Article

Evaluation of Simplified ROI Definition in Facial Thermography for Psychophysiological and Medical Applications


Laboratory of Metrology and Quality, Faculty of Electrical Engineering, University of Ljubljana, Tržaška Cesta 25, 1000 Ljubljana, Slovenia
*
Author to whom correspondence should be addressed.
Appl. Sci. 2026, 16(10), 4631; https://doi.org/10.3390/app16104631
Submission received: 13 April 2026 / Revised: 4 May 2026 / Accepted: 4 May 2026 / Published: 8 May 2026

Abstract

Consistent definition of facial regions of interest (ROIs) is essential for comparable evaluation of temperature dynamics, yet manual ROI annotation remains common. As anatomically faithful annotation is time-consuming and cognitively demanding, this study investigates whether simplified geometric ROIs anchored to facial landmarks can be used without introducing differences in temperature statistics that exceed relevant measurement uncertainty levels. Three novice raters annotated five common facial ROIs across repeated sessions. Temperature metrics (mean, median, and standard deviation) were calculated from all pixels and from the warmest 10% of pixels at three spatial resolutions. Differences between annotation approaches were evaluated with respect to the best achievable and realistic uncertainty levels, 0.3 °C and 1.3 °C, respectively. The simplification reduced annotation time by 42% while maintaining excellent inter- and intra-rater reliability. For most ROIs and metrics, differences remained within the stricter uncertainty level, with larger deviations observed mainly in the anatomically variable periorbital region. Lower spatial resolution increased variability, particularly for small ROIs that fell below the minimum size criterion. These results demonstrate that simplified ROI definitions provide comparable temperature statistics while substantially improving time efficiency, supporting their use in manual and automated facial thermography analysis.

1. Introduction

Advanced thermal imaging cameras and carefully controlled acquisition have enabled deeper exploration of human physiology and psychological processes based on skin temperature [1,2,3,4]. However, once the thermogram is acquired, a crucial part of the research is its analysis, which depends on the selection of regions of interest (ROIs) [1,5,6]. Generally, two approaches to ROI definition can be distinguished [1]: (I) tailoring the ROI shape to a specific pathology or physiological process (e.g., nostrils for breathing rate monitoring), and (II) using general ROI shapes that cover facial areas with pronounced temperature dynamics, typically applied in psychophysiological studies. Both approaches can result in considerable variation in ROI definitions between studies.
Although advances in image processing and deep learning have enabled the development of customised software solutions for automatic ROI definition [7,8], manual ROI labelling by trained raters remains widely used [9,10,11,12,13,14,15,16,17,18,19]. In practice, raters place rectangles, circles, or freehand polygons on seemingly identical skin areas in different thermograms, where shifts in position or size can influence the calculated ROI statistics [1,9,11,20,21,22]. This approach is particularly time-consuming and cognitively demanding, especially for large datasets and multiple ROIs per thermogram. In facial thermal imaging, the effort is even greater, as facial anatomy lacks clear boundaries and differs in shape and proportions between individuals. As a result, repeatability between raters depends on the observed facial part, with excellent agreement for clearly defined landmarks (e.g., tip of the nose) and moderate to good agreement for regions with vague boundaries (e.g., cheeks and periorbital region) [16,17,18]. Several guidelines have attempted to address this challenge by improving measurement and analysis protocols, but face-specific rules for defining and documenting ROIs remain limited [1,5,6]. Clear ROI definitions (position, shape, size) also create a common language, ensuring that terms such as “forehead” or “periorbital” refer to the same measurement position in all studies and are a prerequisite for meaningful synthesis and reliable comparisons between studies. Clear ROI definitions also establish a common language, ensuring that terms such as “forehead” or “periorbital” refer to the same measurement position in all studies. This consistency is necessary for meaningful synthesis and reliable comparisons across studies.
The metrological limitations of the camera, protocol, and environment further constrain ROI analysis. The characteristics of the thermal imager, particularly its resolution and the size-of-source effect (SSE), are among the main factors contributing to measurement uncertainty, as they link accuracy to the number of pixels within the ROI. Low-resolution thermograms increase the footprint of each pixel and amplify the SSE, so very small ROIs may be distorted by surrounding pixels and may not meet the minimum size requirement of at least 3 × 3 pixels for accurate temperature measurement [23]. Studies typically report the mean or median ROI temperature with standard deviation [1,2,9,21], as pixel non-uniformity also introduces position-dependent variability, but its influence is reduced when the ROI statistic summarises many pixels [5,24]. Consequently, small changes in boundary definition may have limited influence on ROI statistical metrics [1,2,9,21]. Facial skin can exhibit local temperature outliers due to inflammation, terminal hair, or breath, so some studies report a more robust measure, namely the mean of the warmest 10% of pixels within the ROI [25,26,27].
As most studies on facial thermography focus on the entire face, the forehead, the inner canthus or periorbital region, and the tip of the nose [1], these regions are analysed in this paper. We propose a set of simple, general-purpose facial ROI definitions based on easily reproducible geometric shapes anchored to facial landmarks. This approach is particularly suitable for psychophysiological studies, where the aim is to analyse general temperature dynamics within broader facial regions rather than highly localised features. Given the measurement uncertainty of the thermal imager and the numerous influencing factors, it is unlikely that highly precise boundary tracking will meaningfully affect the temperature statistics of the ROI. We compare the proposed simplified ROIs with anatomically faithful ROIs using the mean, median, and standard deviation of temperature, calculated both from all (whole) pixels and from the warmest 10% of pixels within the ROI. We evaluate the differences between the two approaches using the best achievable expanded measurement uncertainty of a calibrated thermal imager (±0.3 °C) [5] and the expanded uncertainty of facial thermography in naturalistic settings (±1.3 °C) [1], as differences below these uncertainty levels can be considered metrologically meaningless. Additionally, we evaluate annotation time and inter- and intra-rater reliability for both approaches. We hypothesise that simplified landmark-based ROIs will produce temperature statistics equivalent to complex anatomically defined ROIs, while reducing annotation time and preserving measurement reliability. To our knowledge, this is the first study to predefine equivalence levels based on the measurement uncertainty budget and to formally compare simplified and anatomically compliant ROI definitions across multiple facial regions, spatial resolutions, and raters.

2. Materials and Methods

2.1. ROI Shape Definition

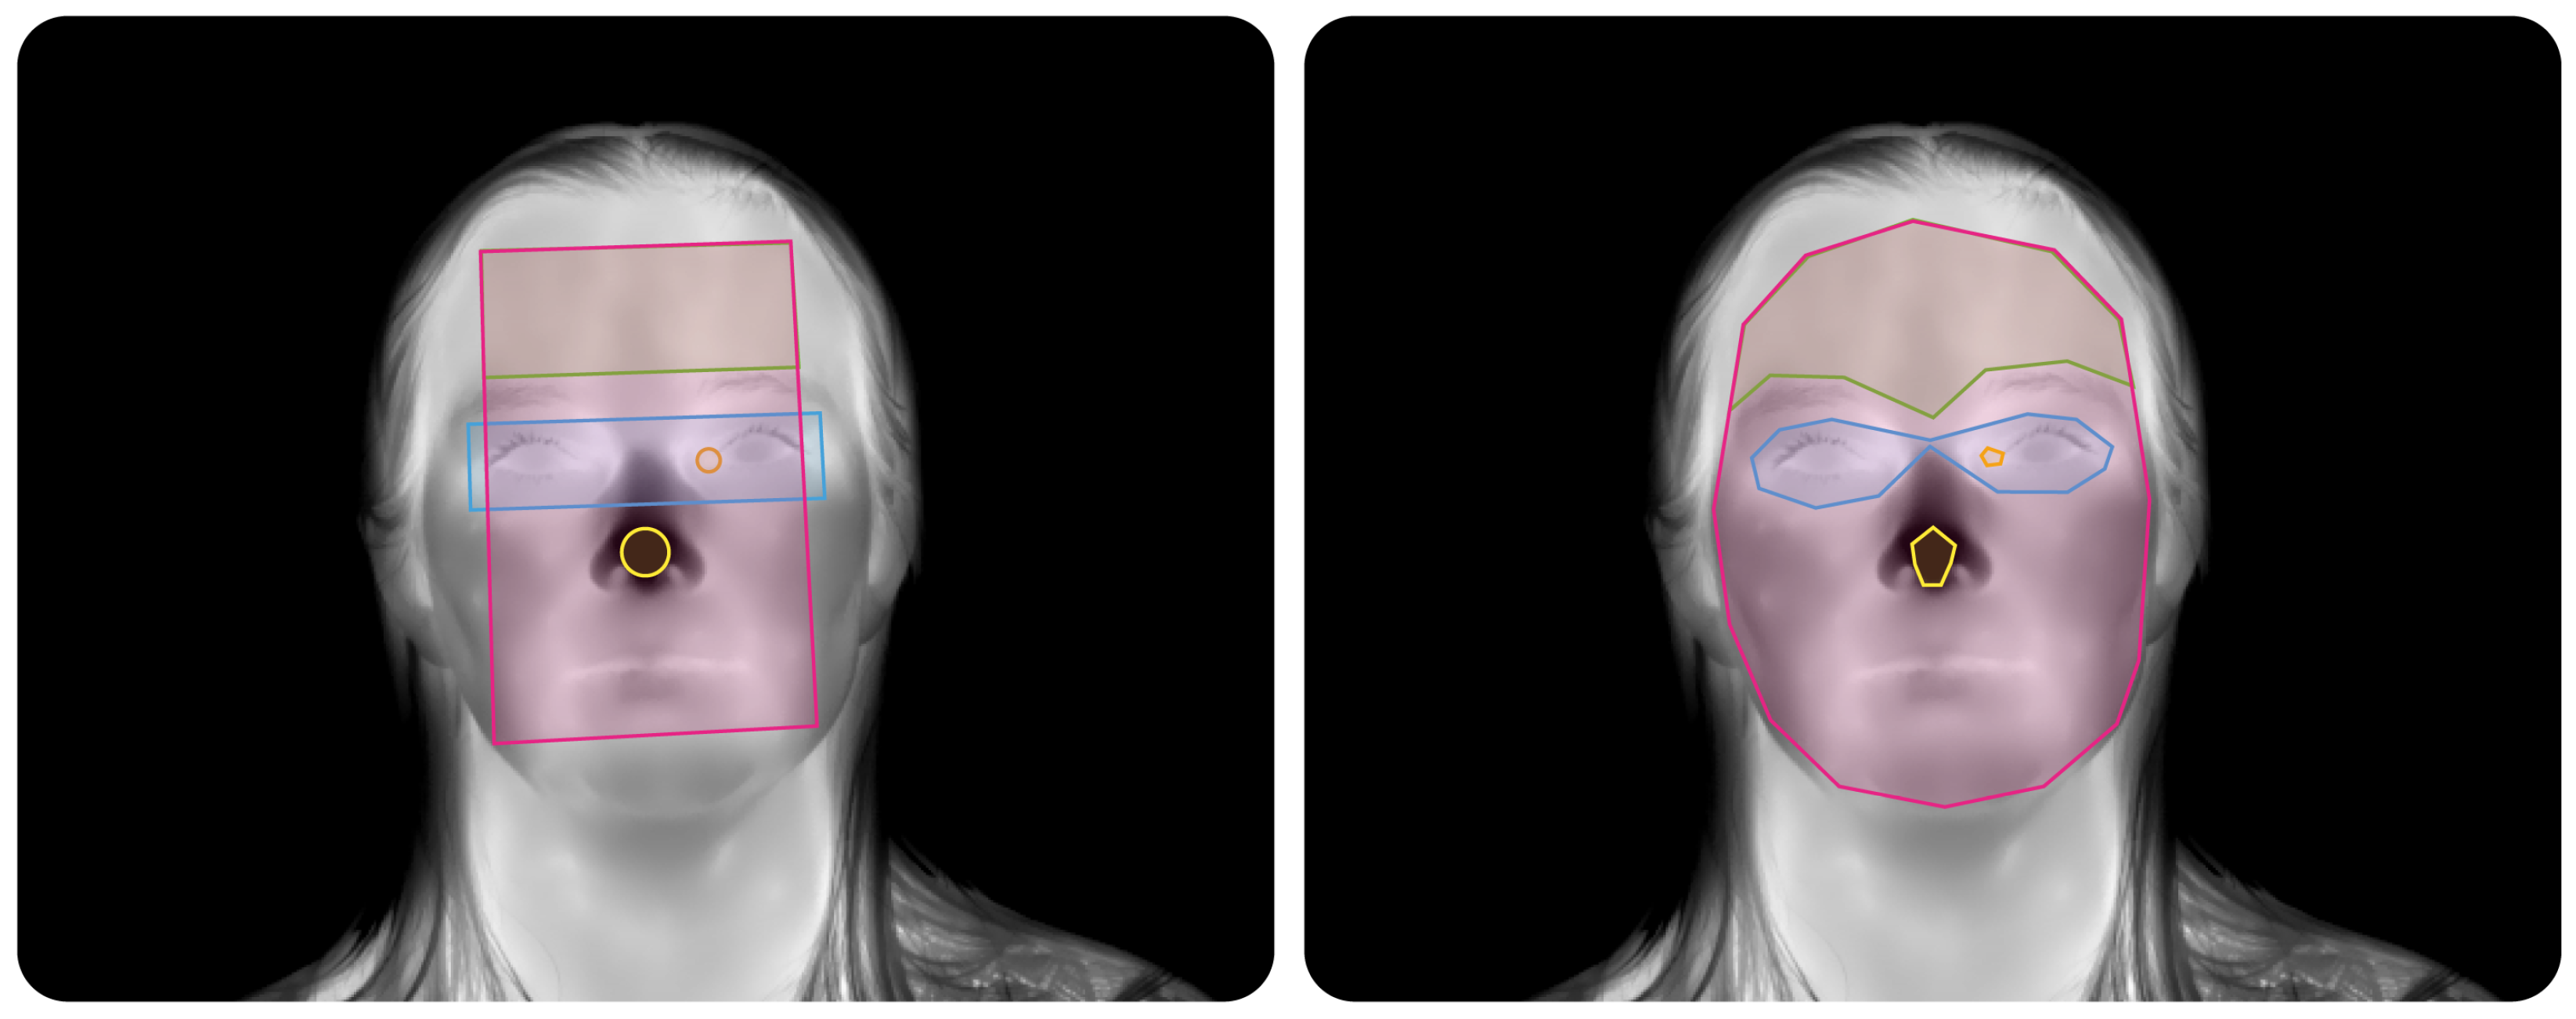
To evaluate the influence of ROI shape on temperature statistics, two definition approaches, differing primarily in anatomical detail and geometric constraint, were implemented and compared (see Figure 1). In the Complex approach, the rater delineates the target anatomy using freehand polygons. The Face ROI has 14 vertices following the inner facial contour; the Forehead ROI has 12 vertices placed below the hairline or scalp edge in bald subjects and above the eyebrows, with a dip to include the glabella; the Periorbital ROI has 14 vertices placed below the eyebrows and along the orbital rim; the Inner canthus ROI has 5 vertices around the medial canthus; and the Nose tip ROI has 7 vertices avoiding the nostrils. In the Simple approach, the rater places geometric shapes anchored to facial landmarks, requiring fewer placement decisions. The Face ROI is a rectangle inscribed within the facial outline; the Forehead ROI is a rectangle bounded at the bottom by the upper eyebrow line and at the top by the visible hairline or scalp edge in bald subjects; the Periorbital ROI is a rectangle spanning both eye sockets; the Inner canthus ROI is a circle centred on the medial canthus; and the Nose tip ROI is a circle centred on the tip, avoiding the nostrils. The shapes are anchored to stable facial landmarks and scaled according to facial proportions to ensure consistency between subjects and sessions. Raters were free to mark the ROIs as needed to capture the intended region, with no size restrictions on annotation.

2.2. Acquisition and Annotation of Thermograms

Facial thermograms of 15 healthy adult subjects (7 females, 8 males; 33 ± 10.7 years) were recorded at 30 fps using a FLIR T1020 LWIR thermal imager (FLIR Systems AB, Täby, Sweden, calibrated in an accredited laboratory), with a spatial resolution of 768 × 1024 px and a thermal sensitivity of <20 mK at 30 °C. The imager was mounted on a tripod at a distance of 1 m and positioned perpendicular to the face of the seated subject. The emissivity coefficient was set to 0.98 [1]. The camera was switched on 10 minutes before the start of measurement to allow it to reach thermal equilibrium. Measurements were conducted in a temperature-controlled room at (20.6 ± 0.54) °C and a relative humidity of (55.8 ± 4.13)%. The background was non-reflective, and no direct sunlight or other sources of radiation was present in the vicinity of the subject. Subjects were asked to avoid vigorous physical activity and the intake of large meals, caffeine, alcohol, and nicotine for four hours prior to measurement. All subjects provided written informed consent before measurement. This study was approved by the University of Ljubljana’s Committee for Ethics in Research Involving Human Subjects (application number: 35-2023).
Thermograms were extracted from the resulting thermal videos in csq format. ROI annotations were created using the Labelme tool (version as of 6 November 2024) [28], which supports labelling polygons and geometric shapes. As Labelme does not support rectangle rotation, rectangles in the Simple approach were drawn as polygons with four vertices forming rectangles. Circles were defined by a centre point and an edge point. If a rater failed to fully define any ROI, the software did not save the annotation and did not display a new thermogram until all five ROIs were defined. The time between opening and saving a thermogram was recorded as the annotation time.
To reflect realistic variability in manual annotation, three inexperienced raters were selected to annotate five ROIs on each thermogram (Face, Forehead, Periorbital, Nose tip, Inner canthus). Each session included 150 thermograms, with 75 present in all sessions to assess repeatability, while the remaining thermograms prevented memorisation. In total, six annotation sessions were conducted, one per week: Complex approach training, two Complex approach sessions, Simple approach training, and two Simple approach sessions. Thermograms from the same subject were not presented consecutively. The order within each session was randomised and identical for all three raters, and thermograms were displayed sequentially. After every set of 30 successfully saved thermograms, raters could take a break or continue with the next set.

2.3. Thermogram Analysis

All thermogram analyses were performed on the subset of 75 thermograms present in all annotation sessions. Each thermogram was annotated by three raters across four evaluation sessions (two per approach), resulting in repeated measurements for subsequent analyses and ensuring consistent pairing across raters, sessions, and approaches. All possible paired differences between the Simple and Complex sessions were included in the analysis to retain the variability introduced by repeated annotations.

2.3.1. Rater Annotation Analysis

Annotation time was summarised using mean M and standard deviation S D across all valid annotations, with each thermogram in each session treated as an independent observation. Cases with missing or corrupted annotation times (>900 s) were excluded. Annotation times were first averaged across sessions within each approach, and these values were then paired between approaches. A paired two-sided t-test was used to assess statistical significance, with  p 0.05 indicating a significant difference. All analyses were performed in RStudio 2025.05.0.
Repeatability of ROI temperature measurements was assessed by computing the intraclass correlation coefficient (ICC) using the irr package in RStudio 2025.05.0, based on M at the original resolution (768 × 1024 px), for both all ROI pixels ( p 100 ) and the warmest 10% of ROI pixels ( p 10 ). Inter-rater reliability was assessed with ICC estimates and their 95% confidence intervals (CIs) based on a mean-rating ( k = 3 ), absolute-agreement, two-way random-effects model. Intra-rater reliability was assessed using ICC estimates and their 95% CI based on a single-measurement, absolute-agreement, two-way mixed-effects model. ICC values of <0.5 indicate poor reliability, 0.5 0.75 moderate reliability, 0.75 0.9 good reliability, and >0.90 indicate excellent reliability [29].

2.3.2. Resolution and Temperature Analysis

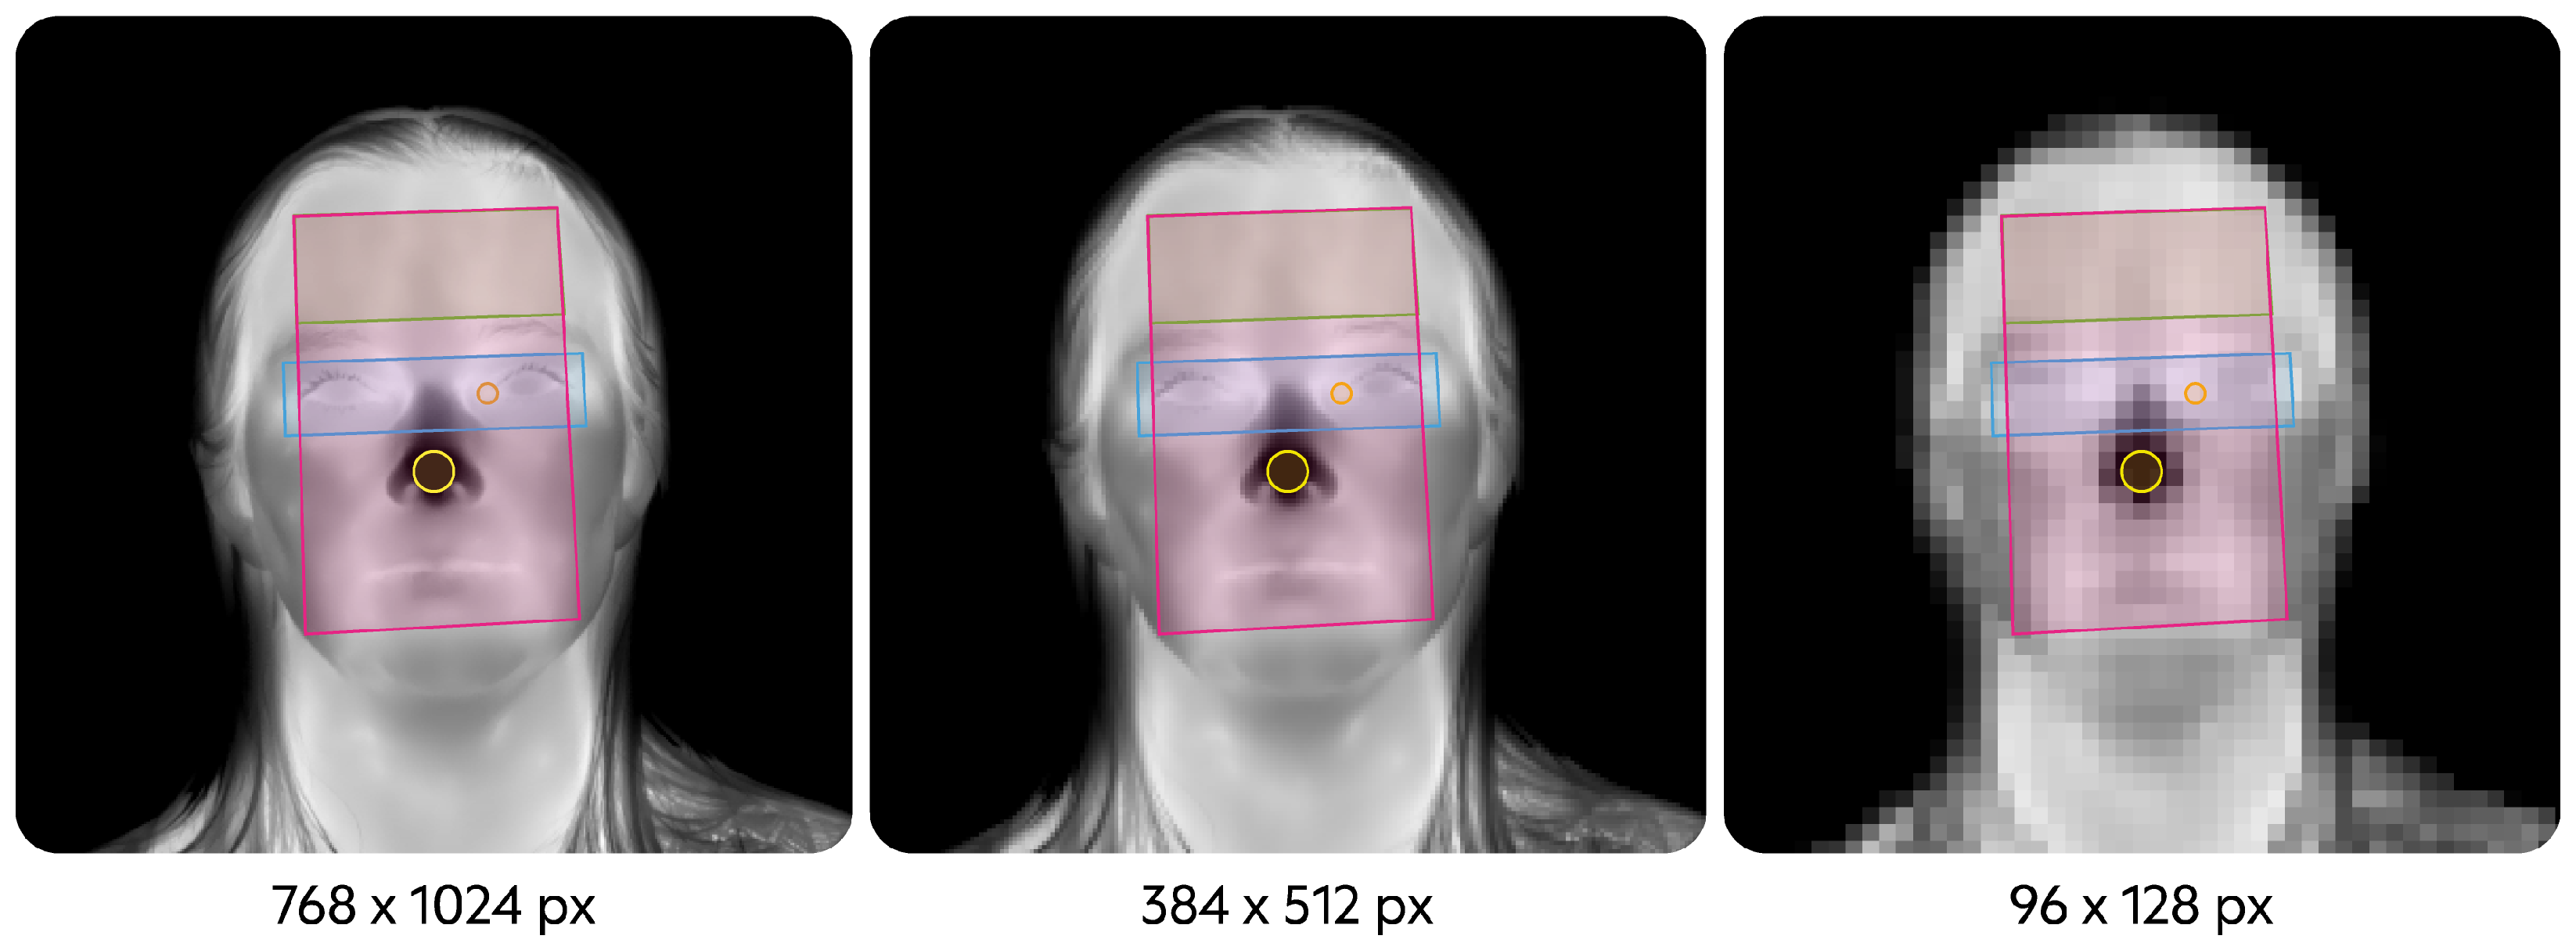
As thermal imagers with varying spatial resolutions are commonly used, and spatial resolution is one of the main sources of uncertainty, its influence on ROI temperature statistics was evaluated by analysing thermograms at the original resolution (768 × 1024 px) and at two lower resolutions (384 × 512 px and 96 × 128 px). Lower resolutions were obtained by downsampling the original thermograms using exact block averaging, where each pixel in the downsampled image represents the mean temperature of a corresponding non-overlapping block in the original image (2 × 2 px and 8 × 8 px blocks, respectively). This approach preserves the physical interpretation of temperature values while simulating larger effective pixel sizes (Figure 2). ROI masks were downsampled using the same block structure. A pixel in the downsampled image was included in the ROI only if all pixels within the corresponding block in the original resolution were part of the ROI. This ensured that ROI boundaries were not artificially expanded during downsampling and that all analysed pixels corresponded strictly to the originally defined regions.
For each ROI, temperature statistics were computed using only pixels fully contained within its boundaries. The mean M, median M e , and standard deviation S D were calculated for all pixels within the ROI ( p 100 ), as well as for the warmest 10% of ROI pixels ( p 10 ). ROI size n was defined as the number of included pixels, and ROIs with n < 9 pixels were excluded from further analysis. Downsampling and temperature metric computation were performed using Python 3.11.9 (Visual Studio Code). Differences between the Simple and Complex approaches for each ROI and temperature metric were evaluated using Bland–Altman analysis, including bias d ¯ (mean difference) and limits of agreement (LoA), computed in Matlab R2025b. The magnitude of these differences was interpreted with respect to two reference uncertainty bands, namely the best achievable uncertainty u B = 0.3 °C and a realistic uncertainty for facial thermography u R = 1.3 °C.
Formal equivalence between the Simple and Complex approaches was assessed using the two one-sided tests (TOST), performed in Matlab R2025b. For each ROI, metric, and resolution, paired differences (Simple–Complex) were tested against two predefined equivalence margins, ±0.3 °C and ±1.3 °C, corresponding to the best achievable and realistic uncertainty levels, respectively. Equivalence was concluded when the 90% CI of the mean paired difference lay entirely within the selected equivalence margin.

3. Results

3.1. Rater Annotation Analysis

Raters spent significantly less time annotating Simple ROIs ( M = 61.6 s, S D = 44.23 s) than Complex ROIs ( M = 107.3 s, S D = 61.06 s), with a mean difference of 46.7 s ( S D = 60.0 s; t ( 224 ) = 11.68 , p < 0.001 ).
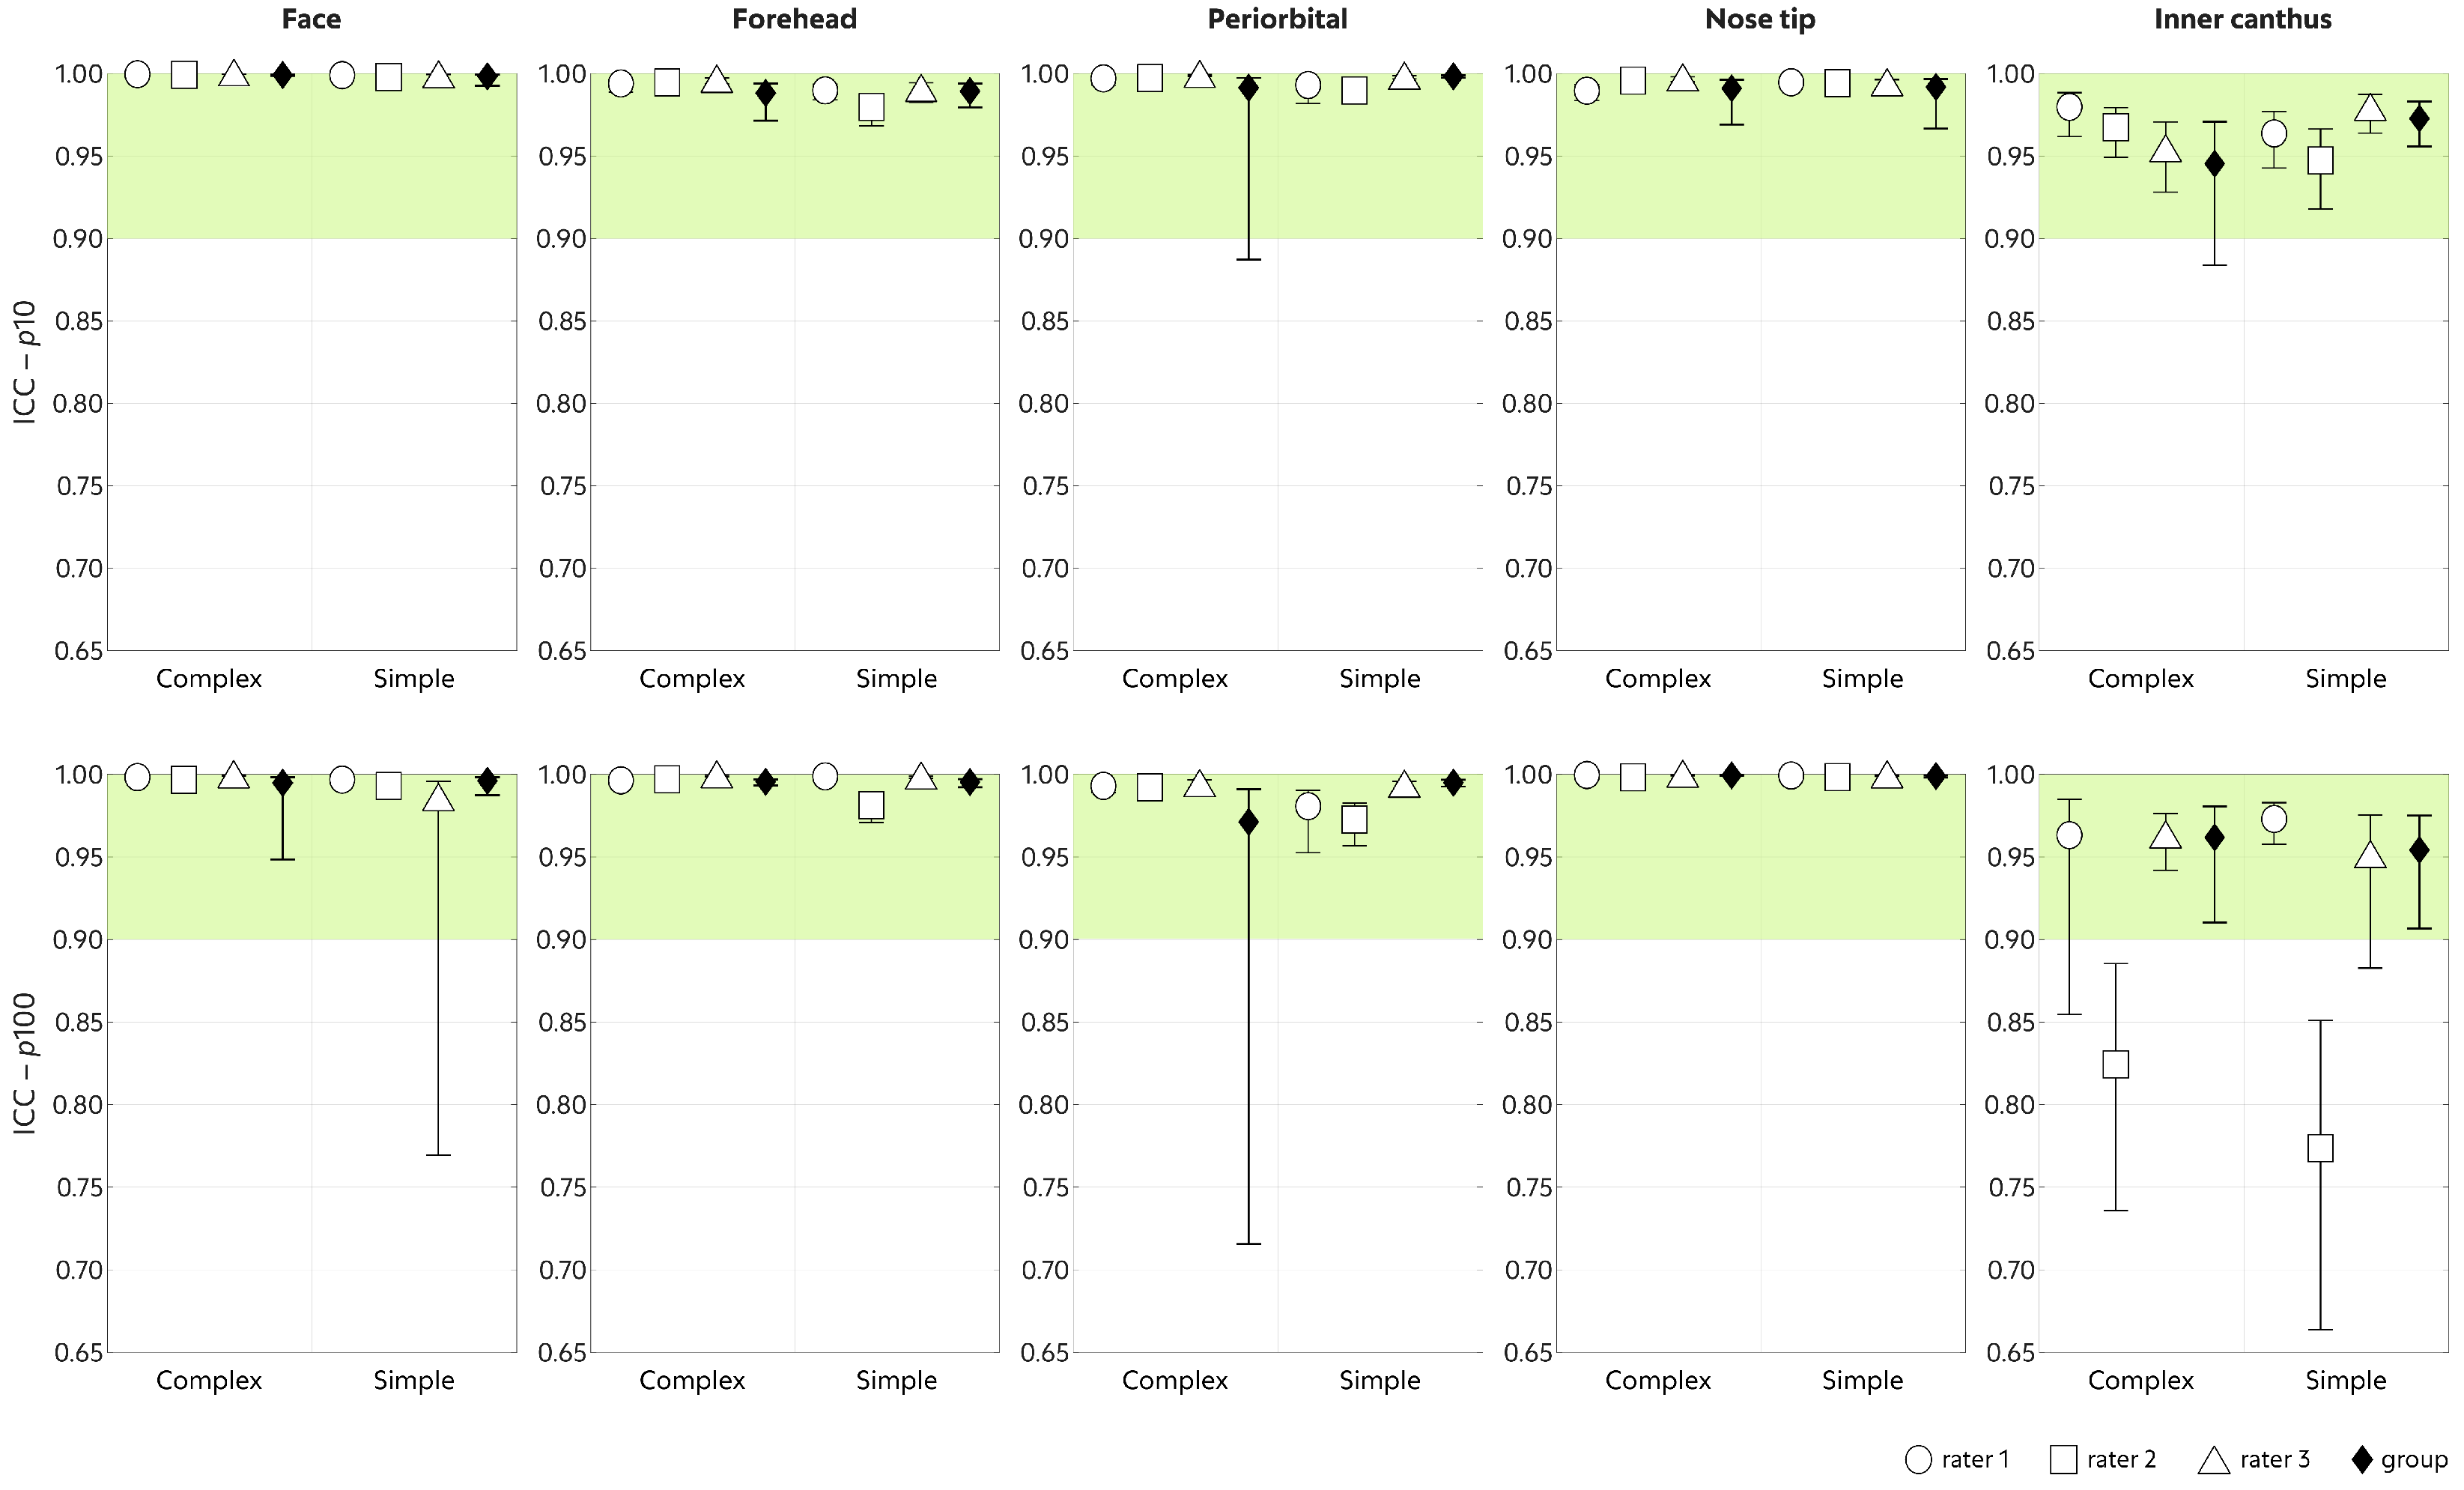
The inter- and intra-rater reliability was high across all ROIs (Figure 3). The only ICC estimates in the good (rather than excellent) range were observed for the Inner canthus ROI for rater 2 at p 100 in both approaches (Simple: ICC ( 3 , 1 ) = 0.774 , Complex: ICC ( 3 , 1 ) = 0.824 ). Overall, both approaches demonstrated high consistency across raters and sessions.

3.2. Resolution and Temperature Analysis

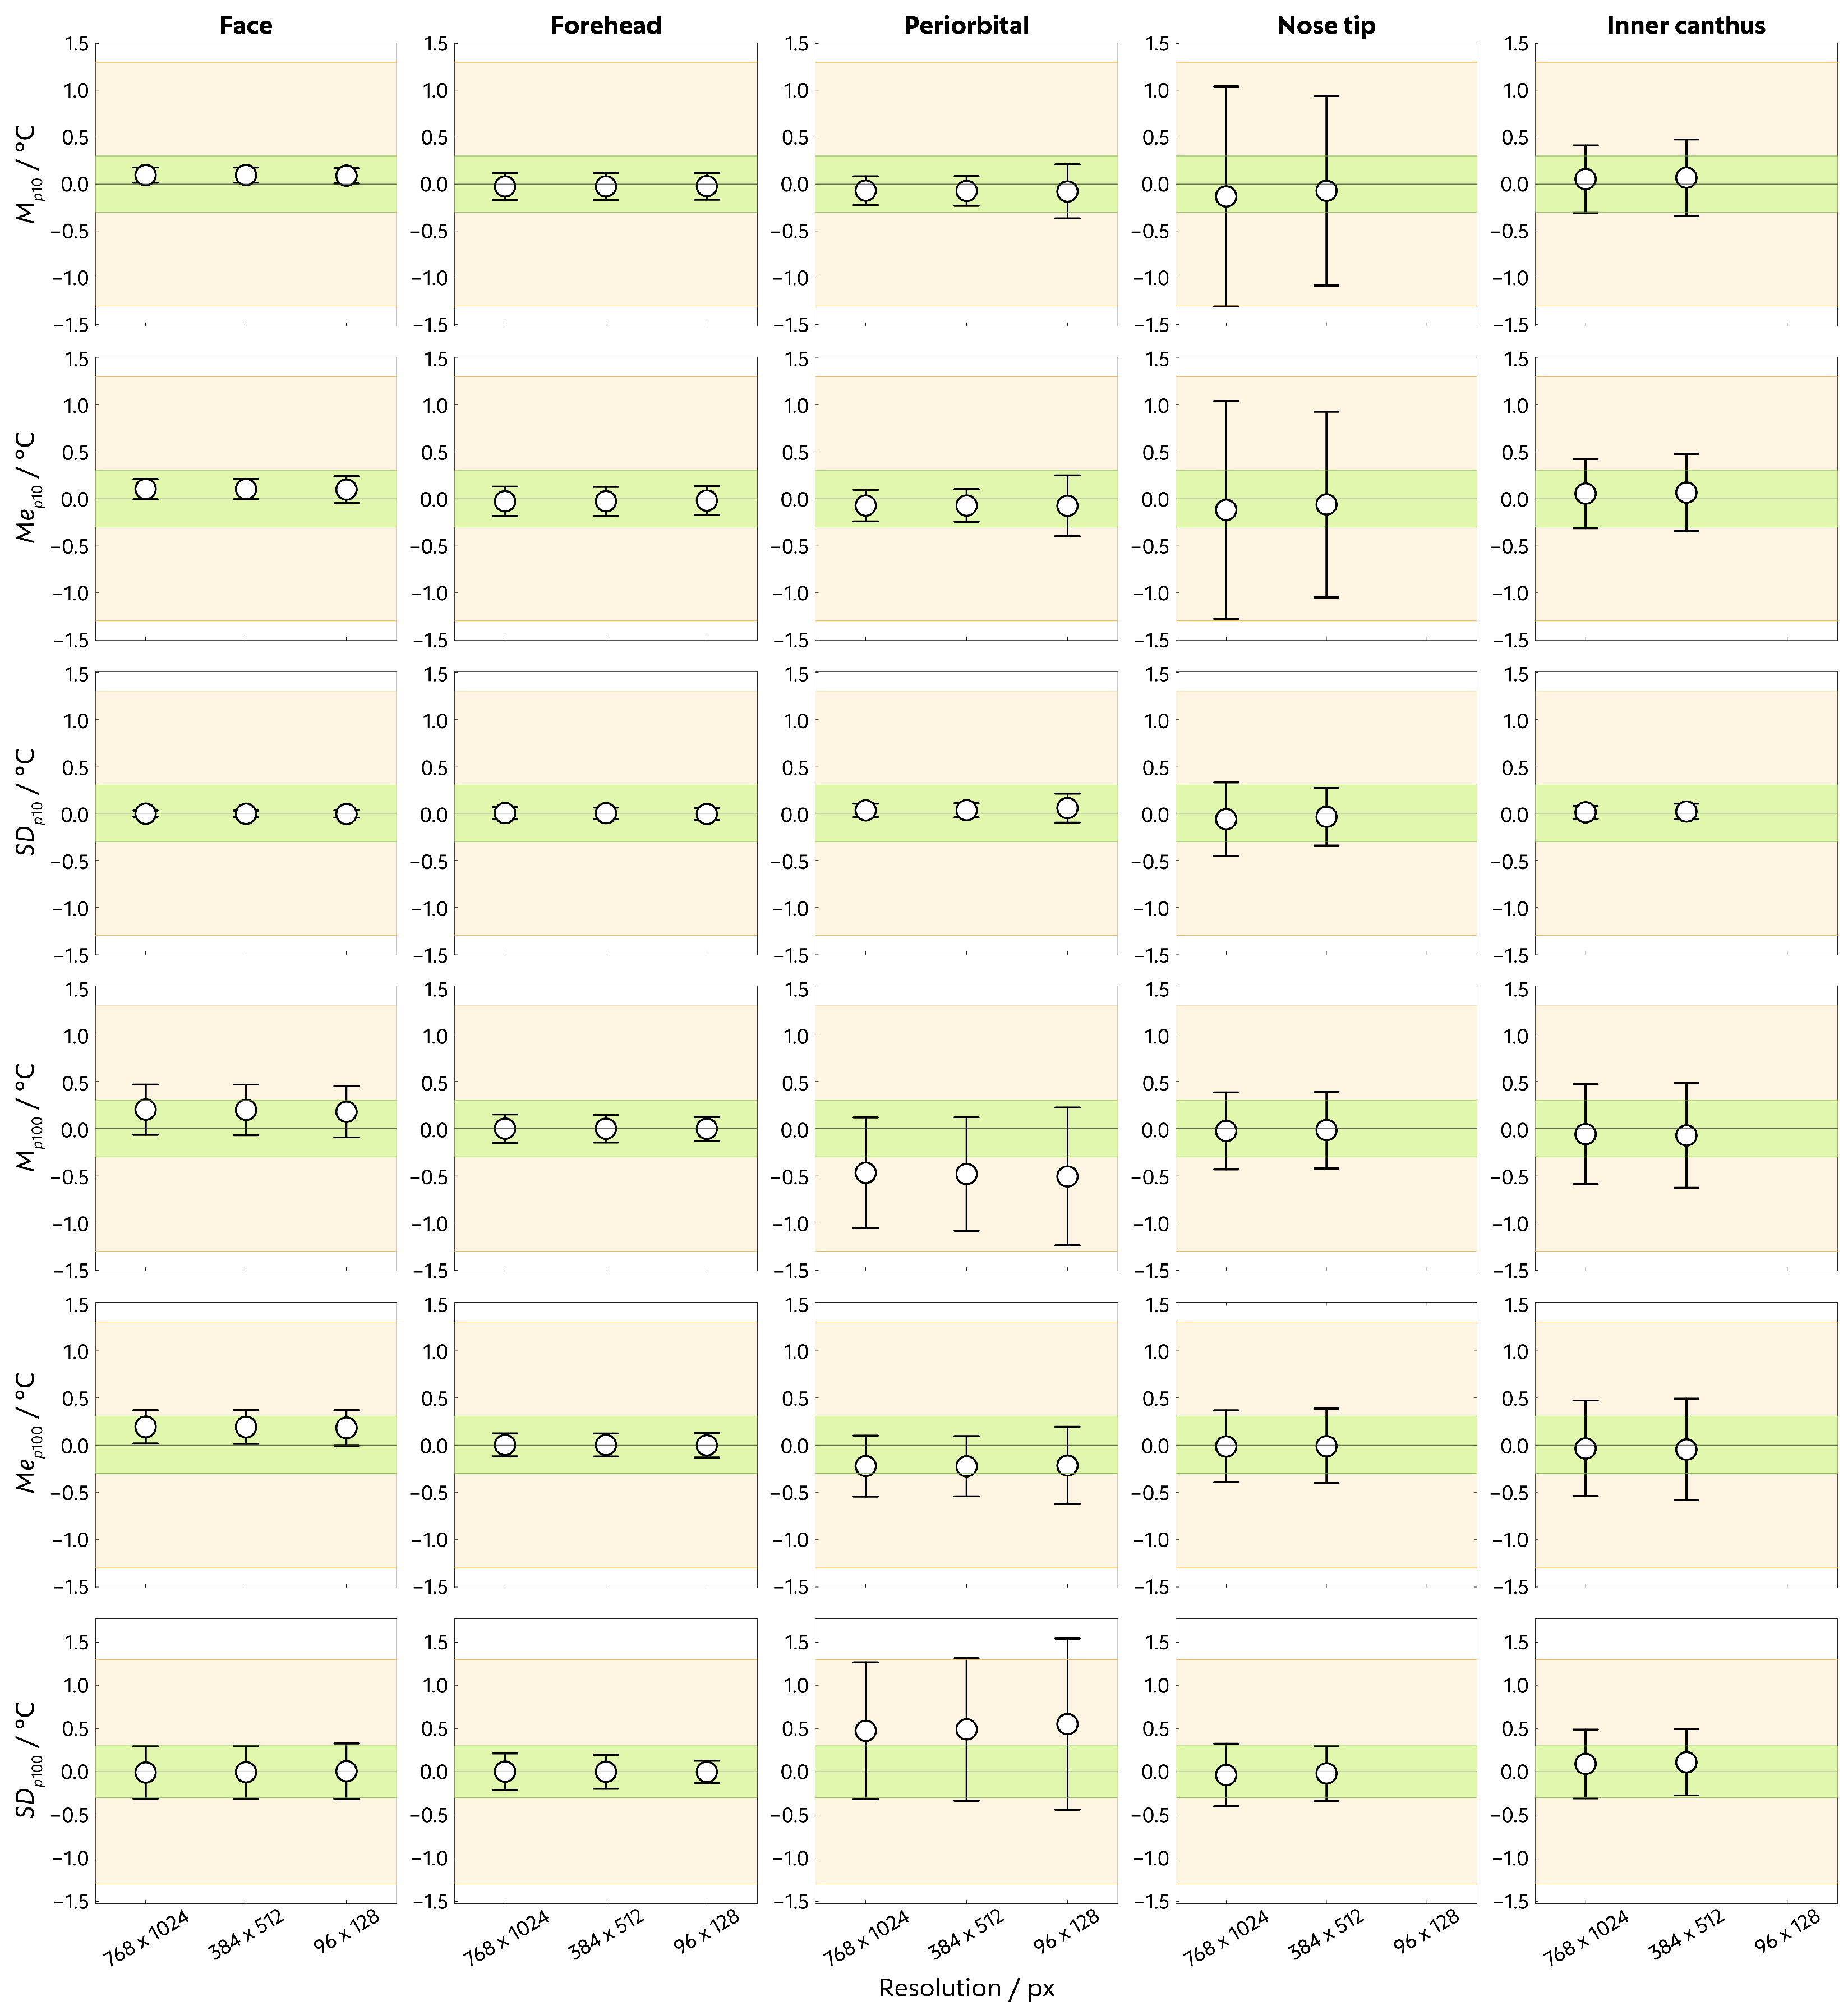
An overview of the differences between the Simple and Complex approaches across ROIs, metrics, and resolutions is presented using Bland–Altman plots in Figure 4. For the Forehead ROI, across all metrics and resolutions, bias was d ¯ = 0.0 °C, and LoA were entirely below u B . Similarly, for the Face ROI, all d ¯ values remained below u B but were consistently positive, indicating systematically higher temperatures for the Simple approach. The upper LoA of M p 100 and M e p 100 exceeded u B , reaching 0.5 °C and 0.4 °C, respectively, which is still well below u R . In contrast, for p 10 metrics, both d ¯ and LoAs were largely below u B , indicating improved agreement when only the warmest pixels were considered.
For the Periorbital ROI, the largest differences between approaches were observed. For M p 100 and S D p 100 , d ¯ exceeded u B ( d ¯ M , p 100 = 0.5 °C for all three resolutions; d ¯ S D , p 100 = 0.6 °C for the lowest resolution). S D p 100 also showed the widest LoA, with the lowest resolution reaching up to 1.5 °C, exceeding u R . In contrast, p 10 metrics exhibited smaller differences, with LoA largely below u B at higher resolutions, although some widening was observed at the lowest resolution.
For the smallest ROIs (Inner canthus and Nose), bias was well below u B ( | d ¯ |   0.1 °C). However, the LoA often exceeded u B , particularly for p 100 metrics of the Inner canthus ROI and p 10 metrics of the Nose ROI, while remaining below u R . At the lowest resolution (96 × 128 px), the Inner canthus and Nose ROIs did not meet the minimum size criterion ( n 9 ) and were therefore excluded from the analysis.
TOST results further supported these findings. At the stricter equivalence margin of ±0.3 °C, equivalence between the Simple and Complex approaches was not confirmed only for M p 100 and S D p 100 of the Periorbital ROI at any resolution (Table 1). At the wider equivalence margin of ±1.3 °C, equivalence was confirmed for all combinations. For the Inner canthus and Nose ROIs at 96 × 128 px, equivalence could not be tested because these ROIs did not meet the minimum size criterion ( n 9 ).

4. Discussion

The aim of this study was to investigate whether the definition of facial ROIs can be simplified without introducing differences in temperature statistics that exceed practically relevant uncertainty levels. To this end, we designed two ROI annotation approaches, namely the Complex approach, based on anatomically detailed polygons, and the Simple approach, which uses geometric shapes anchored to facial landmarks. The resulting differences were evaluated with respect to two reference uncertainty bands, representing the best achievable ( u B = 0.3 °C) and a realistic ( u R = 1.3 °C) measurement uncertainty in facial thermography.
The Simple approach was significantly more time-efficient, with novice raters requiring approximately 42% less time to annotate a thermogram. Both approaches demonstrated excellent inter- and intra-rater reliability across most ROIs and metrics, indicating that simplifying ROI geometry does not reduce annotation reliability. This suggests that the simplified approach reduces sensitivity to rater experience and may require less extensive training to achieve consistent results, which is particularly relevant given the lack of standardised ROI definitions in facial thermography.
The agreement between approaches depended on the ROI and the selected temperature metric. Overall, bias remained below u B , except for M and S D of the Periorbital ROI. For p 100 metrics, both mean and standard deviation bias exceeded u B , with LoA extending beyond this level and, for S D p 100 at the lowest resolution, exceeding u R . These differences are likely related to the anatomical variability of the periorbital region and the geometry of the simplified ROIs, which may include cooler surrounding areas. This behaviour reflects the intrinsic anatomical and thermal variability of the periorbital region, including variations in tissue properties and surface topography, rather than a limitation specific to the simplified ROI definition. To preserve the simplicity and reproducibility of annotation, the simplified ROI geometry was intentionally not further optimised, as increased anatomical detail does not provide additional meaningful information given the measurement uncertainty of the thermal imager. In contrast, p 10 metrics showed substantially smaller differences, with LoAs largely below u B at higher resolutions, indicating that the warmest pixels within the periorbital region are concentrated around the inner canthus and that restricting the analysis to these pixels reduces sensitivity to ROI definition. This indicates that p 10 metrics provide a physically meaningful representation that isolates the most stable and physiologically relevant thermal signal. For the largest ROIs (Face and Forehead), metric differences were comparable across resolutions. In the Periorbital ROI, the LoA increased as resolution decreased, while the Inner canthus and Nose ROIs at the lowest resolution no longer met the minimum size criterion required for reliable temperature measurement ( n 9 ) and were therefore excluded from the analysis. This highlights the inherent limitation of small ROIs in low-resolution thermograms, where insufficient pixel representation prevents reliable analysis of small facial regions and increases sensitivity to measurement variability and to temperature contributions from surrounding regions (SSE), regardless of the approach used to define the ROI.
These findings are consistent with the TOST results, which confirmed statistical equivalence between the Simple and Complex approaches for most ROI, metric, and resolution combinations at the stricter uncertainty level u B . The main exceptions were M p 100 and S D p 100 of the Periorbital ROI, reflecting the wider LoA observed for these metrics. At u R , equivalence was confirmed for all valid comparisons.
High agreement between the two approaches suggests that the measurement uncertainty of modern thermal imaging cameras outweighs the minor differences introduced by simplified ROIs. From a practical perspective, this indicates that precise delineation of ROI boundaries is unnecessary for obtaining reliable temperature statistics in facial thermography.
The Nose ROI exhibited the greatest variation in p 10 metrics, likely because the nose tip is not sharply defined and annotations can easily include warmer regions above the tip. In contrast, p 10 temperature metrics were more robust to variations in ROI definition for the Face, Periorbital, and Inner canthus ROIs, as the warmest pixels in these regions are probably concentrated around the inner canthus, which is usually the warmest part of the face [1,30]. This suggests that, rather than increasing the geometric complexity of the ROI definition, robust temperature estimation in anatomically variable regions can be achieved by selecting appropriate statistical measures that focus on physiologically relevant pixels. This presents a possible direction for future work, namely mitigating the challenges of defining the Inner canthus ROI at low resolutions by deriving it from a larger Periorbital or Face ROI using a temperature-based approach. Such strategy could improve the robustness of this challenging ROI definition.
As this study was limited to manual ROI annotation, validation of the simplified ROI definitions in automated or semi-automated pipelines remains an open question and would enable analysis of larger thermogram datasets with more subjects. Additionally, this study was conducted on a relatively homogeneous sample of healthy adult subjects. To improve generalisability, it would be valuable to investigate these simplification strategies in studies of localised pathologies or treatment effects, where finer spatial specificity may be required. However, despite current limitations in sample characteristics and infrared technology, it is feasible to simplify manual, semi-automated, and automated ROI annotation to accelerate research and alleviate the cognitive burden on researchers. These results also provide a foundation for future AI-assisted and machine learning applications, where simplified yet robust ROI definitions could streamline model training and expand the practical use of facial thermography in research and clinical settings.

5. Conclusions

The results demonstrate that simple, geometry-based ROI definitions in facial thermography yield temperature statistics comparable to anatomically faithful definitions, while significantly reducing annotation time. This has practical implications for both manual and automated annotation workflows. Thermogram processing algorithms do not need to reproduce exact polygonal outlines to obtain reliable temperature summaries. Instead, they can use stable, high-contrast landmarks such as the edge of the face, the eyebrow line, or the nostrils, and define simple, sufficiently large ROIs to ensure an adequate pixel count for reliable temperature estimation across spatial resolutions. This reduces algorithm complexity and improves the feasibility of automated analysis without compromising measurement accuracy.

Author Contributions

Conceptualization, V.S. and G.G.; methodology, V.S.; software, V.S.; validation, V.S. and G.G.; formal analysis, V.S.; investigation, V.S.; resources, V.S. and G.G.; data curation, V.S.; writing—original draft preparation, V.S.; writing—review and editing, V.S. and G.G.; visualization, V.S.; supervision, G.G.; project administration, G.G. and V.S.; funding acquisition, G.G. All authors have read and agreed to the published version of the manuscript.

Funding

This research was funded by the Slovenian Research and Innovation Agency, research core funding No. P2-0225.

Institutional Review Board Statement

This study was conducted in accordance with the Declaration of Helsinki, and approved by the University of Ljubljana’s Committee for Ethics in Research Involving Human Subjects (application number: 35-2023, date of approval: 22 May 2024).

Informed Consent Statement

Informed consent was obtained from all subjects involved in this study.

Data Availability Statement

The data presented in this study are available upon request from the corresponding author.

Acknowledgments

The AI tool ChatGPT-5 was used for language improvement.

Conflicts of Interest

The authors declare no conflicts of interest.

Abbreviations

The following abbreviations are used in this manuscript:
CIConfidence Interval
ICCIntraclass Correlation Coefficient
LoALimits of Agreement
LWIRLong-Wave Infrared
ROIRegion of Interest
SSESize-of-Source Effect
TOSTTwo One-Sided Tests

References

  1. Stanić, V.; Geršak, G. Facial thermal imaging: A systematic review with guidelines and measurement uncertainty estimation. Measurement 2025, 242, 115879. [Google Scholar] [CrossRef] [Scilit]
  2. Ammer, K.; Ring, F. The Thermal Human Body: A Practical Guide to Thermal Imaging; Jenny Stanford Publishing: Singapore, 2019. [Google Scholar] [CrossRef] [Scilit]
  3. Ioannou, S.; Gallese, V.; Merla, A. Thermal infrared imaging in psychophysiology: Potentialities and limits. Psychophysiology 2014, 51, 951–963. [Google Scholar] [CrossRef] [Scilit] [PubMed]
  4. Filippini, C.; Cardone, D.; Perpetuini, D.; Chiarelli, A.; Petitto, L.; Merla, A. Assessment of autonomic response in 6–12-month-old babies during the interaction with robot and avatar by means of thermal infrared imaging. Quant. InfraRed Thermogr. J. 2022, 20, 78–91. [Google Scholar] [CrossRef] [Scilit]
  5. Pušnik, I.; Saunders, P.; Girard, F.; Knazovicka, L.; Simpson, R.; Machin, G.; Cardenas Garcia, D.; Quanzeng, W.; Kuelhas, K.; Sadli, M.; et al. Best Practice Guide: Use of Thermal Imagers to Perform Traceable Non-contact Screening of Human Body Temperature. 2021. Available online: https://www.bipm.org/en/committees/cc/cct/guides-to-thermometry (accessed on 22 February 2022).
  6. Moreira, D.G.; Costello, J.T.; Brito, C.J.; Adamczyk, J.G.; Ammer, K.; Bach, A.J.; Costa, C.M.; Eglin, C.; Fernandes, A.A.; Fernández-Cuevas, I.; et al. Thermographic imaging in sports and exercise medicine: A Delphi study and consensus statement on the measurement of human skin temperature. J. Therm. Biol. 2017, 69, 155–162. [Google Scholar] [CrossRef] [Scilit]
  7. Singh, J.; Arora, A.S. Automated approaches for ROIs extraction in medical thermography: A review and future directions. Multimed. Tools Appl. 2020, 79, 15273–15296. [Google Scholar] [CrossRef] [Scilit]
  8. Masaki, A.; Nagumo, K.; Oiwa, K.; Nozawa, A. Feature analysis for drowsiness detection based on facial skin temperature using variational autoencoder: A preliminary study. Quant. InfraRed Thermogr. J. 2022, 20, 304–318. [Google Scholar] [CrossRef] [Scilit]
  9. Ludwig, N.; Formenti, D.; Gargano, M.; Alberti, G. Skin temperature evaluation by infrared thermography: Comparison of image analysis methods. Infrared Phys. Technol. 2014, 62, 1–6. [Google Scholar] [CrossRef] [Scilit]
  10. Stanić, V.; Žnidarič, T.; Repovš, G.; Geršak, G. Dynamic Seat Assessment for Enabled Restlessness of Children with Learning Difficulties. Sensors 2022, 22, 3170. [Google Scholar] [CrossRef] [Scilit] [PubMed]
  11. Salazar-López, E.; Domínguez, E.; Ramos, V.J.; De la Fuente, J.; Meins, A.; Iborra, O.; Gálvez, G.; Rodríguez-Artacho, M.; Gómez-Milán, E. The mental and subjective skin: Emotion, empathy, feelings and thermography. Conscious. Cogn. 2015, 34, 149–162. [Google Scholar] [CrossRef] [Scilit]
  12. Ferreira, C.L.P.; Castelo, P.M.; Zanato, L.E.; Poyares, D.; Tufik, S.; Bommarito, S. Relation between oro-facial thermographic findings and myofunctional characteristics in patients with obstructive sleep apnoea. J. Oral Rehabil. 2021, 48, 720–729. [Google Scholar] [CrossRef] [Scilit]
  13. Molina-Payá, J.; Ríos-Díaz, J.; Martínez-Payá, J. Inter and intraexaminer reliability of a new method of infrared thermography analysis of patellar tendon. Quant. InfraRed Thermogr. J. 2021, 18, 127–139. [Google Scholar] [CrossRef] [Scilit]
  14. Mauriz, E.; Caloca-Amber, S.; Vázquez-Casares, A.M. Effect of facial skin temperature on the perception of anxiety: A pilot study. Healthcare 2020, 8, 206. [Google Scholar] [CrossRef] [Scilit] [PubMed]
  15. Tian, X.; Fang, L.; Liu, W. The influencing factors and an error correction method of the use of infrared thermography in human facial skin temperature. Build. Environ. 2023, 244, 110736. [Google Scholar] [CrossRef] [Scilit]
  16. Ioannou, S.; Morris, P.; Mercer, H.; Baker, M.; Gallese, V.; Reddy, V. Proximity and gaze influences facial temperature: A thermal infrared imaging study. Front. Psychol. 2014, 5, 845. [Google Scholar] [CrossRef] [Scilit]
  17. Costa, A.C.; Dibai Filho, A.V.; Packer, A.C.; Rodrigues-Bigaton, D. Intra and inter-rater reliability of infrared image analysis of masticatory and upper trapezius muscles in women with and without temporomandibular disorder. Braz. J. Phys. Ther. 2013, 17, 24–31. [Google Scholar] [CrossRef] [Scilit]
  18. Diaz-Piedra, C.; Gomez-Milan, E.; Di Stasi, L.L. Nasal skin temperature reveals changes in arousal levels due to time on task: An experimental thermal infrared imaging study. Appl. Ergon. 2019, 81, 102870. [Google Scholar] [CrossRef] [Scilit] [PubMed]
  19. Hillen, B.; Pfirrmann, D.; Nägele, M.; Simon, P. Infrared thermography in exercise physiology: The dawning of exercise radiomics. Sport. Med. 2020, 50, 263–282. [Google Scholar] [CrossRef] [Scilit] [PubMed]
  20. Fernández-Cuevas, I.; Marins, J.C.B.; Lastras, J.A.; Carmona, P.M.G.; Cano, S.P.; García-Concepción, M.Á.; Sillero-Quintana, M. Classification of factors influencing the use of infrared thermography in humans: A review. Infrared Phys. Technol. 2015, 71, 28–55. [Google Scholar] [CrossRef] [Scilit]
  21. Perpetuini, D.; Formenti, D.; Cardone, D.; Filippini, C.; Merla, A. Regions of interest selection and thermal imaging data analysis in sports and exercise science: A narrative review. Physiol. Meas. 2021, 42, 08TR01. [Google Scholar] [CrossRef] [Scilit]
  22. da Silva, W.; Machado, Á.S.; Kunzler, M.R.; Jimenez-Perez, I.; Gil-Calvo, M.; Priego-Quesada, J.I.; Carpes, F.P. Reproducibility of skin temperature analyses by novice and experienced evaluators using infrared thermography. J. Therm. Biol. 2022, 110, 103345. [Google Scholar] [CrossRef] [Scilit]
  23. Pušnik, I.; Geršak, G. Evaluation of the size-of-source effect in thermal imaging cameras. Sensors 2021, 21, 607. [Google Scholar] [CrossRef] [Scilit] [PubMed]
  24. JCGM 100:2008; Evaluation of Measurement Data—Guide to the Expression of Uncertainty in Measurement. Joint Committee for Guides in Metrology: Sèvres, France, 2008. [CrossRef] [Scilit]
  25. Robinson, D.T.; Clay-Warner, J.; Moore, C.D.; Everett, T.; Watts, A.; Tucker, T.N.; Thai, C. Toward an unobtrusive measure of emotion during interaction: Thermal imaging techniques. In Biosociology and Neurosociology; Emerald Group Publishing Limited: Leeds, UK, 2012; Volume 29, pp. 225–266. [Google Scholar] [CrossRef] [Scilit]
  26. Abouelenien, M.; Pérez-Rosas, V.; Mihalcea, R.; Burzo, M. Detecting deceptive behavior via integration of discriminative features from multiple modalities. IEEE Trans. Inf. Forensics Secur. 2016, 12, 1042–1055. [Google Scholar] [CrossRef] [Scilit]
  27. Baltaci, S.; Gokcay, D. Stress detection in human–computer interaction: Fusion of pupil dilation and facial temperature features. Int. J. Hum.-Interact. 2016, 32, 956–966. [Google Scholar] [CrossRef] [Scilit]
  28. Wada, K. Labelme: Image Polygonal Annotation with Python. GPL-3 License. 2021. Available online: https://github.com/wkentaro/labelme (accessed on 6 November 2024).
  29. Koo, T.K.; Li, M.Y. A guideline of selecting and reporting intraclass correlation coefficients for reliability research. J. Chiropr. Med. 2016, 15, 155–163. [Google Scholar] [CrossRef] [Scilit] [PubMed]
  30. Mercer, J.B.; Ring, E.F.J. Fever screening and infrared thermal imaging: Concerns and guidelines. Thermol. Int. 2009, 19, 67–69. [Google Scholar]
Figure 1. A thermogram with Face (pink), Forehead (green), Periorbital (blue), Inner canthus (orange), and Nose tip (yellow) ROIs labelled using two approaches. (Left): Simple approach with geometric ROIs anchored to facial landmarks. (Right): Complex approach with anatomically detailed freehand ROI polygons.
Applsci 16 04631 g001
Figure 2. Example thermogram with annotated ROIs (Face, Forehead, Periorbital, Nose tip, Inner canthus) shown at three spatial resolutions (768 × 1024 px, 384 × 512 px, and 96 × 128 px). As thermogram resolution decreases, each pixel represents a larger area, resulting in a coarser spatial representation and fewer pixels within each ROI.
Applsci 16 04631 g002
Figure 3. Inter- and intra-rater ICC results across ROIs and approaches for p 10 and p 100 . Markers represent ICC estimates, with whiskers indicating 95% CI. The green band denotes the excellent reliability range.
Applsci 16 04631 g003
Figure 4. Bland–Altman summary of differences between the Simple and Complex approaches across ROIs, metrics, and resolutions. Markers indicate d ¯ , with whiskers representing LoA. Positive d ¯ indicates higher ROI metric values for the Simple approach. The green shaded band denotes u B and the orange band u R .
Applsci 16 04631 g004
Table 1. TOST equivalence results for the difference Simple–Complex at the stricter equivalence margin of ±0.3 °C. Equivalence was concluded when the 90% CI of the mean paired difference fell entirely within the predefined margin. NT indicates that equivalence could not be tested because the ROI did not satisfy the minimum size criterion ( n 9 ).
ROIResolution/px M p 100 Me p 100 SD p 100 M p 10 Me p 10 SD p 10
Forehead768 × 1024YESYESYESYESYESYES
384 × 512YESYESYESYESYESYES
96 × 128YESYESYESYESYESYES
Face768 × 1024YESYESYESYESYESYES
384 × 512YESYESYESYESYESYES
96 × 128YESYESYESYESYESYES
Periorbital768 × 1024NOYESNOYESYESYES
384 × 512NOYESNOYESYESYES
96 × 128NOYESNOYESYESYES
Inner canthus768 × 1024YESYESYESYESYESYES
384 × 512YESYESYESYESYESYES
96 × 128NTNTNTNTNTNT
Nose768 × 1024YESYESYESYESYESYES
384 × 512YESYESYESYESYESYES
96 × 128NTNTNTNTNTNT
Disclaimer/Publisher’s Note: The statements, opinions and data contained in all publications are solely those of the individual author(s) and contributor(s) and not of MDPI and/or the editor(s). MDPI and/or the editor(s) disclaim responsibility for any injury to people or property resulting from any ideas, methods, instructions or products referred to in the content.