
Optimization and Machine Learning in Modeling Approaches to Hybrid Energy Balance to Improve Ports’ Efficiency

 ,
,  ,
,  ,
,  , , and
Abstract
1. Introduction
- System flexibility supports off-grid, grid-connected, and hybrid configurations with multiple energy sources, including solar, wind, hydropower, and pumped storage, grid connection, and battery storage;
- Performance balances energy resource allocation based on load demand and renewable energy variability and seamlessly incorporates various renewable sources and storage solutions;
- Analysis evaluation assesses technical–operational assessments and cost-effectiveness by analyzing capital and operational expenses, along with key financial metrics, and examines the impact of parameter variations on system efficiency and performance;
- User-friendly interfaces offer an intuitive graphical interface with visualization tools for data interpretation and presentation.
2. Materials and Methods
2.1. Strategic Energy Management Optimization
2.1.1. EMTv1 Model
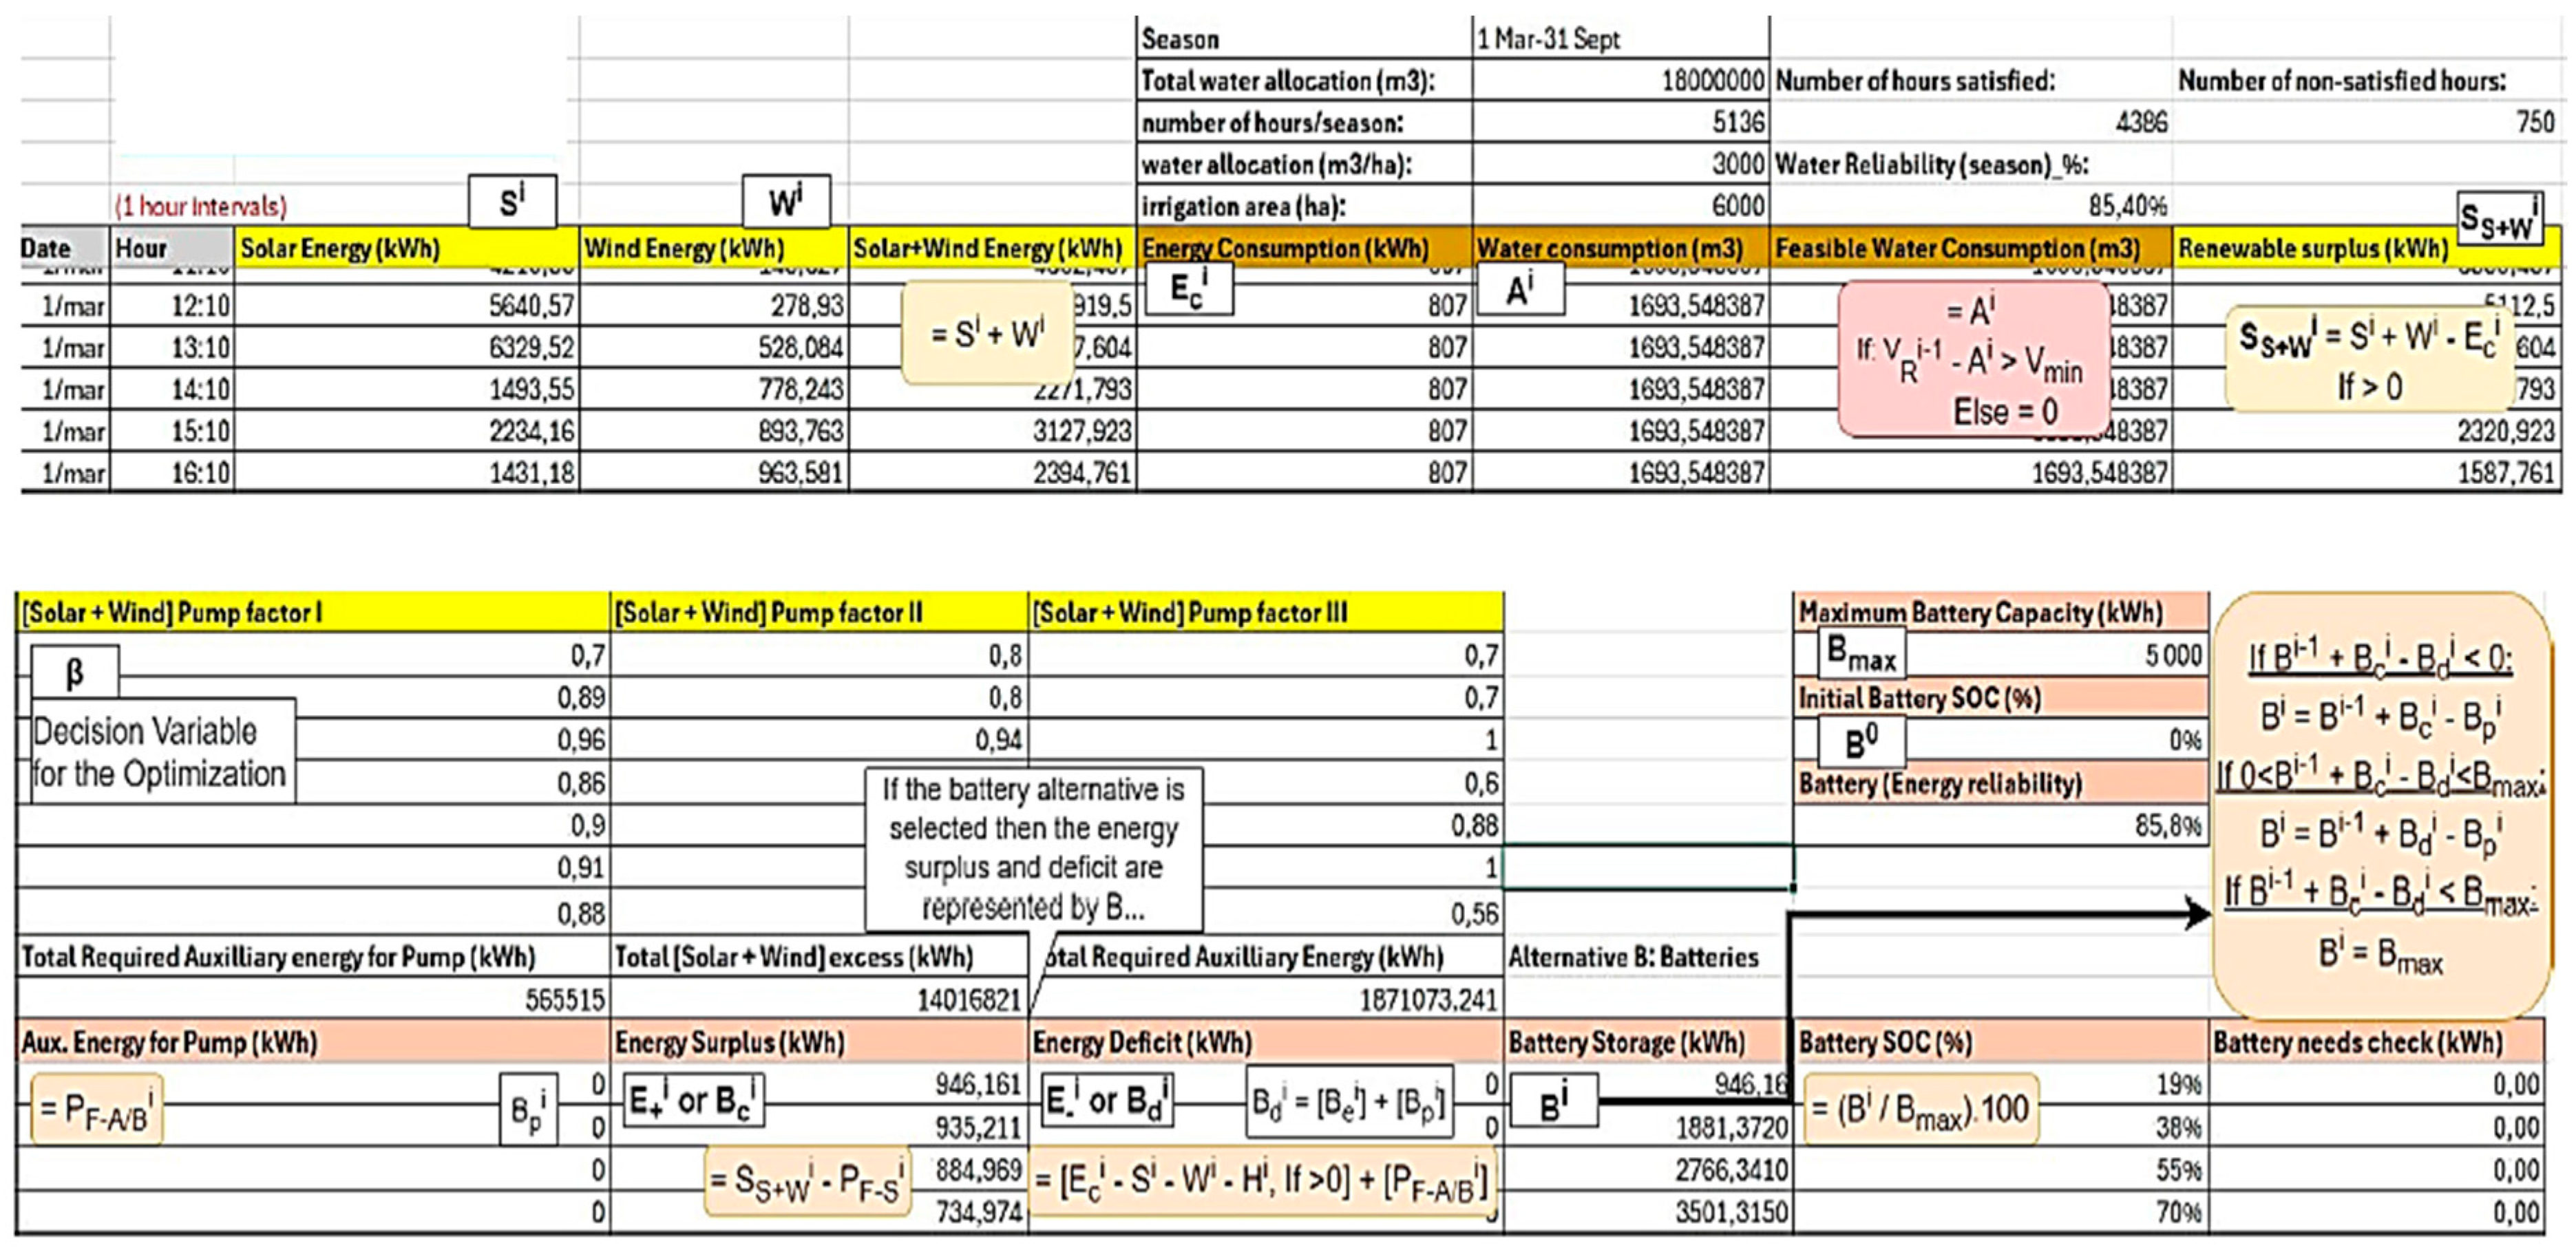
2.1.2. HY4RES Model
2.1.3. HOMER Model
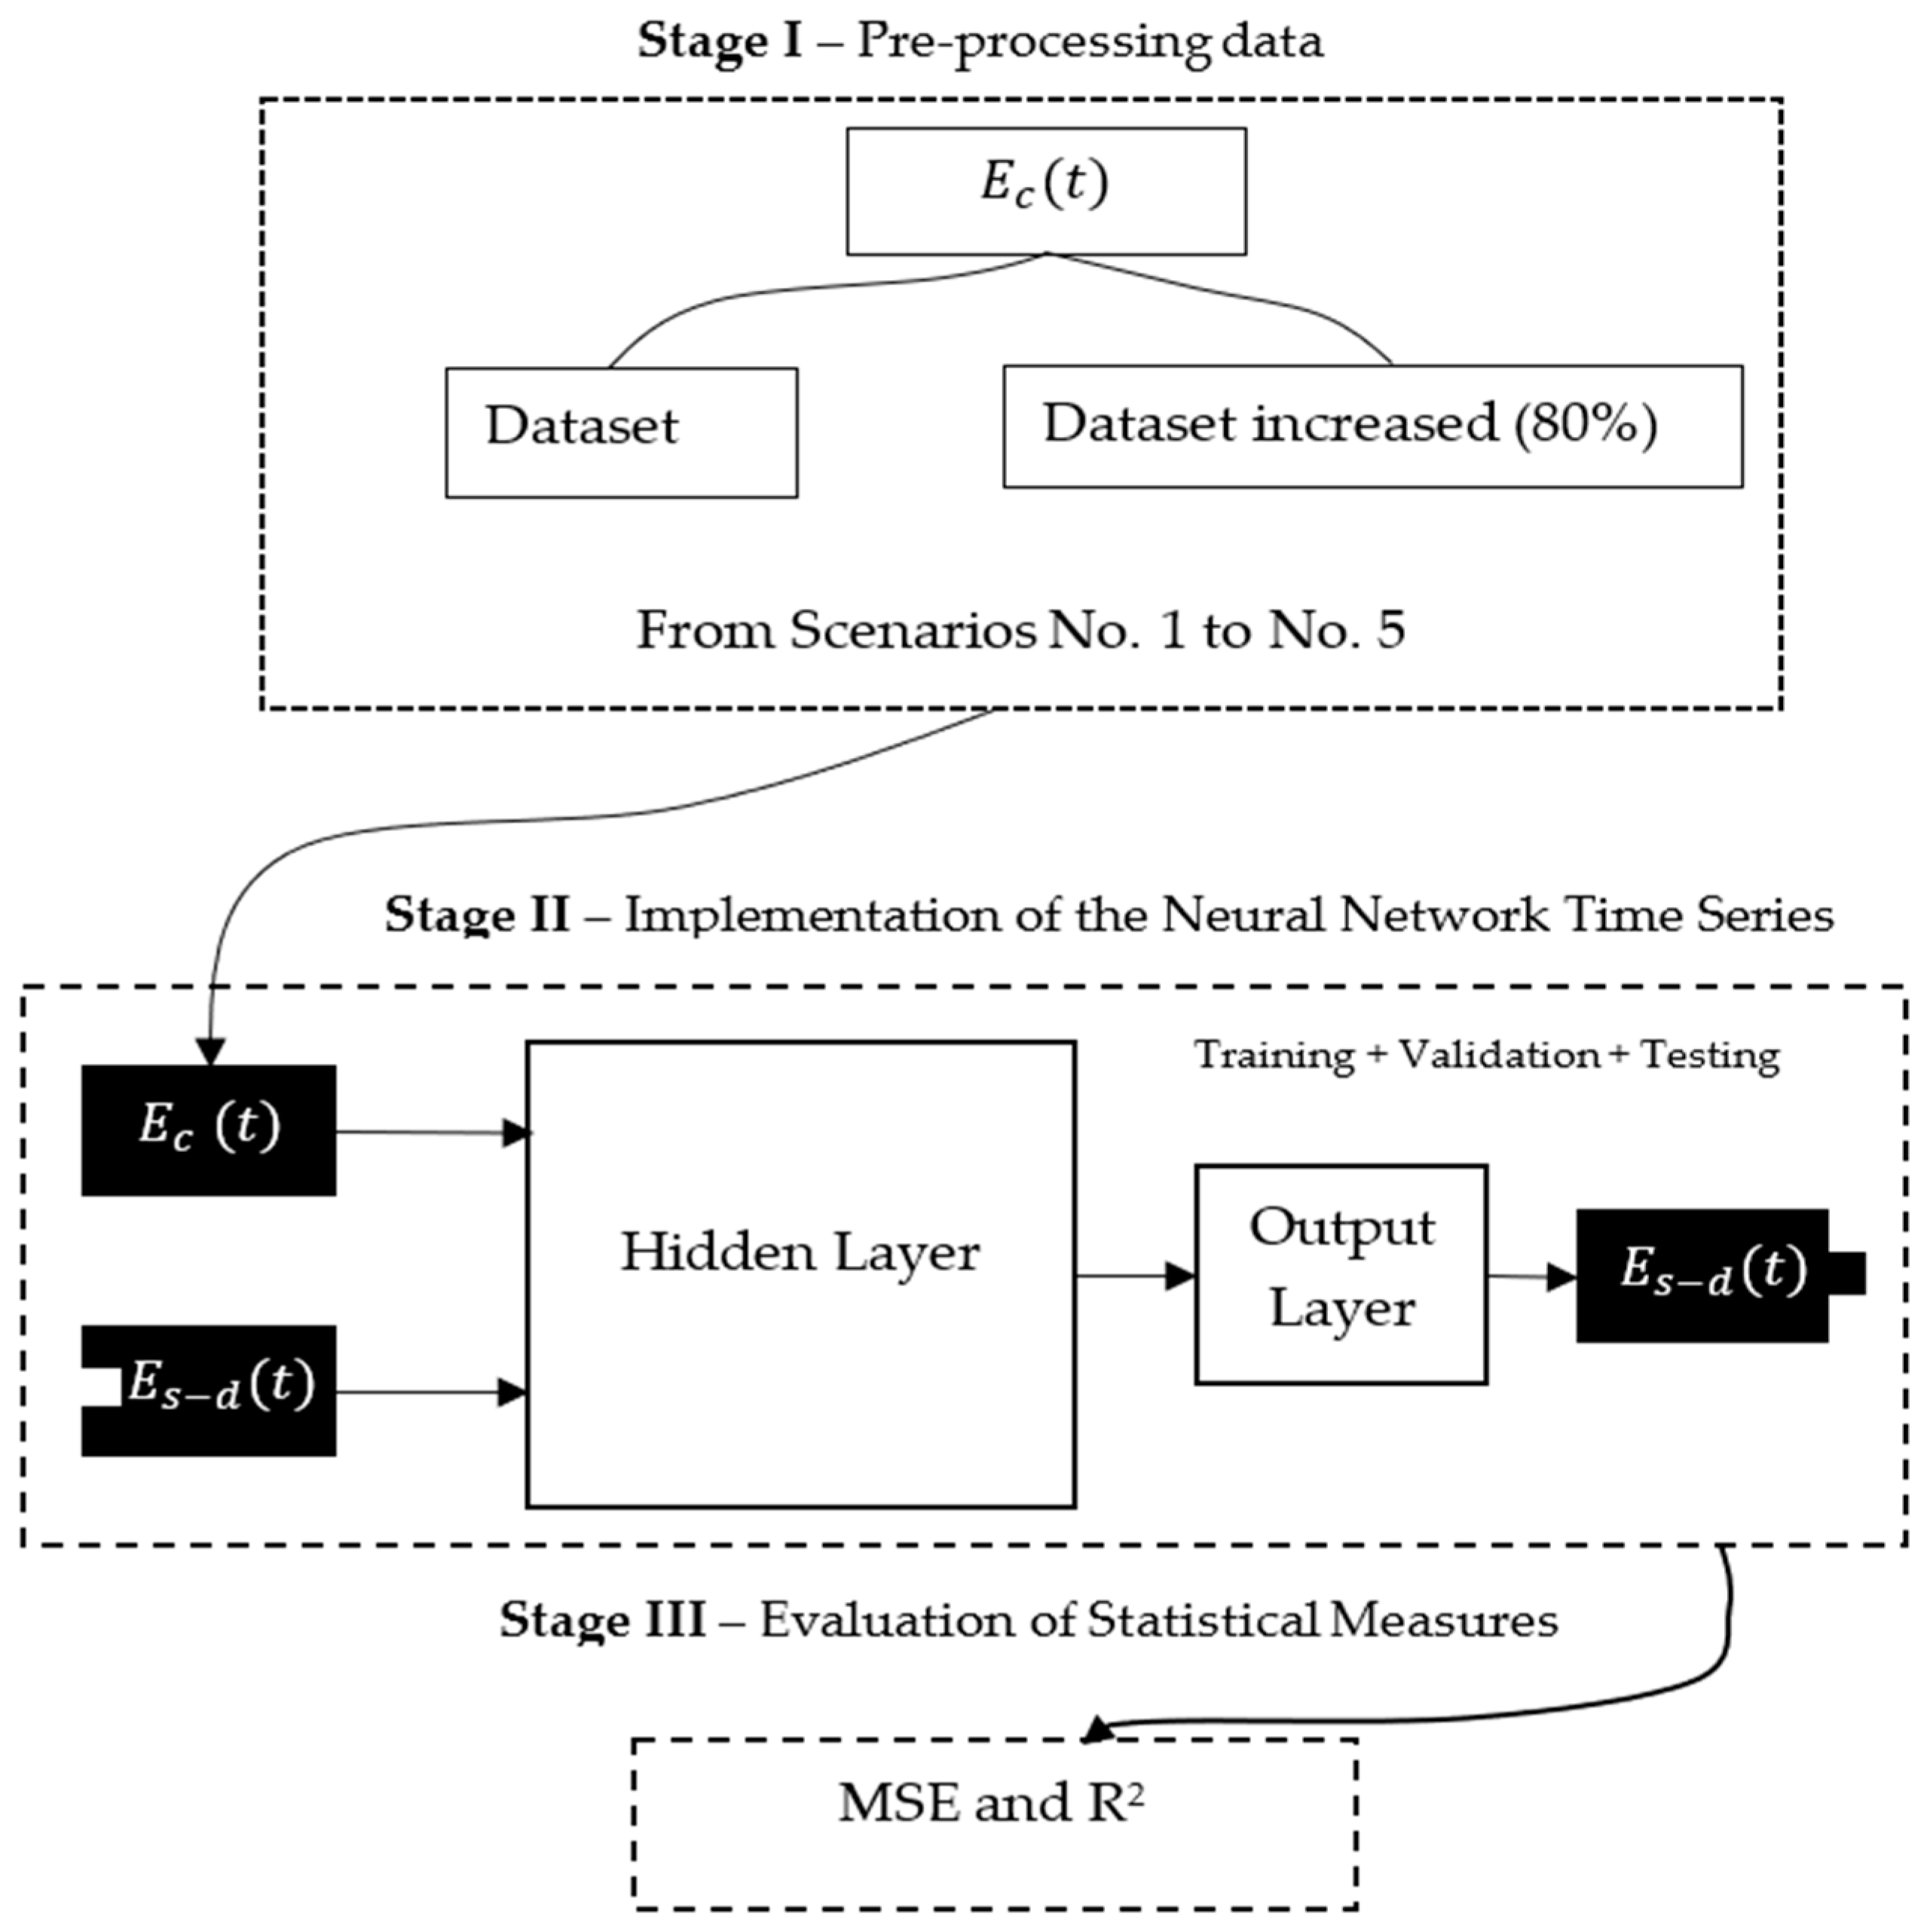
2.2. Machine Learning Methodology
- (I)
- Pre-Processing Data
- (II)
- Implementation of the Neural Network Time Series (NNTS)
- (III)
- Evaluation of Statistical Measures
- Mean square error
- Coefficient of determination ()
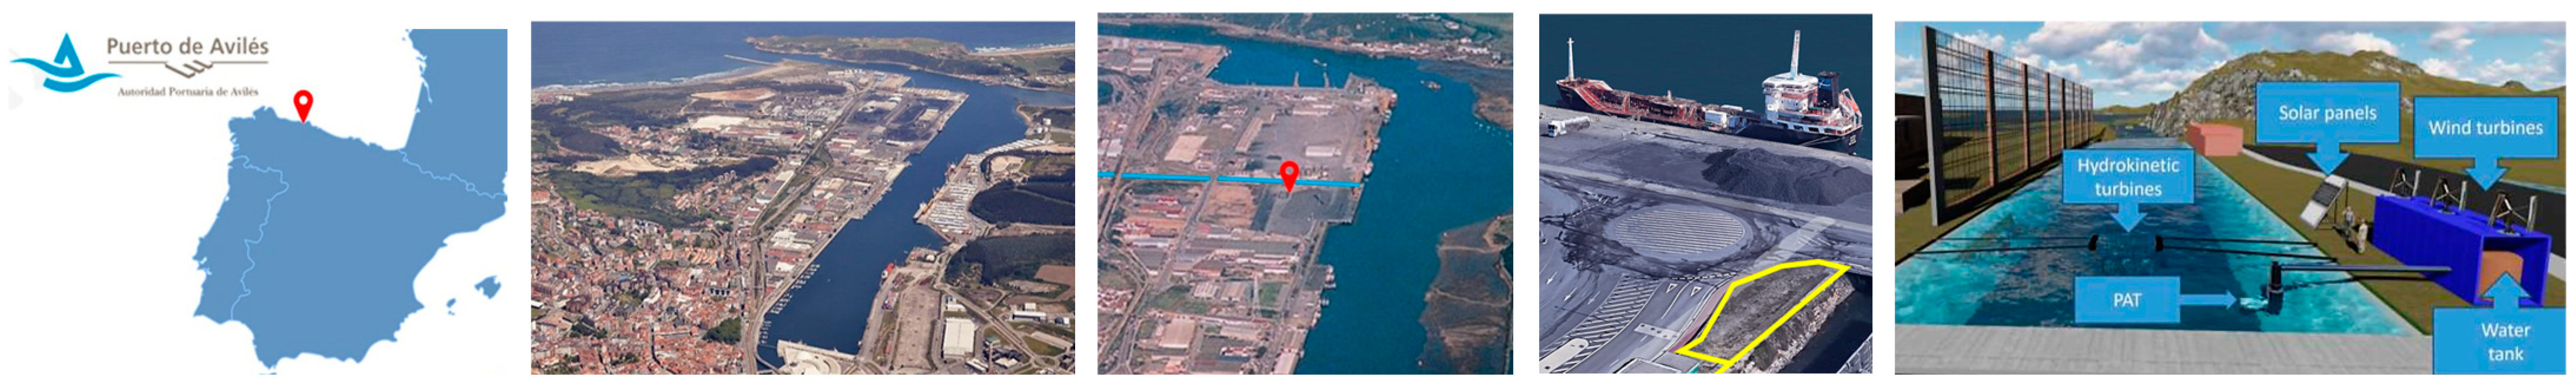
3. Case Study of the Port of Avilés
3.1. Brief System Characterization
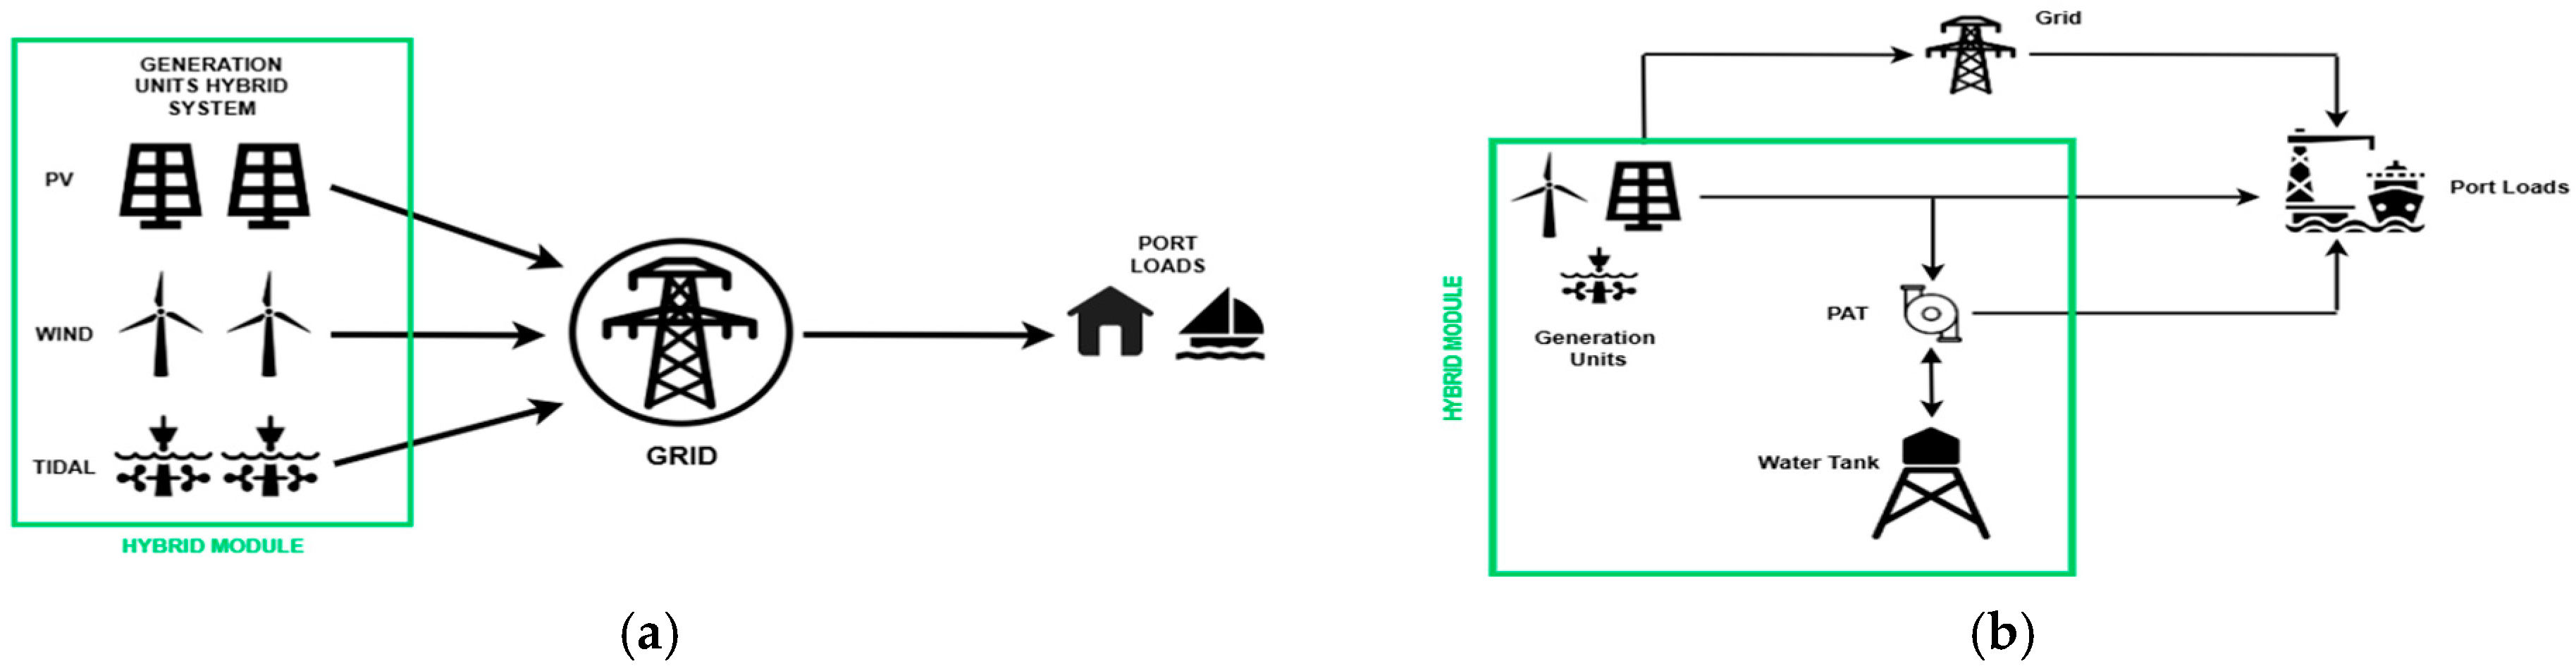
- Sea Hybrid Module: This was a storage unit for all electrical components, control electronics, and batteries, along with other essential elements required for the analysis of the pilot site, such as sensors. Additionally, it housed a water tank and a Pump-as-Turbine (PAT) unit.
- Solar Panels: A metal support structure, located near the sea Hybrid module, accommodated multiple solar panels to generate electricity during daylight hours.
- Wind Turbines: Three vertical-axis wind turbines were installed on top of the sea hybrid module to harness the wind energy available at the site.
- Hydrokinetic Turbines: Given the presence of a small tidal river near the pilot site, a floating platform equipped with two vertical-axis hydrokinetic turbines was developed to capture energy from the kinetic movement of the water current.
- PHS (based on Pump-as-Turbine (PAT)) Unit: This unit, located within the sea hybrid module, included a water tank, a pump operating as a turbine, and all necessary plumbing components, such as pipes and control valves.
3.2. Different Modeling Approaches
3.2.1. EMT Modeling
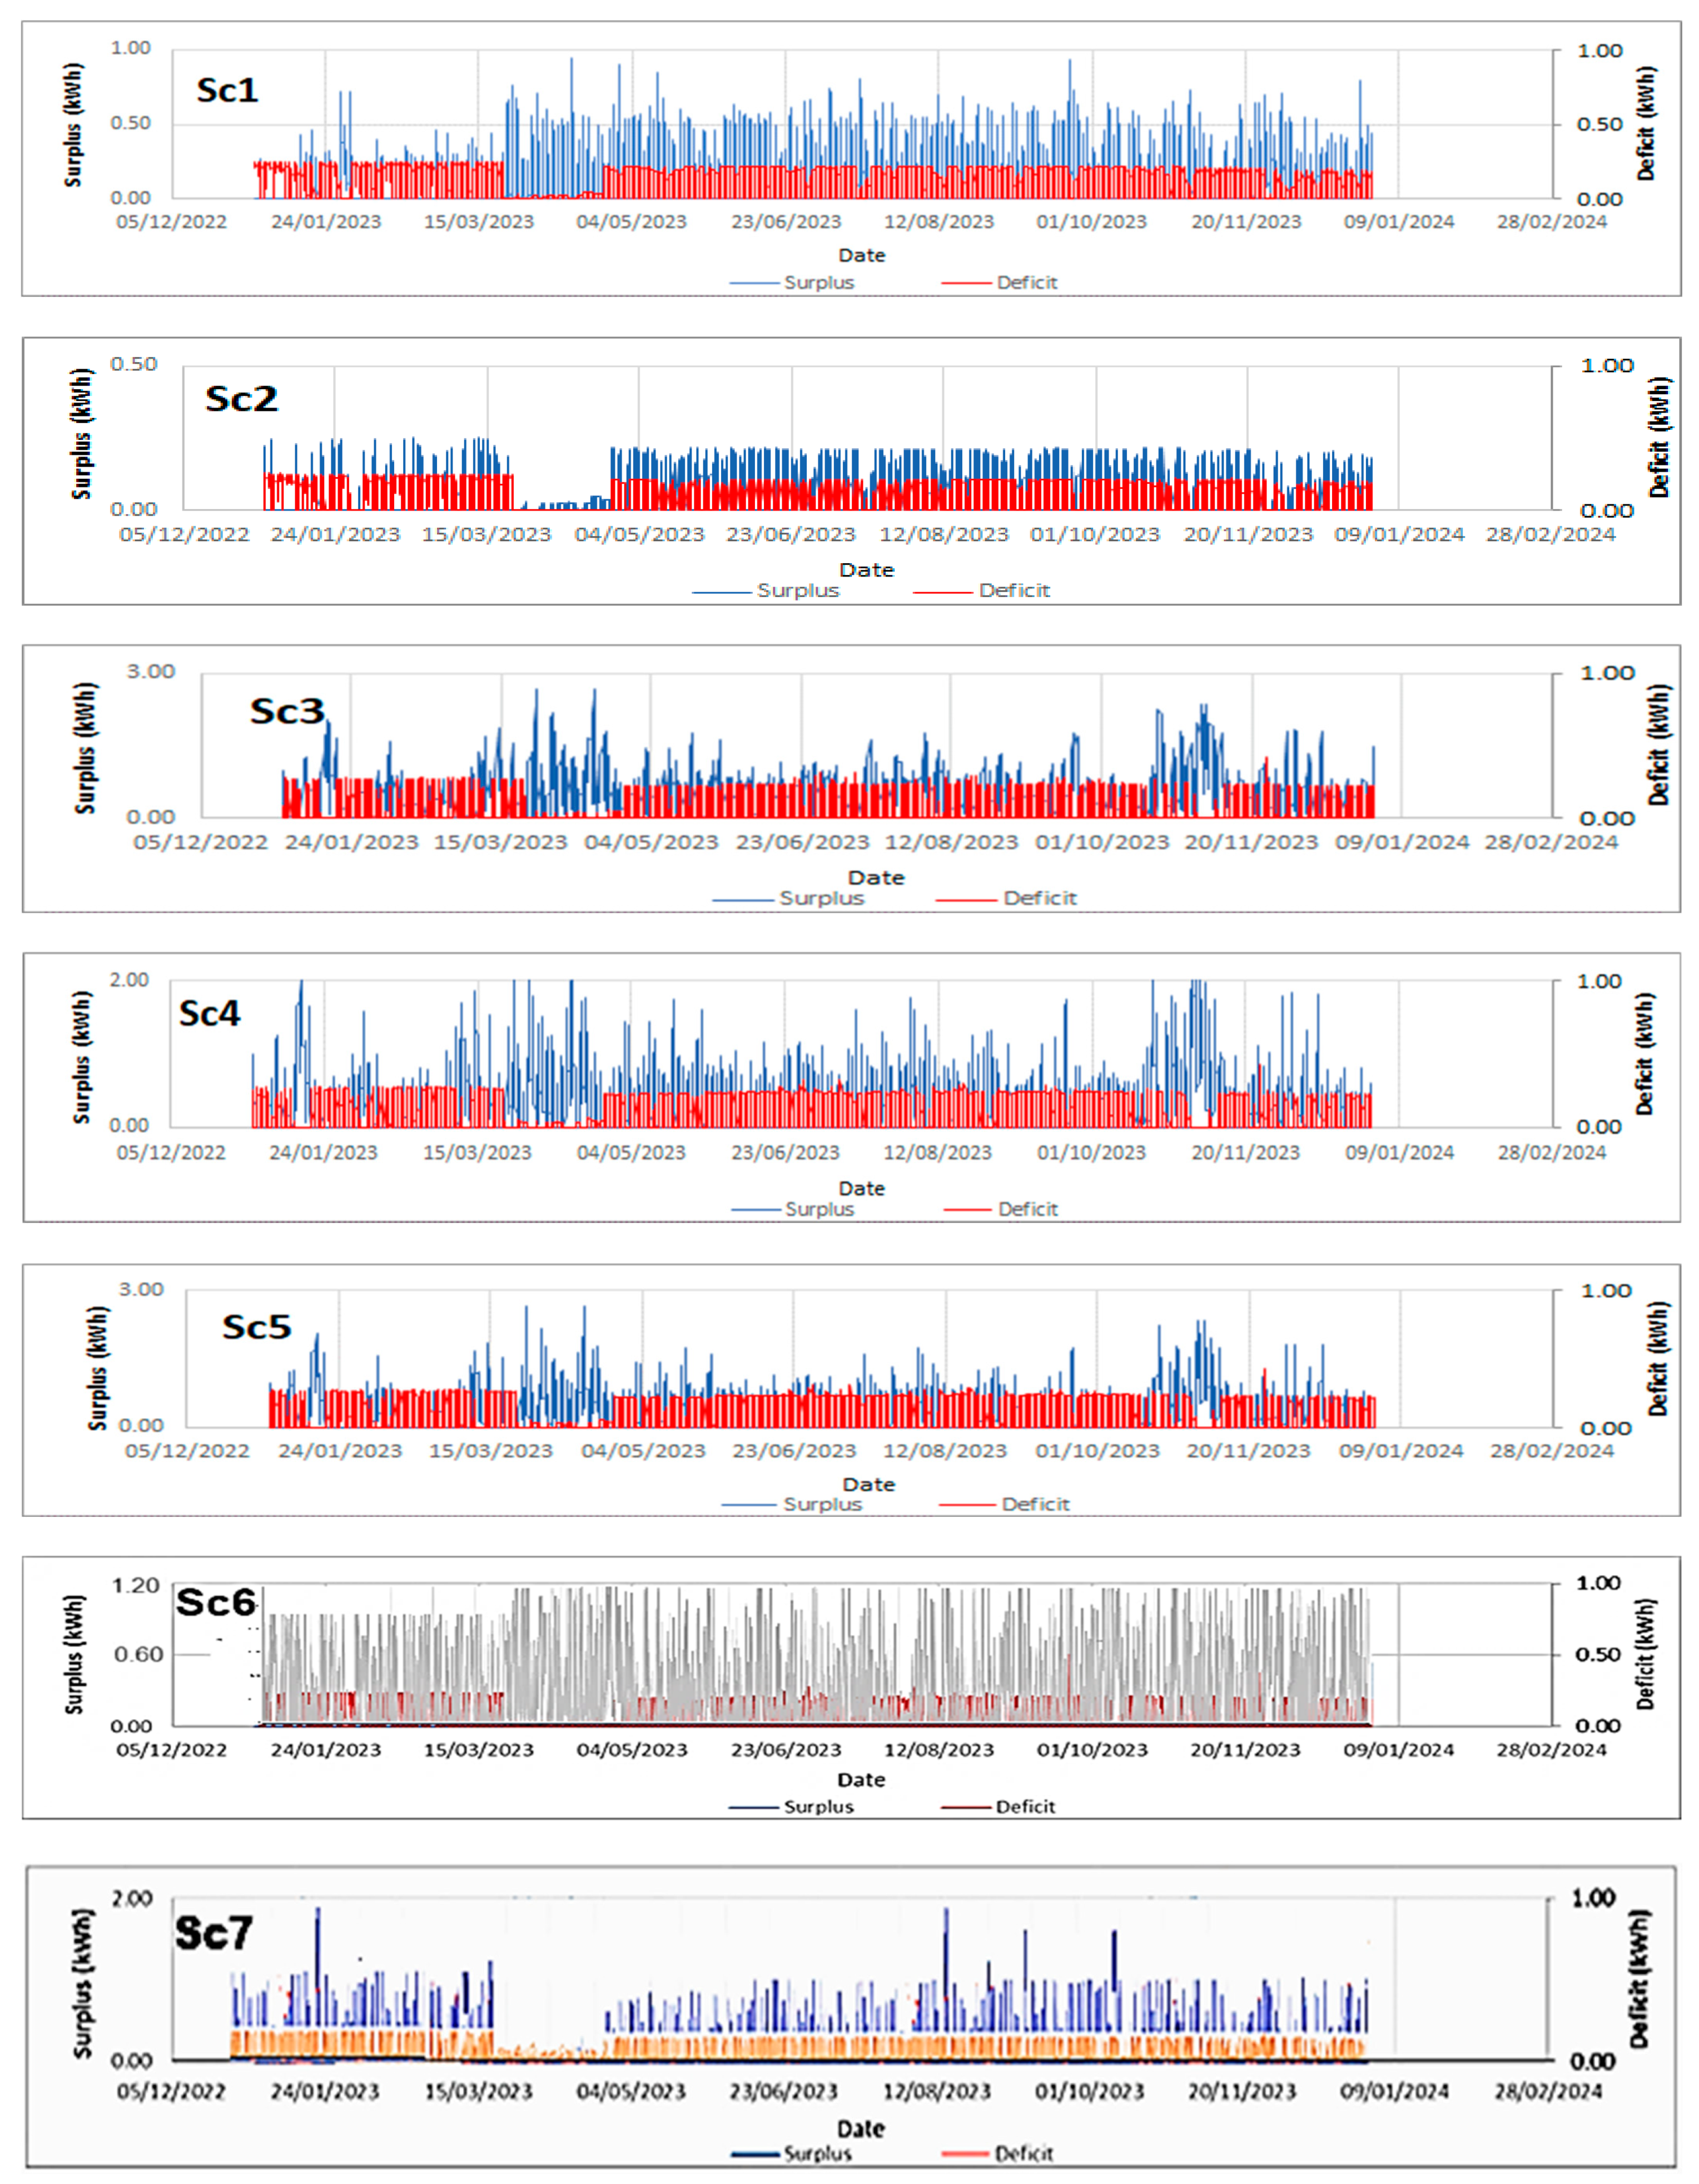
- Scenario 1—EMT Modeling: On-Grid Without Self-Consumption and PAT: A comparison of generated and consumed energy revealed a significant surplus, with the hybrid module producing 1449 kWh/year while demand was only 171 kWh/year. This underscored the technology’s impact, even without direct interaction between generation and demand. Figure 9 shows the energy balance with substantial surplus energy and the deficit in terms of strategic operation for two sample months.
- Scenario 2—EMT Modeling: On-Grid with Self-Consumption and PAT: This scenario focused on the interaction between generation and demand, integrating both the energy-generating components and the storage capabilities of one module. A first optimization was focused on the storage capacity that maximized economic benefits, which was 15 m3. This volume entirely almost eliminated dependence on the electricity grid, covering a total of 8619 h annually, equivalent to 98.39% hours of the year. For the energy demand sector, two representative months of the year, January and August, were selected. These months were chosen to capture the key differences in operation between winter and summer (Figure 10).
3.2.2. HY4RES Modeling
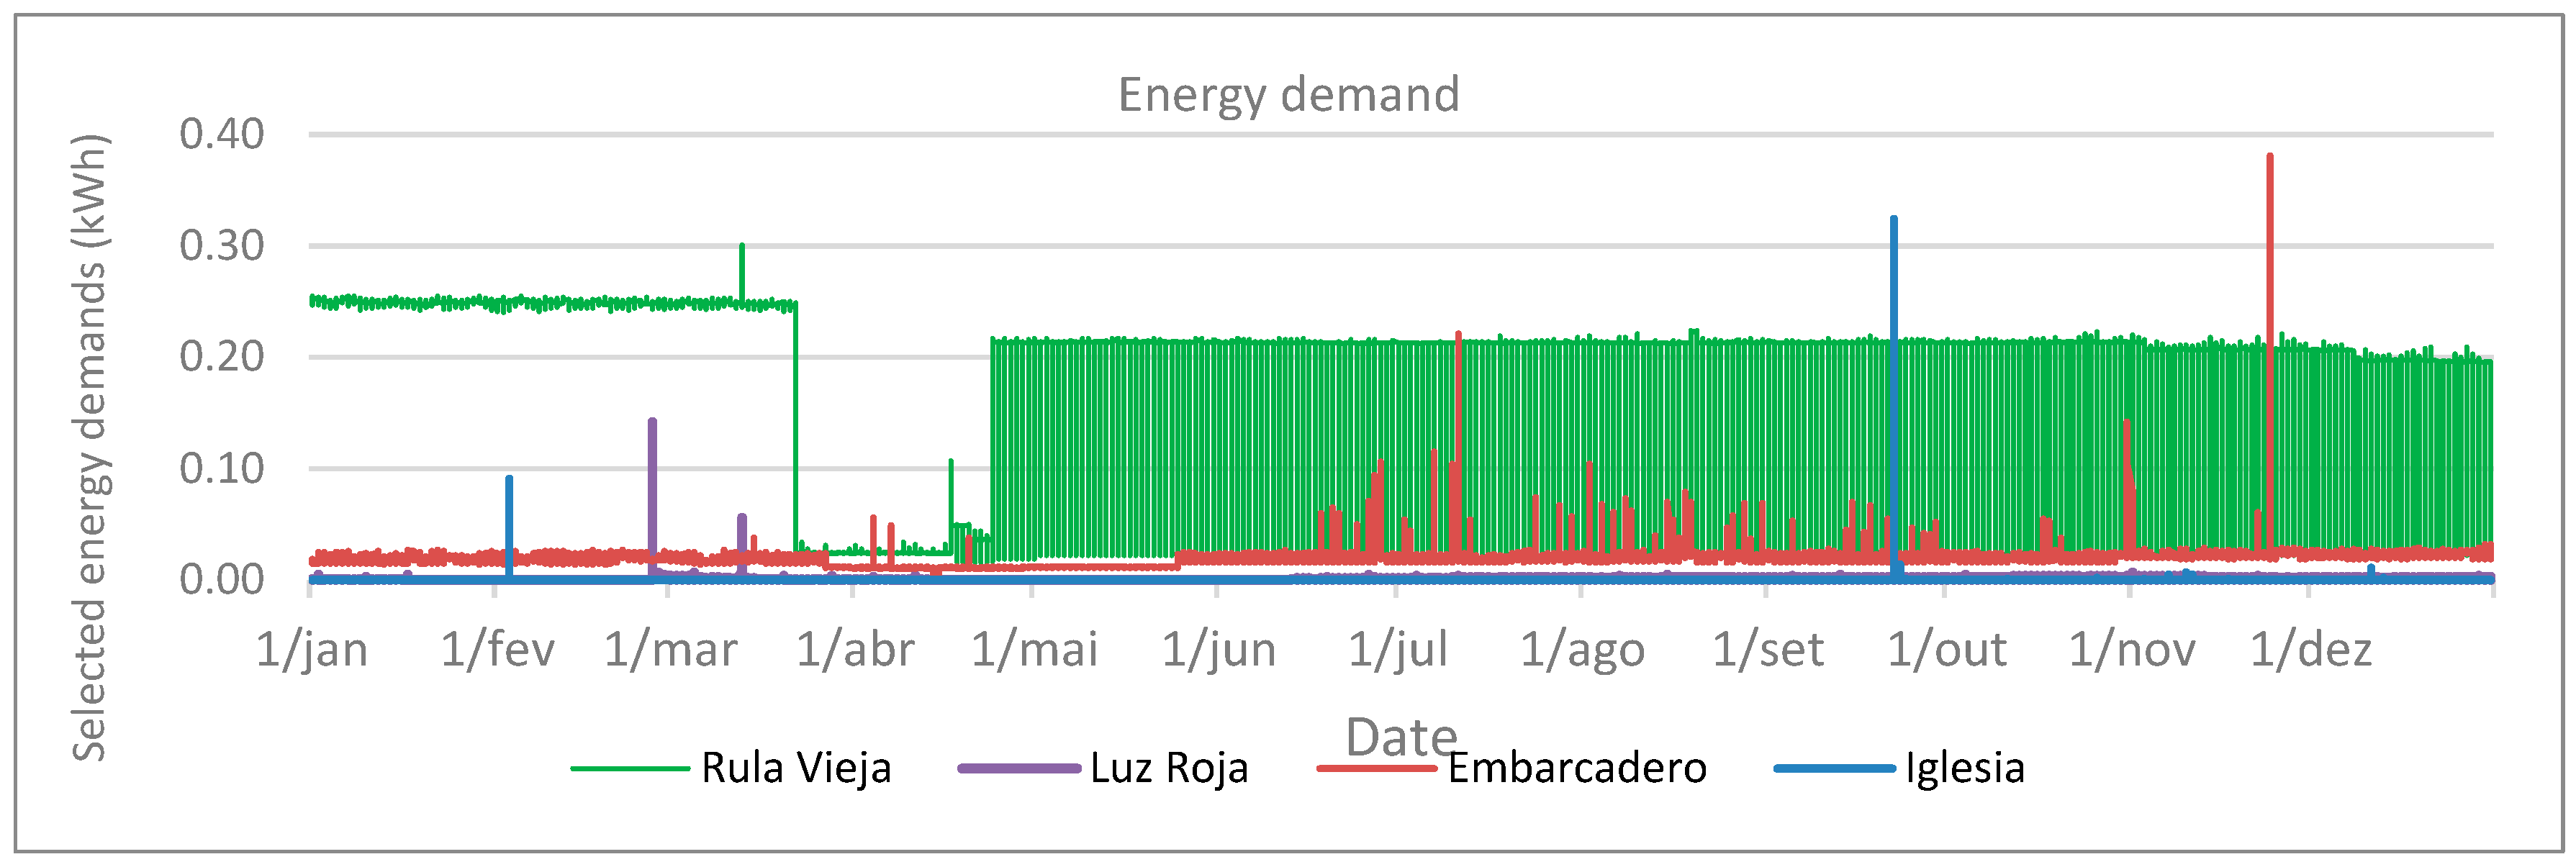
- Peak load = 0.604 kW;
- Average hourly consumption = 0.161 kWh;
- Total annual consumption = 1410.3 kWh.

- -
- Scenario 3—Solar, wind, and hydrokinetic energy and electric grid;
- -
- Scenario 4—Solar, wind, and hydrokinetic energy and PAT (PHS), eventually requiring the electric grid to meet the defined load;
- -
- Scenario 5—Solar, wind, and hydrokinetic energy and BESS (battery energy storage system), keeping in mind the primary renewable sources being solar + wind + hydrokinetic in all scenarios.
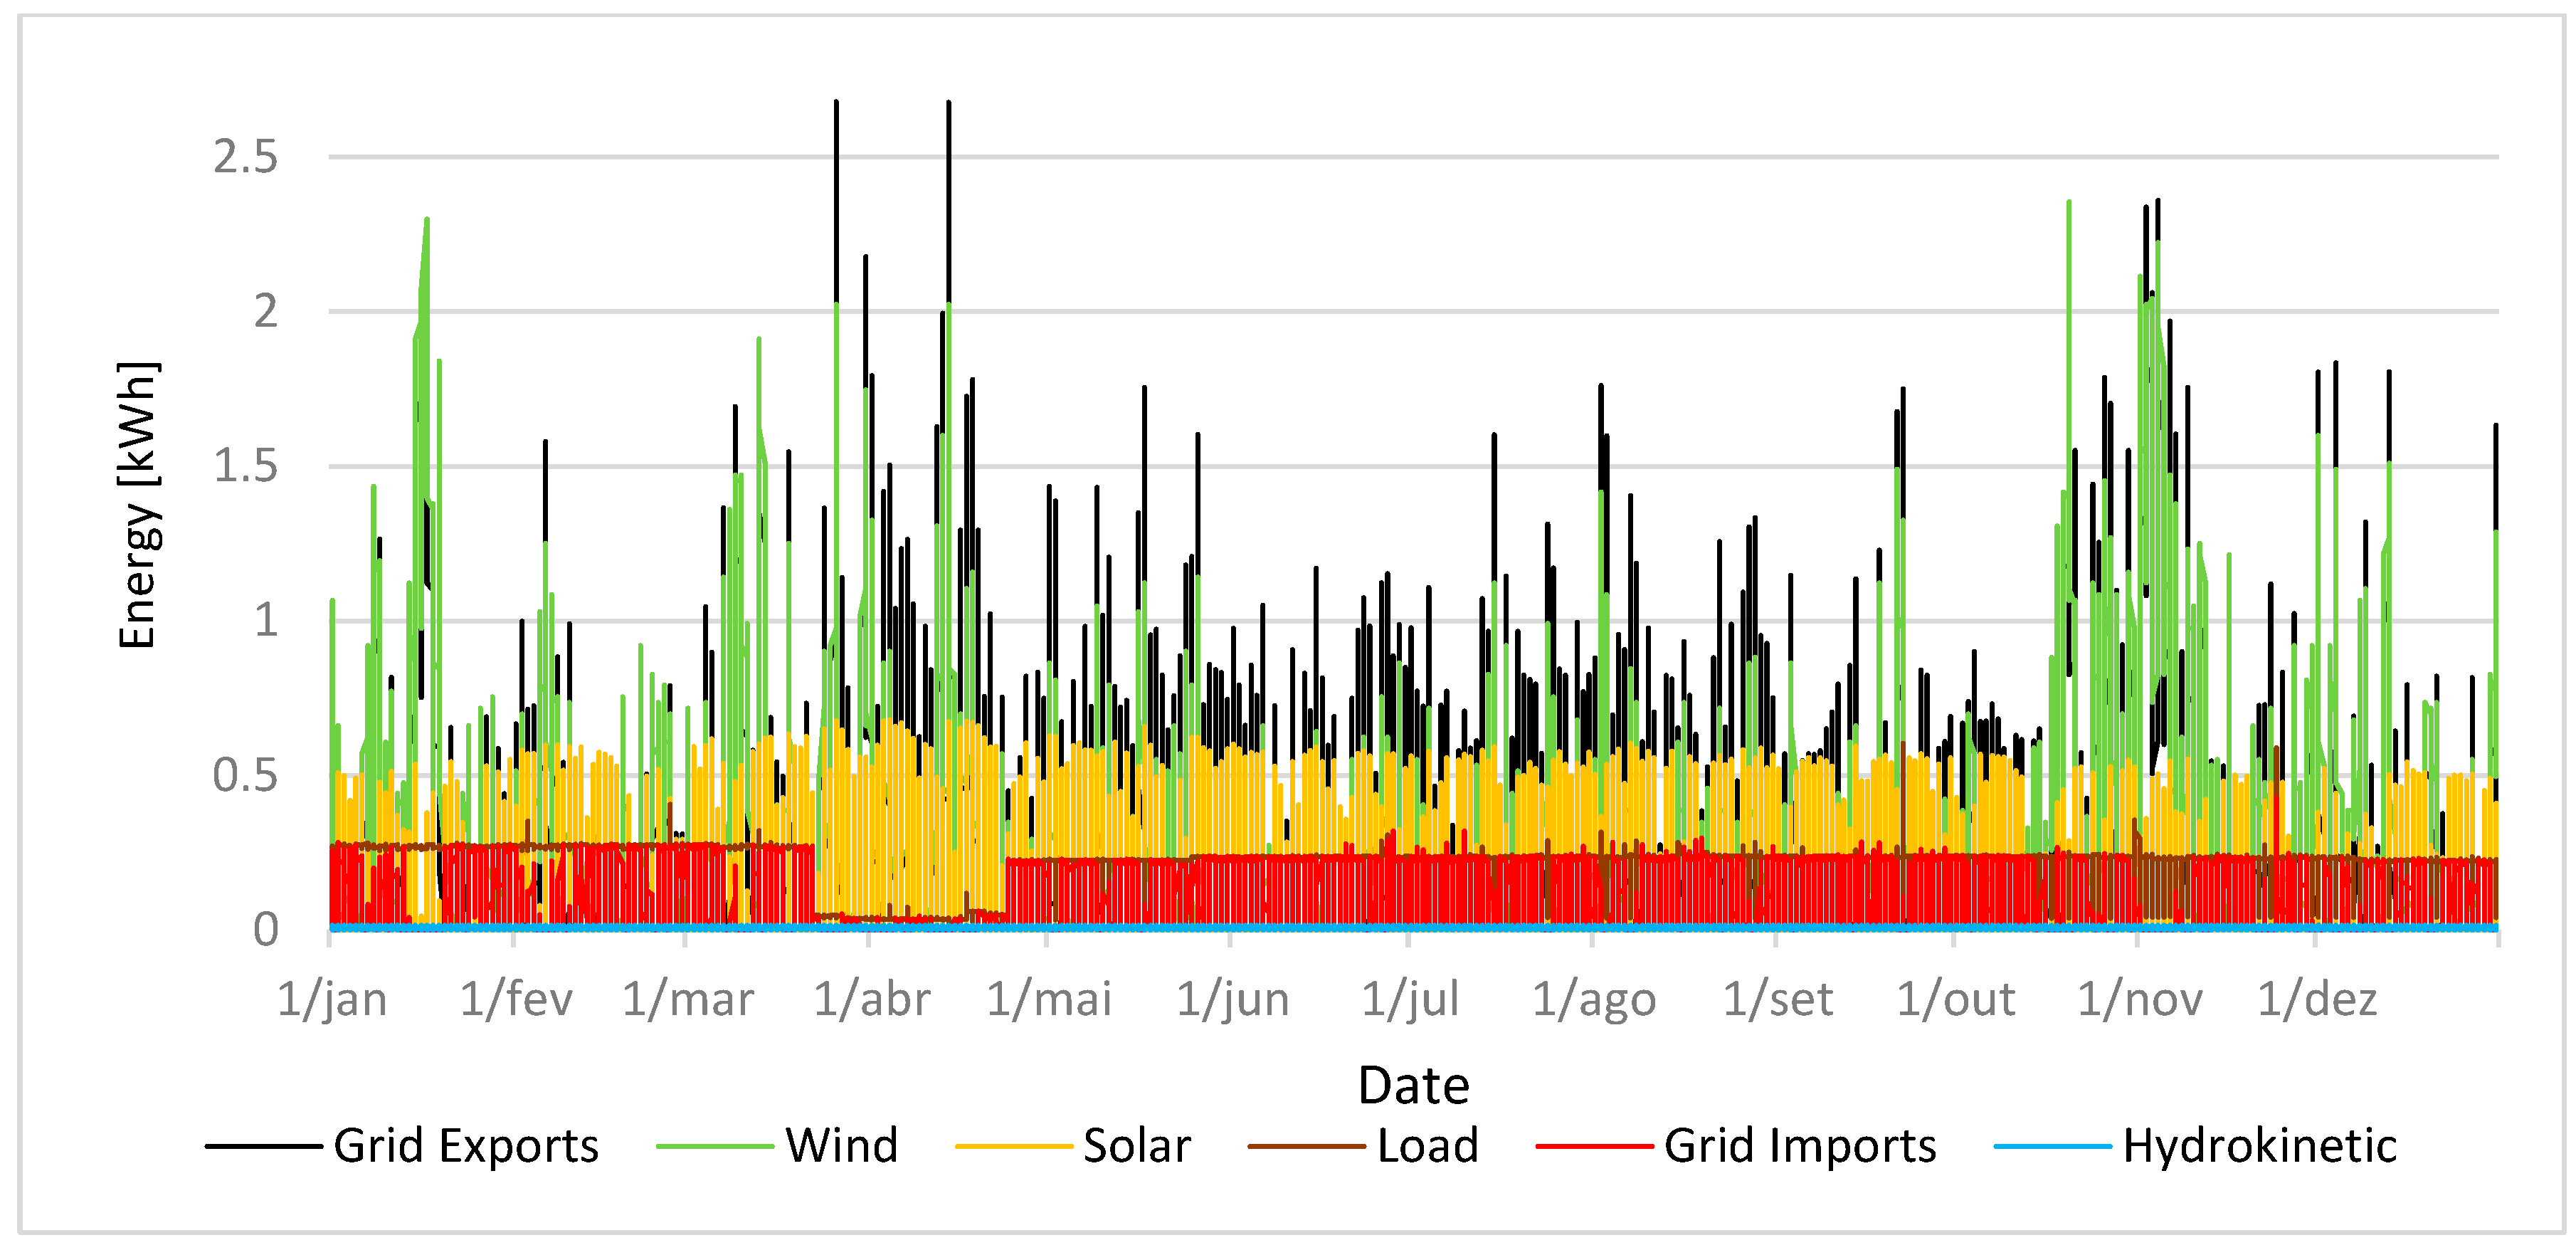
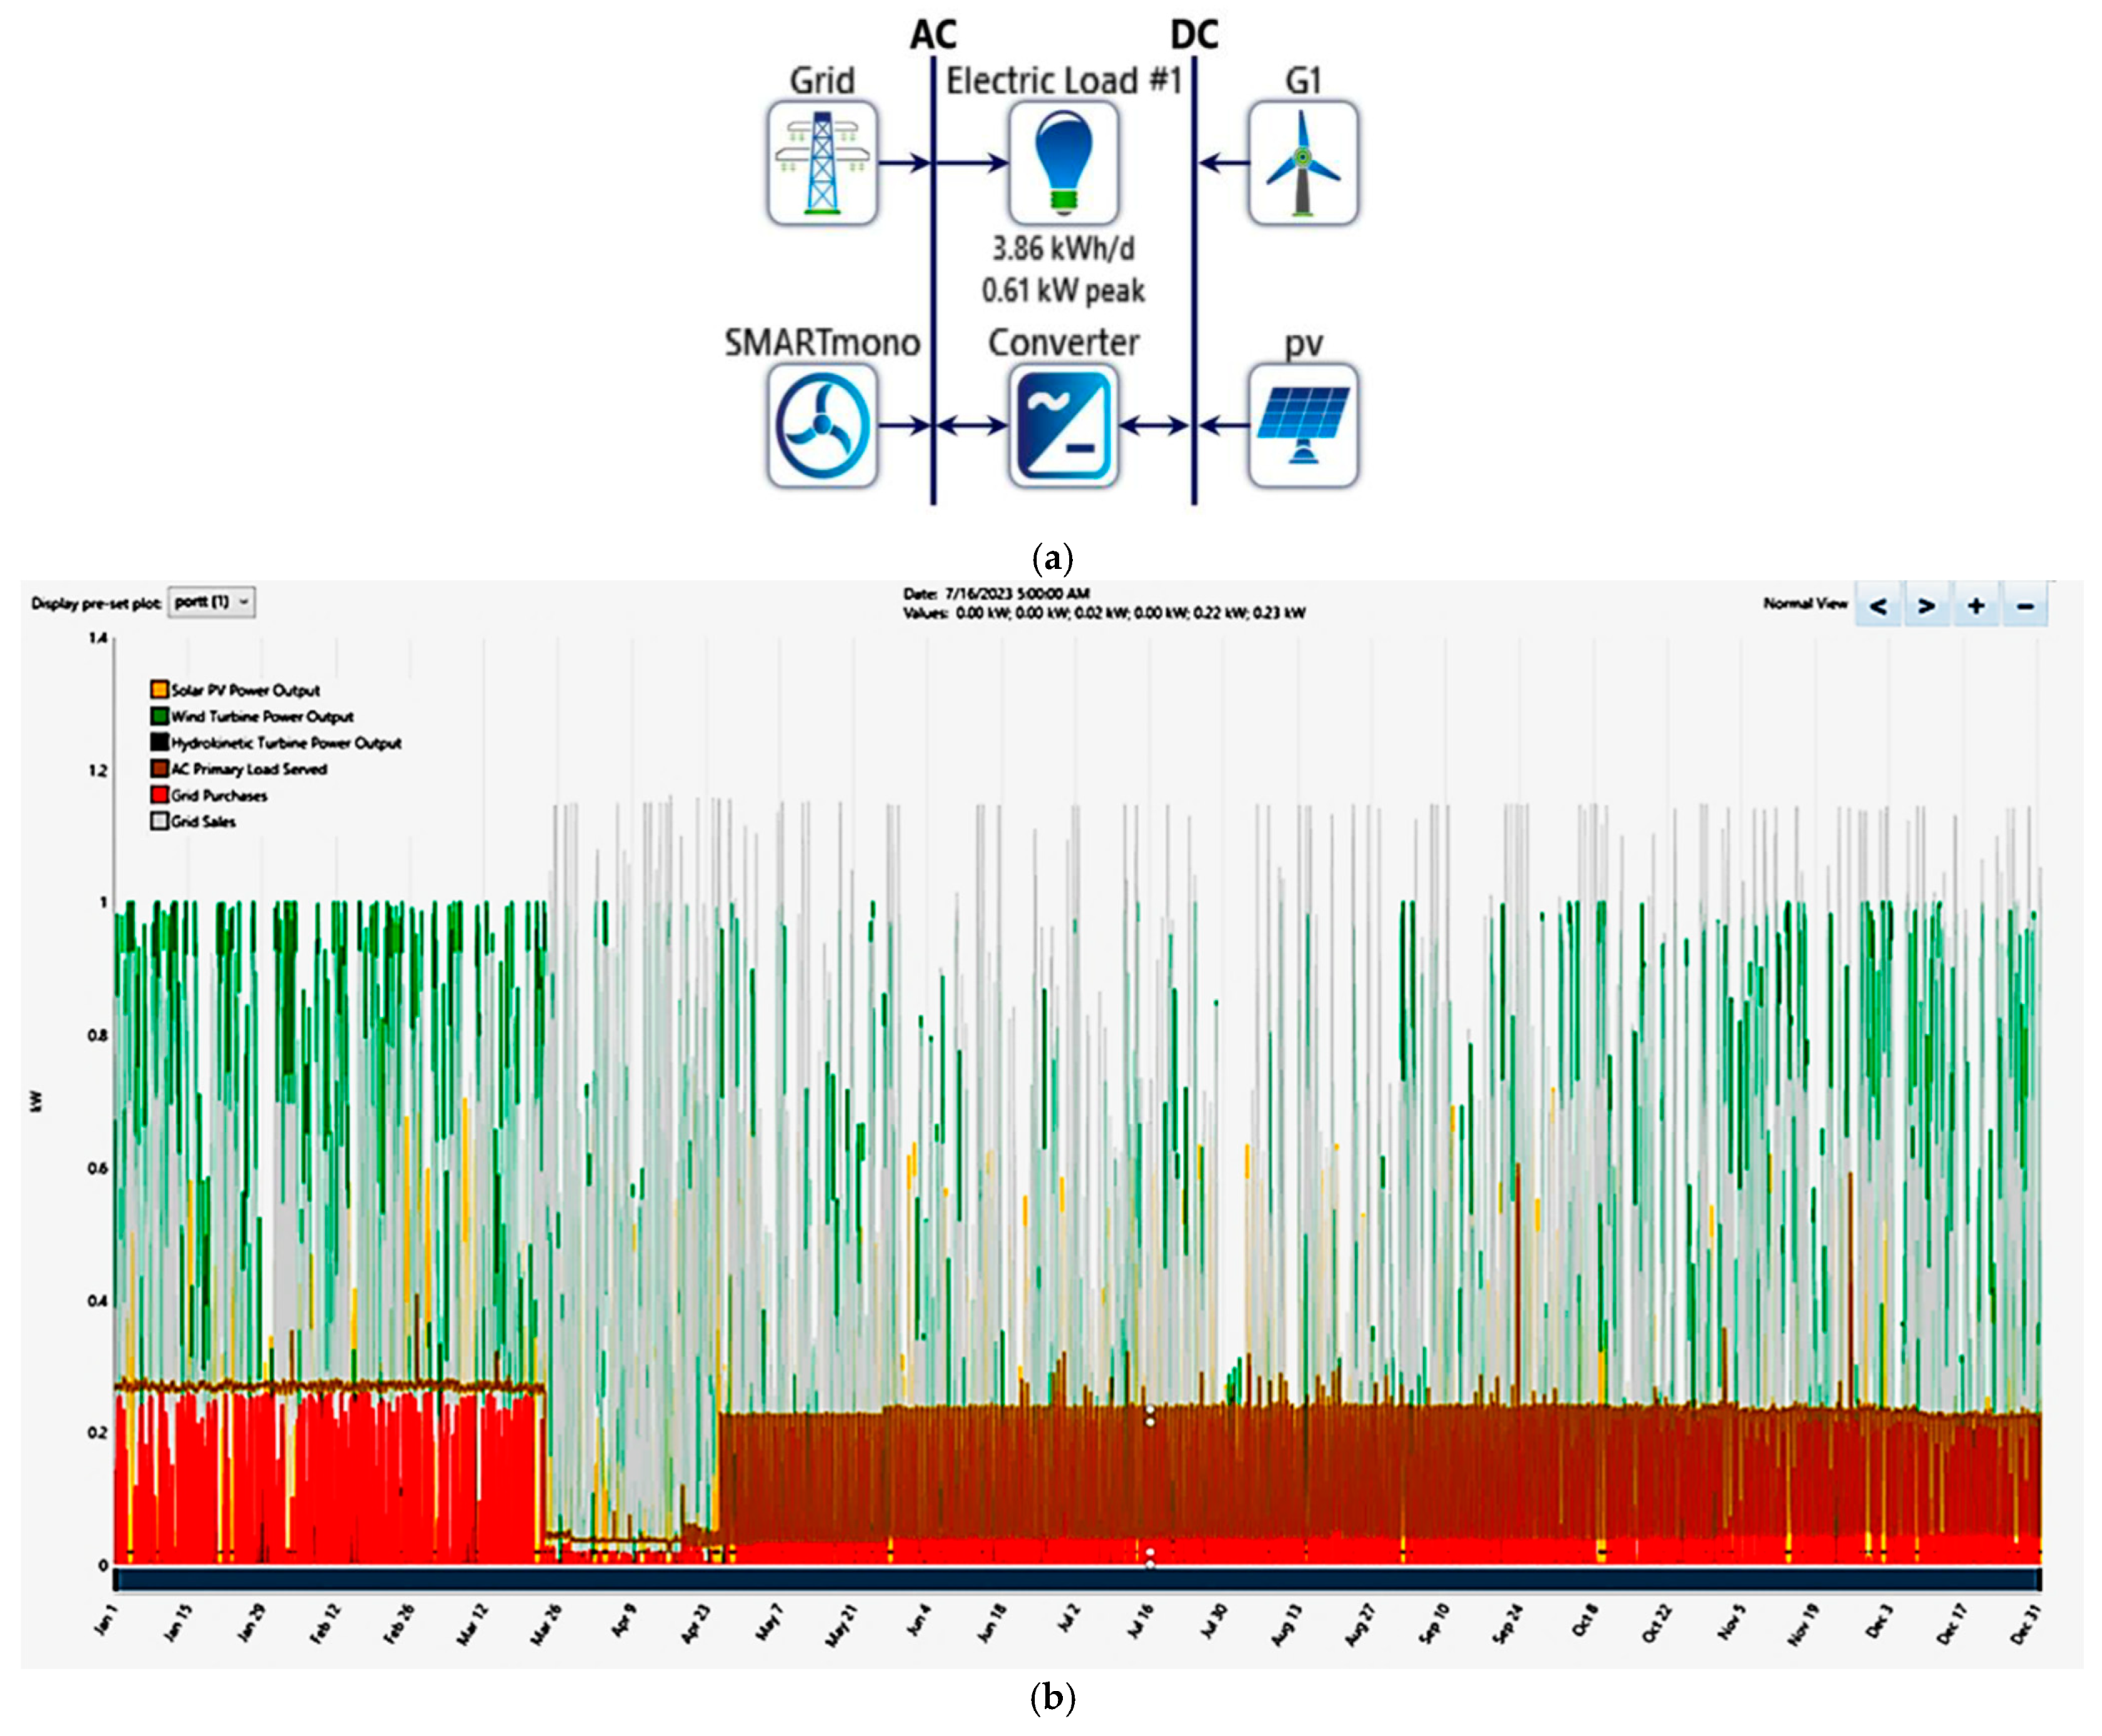
- Scenario 3—HY4RES Modeling: Solar, Wind, and Hydrokinetic Energy and Grid: In this scenario, the electric grid satisfied the energy needs that had not been satisfied by the primary renewables. The system was independent of the grid for ~60% of the total annual hours and the energy needs were covered 72%. Nonetheless, the system exported more energy to the grid than it imported:
- -
- Total annual exported renewables = 2681.2 kWh;
- -
- Total annual imported renewables = 609.8 kWh.
- Scenario 4—HY4RES Modeling: Solar, Wind, and Hydrokinetic Energy and PAT: The goal of this configuration was to maximize the performance of the PAT (PHS) system. However, the site did not possess a significant height variation, and the module’s scale was small. So, the production potential of the PAT subsystem was likely insufficient to meet all the defined energy demand without grid assistance.
- Pump-rated power (with an efficiency equal to the one in turbine mode) = 0.523 kW;
- Reservoir capacity = 10 m3.
- E is the energy stored in kWh;
- ρwater is the density of water, 1000 kg/m3;
- Vres is the volume of water in the upper reservoir in m3;
- Hhead is the available head in m;
- η is the efficiency of the energy conversion considering losses for turbine efficiency and generator efficiency.
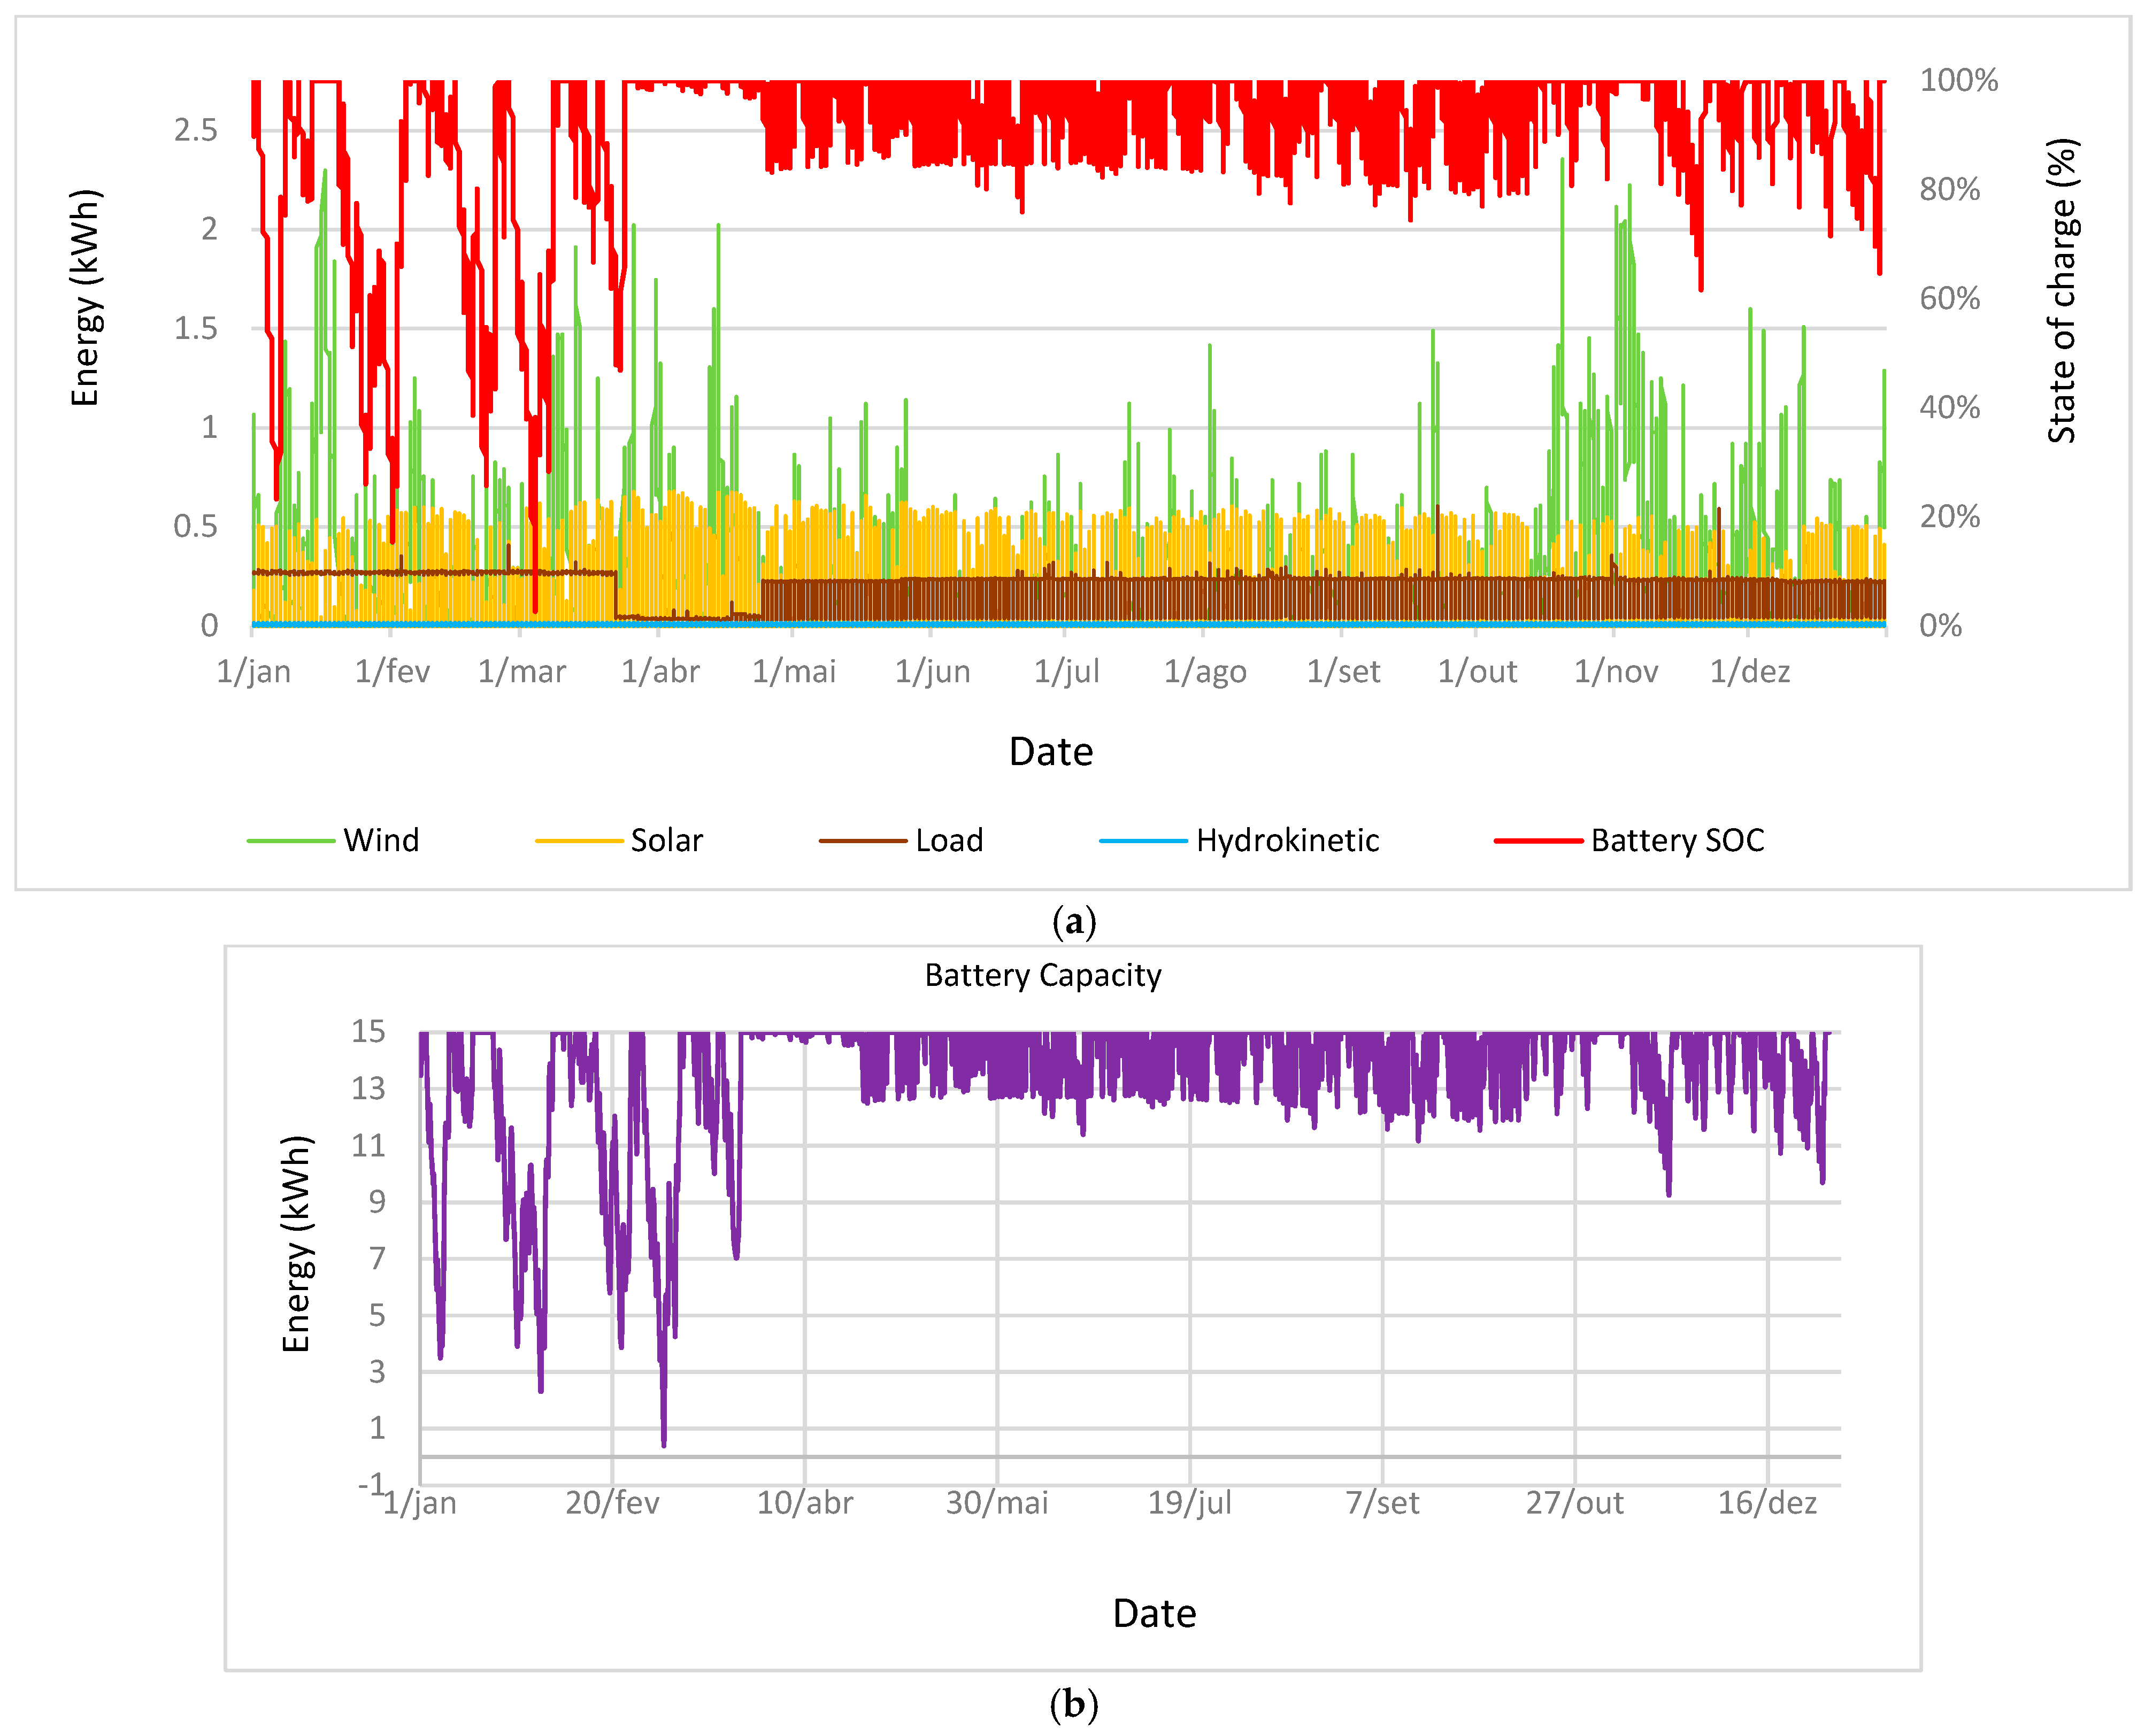
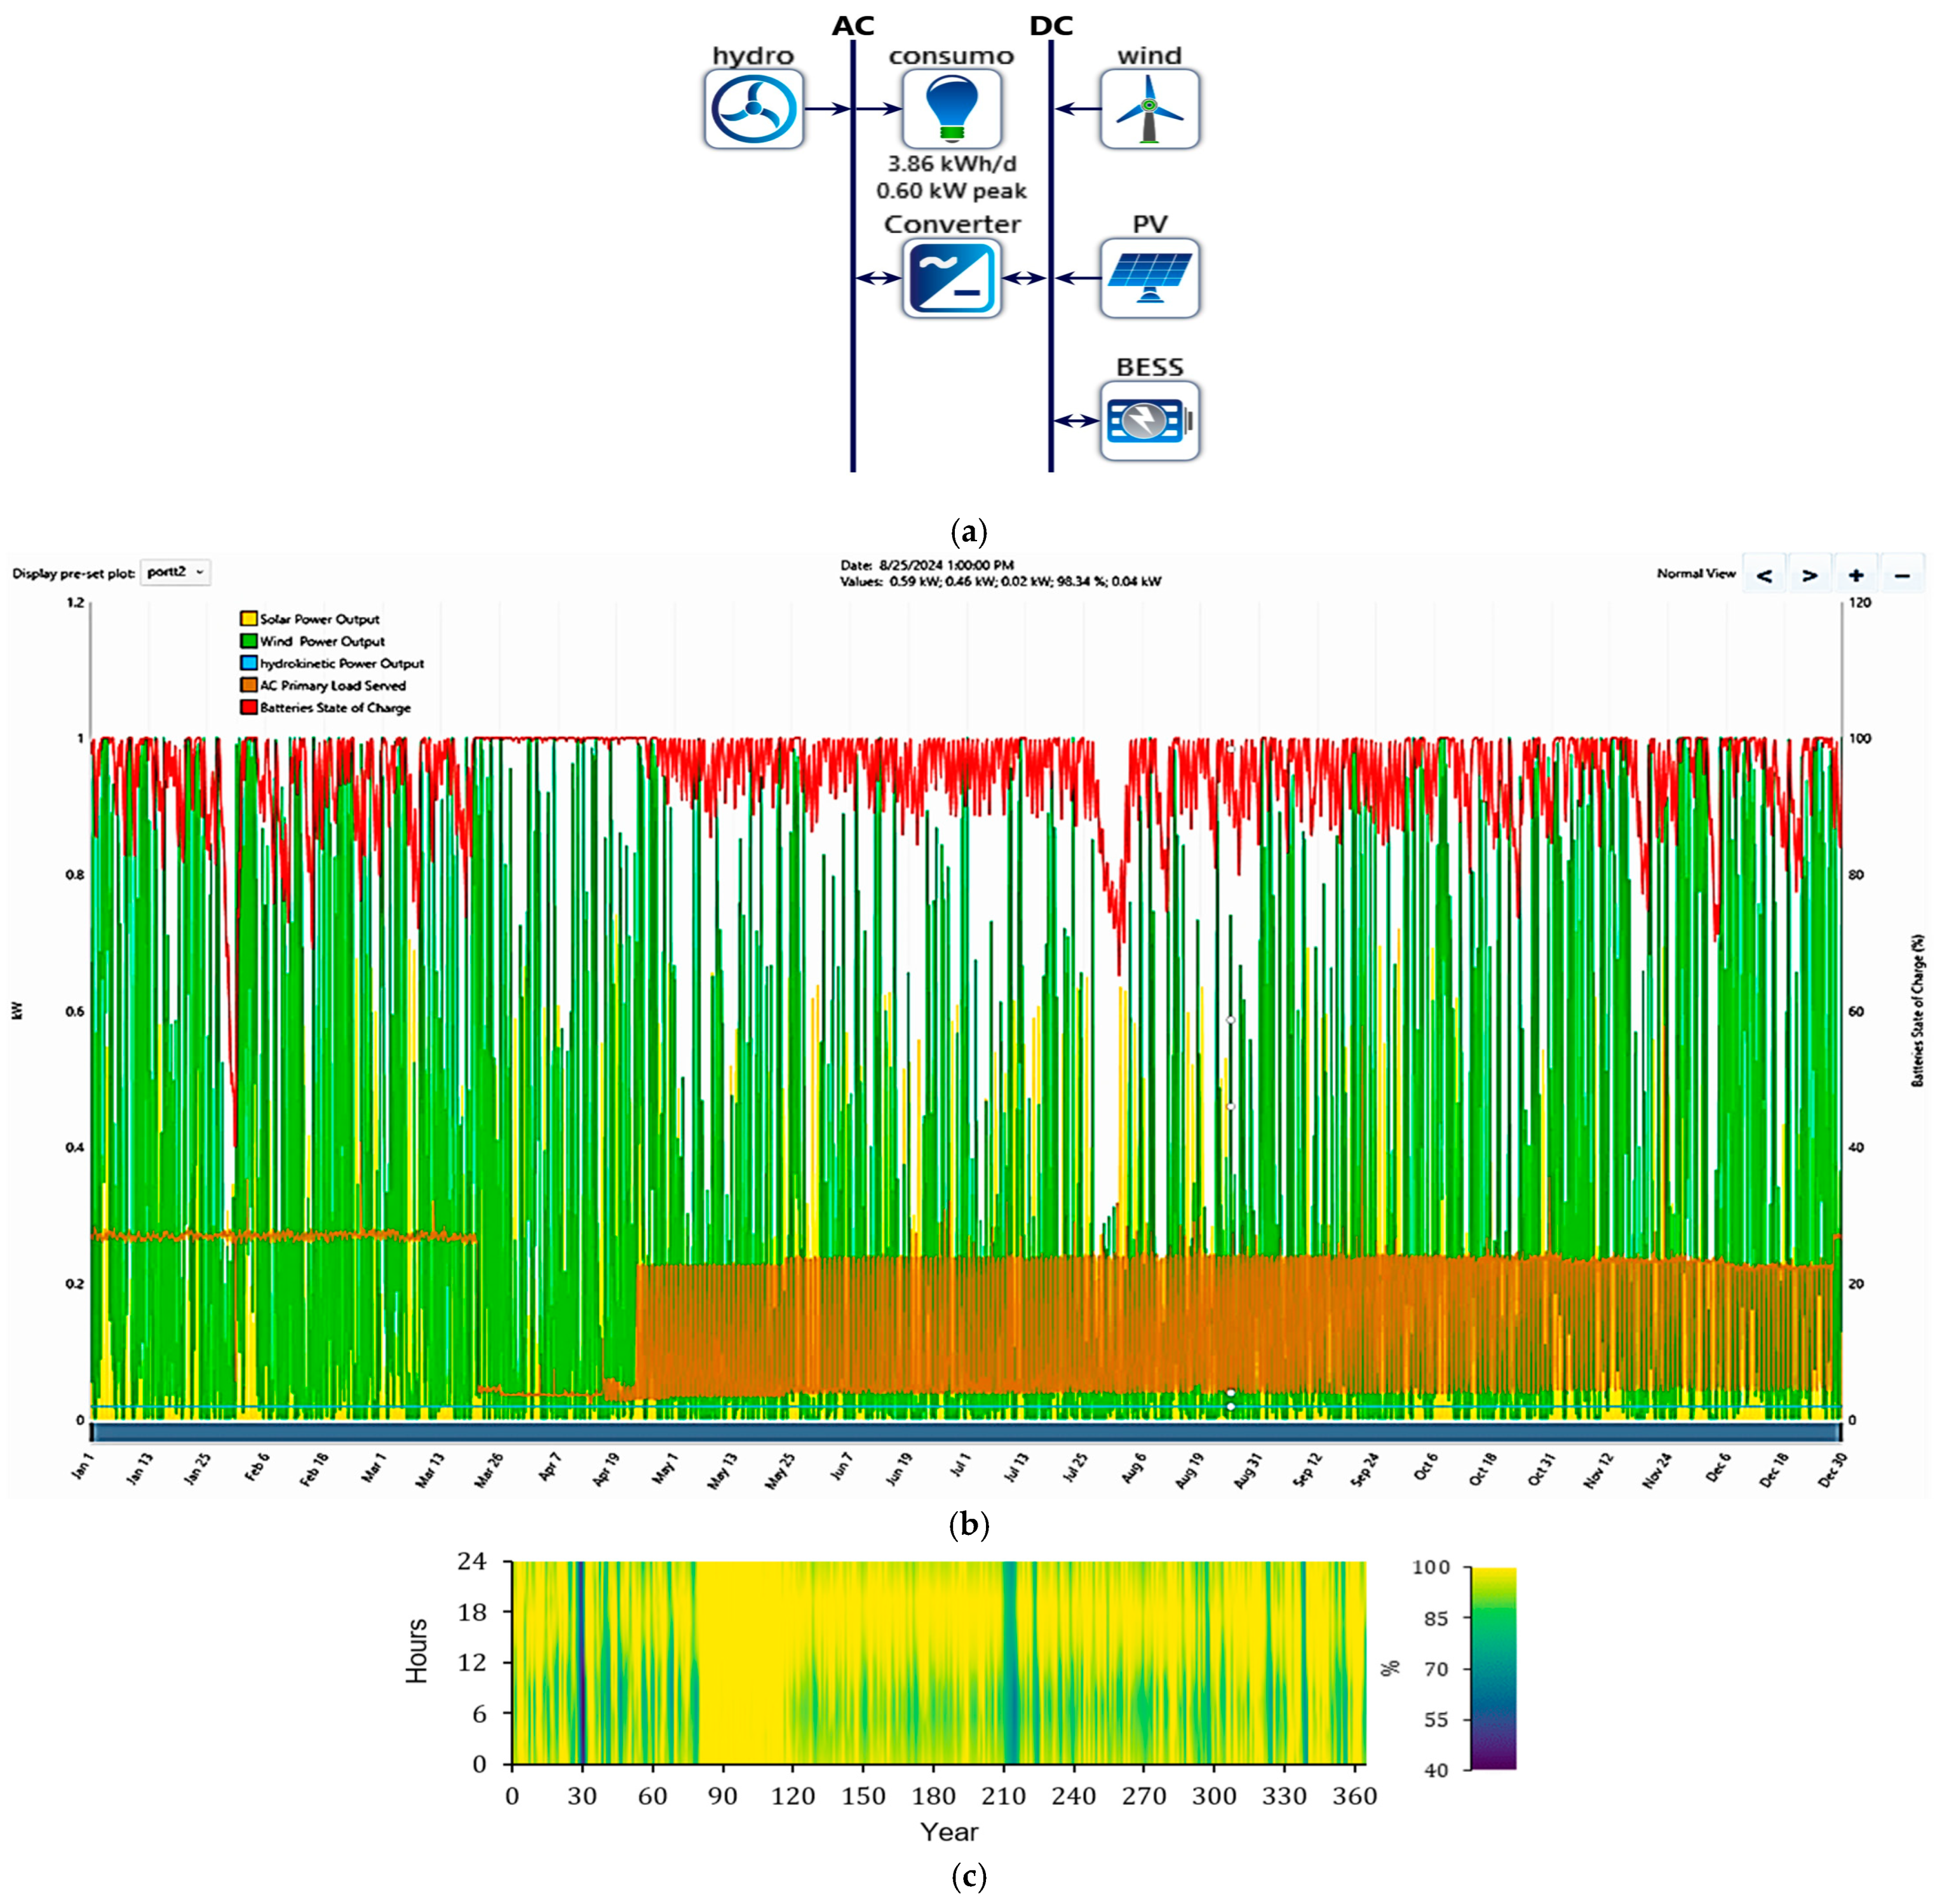
- Scenario 5—HY4RES Modeling: Solar, Wind, and Hydrokinetic Energy and BESS: This scenario used a battery storage system to store the excess renewable energy and ensure the energy needs when these were insufficient. The optimization required a battery capacity of 15 kWh to ensure 100% of the defined demand.
- Stored renewable excess = 609.8 kWh (23% of the total excess);
- Discharged energy from battery storage = 609.5 kWh (100% of the required amount to completely ensure the energy needs);
- Renewable excess not stored = 2071.4 kWh (77% of the total excess).
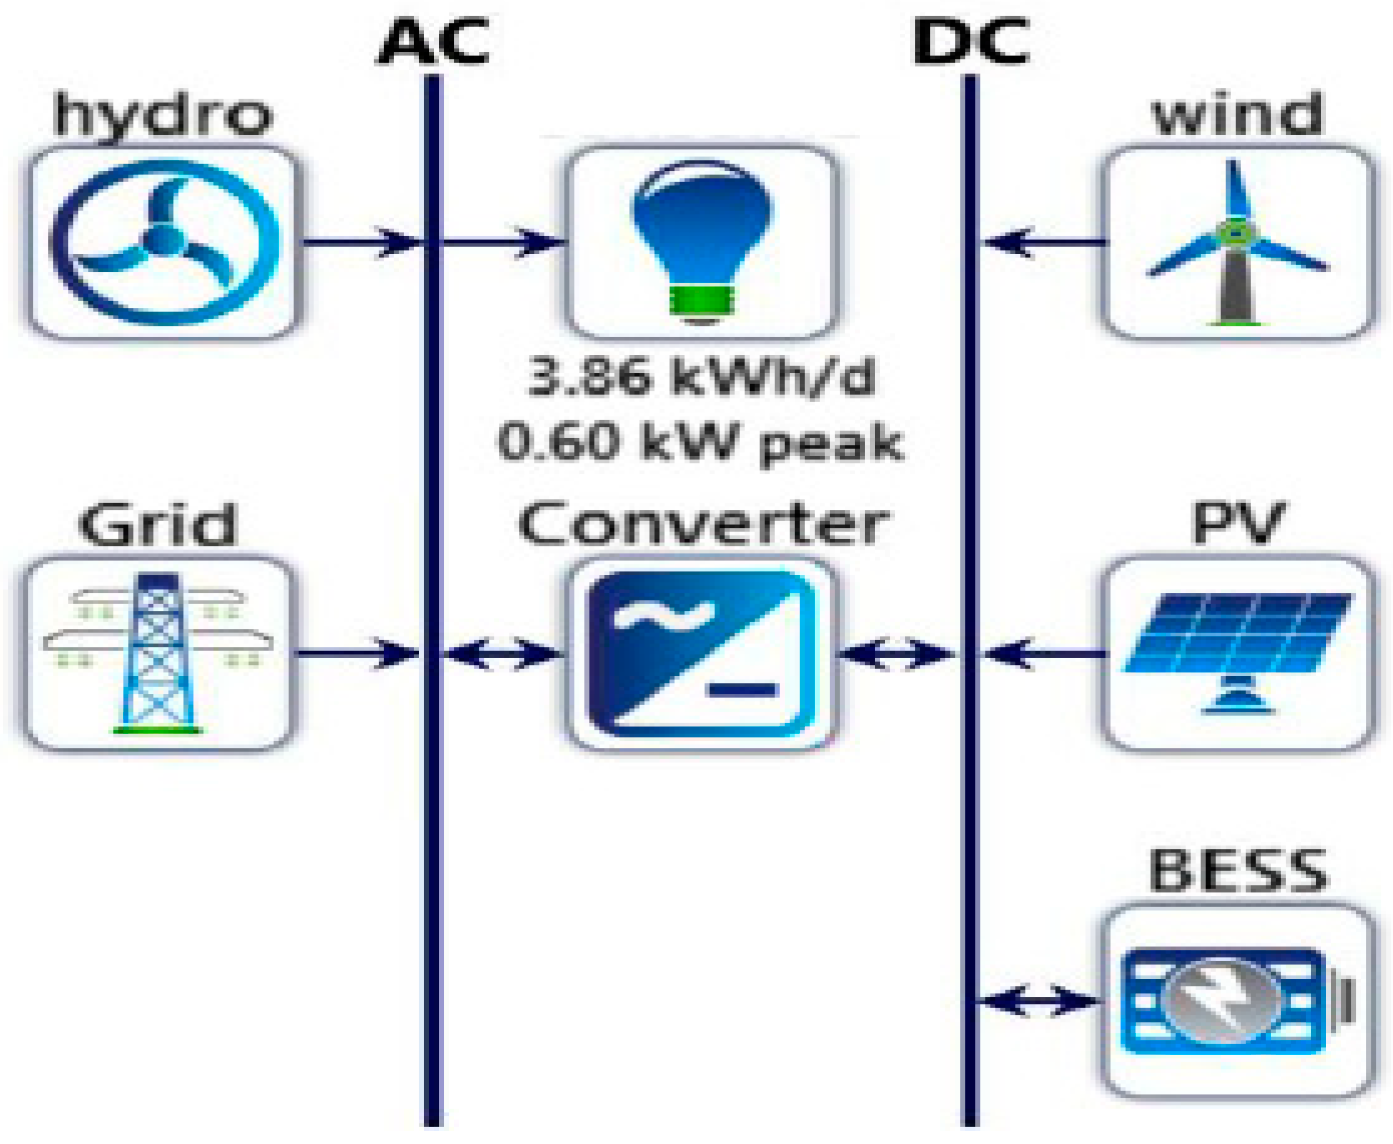
3.2.3. HOMER Modeling
- -
- Scenario 6—Solar, wind, and hydrokinetic energy and the electric grid;
- -
- Scenario 7—Solar, wind, and hydrokinetic energy and BESS (battery energy storage system), keeping in mind that the primary renewable sources were solar + wind + hydrokinetic in all scenarios.It was not able to use a micro-PAT component in the hybrid energy solution module simulation due to the minimum limit possible for this element’s implementation.
- Scenario 6—HOMER Modeling: Solar, Wind, and Hydrokinetic Energy and Electric Grid: According to the evaluation of Scenario 6 using HOMER® 3.16.2 Pro modeling, the amount of energy that needed to be purchased from the grid was calculated as approximately 546 kWh annually. This met the annual energy consumption of 1409 kWh, while 2385 kWh of energy was sold back to the grid. During certain periods of the year, due to increased energy demand, a grid connection was necessary to meet the energy needs in the scenarios without battery storage (Table 2 and Figure 17).
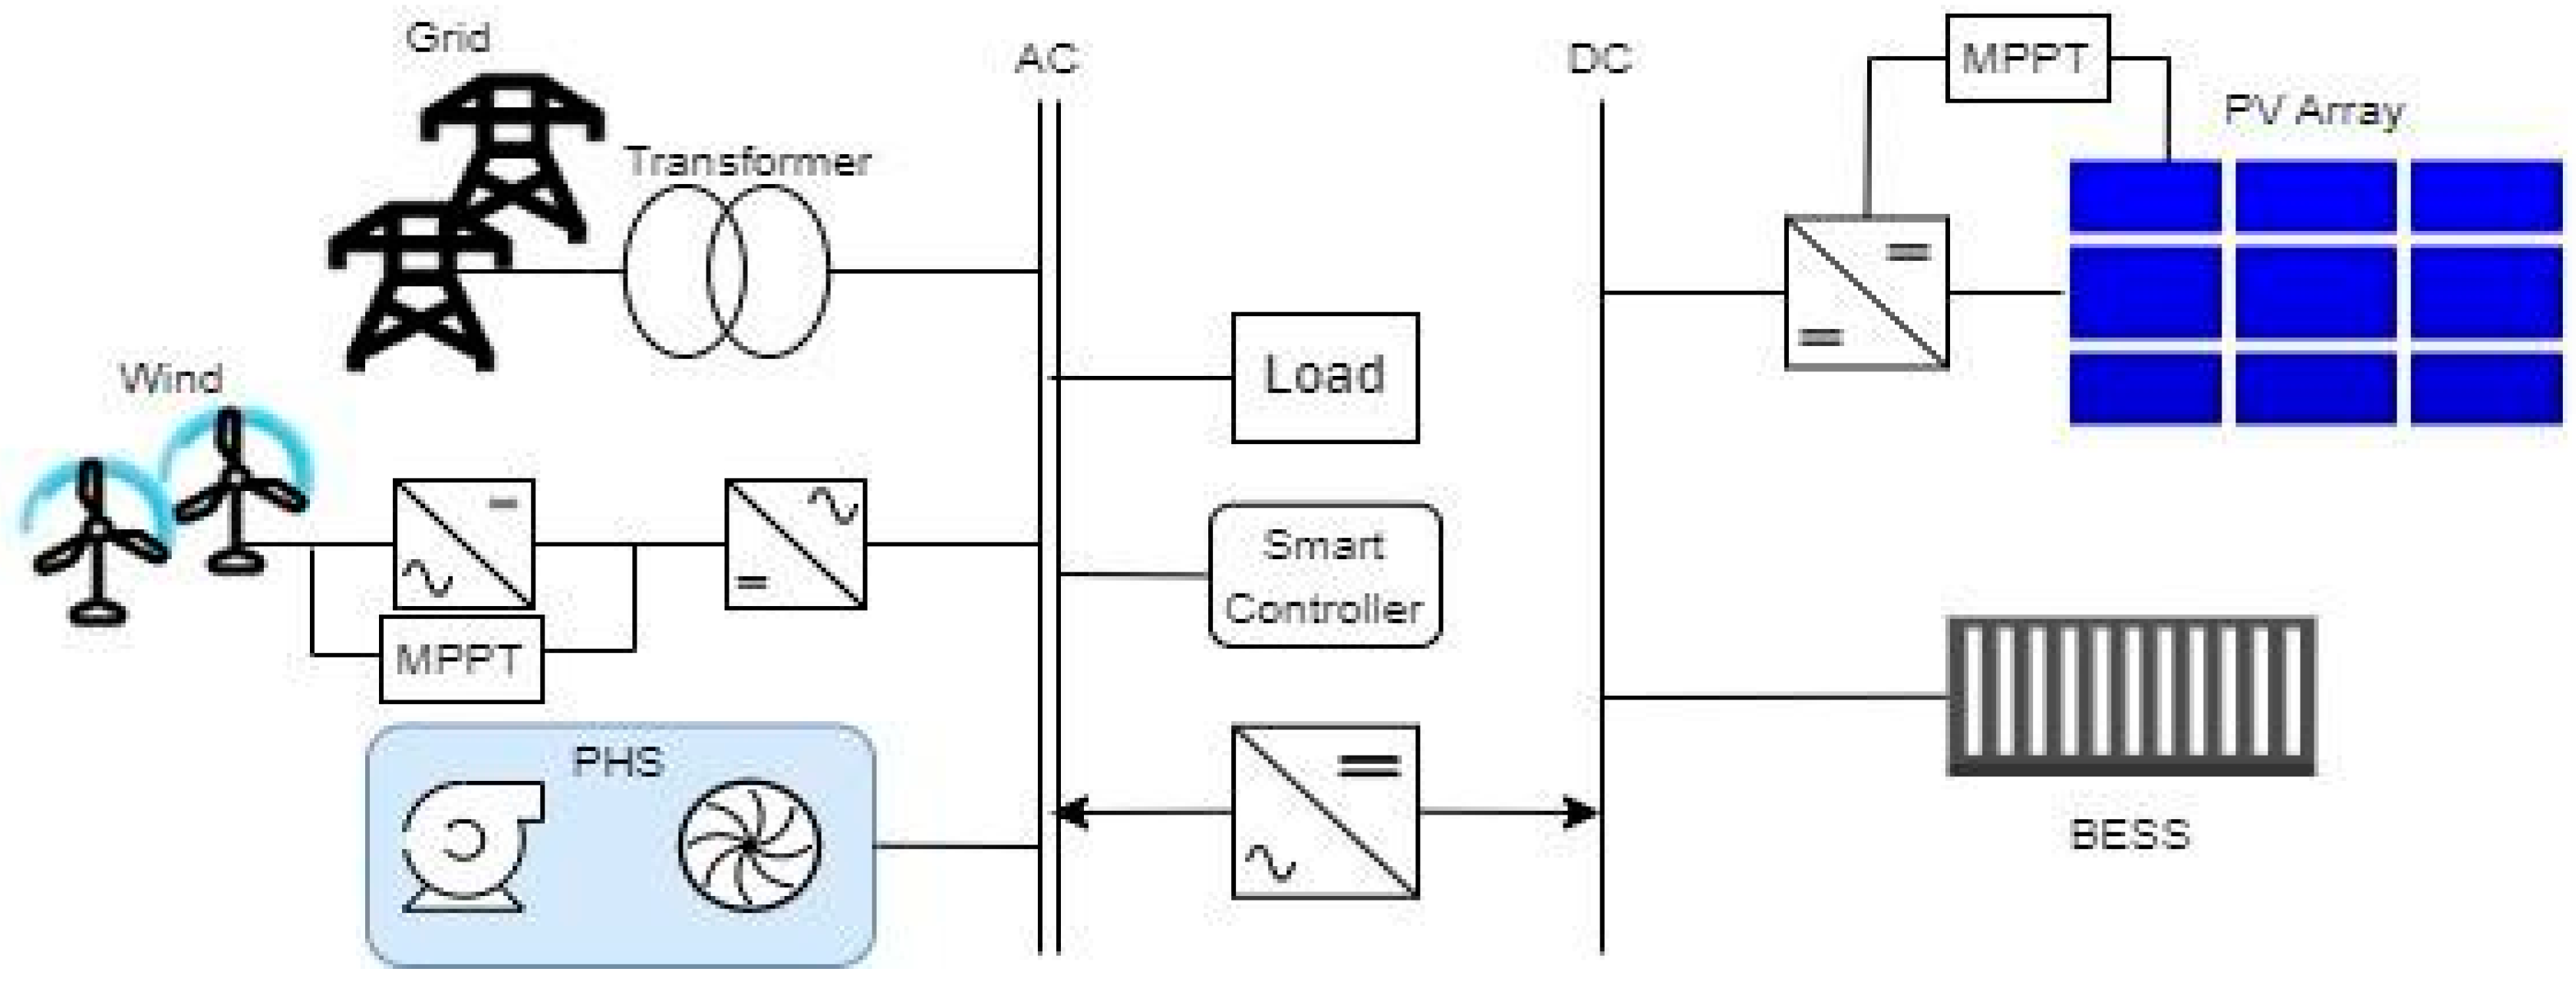
3.3. Converter and Controller
4. Modeling Skills and ML of Energy Balance
5. Conclusions
- Optimization of Renewable Energy Sources and Storage System Management—This step involved the strategic optimization of energy sources and storage systems using three distinct mathematical models: EMTv1 and HY4RES, both developed under the HY4RES research project, and HOMER® 3.16.2 Pro, a widely recognized commercial energy tool. Seven different scenarios (labeled from Sc1 to Sc7) were designed and analyzed based on the models’ capabilities in integrating energy components and managing storage systems.
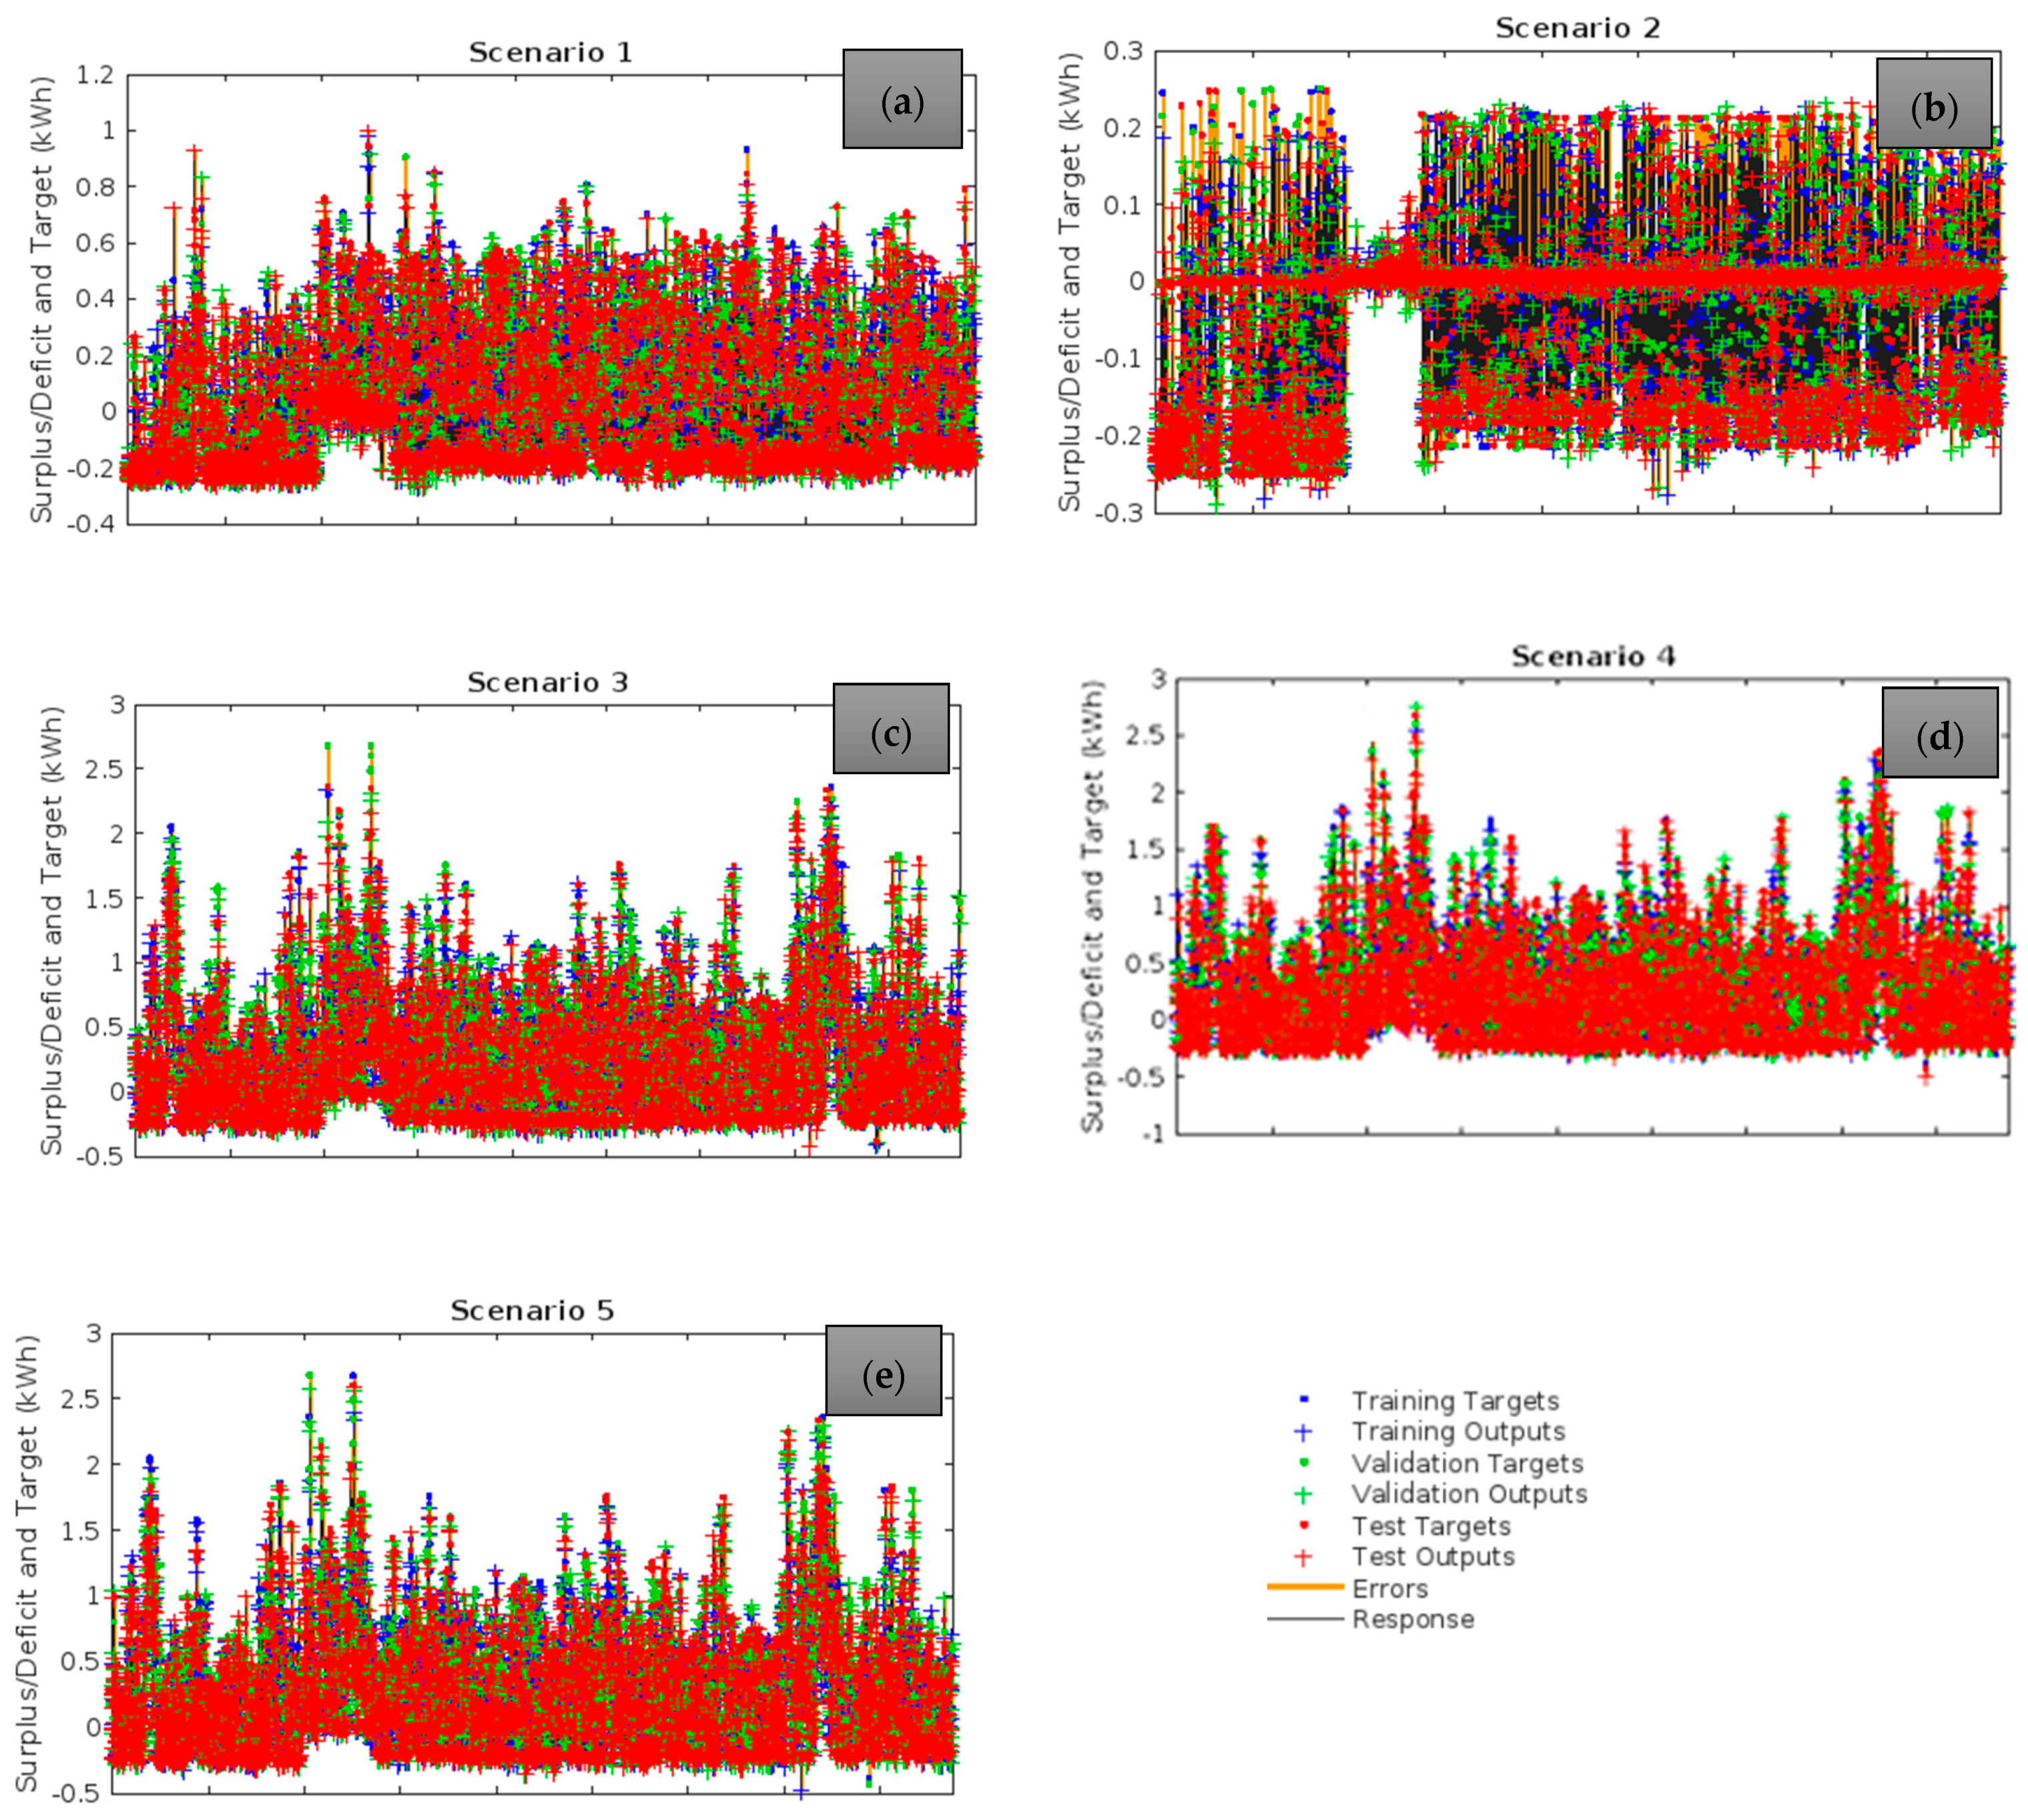
- Machine Learning-Based Energy Balance Prediction—This step focused on forecasting energy surplus and deficit through machine learning techniques. Predictions were conducted for five scenarios derived from the developed optimization models, enhancing the overall accuracy and reliability of energy management assessments.
Author Contributions
Funding
Data Availability Statement
Acknowledgments
Conflicts of Interest
Nomenclature
| Acronyms | |
| AC | Alternating Current |
| AI | Artificial Intelligence |
| ANN | Artificial Neural Network |
| BESS | Battery Energy Storage System |
| DC | Direct Current |
| DT | Digital Twin |
| EMT | Energy Management Tool |
| GIS | Geographic Information System |
| HES | Hybrid Energy System |
| HOMER | Hybrid Optimization of Multiple Energy Resources |
| HY4RES | Hybrid for Renewable Energy Solutions |
| IoT | Internet of Things |
| MRE | Marine Renewable Energy |
| MSE | Mean Square Error |
| NARX | Non-Linear Autoregressive Model Exogenous |
| NL-GRG | Non-Linear Generalized Reduced Gradient |
| NNTS | Neural Network Time Series |
| PAT | Pump-as-Turbine |
| PED | Positive Energy District |
| PERS | Port Environmental Review System |
| PHS | Pumped Hydropower Storage |
| PV | Photovoltaic |
| UWF | Urban Waterfront |
| Variables | |
| Batteries for energy needs [kWh] | |
| Feasible battery energy [kWh] | |
| COVDemand | Percentage of covered demand by the hybrid module [%] |
| E | Energy required (W) |
| Energy need [kWh] | |
| Energy deficit in [kWh] | |
| Energy surplus in [kWh] | |
| Energy need [kWh] | |
| Erevenues | Energy savings (kWh), |
| Derating factor of solar PV | |
| g | Gravity acceleration [9.81 m/s2] |
| Incident solar irradiance [kW/m2] | |
| Incident solar irradiance under standard test conditions [kW/m2] | |
| Effective head [m] | |
| H | Head (m) |
| H | Pump head [m] |
| Hi | Hydropower generated [kWh] |
| Required hydropower [kWh] | |
| Ht | Average turbine head [m] |
| N | Number of years |
| P | Installed power (kW) |
| Feasible renewable for pump [kWh] | |
| Hydro turbine power output [kW] | |
| Grid energy for pump [kWh] | |
| Output power of wind turbine under standard conditions [kW] | |
| Output power of wind turbine [kW] | |
| PN | Pump nominal power [kW] |
| PPV | PV power generated [kW] |
| Available renewable for pump [kWh] | |
| Hydro turbine flow rate [m3/s] | |
| R2 | Determination coefficient [-] |
| Si | Solar energy [kWh] |
| Renewable surplus [kWh] | |
| Tc | Cell temperature of solar PV [°C] |
| Tc,STC | Cell temperature at STC [25 °C] |
| Wind speed at the hub height of the wind turbine [m/s] | |
| Wind speed at the anemometer height [m/s] | |
| V | Storage water volume (m3), |
| Vmax | Maximum reservoir volume [m3] |
| Vmin | Minimum reservoir volume [m3] |
| Pumped volume [m3] | |
| Reservoir volume [m3] | |
| Previous reservoir volume [m3] | |
| Turbine volume [m3] | |
| Power output during standard test conditions [kW] | |
| Wi | Wind energy [kWh] |
| Surface roughness length [m] | |
| Hub height of the wind turbine [m] | |
| Anemometer height [m] | |
| Temperature coefficient of power | |
| α | Hydropower factor |
| β | Renewable factor |
| γ | Grid factor |
| ηt | Average turbine efficiency [%] |
| Efficiency of hydro turbine [%] | |
| Actual air density [kg/m3] | |
| Air density at STP, which is 1.225 [kg/m3] | |
| Water density, which is 1000 [kg/m3] | |
| Δt | Time step [h] |
References
- IEA. Empowering People—The Role of Local Energy Communities in Clean Energy Transitions; IEA: Paris, France, 2023. [Google Scholar]
- Directive, E.J.E.B. 2001 of the European Parliament and of the Council of 11 December 2018 on the Promotion of the Use of Energy from Renewable Sources; EU: Brussels, Belgium, 2018. [Google Scholar]
- Caramizaru, A.; Uihlein, A. Energy Communities—An Overview of Energy and Social Innovation; Publications Office of the European Union, JRC Publications Repository: Luxembourg, 2020. [Google Scholar]
- European Commission. Going Climate-Neutral by 2050: A Strategic Long-Term Vision for a Prosperous, Modern, Competitive and Climate-Neutral EU Economy. Directorate-General for Climate Action, European Commission. 2019. Available online: https://op.europa.eu/en/publication-detail/-/publication/92f6d5bc-76bc-11e9-9f05-01aa75ed71a1 (accessed on 3 January 2025).
- Fragkos, P.; Fragkiadakis, K.; Sovacool, B.; Paroussos, L.; Vrontisi, Z.; Charalampidis, I. Equity implications of climate policy: Assessing the social and distributional impacts of emission reduction targets in the European Union. Energy 2021, 237, 121591. [Google Scholar] [CrossRef]
- Alamoush, A.S.; Ballini, F.; Ölçer, A.I. ‘Ports’ Technical and Operational Measures to Reduce Greenhouse Gas Emission and Improve Energy Efficiency: A Review. Mar. Pollut. Bull. 2020, 160, 111508. [Google Scholar] [CrossRef] [PubMed]
- Can Ports Serve as Renewable Energy Hubs? Future Bridge NetZero Events. 2024. Available online: https://netzero-events.com/can-ports-serve-as-renewable-energy-hubs/ (accessed on 10 January 2025).
- Ramos, H.M.; Vargas, B.; Saldanha, J.R. New Integrated Energy Solution Idealization: Hybrid for Renewable Energy Network (Hy4REN). Energies 2022, 15, 3921. [Google Scholar] [CrossRef]
- Teng, F.; Zhang, Q.; Xiao, G.; Ban, Z.; Liang, Y.; Guan, Y. Energy Management for a Port Integrated Energy System Based on Distributed Dual Decomposition Mixed Integer Linear Programming. J. Mar. Sci. Eng. 2023, 11, 1137. [Google Scholar] [CrossRef]
- Xiong, C.; Su, Y.; Wang, H.; Zhang, D.; Xiong, B. Optimal distributed energy scheduling for port microgrid system considering the coupling of renewable energy and demand. Sustain. Energy Grids Netw. 2024, 39, 101506. Available online: https://www.elsevier.com/locate/segan (accessed on 29 April 2025). [CrossRef]
- Psaraftis, H.N.; Zis, T. Shipping decarbonization and green ports. Marit. Transp. Res. 2022, 3, 100068. [Google Scholar] [CrossRef]
- Buonomano, A.; Del Papa, G.; Giuzio, G.F.; Maka, R.; Palombo, A. Advancing sustainability in the maritime sector: Energy design and optimization of large ships through information modelling and dynamic simulation. Appl. Therm. Eng. 2023, 235, 121359. [Google Scholar] [CrossRef]
- Barone, G.; Buonomano, A.; Del Papa, G.; Maka, R.; Palombo, A. How to achieve energy efficiency and sustainability of large ships: A new tool to optimize the operation of on-board diesel generators. Energy 2023, 282, 128288. [Google Scholar] [CrossRef]
- Damman, S.; Steen, M. A socio-technical perspective on the scope for ports to enable energy transition. Transp. Res. Part D Transp. Environ. 2021, 91, 102691. [Google Scholar] [CrossRef]
- Buonomano, A.; Del Papa, G.; Giuzio, G.F.; Palombo, A.; Russo, G. Future pathways for decarbonization and energy efficiency of ports: Modelling and optimization as sustainable energy hubs. J. Clean. Prod. 2023, 420, 138389. [Google Scholar] [CrossRef]
- Hoang, A.T.; Foley, A.M.; Nižetić, S.; Huang, Z.; Ong, H.C.; Ölçer, A.I.; Pham, V.V.; Phuong, X. Nguyen Energy-related approach for reduction of CO2 emissions: A critical strategy on the port-to-ship pathway. J. Clean. Prod. 2022, 355, 131772. [Google Scholar] [CrossRef]
- Nyeche, E.N.; Diemuodeke, E.O. Modelling and optimisation of a hybrid PV-wind turbine-pumped hydro storage energy system for mini-grid application in coastline communities. J. Clean. Prod. 2020, 250, 119578. [Google Scholar] [CrossRef]
- Klar, R.; Fredriksson, A.; Angelakis, V. Digital Twins for Ports: Derived From Smart City and Supply Chain Twinning Experience. IEEE Access 2023, 11, 71777–71799. [Google Scholar] [CrossRef]
- Xu, H.; Liu, J.; Xu, X.; Chen, J.; Yue, X. The impact of AI technology adoption on operational decision-making in competitive heterogeneous ports. Transp. Res. Part E: Logist. Transp. Rev. 2024, 183, 103428. [Google Scholar] [CrossRef]
- Masood Ahmad, M.; Kumar, A.; Ranjan, R. Recent Developments of Tidal Energy as Renewable Energy: An Overview. In River and Coastal Engineering; Jha, R., Singh, V.P., Singh, V., Roy, L., Thendiyath, R., Eds.; Water Science and Technology Library; Springer: Cham, Switzerland, 2022; Volume 117. [Google Scholar] [CrossRef]
- Su, Z.; Liu, Y.; Gao, Y.; Park, K.-S.; Su, M. Critical Success Factors for Green Port Transformation Using Digital Technology. J. Mar. Sci. Eng. 2024, 12, 2128. [Google Scholar] [CrossRef]
- Jia, X.; Cui, Y. Examining interrelationships of barriers in the evolution of maritime port smartification from a systematic perspective. Transp. Policy 2021, 114, 49–58. [Google Scholar] [CrossRef]
- Acciaro, M.; Ghiara, H.; Cusano, M.I. Energy management in seaports: A new role for port authorities. Energy Policy 2014, 71, 4–12. [Google Scholar] [CrossRef]
- Barone, G.; Buonomano, A.; Forzano, C.; Giuzio, G.F.; Palombo, A. Improving the Efficiency of Maritime Infrastructures through a BIM-Based Building Energy Modelling Approach: A Case Study in Naples, Italy. Energies 2021, 14, 4854. [Google Scholar] [CrossRef]
- Østergaard, P.A.; Duic, N.; Noorollahi, Y.; Mikulcic, H.; Kalogirou, S. Sustainable development using renewable energy technology. Renew Energy 2020, 146, 2430–2437. [Google Scholar] [CrossRef]
- Pivetta, D.; Volpato, G.; Carraro, G.; Dall’Armi, C.; Da Lio, L.; Lazzaretto, A.; Taccani, R. Optimal decarbonization strategies for an industrial port area by using hydrogen as energy carrier. Int. J. Hydrogen Energy 2023, 52, 1084–1103. [Google Scholar] [CrossRef]
- Barone, G.; Buonomano, A.; Forzano, C.; Palombo, A. Implementing the dynamic simulation approach for the design and optimization of ships energy systems: Methodology and applicability to modern cruise ships. Renew. Sustain. Energy Rev. 2021, 150, 111488. [Google Scholar] [CrossRef]
- Abu Bakar, N.N.; Bazmohammadi, N.; Vasquez, J.C.; Guerrero, J.M. Electrification of onshore power systems in maritime transportation towards decarbonization of ports: A review of the cold ironing technology. Renew. Sustain. Energy Rev. 2023, 178, 113243. [Google Scholar] [CrossRef]
- Aparisi-Cerd’a, I.; Ribó-Pérez, D.; Cuesta-Fernandez, I.; Gómez-Navarro, T. Planning positive energy districts in urban water fronts: Approach to La Marina de Valencia. Spain Energy Convers. Manag. 2022, 265, 115795. [Google Scholar] [CrossRef]
- Agostinelli, S.; Neshat, M.; Majidi Nezhad, M.; Piras, G.; Astiaso Garcia, D. Integrating Renewable Energy Sources in Italian Port Areas towards Renewable Energy Communities. Sustainability 2022, 14, 13720. [Google Scholar] [CrossRef]
- Vidal, T.A. Modelling and optimization of a hybrid renewable energy system for Puerto de Avilés, Spain, Project in Energy Engineering and Management II, MEGE, IST, 2025. Available online: https://fenix.tecnico.ulisboa.pt/cursos/mege/dissertacao/846778572214890 (accessed on 10 January 2025).
- Coelho, J.S.T.; van de Loo, M.; Díaz, J.A.R.; Coronado-Hernández, O.E.; Perez-Sanchez, M.; Ramos, H.M. Multi-Objective and Multi-Variable Optimization Models of Hybrid Renewable Energy Solutions for Water–Energy Nexus. Water 2024, 16, 2360. [Google Scholar] [CrossRef]
- Coehlo, J.S.; Alves, A.B.; Morillo, J.G.; Coronado-Hernández, O.E.; Perez-Sanchez, M.; Ramos, H.M. Hybrid Energy Solution to Improve Irrigation Systems: HY4RES vs. HOMER Optimization Models. Energies 2024, 17, 4037. [Google Scholar] [CrossRef]
- Guruprasad, P.S.M.; Quaranta, E.; Coronado-Hernández, O.E.; Ramos, H.M. Hydropower Advantages over Batteries in Energy Storage of Off-Grid Systems: A Case Study. Energies 2023, 16, 6309. [Google Scholar] [CrossRef]


| PV Solar | Hydrokinetic |
| Installed power of solar panels, 405 W/panel | Area swept by turbine, 0.28 m2 |
| Number of solar panels, 2 panels | Number of wind turbines, 2 turbines |
| Average solar irradiation in Avilés, 3 kWh/m2/day | Average water velocity in river, 0.7 m/s |
| System efficiency, 80% | System efficiency, 20% |
| Days of operation, 292 (80% of year) | Days of operation, 292 (80% of year) |
| Wind | PAT |
| Installed power of wind turbine, 800 W/turbine | Power of PAT system, 200 W |
| Number of wind turbines, 3 turbines | Maximum flow rate, 11 ls |
| Area swept by turbine, 0.45 m2 | Average head, 3 to 5 m |
| Average wind potential, 250 W/m2 | Average efficiency, 62% |
| System efficiency, 20% | Days of operation, 292 (80% of year) |
| Days of operation, 292 (80% of year) |
| Component | Production (kWh/yr) | % | Component | Consumption (kWh/yr) | % |
|---|---|---|---|---|---|
| Solar PV | 904 | 22.6 | AC Primary Load | 1409 | 37.1 |
| Wind Turbines | 2380 | 59.5 | DC Primary Load | 0 | 0 |
| Hydrokinetic Turbine | 166 | 4.16 | Deferrable Load | 0 | 0 |
| Grid Purchases | 546 | 13.7 | Grid Sales | 2385 | 62.9 |
| Total | 3997 | 100 | Total | 3794 | 100 |
| Component | Production (kWh/yr) | % | Component | Consumption (kWh/yr) | % |
|---|---|---|---|---|---|
| Solar PV | 904 | 26.2 | AC Primary Load | 1409 | 100 |
| Wind Turbines | 2380 | 69.0 | DC Primary Load | 0 | 0 |
| Hydrokinetic Turbine | 166 | 4.82 | Deferrable Load | 0 | 0 |
| Total | 3450 | 100 | Total | 1409 | 100 |
| Type of Modeling | Simulated Scenarios | Input of Primary Renewable Sources (PV, Wind) Database | Energy Balance of Primary Sources | Combination of Energy Demand from Different Sectors | Water Allocation Need | Storage Capacity and PHS Unlimited Power | BESS | Complete Optimization Strategic Operation | Less Time-Consuming | Economic Analysis | Environmental Analysis |
|---|---|---|---|---|---|---|---|---|---|---|---|
| EMT—v1 (Research development) | 1 and 2 | Need input data | √ | √ | Not prepared | √ | Not yet | √ | √ | √ | |
| HY4RES (GRG and Python) (Research development) | 3, 4, and 5 | Need input data | √ | √ | √ | √ | √ | √ | √ Not valid for Python version | √ | √ |
| HOMER® 3.16.2 Pro (Commercial) | 6 and 7 | √ | √ | √ | No | Not prepared for micro | √ | √ | √ | √ | √ |
| Energy Needs Reliability (%) | Sc1 | Sc2 | Sc3 | Sc4 | Sc5 | Sc6 | Sc7 |
|---|---|---|---|---|---|---|---|
| EMTv1 | 60 | 60 | |||||
| HY4RES | 72 | 72 | 100 | ||||
| HOMER® 3.16.2 | 63 | ~100 |
| Scenario | Training | Validation | Testing | |||
|---|---|---|---|---|---|---|
| MSE (kWh) | R2 | MSE (kWh) | R2 | MSE (kWh) | R2 | |
| 1 | 0.0036 | 0.9677 | 0.0048 | 09594 | 0.0035 | 0.9716 |
| 2 | 0.0015 | 0.9350 | 0.0018 | 0.9253 | 0.0016 | 0.9287 |
| 3 | 0.0150 | 0.9666 | 0.0156 | 0.9657 | 0.0138 | 0.9660 |
| 4 | 0.0148 | 0.9663 | 0.0150 | 0.9654 | 0.0156 | 0.9665 |
| 5 | 0.0151 | 0.9650 | 0.0147 | 0.9695 | 0.0147 | 0.9678 |
| Scenario | Validation | Test | ||
|---|---|---|---|---|
| MSE (kWh) | R2 | MSE (kWh) | R2 | |
| 1 | 0.0037 | 0.9655 | 0.0043 | 0.9651 |
| 2 | 0.0017 | 0.9289 | 0.0015 | 0.9353 |
| 3 | 0.0166 | 0.9637 | 0.0142 | 0.9671 |
| 4 | 0.0150 | 0.9674 | 0.0167 | 0.9622 |
| 5 | 0.0141 | 0.9693 | 0.0163 | 0.9617 |
Disclaimer/Publisher’s Note: The statements, opinions and data contained in all publications are solely those of the individual author(s) and contributor(s) and not of MDPI and/or the editor(s). MDPI and/or the editor(s) disclaim responsibility for any injury to people or property resulting from any ideas, methods, instructions or products referred to in the content. |
© 2025 by the authors. Licensee MDPI, Basel, Switzerland. This article is an open access article distributed under the terms and conditions of the Creative Commons Attribution (CC BY) license (https://creativecommons.org/licenses/by/4.0/).
Share and Cite
Ramos, H.M.; Coelho, J.S.T.; Bekci, E.; Adrover, T.X.; Coronado-Hernández, O.E.; Perez-Sanchez, M.; Koca, K.; McNabola, A.; Espina-Valdés, R. Optimization and Machine Learning in Modeling Approaches to Hybrid Energy Balance to Improve Ports’ Efficiency. Appl. Sci. 2025, 15, 5211. https://doi.org/10.3390/app15095211
Ramos HM, Coelho JST, Bekci E, Adrover TX, Coronado-Hernández OE, Perez-Sanchez M, Koca K, McNabola A, Espina-Valdés R. Optimization and Machine Learning in Modeling Approaches to Hybrid Energy Balance to Improve Ports’ Efficiency. Applied Sciences. 2025; 15(9):5211. https://doi.org/10.3390/app15095211
Chicago/Turabian StyleRamos, Helena M., João S. T. Coelho, Eyup Bekci, Toni X. Adrover, Oscar E. Coronado-Hernández, Modesto Perez-Sanchez, Kemal Koca, Aonghus McNabola, and R. Espina-Valdés. 2025. "Optimization and Machine Learning in Modeling Approaches to Hybrid Energy Balance to Improve Ports’ Efficiency" Applied Sciences 15, no. 9: 5211. https://doi.org/10.3390/app15095211
APA StyleRamos, H. M., Coelho, J. S. T., Bekci, E., Adrover, T. X., Coronado-Hernández, O. E., Perez-Sanchez, M., Koca, K., McNabola, A., & Espina-Valdés, R. (2025). Optimization and Machine Learning in Modeling Approaches to Hybrid Energy Balance to Improve Ports’ Efficiency. Applied Sciences, 15(9), 5211. https://doi.org/10.3390/app15095211