1. Introduction
F-T cycling, an intense physical weathering process in nature [
1], alters soil’s granular skeleton and spatial architecture through water phase transitions, thereby modifying its physico-mechanical properties [
2,
3,
4,
5]. Over half of China’s landmass lies within seasonally frozen regions [
6,
7], with the Loess Plateau being nearly entirely subjected to these cyclic effects [
8,
9,
10]. Beneath the Quaternary loess deposits, a well-preserved Neogene Hipparion laterite stratum (termed Northern Red Clay) predominates across the Loess Plateau and adjacent areas [
11,
12]. Composed predominantly of montmorillonite and illite clay minerals, this hydro-sensitive material [
13,
14,
15] undergoes swelling-induced strength reduction upon hydration, critically governing loess landslide and collapse mechanisms [
16]. Investigating F-T impacts on its mechanical behavior therefore carries critical implications for geohazard mitigation in these vulnerable terrains.
Recent climate change and infrastructure expansion in cold regions have heightened research interest in F-T mechanisms affecting soil mechanics and geotechnical stability [
17,
18,
19]. F-T processes fundamentally reconfigure soil systems through multidimensional modifications: (1) granular rearrangement and pore structure evolution, (2) physicochemical property transformations, (3) mechanical parameter degradation. These alterations collectively drive significant variations in soil strength, compressibility, and long-term stability. Soil mechanical responses under cryogenic conditions are governed by a complex interplay of intrinsic and extrinsic factors, including but not limited to moisture content and phase transition dynamics, thermal gradients and F-T cycle frequency, porosity and pore size distribution heterogeneity, particle size gradation and mineralogical composition, confinement stress regimes (e.g., overburden pressure), soil fabric architecture, and diagenetic history [
20,
21,
22,
23]. Contemporary consensus identifies F-T cycling as the primary causative agent of progressive mechanical deterioration in cold-region soils [
24]. Experimental studies have demonstrated that the initial F-T cycle induces the most pronounced reduction in soil strength [
25,
26,
27], with significant divergence observed in stress–strain curves after three cycles, transitioning from pronounced strain-softening to moderate softening behavior [
28]. Progressive mechanical degradation occurs with increasing F-T cycles [
29], exemplified by reductions of 85% in unconfined compressive strength and 92% in elastic modulus after seven cycles [
30]. Shear strength parameters exhibit distinct deterioration patterns: subgrade clay experiences a rapid cohesion loss within the first few cycles [
31], sulfate-rich saline soils show abrupt declines in internal friction angle between cycles 9~20, with cohesion reaching minima post-20 cycles [
32], while chloride-dominated saline soils exhibit cohesion and internal friction angle reductions of 54.4–71.4% and 28.3–29.6%, respectively, after 30 cycles [
33]. These trends confirm that sustained F-T cycling systematically weakens soil strength and stiffness [
10,
24,
34], markedly reducing peak and residual strengths through microstructural alterations, including pore proliferation, particle rearrangement, and microcrack propagation. Consequently, elucidating the microstructural evolution under F-T cycling is imperative for understanding the fundamental mechanisms driving this macroscopic mechanical degradation [
35,
36,
37,
38,
39,
40].
F-T cycling profoundly reshapes soil microstructural porosity through mechanisms including phase transitions of pore water, ice crystal growth, and thermal stress generation, consequently altering the soil’s physical and mechanical properties [
41]. The degradation of soil mechanical behavior arises primarily from microstructural damage induced by cryogenic processes [
42,
43,
44]. Recent advances in F-T research have shifted from single-scale analyses of particle arrangements or pore morphology to multiscale frameworks integrating macro-scale physical, hydraulic, and mechanical properties with microstructural characterization techniques [
45]. Contemporary investigations emphasize the coupled effects of multiple factors—such as cycle frequency, moisture content, and particle gradation—on pore structure regulation, elucidating the dynamic evolution of multiscale pore networks [
46]. Emerging approaches employ constitutive models [
47] complemented by numerical simulations [
48] to predict microstructural alterations under cyclic F-T conditions, advancing mechanistic understanding of cryogenic weathering in geomaterials. Experimental studies demonstrate that F-T cycling induces coarse particle fragmentation and fine particle aggregation in soils [
49,
50,
51]. Paralleling mechanical property degradation, the initial F-T cycle exerts the most pronounced impact on pore structure [
52], with subsequent cycles progressively reducing particle size and increasing porosity [
53,
54,
55,
56,
57]. This manifests as a decrease in gel micropores (<10 nm), accompanied by proportional increases in capillary pores (10–5000 nm) and macropores (>5000 nm) [
58]. Microporosity diminishes while meso- and macroporosity expand [
59], transforming initially dense, low-porosity aggregates into porous, interconnected frameworks [
38]—microstructural alterations that directly mirror macroscopic strength deterioration [
60]. During freezing, pore water crystallization weakens interparticle cementation, destabilizes aggregates, and enlarges intergranular voids [
61]. Thawing generates frost-heave cracks on aggregate surfaces, temporarily reducing pore spacing; however, the irreversible nature of F-T damage prevents structural recovery to the initial state, perpetuating mechanical degradation [
62,
63]. Prolonged cycling ultimately loosens soil fabrics, inducing significant structural weakening exacerbated by elevated moisture content [
64,
65,
66,
67]. These findings underscore the critical role of cryogenic microstructural evolution in governing the hydro-mechanical deterioration of seasonally frozen soils.
Although numerous domestic and international studies have investigated F-T-induced degradation mechanisms in rock masses, loess, and conventional red clays, research specifically targeting the F-T damage evolution of northern Hipparion red soil remains scarce. Critical knowledge gaps persist regarding the quantitative relationship between F-T cycle frequency and the characteristic mechanical strength deterioration patterns (e.g., cohesion decrease rate, internal friction angle reduction), as well as the coupled evolution of micropore structure reorganization. Furthermore, the intrinsic multiscale response mechanisms linking macroscopic strength degradation to microscale structural alterations in this unique Neogene deposit require systematic exploration.
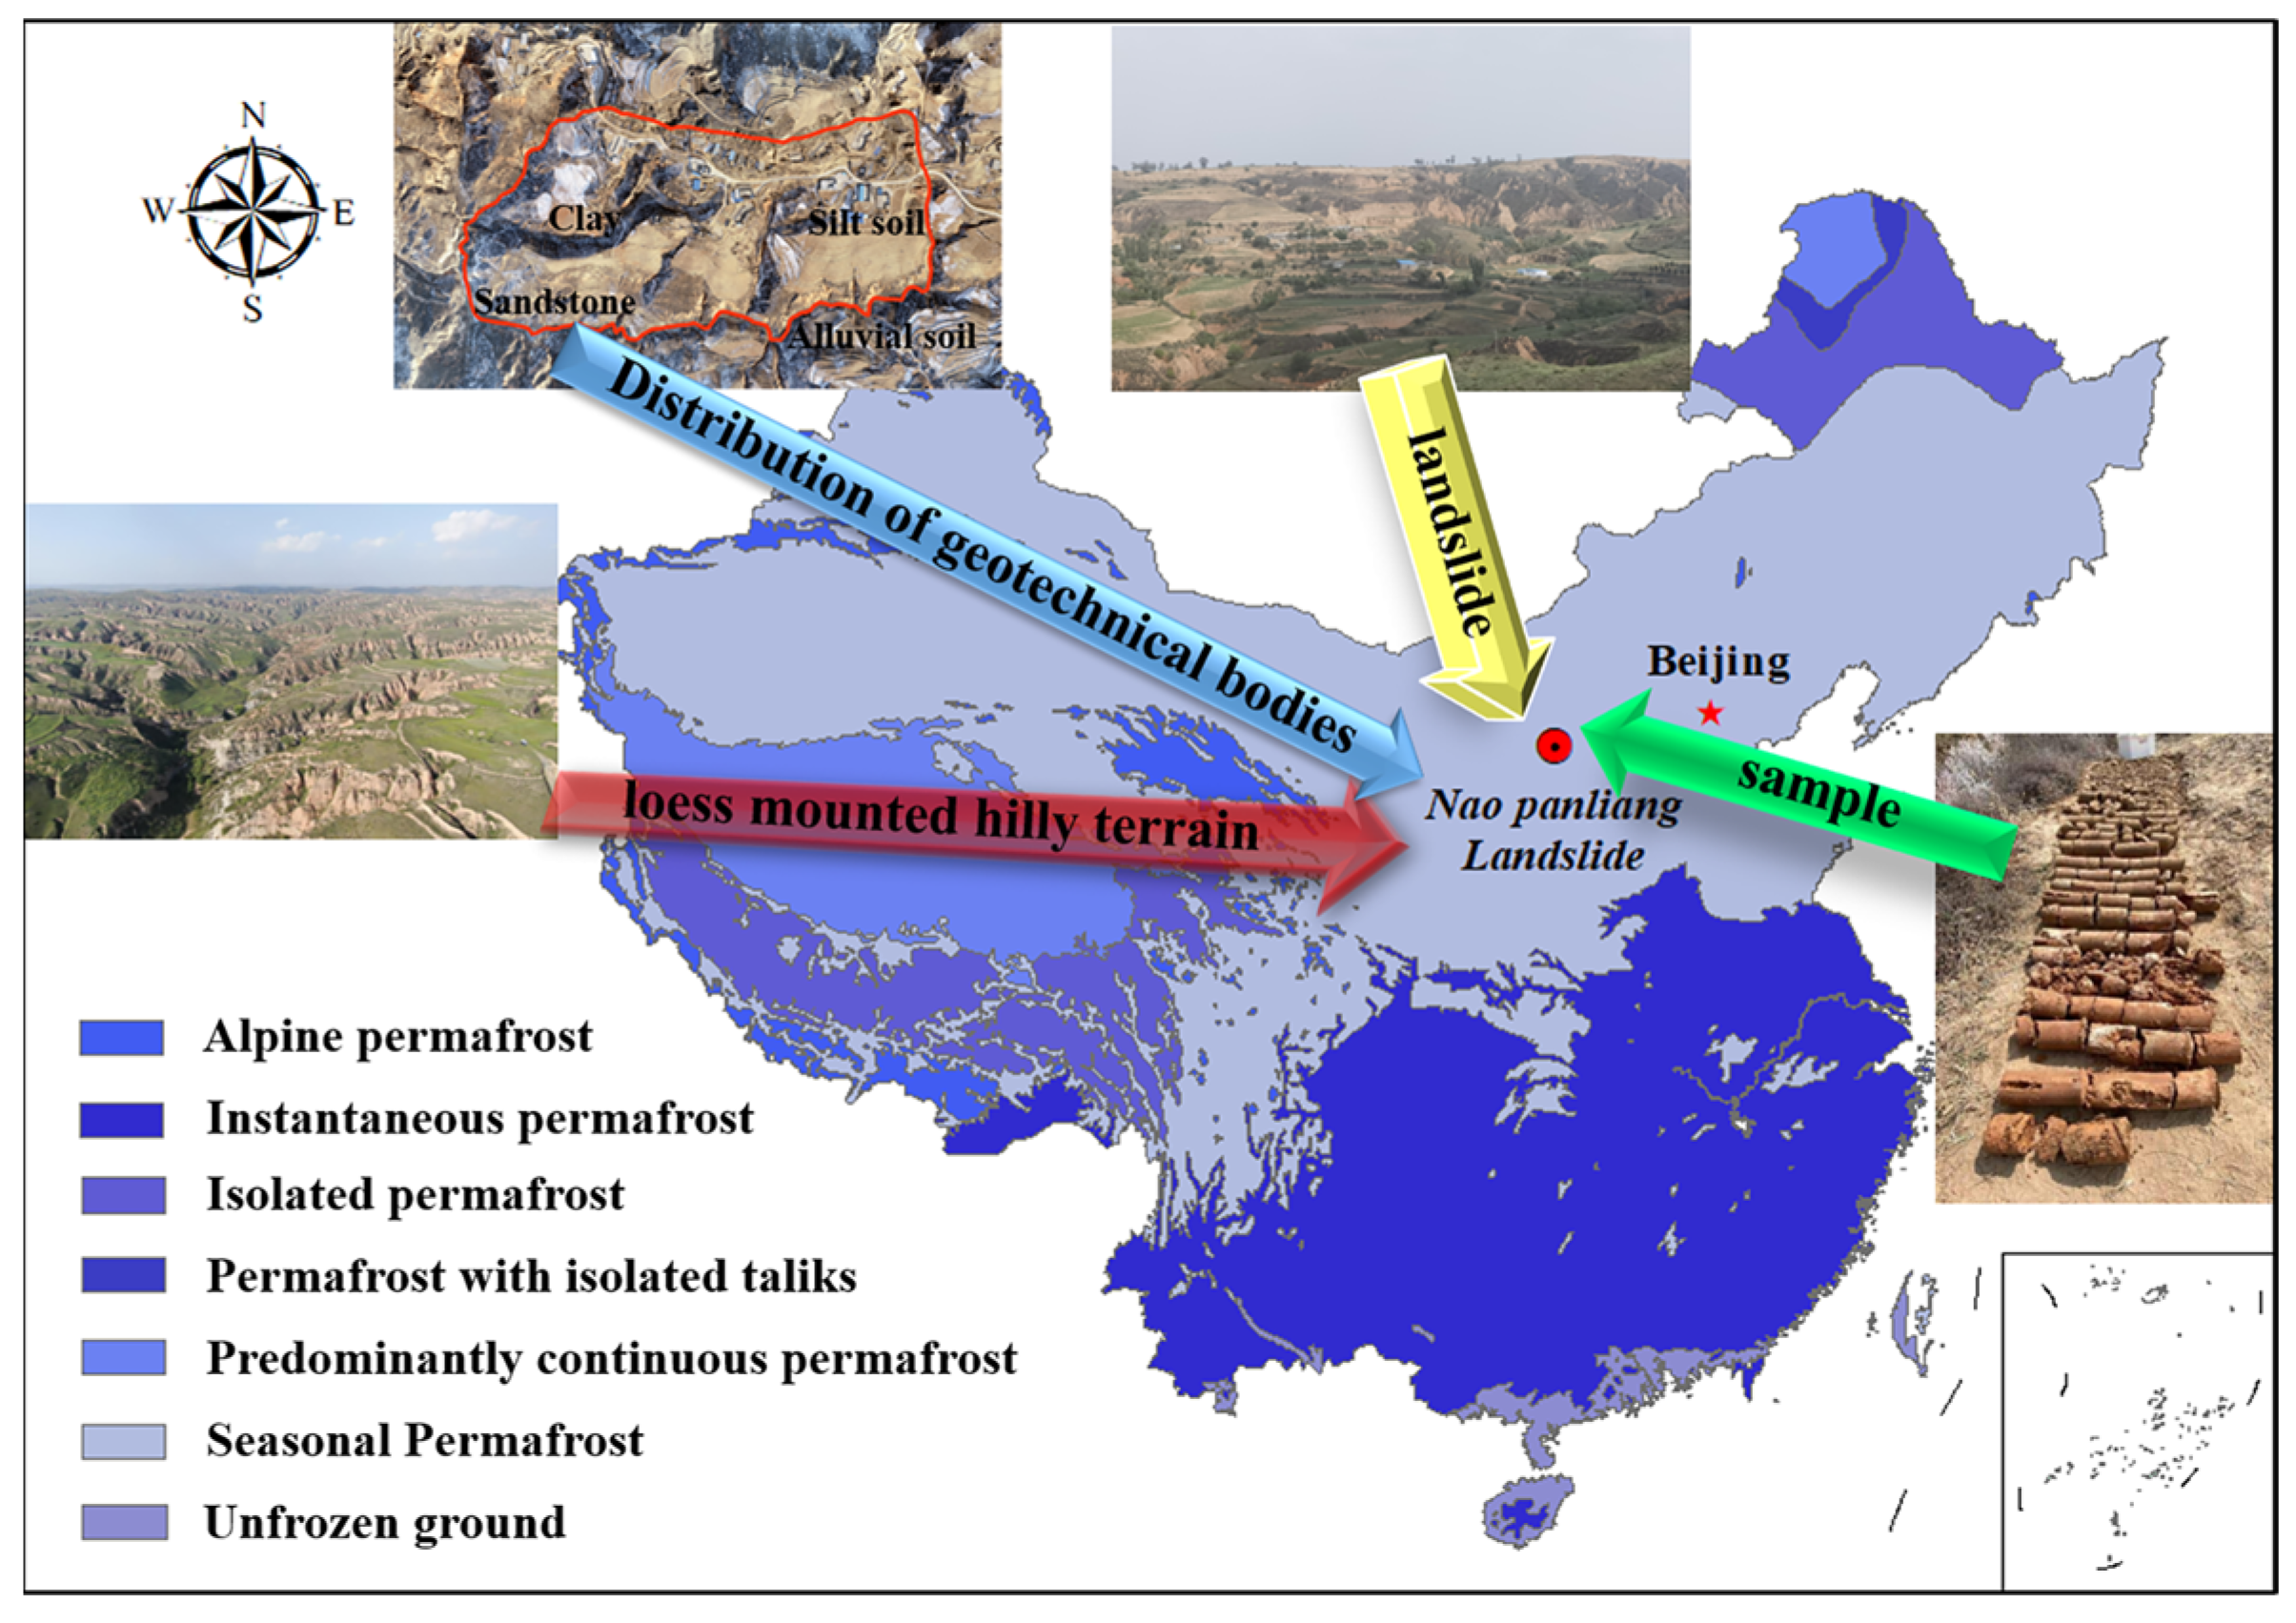
Therefore, this study focuses on the Hipparion laterite from the slip zone of the Nao panliang landslide (
Figure 1) in the northern Jin-shann Canyon of the Yellow River Basin, aiming to reveal the evolution of mechanical properties and pore characteristics under F-T conditions. Through innovative integration of ring-shear tests (simulating the in situ shear behavior of slip zones) and quantitative SEM image analysis (based on pore parameter extraction and fractal theory), we systematically analyze the macro–micro response mechanisms of the soil under hydro-thermal–mechanical coupling processes. This work addresses the research gap in understanding the engineering geological properties and failure mechanisms of Neogene Hipparion laterite in seasonally frozen regions. The conclusions provide theoretical foundations and practical insights for the early warning and mitigation of loess landslides on the Loess Plateau.
2. Materials and Methods
2.1. Overview of the Study Area
The Hipparion laterite used in the physico-mechanical tests was sourced from the Nao panliang landslide in Mugua Town, Fugu County, Yulin City, Shaanxi Province (
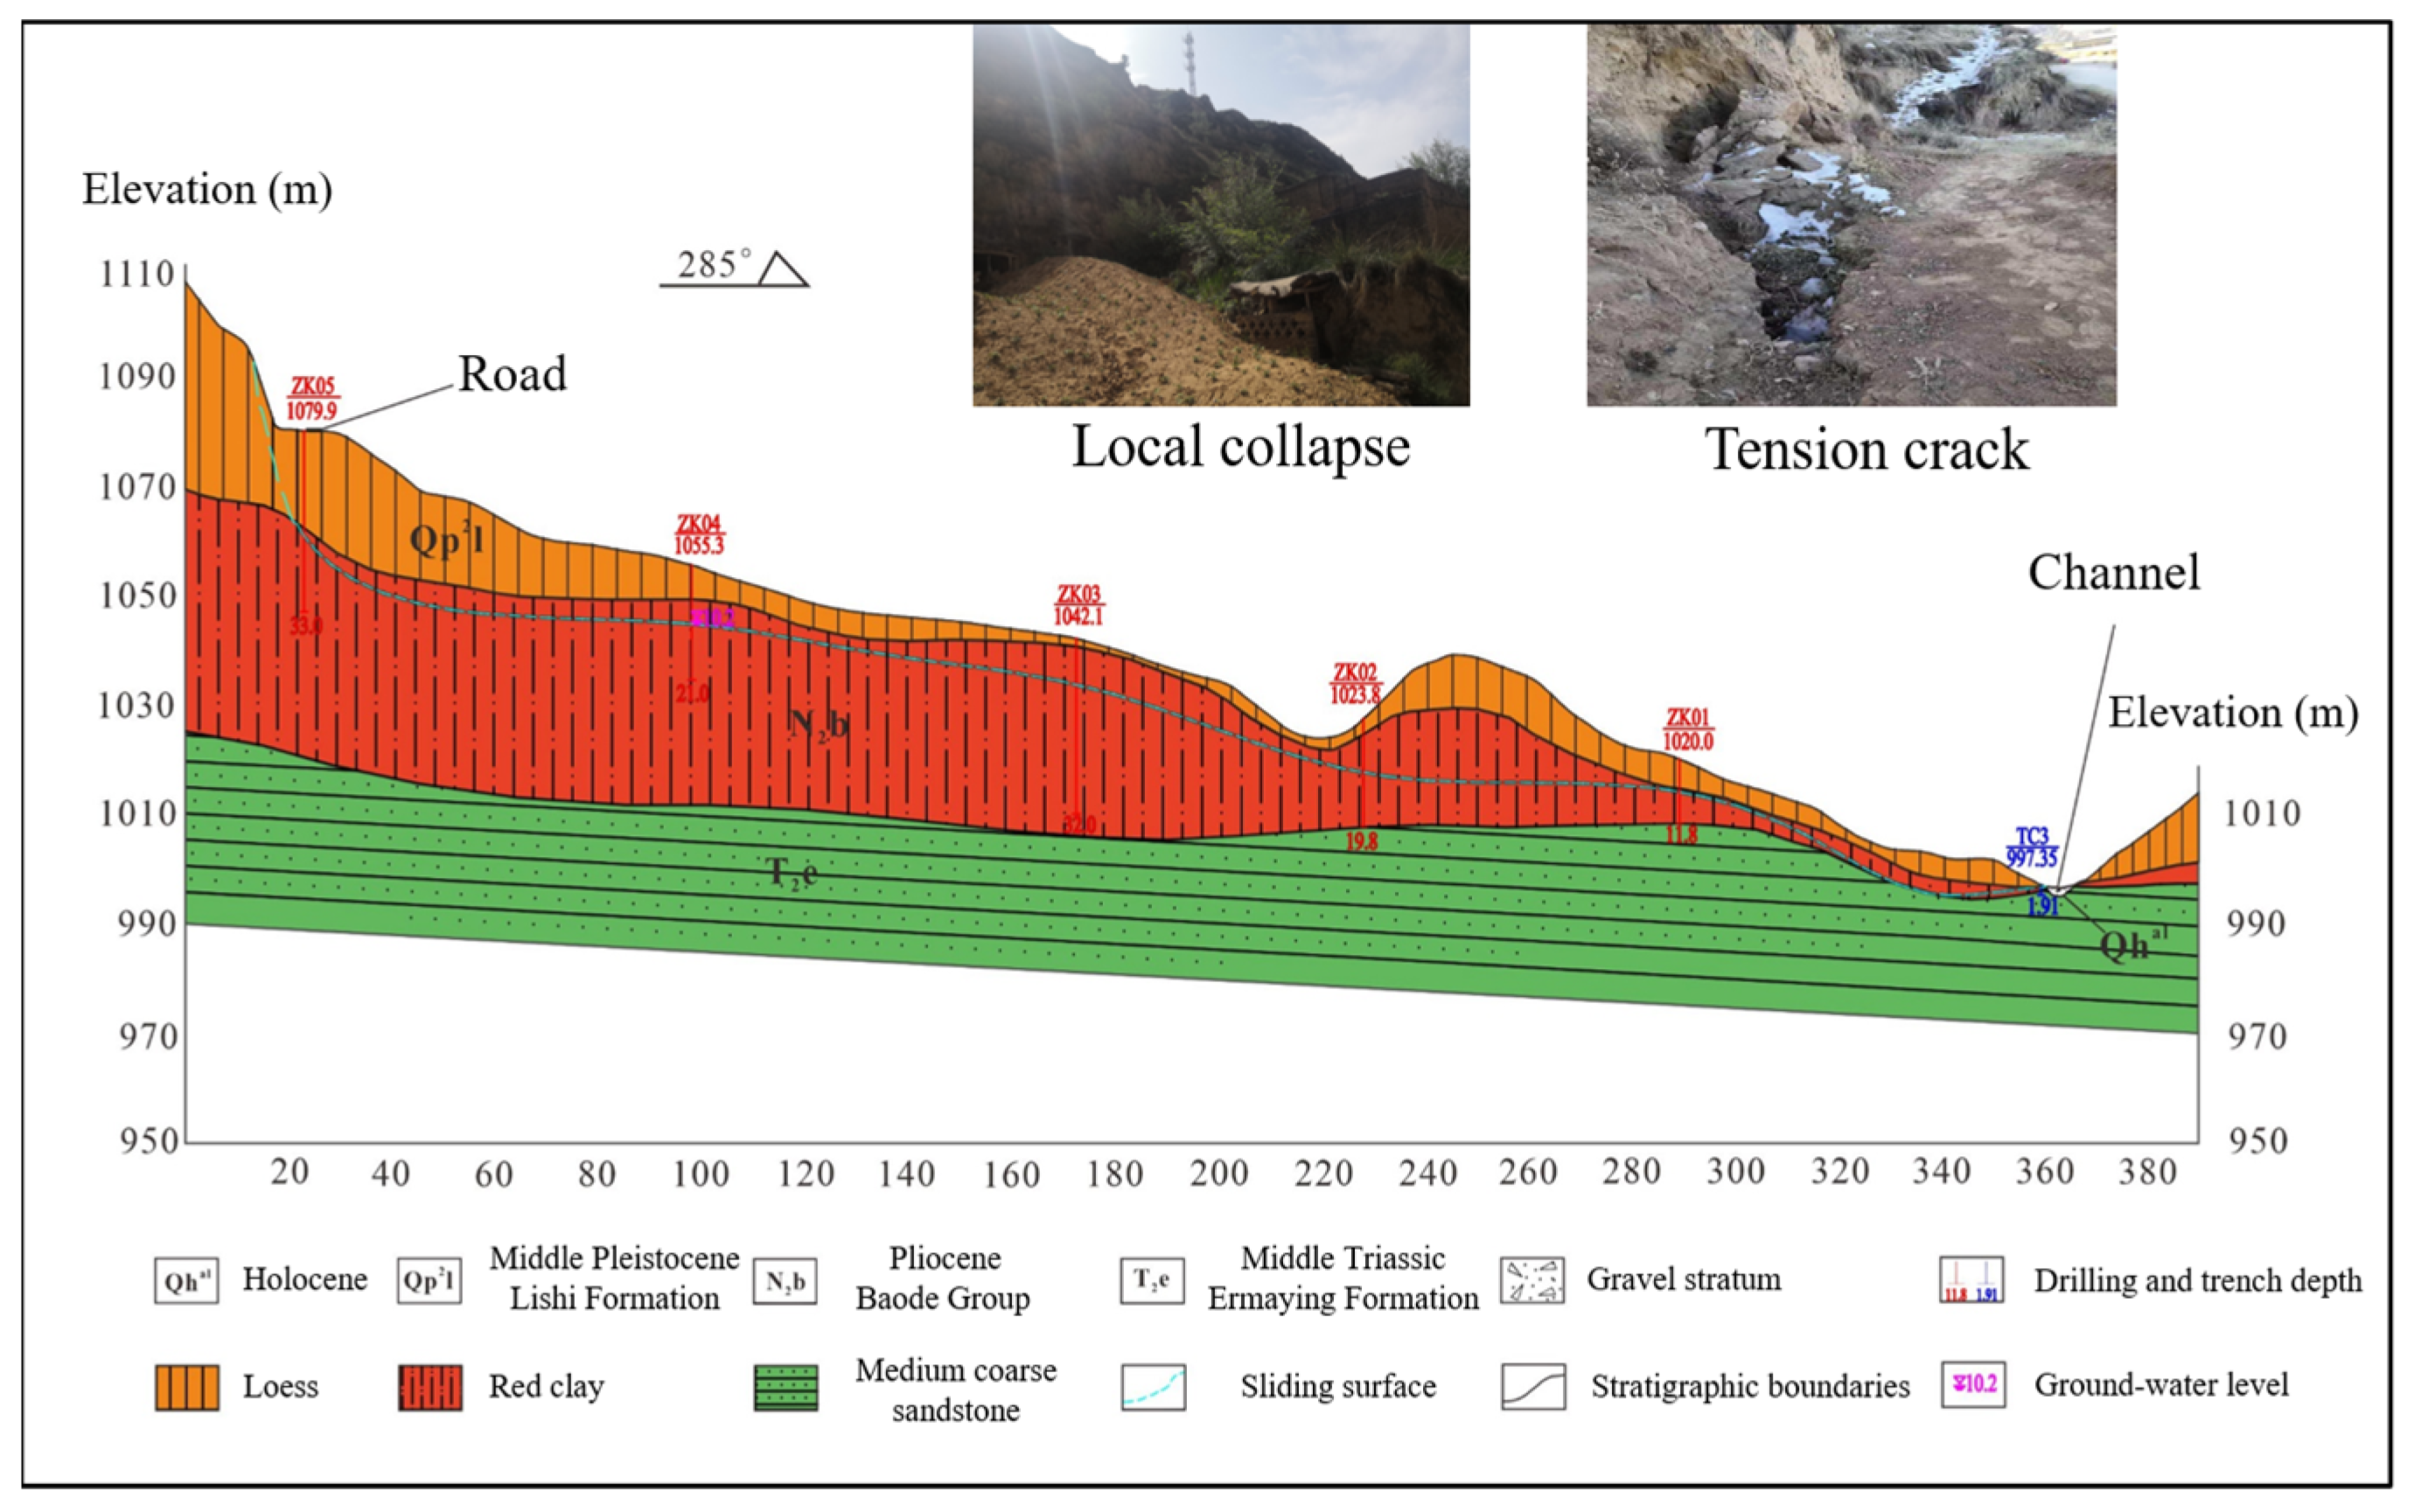
Figure 1). Soil samples were collected from the landslide slip zone at depths ranging from 0 to 33 m. These samples belong to the Neoproterozoic Baode and Jingle Formations. characterized by brownish-Hipparion laterite with occasional calcareous nodules. This deposit is overlain by light yellow clay of the Quaternary Middle Pleistocene Lishi Formation [
68,
69,
70] and underlain by coarse-grained feldspathic sandstone of the Triassic Middle Ermaying Formation. The stratigraphic and lithologic distributions are illustrated in
Figure 2. The sampling depths (0–33 m) were selected to systematically cover critical layers of the slip zone, including the shallow weathered layer (0–10 m), intermediate shear band (10–25 m), and deeper intact layer (25–33 m). Due to seasonal temperature fluctuations in the study area during winter and spring, near-surface soil is more susceptible to F-T cycles: pore water freezes into ice within the soil, generating expansion and compressive stresses through frost heave, which promotes crack development. Upon thawing, the ice melts into water that flows through the soil, accelerating pore evolution and leading to rapid deterioration of physical and mechanical properties, thereby destabilizing the slope. This periodic “frost heave–thaw shrinkage” effect induces dynamic water pressure in the soil, driving sudden or creeping instability of the sliding mass. Therefore, the sampling depths and locations are closely linked to the landslide failure mechanisms: F-T processes dominate in shallow layers, physical–mechanical evolution occurs in the intermediate shear band, and multiscale failure mechanisms (e.g., seepage-induced erosion) develop in the deeper intact layer, collectively providing a theoretical basis for landslide early warning on the Loess Plateau.
2.2. Basic Physical Properties
The Hipparion laterite samples collected from the landslide slide zone underwent laboratory testing to determine the basic physical properties and soluble salt content. The results of these tests are presented in
Table 1 and
Table 2.
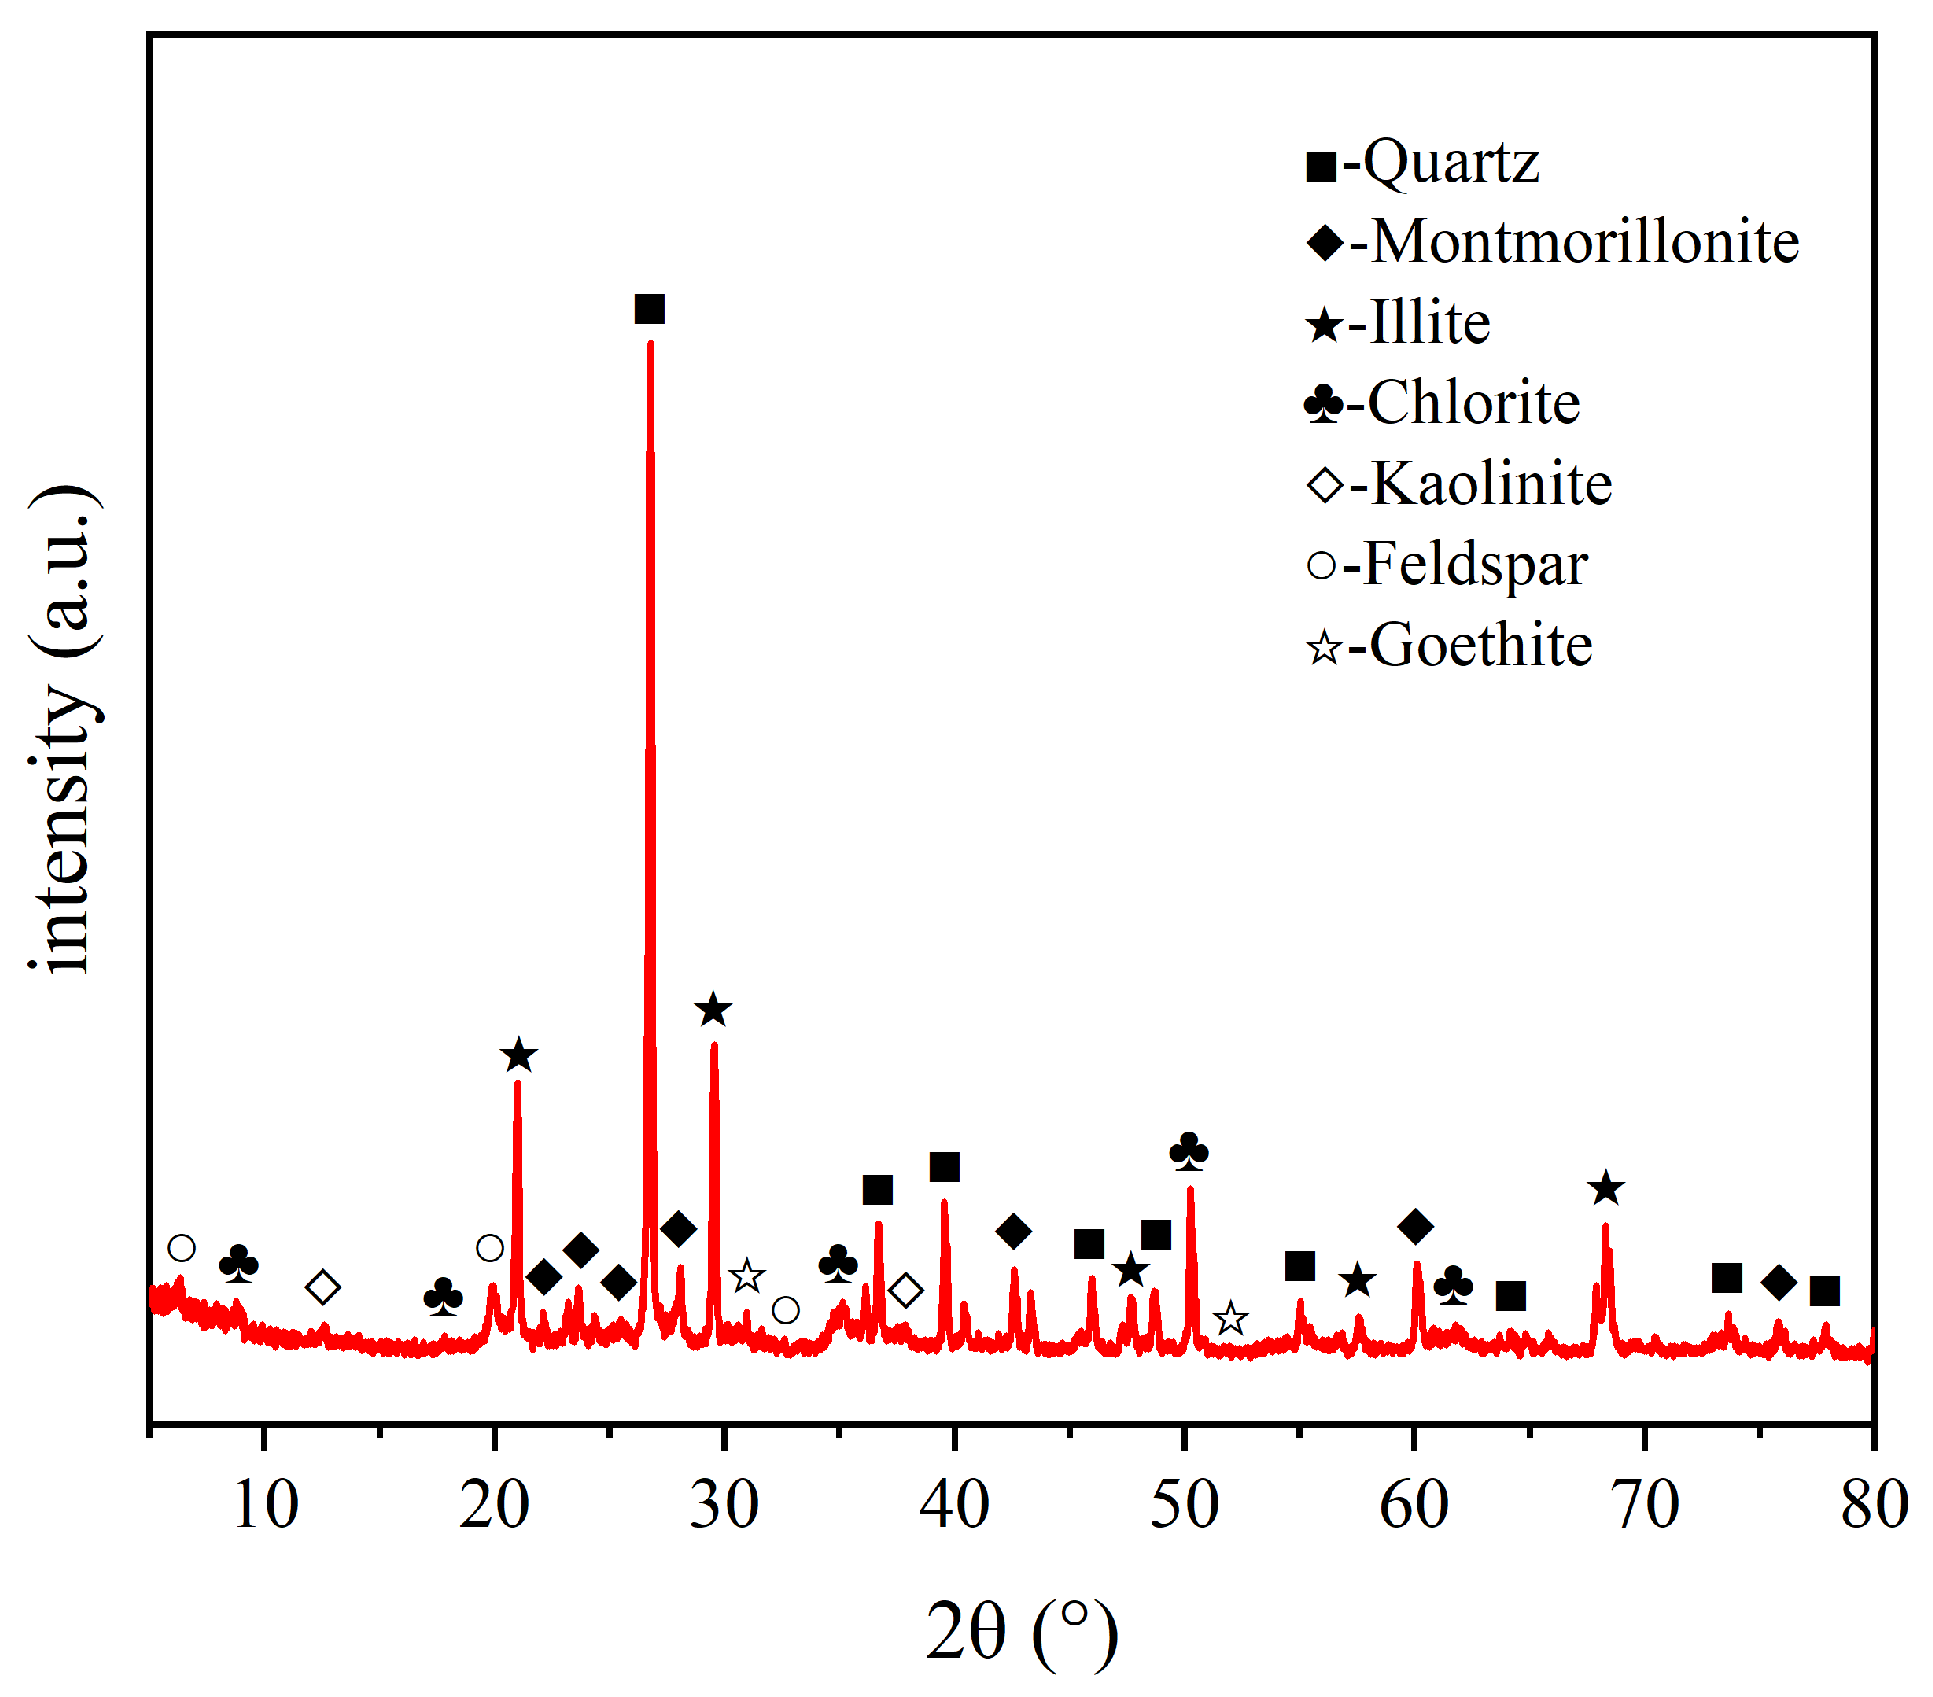
The mineral composition testing of the Hipparion laterite samples was conducted using the XD-3 X-ray diffractometer (XRD). The samples were ground into powder and loaded into the sample stage. The positions of the X-ray source, sample stage, and detector were adjusted to ensure optimal diffraction conditions. A copper target was selected as the X-ray source, with the tube voltage and current appropriately set. The diffraction angle was fixed at 2θ, and the scan range was set from 5° to 80°. After configuring all parameters, the XRD scanning commenced. During the scanning process, X-rays passing through the sample generated diffraction peaks at specific angles, forming the XRD diffraction pattern shown in
Figure 3. Quantitative analysis and phase identification of the sample were performed using dedicated data processing software, enabling the determination of the mineral composition of the Hipparion laterite. The experimental results are summarized in
Table 3.
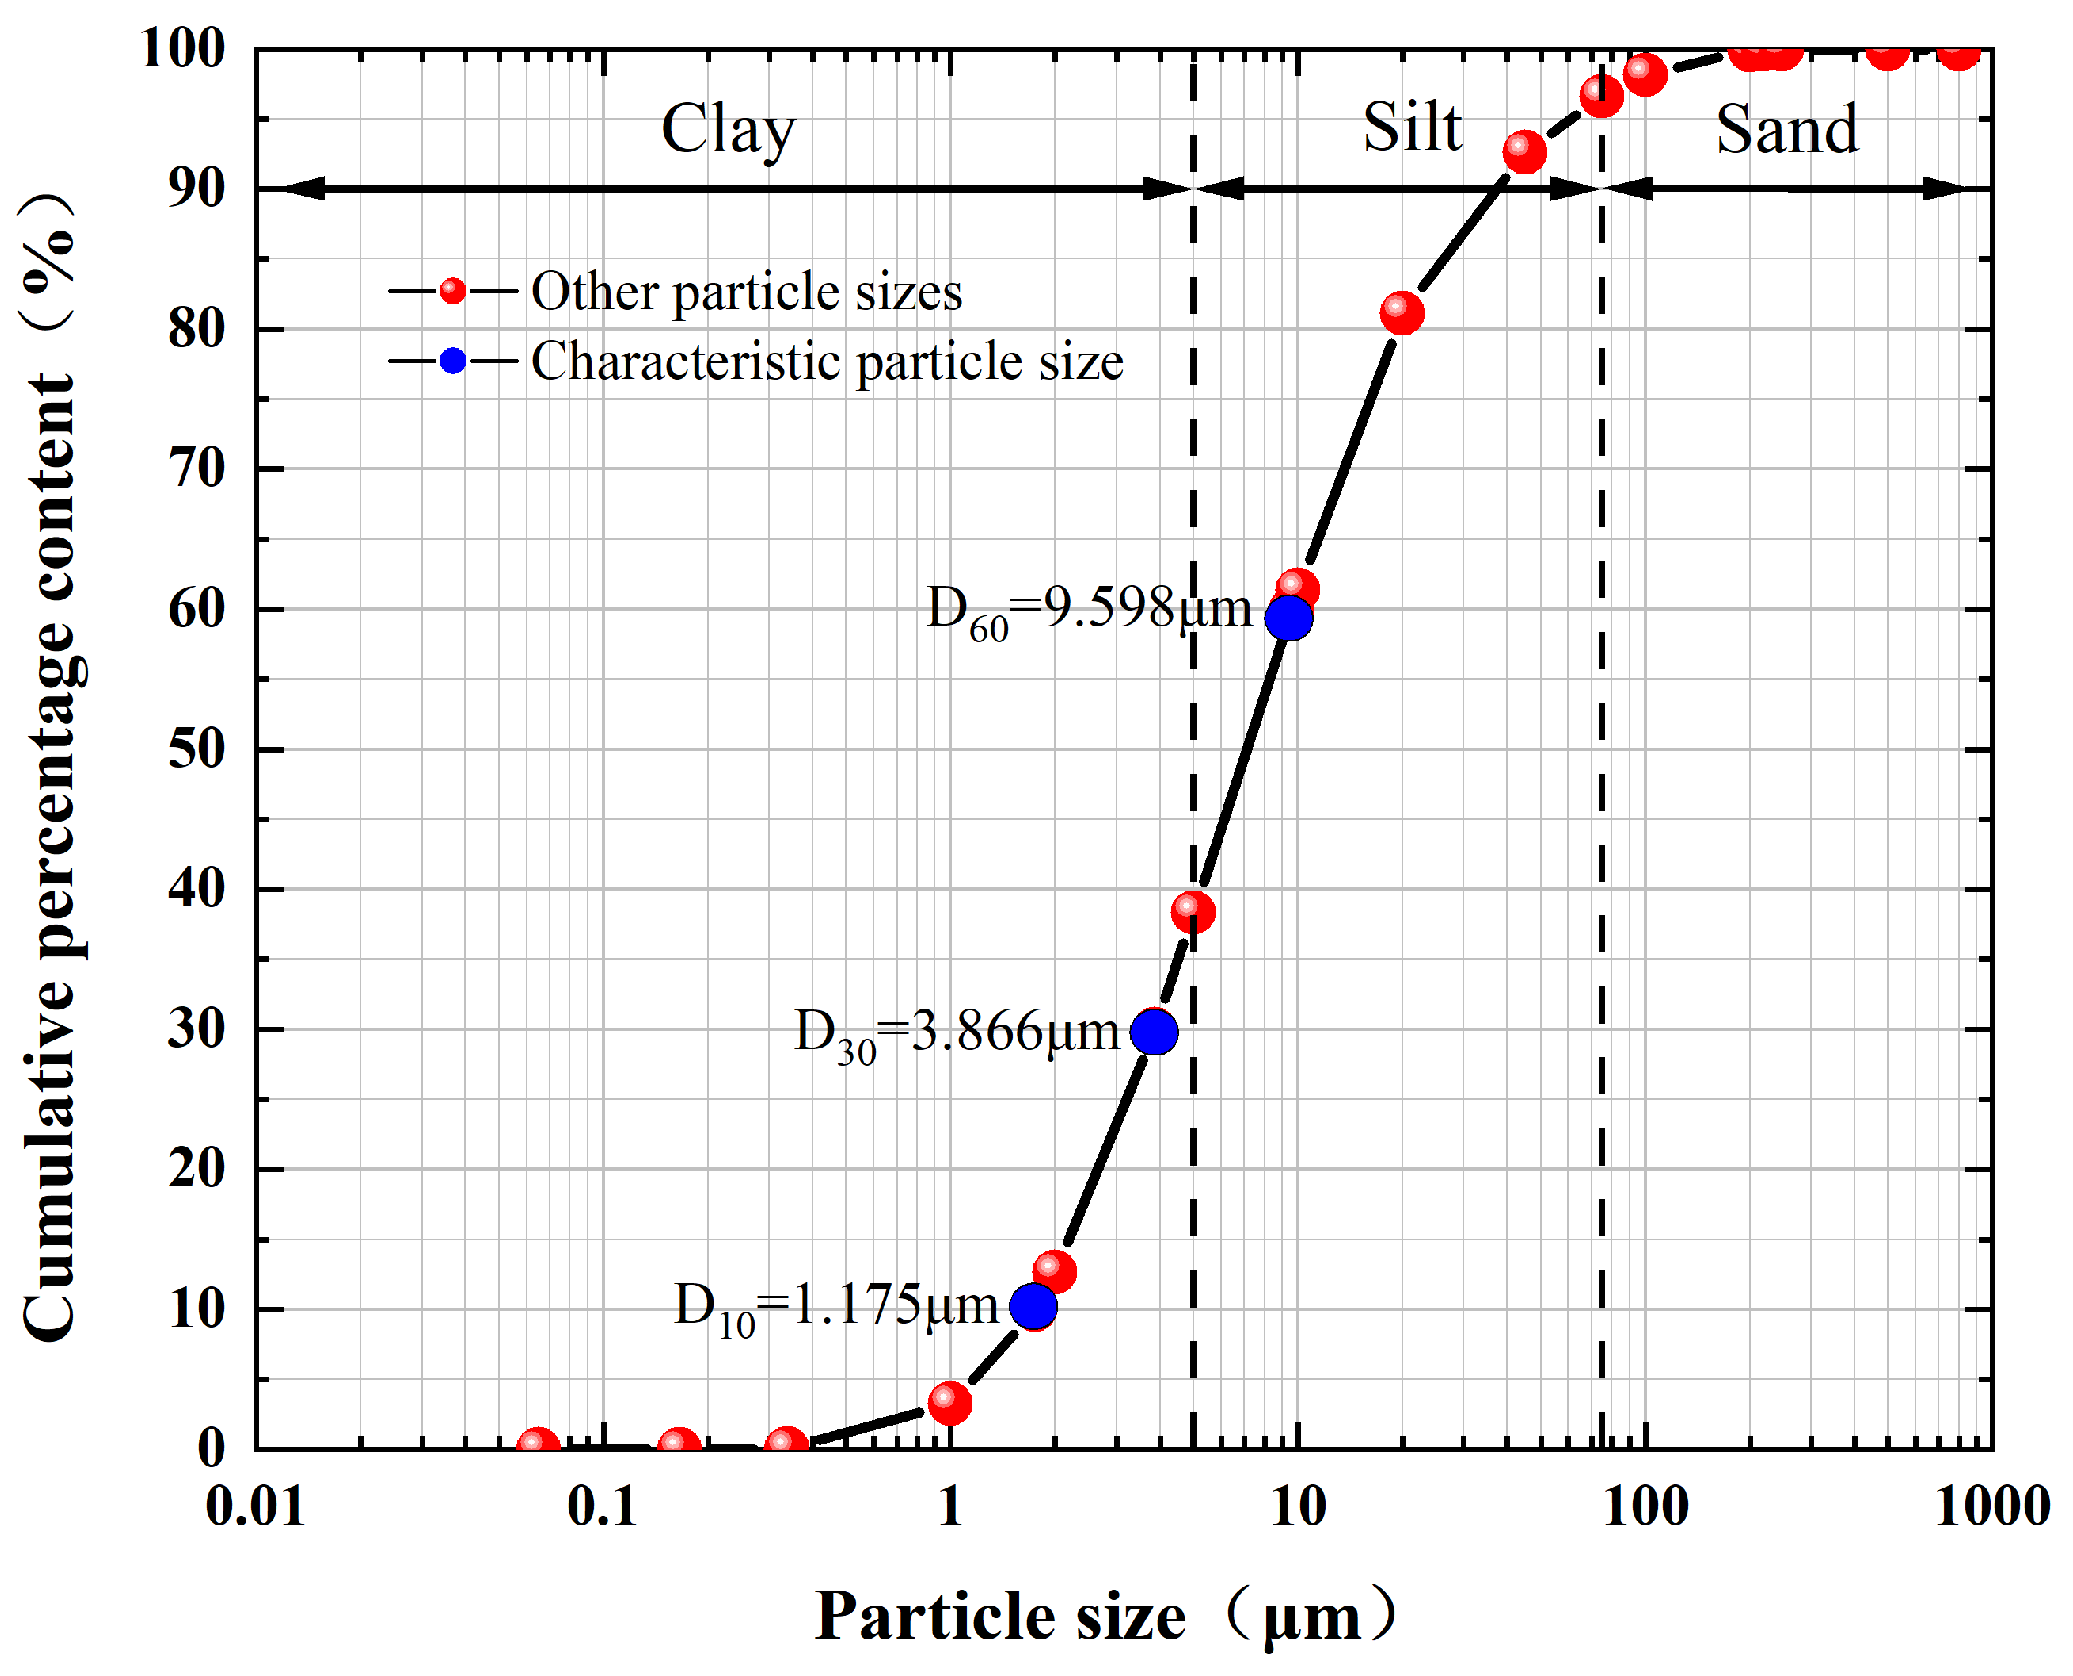
Particle size analysis was conducted on Hipparion laterite samples using a Bettersize 2600 laser particle size analyzer. Cumulative percentage content curves for different particle sizes were derived (
Figure 4). Statistical analysis revealed the following particle size distribution: effective particle size D
10 = 1.175 μm, median particle size D
30 = 3.866 μm, control particle size D
60 = 9.598 μm. The clay content (D ≤ 5μm) was 38.35%, the silt content (5 μm ≤ D ≤ 75 μm) was 58.26%, and the sand content (predominantly fine sand) (75 μm ≤ D ≤ 250 μm) was 3.39%. The calculated coefficient of inhomogeneity (C
u) is 8.169, and the coefficient of curvature (C
c) is 1.325, indicating that the Hipparion laterite sample is well graded.
2.3. Sample Preparation
The original soil material was dried in an oven at 105 °C for over 24 h. Subsequently, the dried soil was sieved through a 2 mm aperture geotechnical sieve and stored in airtight containers. The target moisture content was determined based on the natural moisture content and liquid–plastic limit of the soil materials. Water was evenly sprayed onto the soil sample, thoroughly mixed, and placed in a sealed bag. The sealed bag was then stored in a humidifier for 48 h to ensure complete and even moisture distribution within the soil. The moisture content was redetermined to verify an error of less than 0.5%. Based on the dimensions of the ring specimen (100 mm outer diameter, 70 mm inner diameter, and 10 mm thickness) and the in situ density, the mass of each specimen was calculated. The geotechnical qualitative filter paper was cut into a hollow ring that matched the dimensions of the test soil sample and placed flat at the bottom of the sample mold. The target mass of the soil sample was scooped into the sample mold using a sampling spoon, and circular filter paper was placed evenly on the top surface of the soil sample. The sample mold was placed under a hydraulic jack, and the soil sample was initially compacted using a pressurized rod. After a static period of 3–5min, the axial pressure was removed. The mold was then flipped, and the sample was ejected by applying counterpressure. Upon completion of annular specimen preparation, triplicate samples were prepared for each test condition to mitigate experimental variability and ensure data reproducibility. These replicates were sequentially subjected to programmed F-T cycling testing followed by ring-shear testing.
2.4. F-T Cycles Test
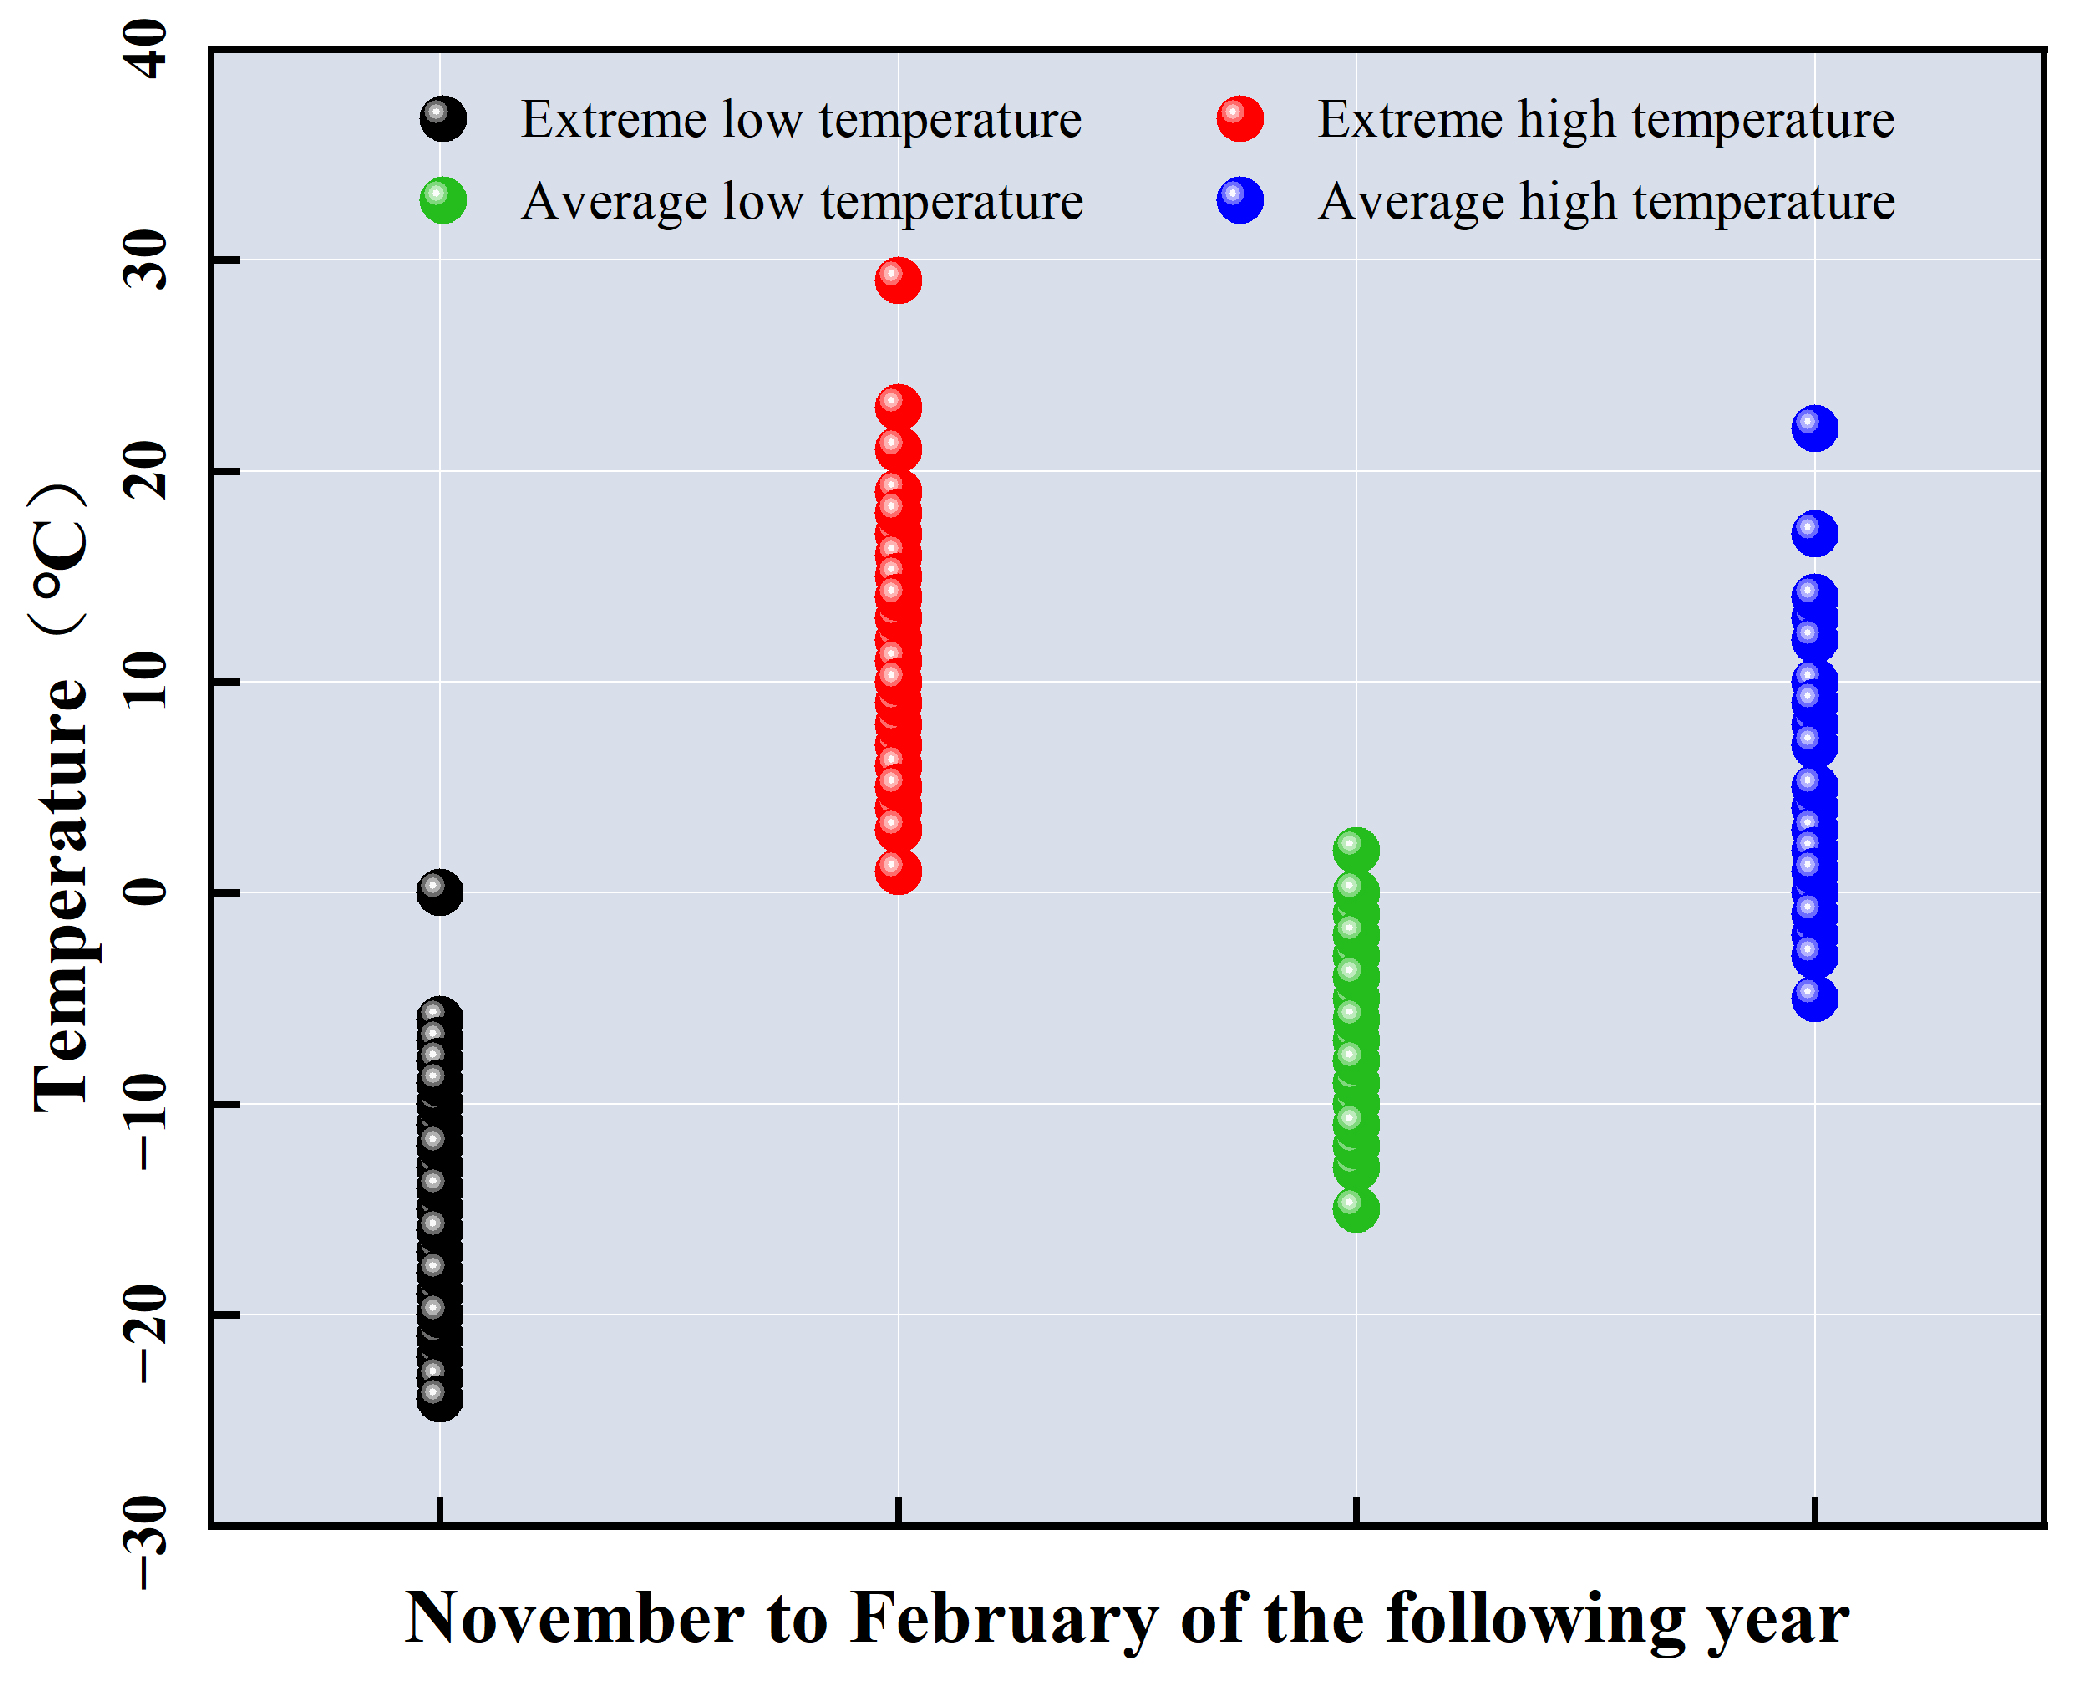
The F-T cycle test was conducted in a WGDW-100 high- and low-temperature alternating humidity and heat test chamber capable of maintaining temperatures between −40 °C and +150 °C. This temperature range satisfies the temperature setting requirements for the F-T cycle experiments on Hipparion laterite in seasonal frozen regions conducted in this study, and the area undergoes at least one F-T cycle annually. A review of the literature and meteorological data from Fugu County revealed the maximum and minimum temperatures during the five winter and spring months over the past fourteen years (
Figure 5). Based on the average high- and low-temperature data, an F-T cycle test was designed.
Ring shear specimens of Hipparion laterite were prepared with different moisture contents (16%, 20%, 24%) and placed in ring molds. The specimens were wrapped in plastic wrap and slowly transferred to the F-T test chamber. As shown in
Figure 6, each F-T cycle involved four rigorously controlled phases: (1) freezing initiation (1 h cooling from 25 °C to −15 °C), (2) isothermal freezing (12 h stabilization at −15 °C), (3) thawing initiation (1 h heating from −15 °C to 20 °C), and (4) isothermal thawing (12 h stabilization at 20 °C), totaling 26 h per cycle, and the temperature–time trajectory detailed in
Figure 6. Based on the stage-dependent characteristics of F-T damage in soils and established engineering practice, the F-T cycle gradient was defined at intervals of 2 cycles. Specimens were subjected to 0, 2, 4, 6, 8, and 10 cycles.
2.5. Ring-Shear Test
Ring-shear tests were conducted on the prepared specimens with different initial moisture contents after various F-T cycles. The tests were performed using a 27-WF2202 Bromhead automatic ring-shear instrument, manufactured by Controls of Milan, Italy. Prior to testing, error calibration of the normal stress sensor, shear stress sensor, and vertical displacement sensor within the data acquisition system must be performed, followed by comprehensive checks of the upper/lower shear plates and parameter configuration system. Additionally, strict regulation of laboratory ambient temperature (±1 °C) is critical throughout the experimental process. Neglecting these protocols may introduce systematic errors, ultimately compromising the reliability of mechanical parameters and rendering the results inapplicable to geotechnical engineering practice. The instrument was slightly modified to increase the specimen height and reduce test errors and costs.
The specimen was carefully placed into the lower shear box, followed by placing the upper shear box equipped with a permeable stone on the specimen’s upper surface. The torque was applied to the shear box using the torque rings on both sides of the shear box. Normal stresses of 200 kPa, 400 kPa, and 600 kPa were applied using weights loaded on a pallet balance with a leverage ratio of 10:1. The shear rate was maintained at a constant value of 20 mm/min, and the loading mode followed a single-stage application. The shear stress was calculated using Equation (1) in accordance with Test Method BS 1377-7:1990 [
73]:
In the equation: A and B represent the torque values of torque rings 1 and 2, respectively, in units of N·m; L denotes the distance between the force application points on the torque beam, measured in mm; RF is the dimensionless average force ring coefficient; R1 and R2 correspond to the outer and inner radii of the specimen, respectively, expressed in mm. Error analysis (including mean and standard deviation) of the shear stress values under each experimental condition was performed in Microsoft Excel 2016, and the strength variation patterns were analyzed through shear stress versus average linear displacement curves with error bars. Subsequently, curve fitting for the shear strength parameters of Hipparion laterite under varying F-T cycles and moisture content levels was conducted in OriginPro 2021, establishing high-correlation functions to predict the degradation of soil cohesion. These results provide theoretical support for practical slope engineering applications.
In ring-shear testing, the peak strength of soil represents the maximum shear stress resisting shear failure during the shearing process, typically corresponding to the apex of the shear stress versus mean linear displacement curve. The residual strength denotes the stabilized shear stress after shear failure, corresponding to the plateau segment following the peak point. For this study, the residual-to-peak strength ratio falling below 0.85 was established as the shear failure criterion. Post-failure shearing was continued to monitor stress evolution, with test termination triggered under a cumulative mean linear displacement reaching 200 mm. Operator-defined termination protocols (e.g., early stoppage for highly sensitive clays or energy-constrained scenarios) were permitted but required explicit documentation of deviations from standard procedures to ensure reproducibility.
2.6. SEM Test and Image Process
The macroscopic mechanical behavior of soil reflects its underlying microstructure. Microscopic analysis was performed using a JSM-7610F ultra-high-resolution thermal field emission scanning electron microscope (FESEM) from Japan Electronics Corporation (JEOL) (Tokyo, Japan). This instrument has a secondary electron image resolution of 1.0 nm and a magnification range of ×250 to ×10,000.
For the ring-sheared samples with different initial moisture contents and subjected to varying numbers of F-T cycles, small 10 mm × 10 mm × 5 mm specimens were extracted from the shear zone. The fresh structural surfaces of the specimens were used for SEM analysis. A total of 18 groups of samples with different moisture contents and F-T cycles were prepared. The samples were processed according to specific test requirements to optimize their conditions for SEM analysis.
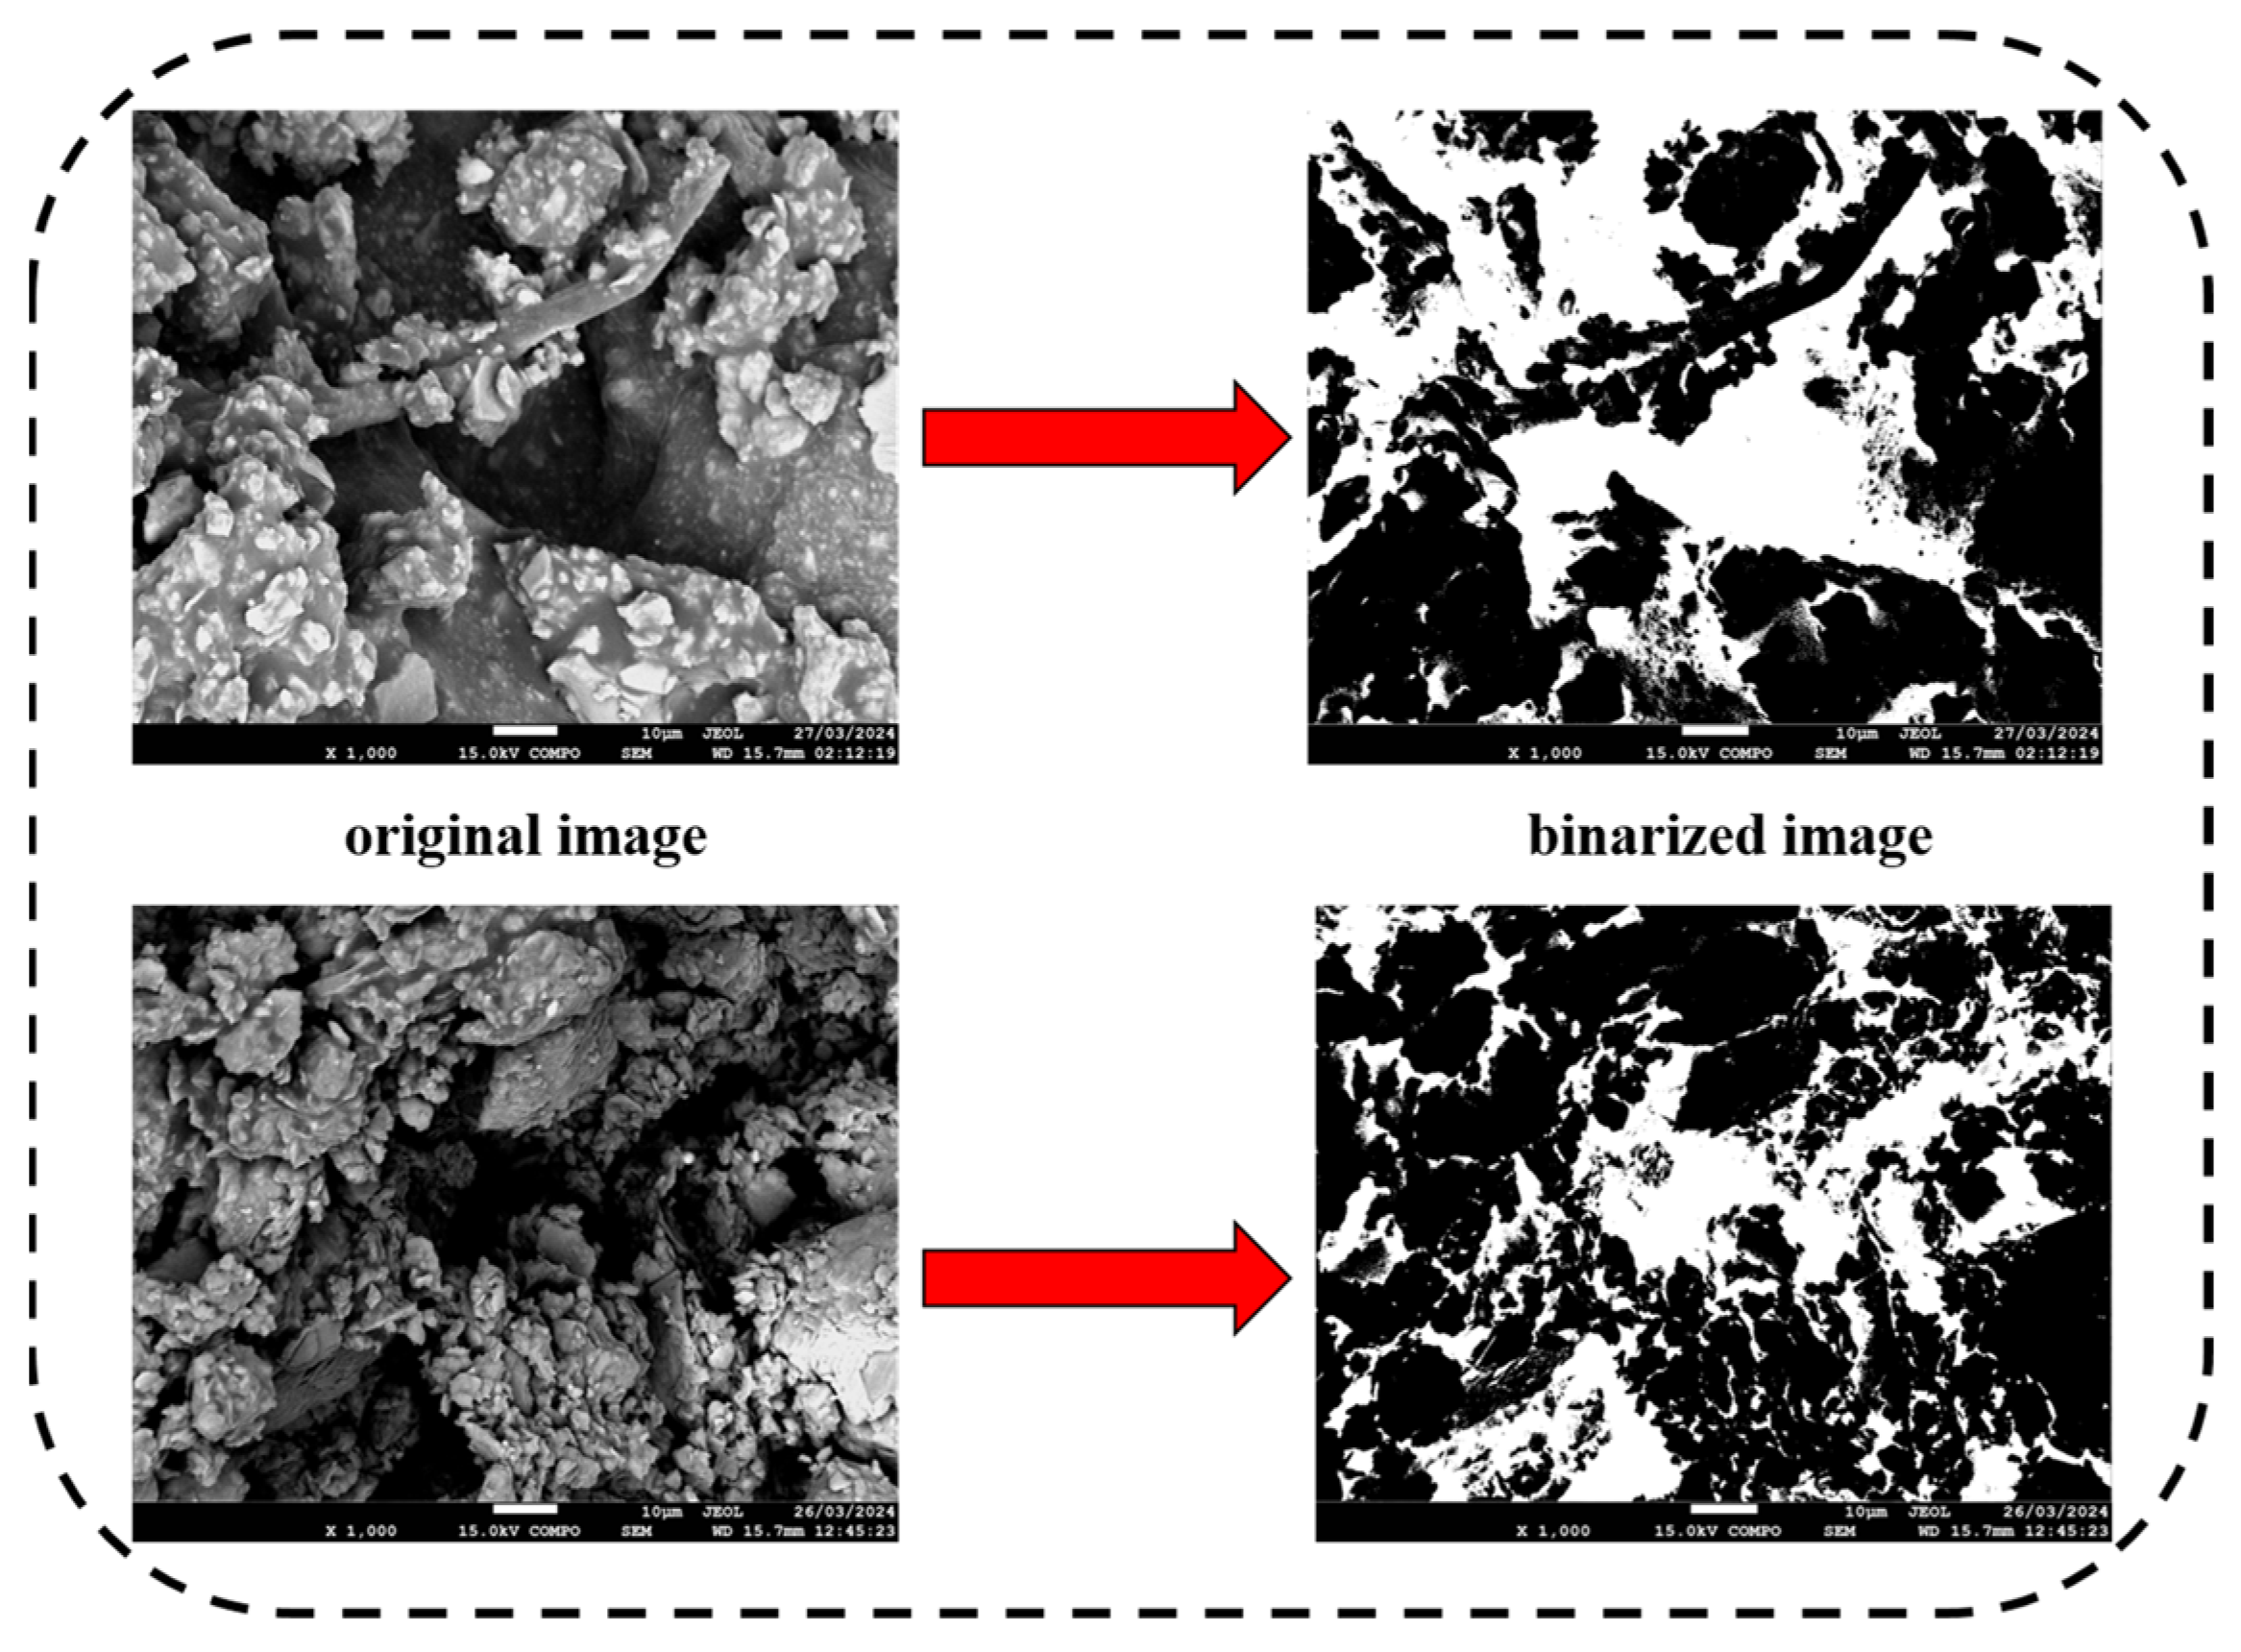
The basic parameters, including the structure, number, and distribution of the particles and pores in the Hipparion laterite samples, were observed at magnifications of ×250, ×500, ×1000, and ×2000. Subsequently, the SEM images at different magnifications were processed and analyzed using the software of Image-Pro Plus (IPP) 6.0 to characterize and quantify these parameters. After importing the SEM image into the software, the first step is to calibrate the scale bar to ensure consistency with the original image. Next, set the grayscale threshold to distinguish soil particles (in black) and pores (in white) by adjusting the threshold values in RGB mode, thereby completing image binarization and segmentation (
Figure 7). Manually fill in pore areas lost during the automated quantification process to reduce experimental errors. After pore labeling, statistical criteria should be defined to filter qualified pore regions. Statistical analysis and quantitative evaluation of the extracted pore parameters within these regions were then conducted (using the same software as employed for error analysis and curve fitting in the ring-shear tests). It is crucial to note that microstructural parameters are typically extracted and analyzed from three distinct locations of the same test sample to ensure the scientific integrity and comprehensive representation of the results regarding the impact of F-T cycles on the pore structure of Hipparion laterite.
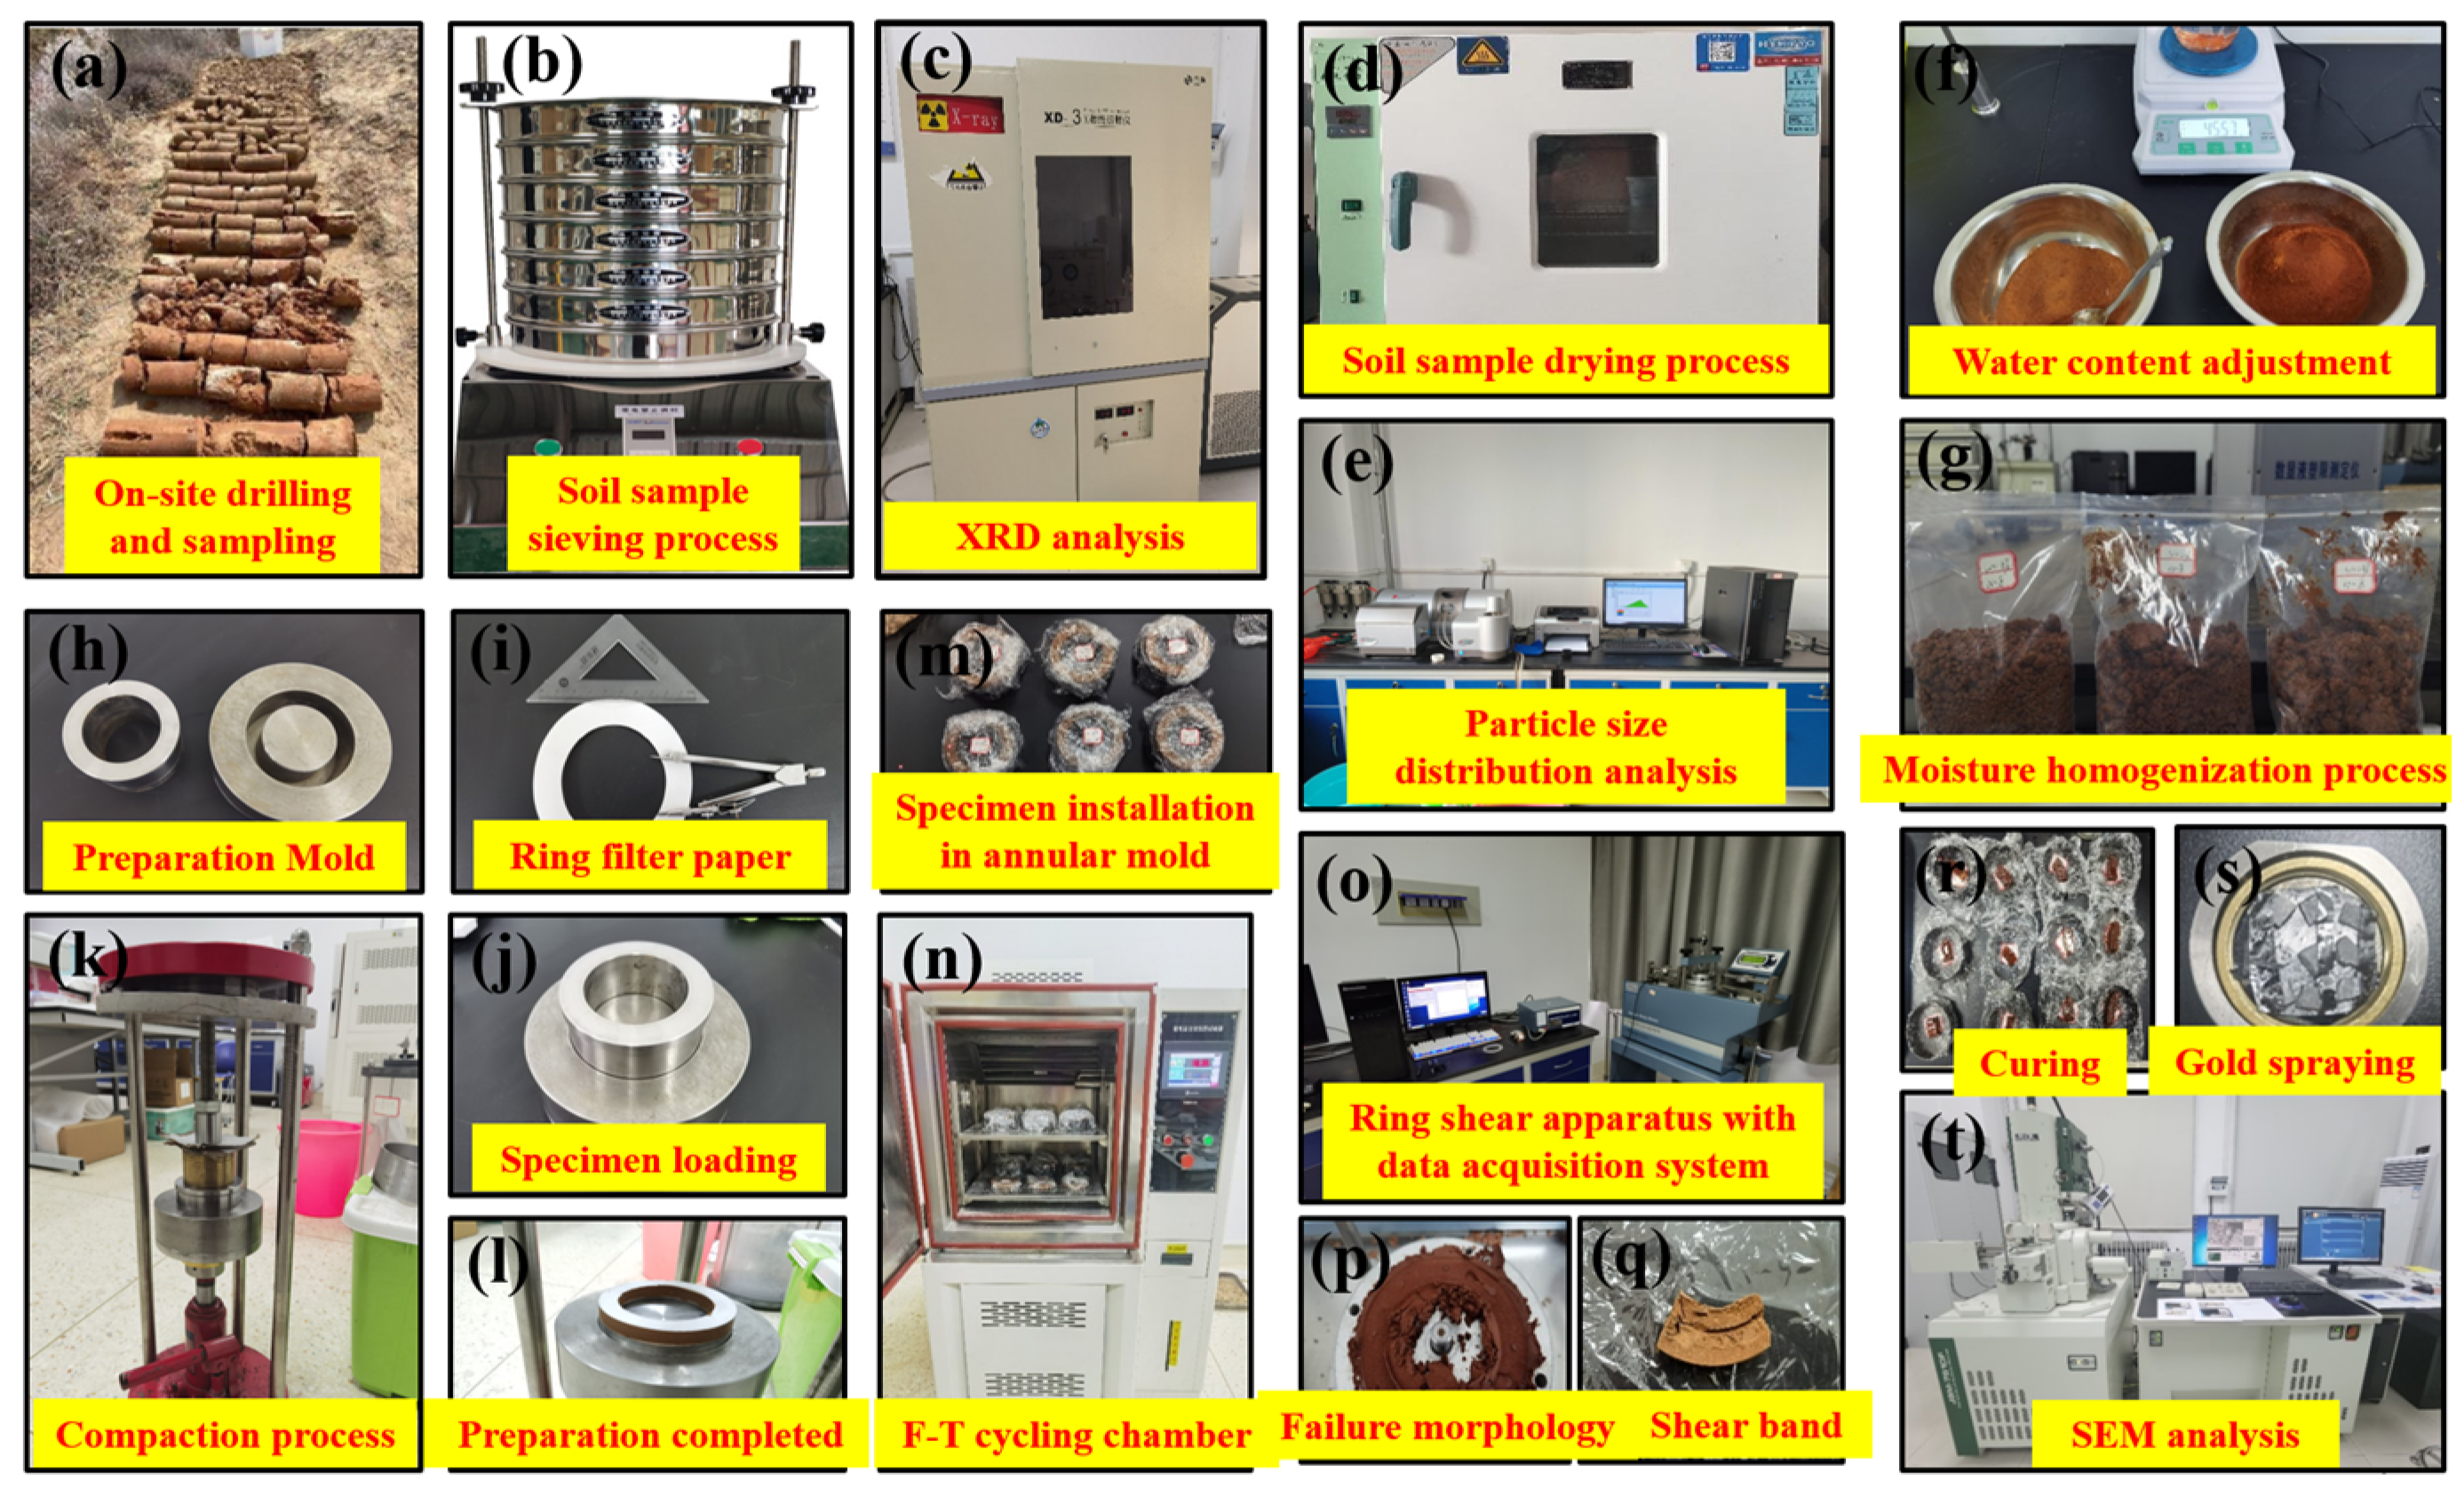
The sample preparation procedures and experimental instruments/equipment discussed in this section are presented in
Figure 8.
3. Results
3.1. Apparent Deformation Characteristics of Hipparion Laterite Under F-T Effect
The visible deformation of the Hipparion laterite samples subjected to multiple F-T cycles is shown in
Figure 9.
Varying degrees of deterioration were observed on the upper surfaces of Hipparion laterite specimens with different moisture contents. For samples with initial moisture contents of 16% and 20%, noticeable changes occurred after 2 to 4 F-T cycles, as soil particles began to disperse, forming numerous tiny pores and initiating the development of microfissures. As the number of cycles increased to 6, the pore network expanded further, resulting in the formation of local zigzag and horizontal cracks. After 8 and 10 cycles, the soil particles displayed a flaky, blocky, and crumbled structure, with localized detachment of the tiny particles. Conversely, Hipparion laterite specimens with an initial moisture content of 24% developed X-type cracks and numerous fissures and microfissures of varying lengths in the early stages of F-T cycling. As the number of cycles reached six, the crack width increased, and the lateral expansion of the soil body became evident. Further deterioration occurred after 8 and 10 cycles, characterized by the formation of prominent white stripes indicative of ice formation and the development of diagonal and horizontal fissures that extended through the soil body.
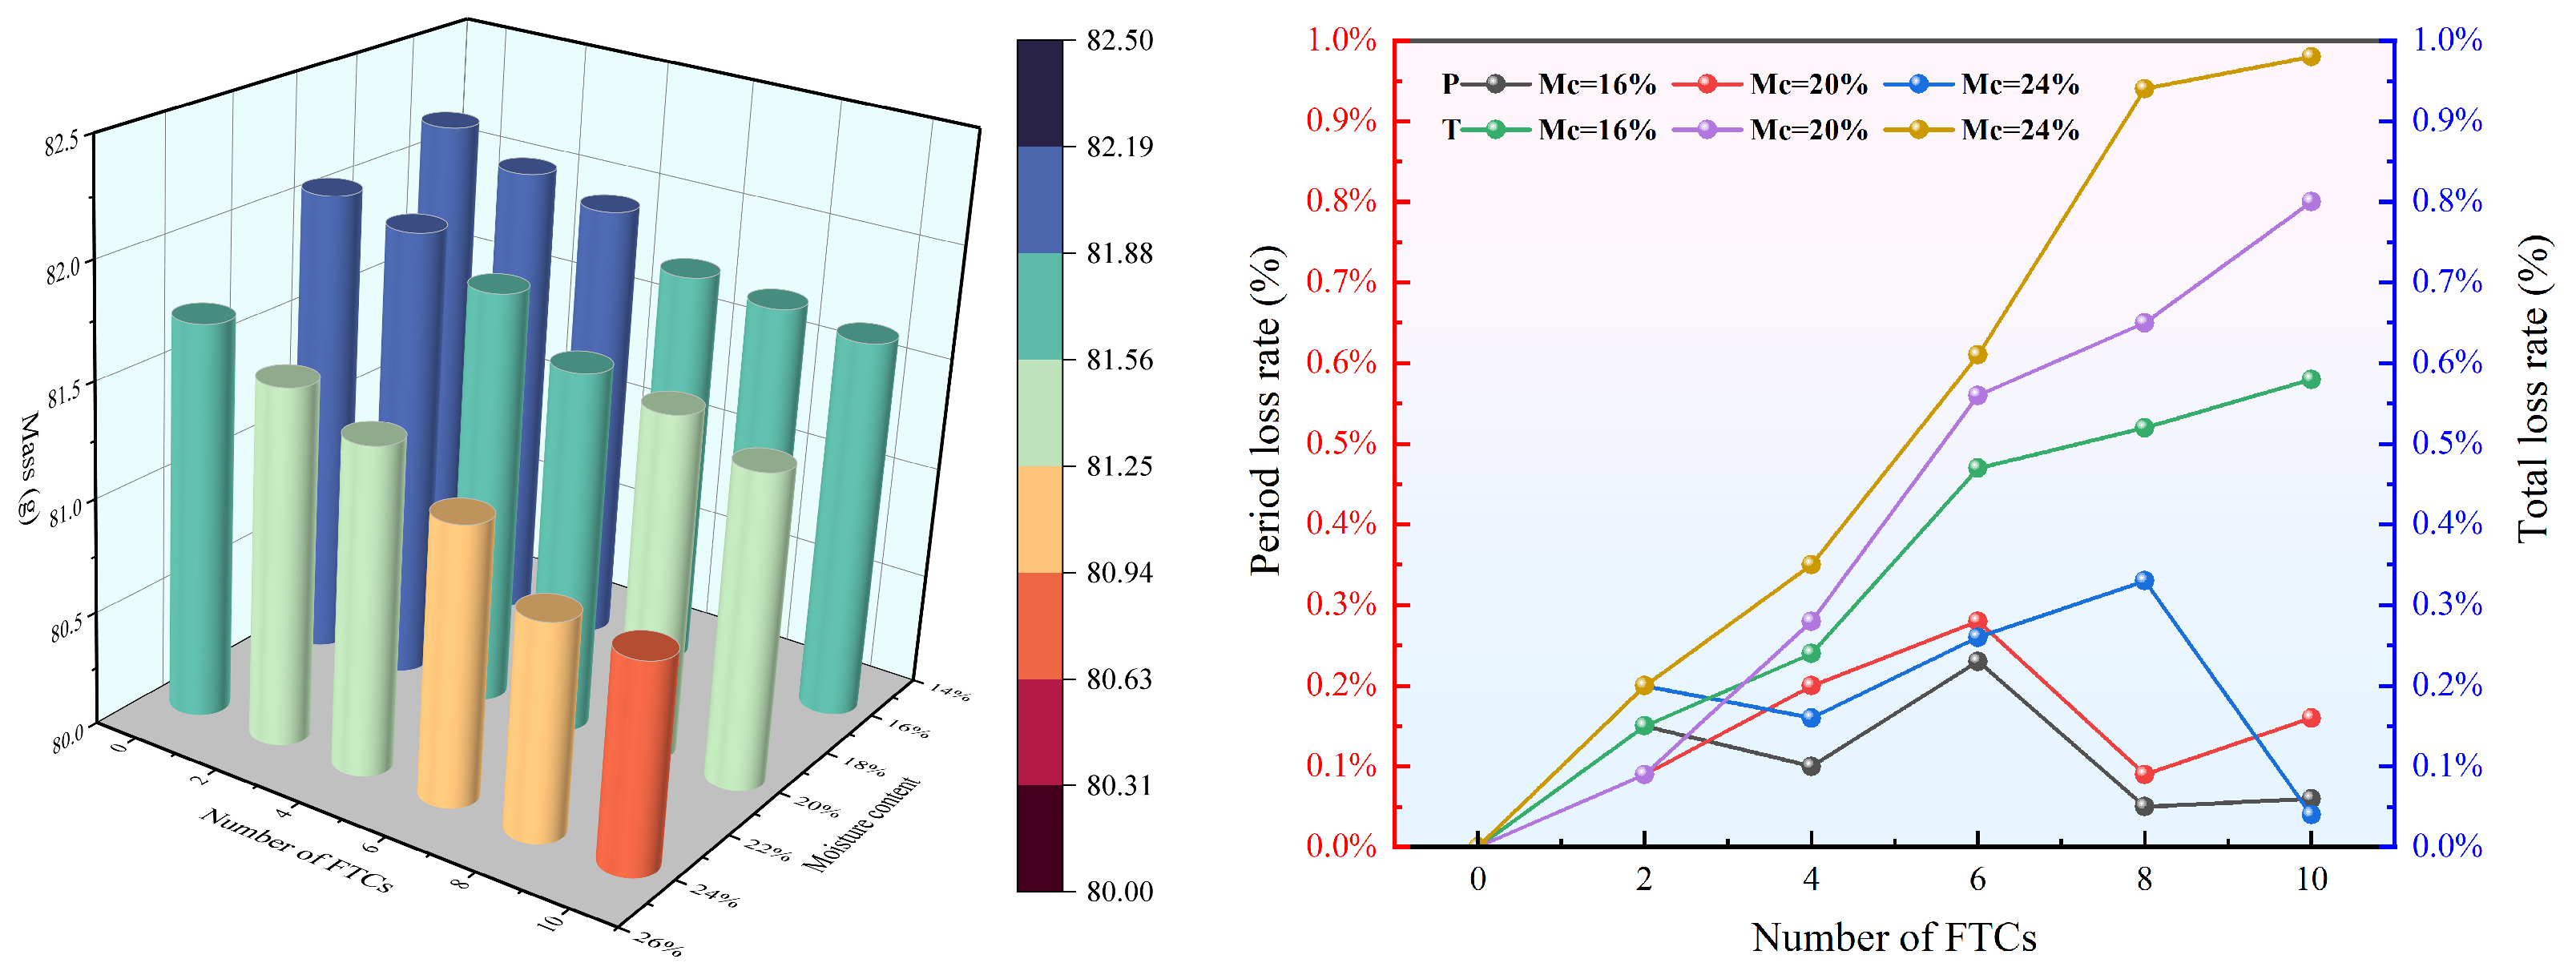
However, under the combined effects of temperature fluctuations and moisture content, the Hipparion laterite specimens exhibit localized exfoliation of particles, resulting in a noticeable change in the quality of the specimens [
74]. As shown in
Figure 10, the mass loss of the Hipparion laterite specimens increased with the number of F-T cycles, ranging from 0.48 to 0.8 g. The most significant mass loss occurred between 2 and 6 F-T cycles, with a loss rate of 0.09% to 0.28%. Subsequently, the loss rate decreased and stabilized. Overall, the total mass loss ranged from 0.58% to 0.98%, lower than that of typical loess.
Overall, the Hipparion laterite specimens exhibited minimal deterioration after two F-T cycles. However, significant deterioration occurred between 4 and 8 cycles, after which the deterioration rate stabilized.
3.2. Macroscopic Mechanical Properties of Hipparion Laterite Under F-T Effect
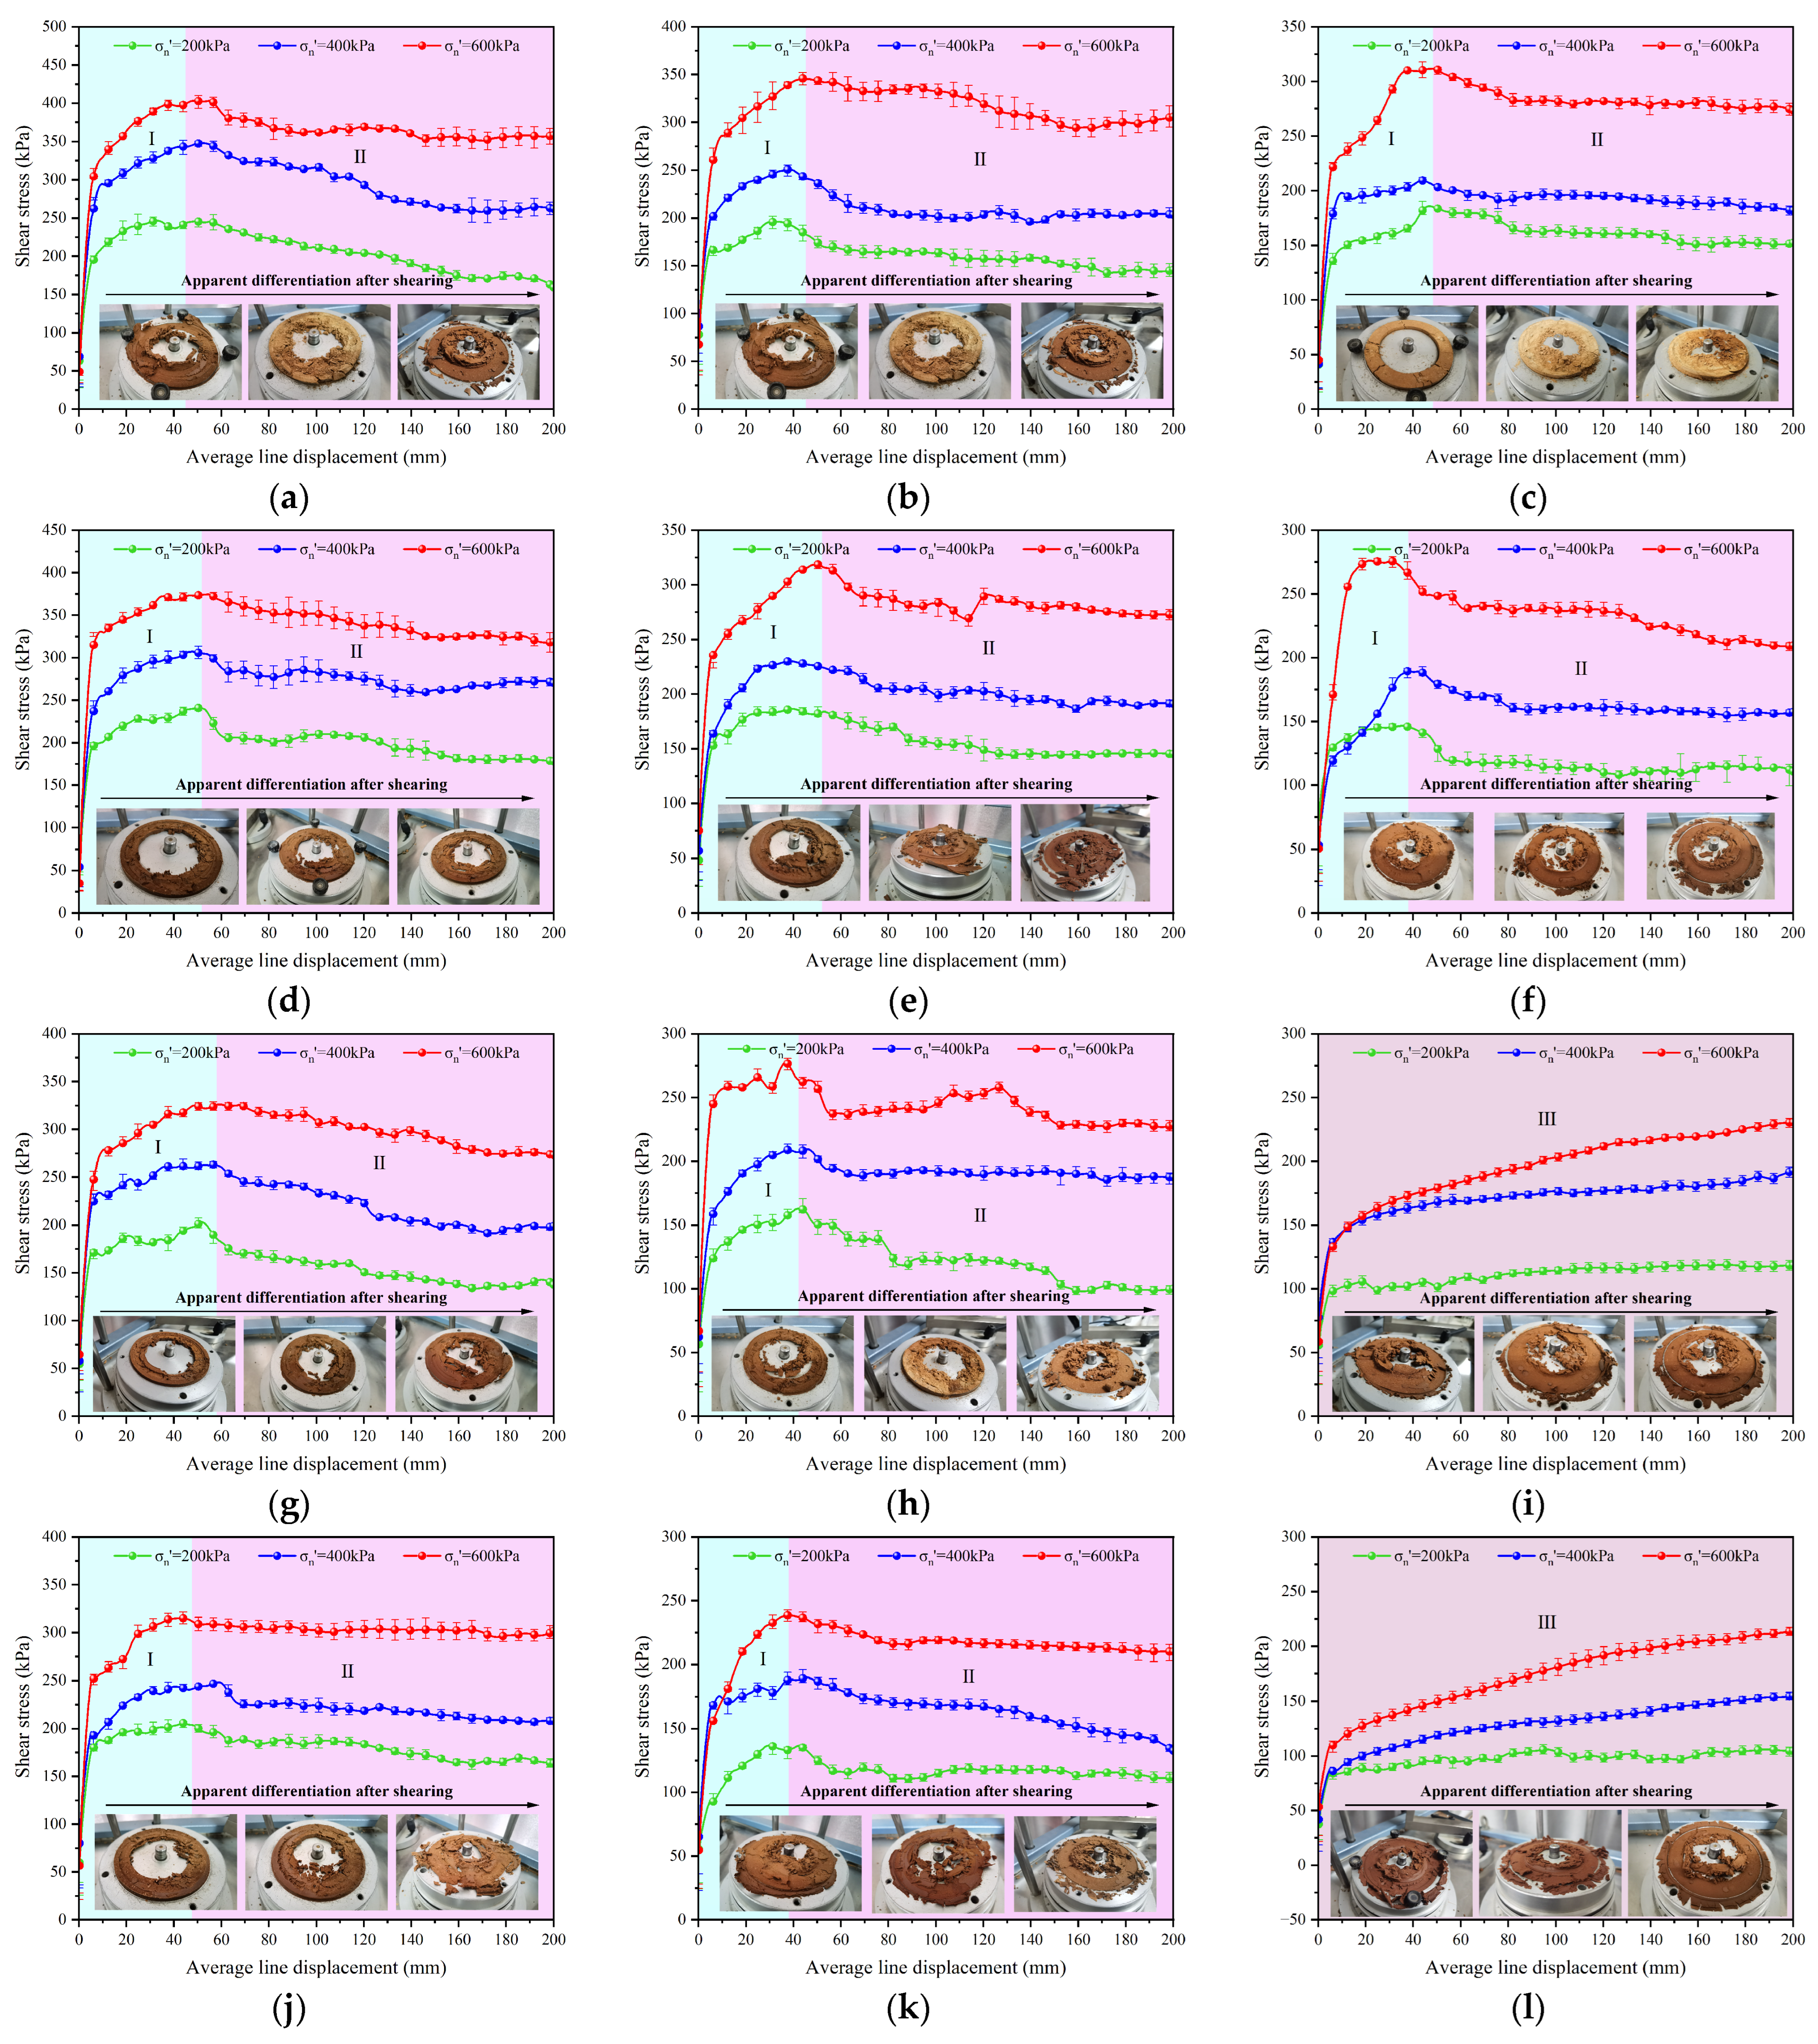
Hipparion laterite specimens with varying initial moisture contents showed distinct pre- and post-F-T behavioral contrasts. Shear mechanical tests under varying normal stresses revealed three characteristic stages in the shear stress–displacement curves (
Figure 11):
Stage I: Strain Development. This stage represents the strain growth process. Shear displacement drives progressive stress accumulation, marked by linear stress escalation.
Stage II: Strain-Softening. Post-peak stress, a progressive decline occurs until residual strength stabilization.
Stage III: Strain-Hardening. Persistent shear-induced hardening emerges, with initial rapid strengthening followed by decelerated resistance gain.
Under low moisture content conditions (16% and 20%), the shear stress–displacement curves primarily exhibit a transition from Stage I to Stage II. The average linear displacements at the peak stress points ranged from 37.8 to 58.3 mm. In contrast, under conditions of 6 to 10 F-T cycles and a high moisture content (24%), the entire Stage III process was evident. In the early stage of the F-T cycle, the shear failure of specimens involved increased the penetration of fine particles into cracks, resulting in more pronounced shear surfaces with greater undulations. As the moisture content increased, the shear surface exhibited liquefaction or even high degrees of liquefaction, with a reduction in fine particles and an increase in coarse particles. Portions of the specimen were extruded laterally along the inner and outer ring surfaces, adhering to the shear ring, resulting in a smaller overall difference in shear surface undulation. In the middle and late stages of the F-T cycle, specimens reached peak strength at lower shear stresses, indicating increased susceptibility to shear failure.
The strength degradation characteristics of Hipparion laterite under F-T cycles reveal significant moisture-dependent behavior. After 10 F-T cycles, specimens with varying initial moisture contents exhibited reductions in peak strength (46.27–96.93 kPa) and residual strength (48.72–70.66 kPa), corresponding to total degradation rates of 18.24–51.54% and 20.89–43.67%, respectively. The most severe deterioration occurred within the first six cycles, with cycle-specific degradation rates reaching 18.96–38.79% (peak strength) and 27.97–28.85% (residual strength). Beyond eight cycles, strength variations stabilized, indicating entry into an F-T equilibrium phase. Notably, higher moisture contents exacerbated strength loss, with maximum reductions of 116.25 kPa (peak) and 93.38 kPa (residual), both exceeding 50% total degradation. A strong positive correlation was observed between normal stress and shear stress across all conditions. These findings conclusively demonstrate the coupled influence of F-T effects and initial moisture content on the mechanical degradation of Hipparion laterite.
The deterioration of mechanical properties in Hipparion laterite induced by F-T cycling is predominantly manifested through alterations in shear strength parameters, specifically a marked reduction in cohesion (
c) and the internal friction angle (
φ) [
75].
According to the Mohr–Coulomb shear mechanical strength theory, the normal stress acting on Hipparion laterite in the slip zone is related to both the peak and residual shear stresses, as described by the following equations:
In the equation,
τp and
τr represent the peak shear strength and residual shear strength of the soil, respectively, expressed in kPa;
cp and
cr denote the peak cohesion and residual cohesion of the soil, also in kPa;
σ is the effective normal stress in kPa; while
φp and
φr correspond to the peak internal friction angle and residual internal friction angle of the soil, measured in degrees (°).
Based on these equations, the peak and residual shear strengths of Hipparion laterite specimens with varying numbers of F-T cycles and initial moisture contents were statistically determined and are presented in
Figure 12.
Nonlinear curve fitting was applied to the test data to establish a functional relationship between the number of F-T cycles and soil shear strength. The cohesion and internal friction angle exhibit distinct functional relationships with F-T cycles: the former conforms to a monotonically decreasing modified exponential function, while the latter angle follows a monotonically increasing exponential function. The relationships are as follows:
In the equation,
C represents the cohesion (kPa),
φ denotes the internal friction angle (°), and
N signifies the number of F-T cycles. The parameters
m,
n,
t,
a, and
b are fitting constants derived from experimental data regression.
Overall, the peak and residual cohesion of the Hipparion laterite specimens decreased with increasing numbers of F-T cycles and increasing moisture content. In contrast, the peak and residual internal friction angles exhibited a less consistent pattern with slight fluctuations. However, there was a general upward trend although the differences were minimal. For peak cohesion, losses of 26.76 kPa, 18.44 kPa, and 21.29 kPa were observed during 4 to 8 F-T cycles, respectively. From 8 to 10 cycles, the curve became slower with smaller slopes, and the strength remained almost constant. The residual cohesion of the Hipparion laterite specimen with 16% moisture content decreased by 34.17 kPa after two F-T cycles, representing a deterioration rate of 24.03%, highlighting the significant effect of F-T cycles. Subsequently, the slope of the curve line decreased, and the magnitude of the change became roughly similar to that of the peak cohesion. In contrast, the variation in the residual internal friction angle slightly differed from that of the peak internal friction angle. During the 2nd to 4th F-T cycles, the residual internal friction angles for different moisture contents reached low values of 15.77°, 13.29°, and 14.91°, respectively. These values then gradually increased, with a higher total growth rate observed within the 0th to 10th cycle range, although this rate remained lower than that of the peak internal friction angle. This finding is consistent with observations of F-T damage in red sandstone [
76,
77].
3.3. Microscopic Evolutionary Properties of Hipparion Laterite Under F-T Effect
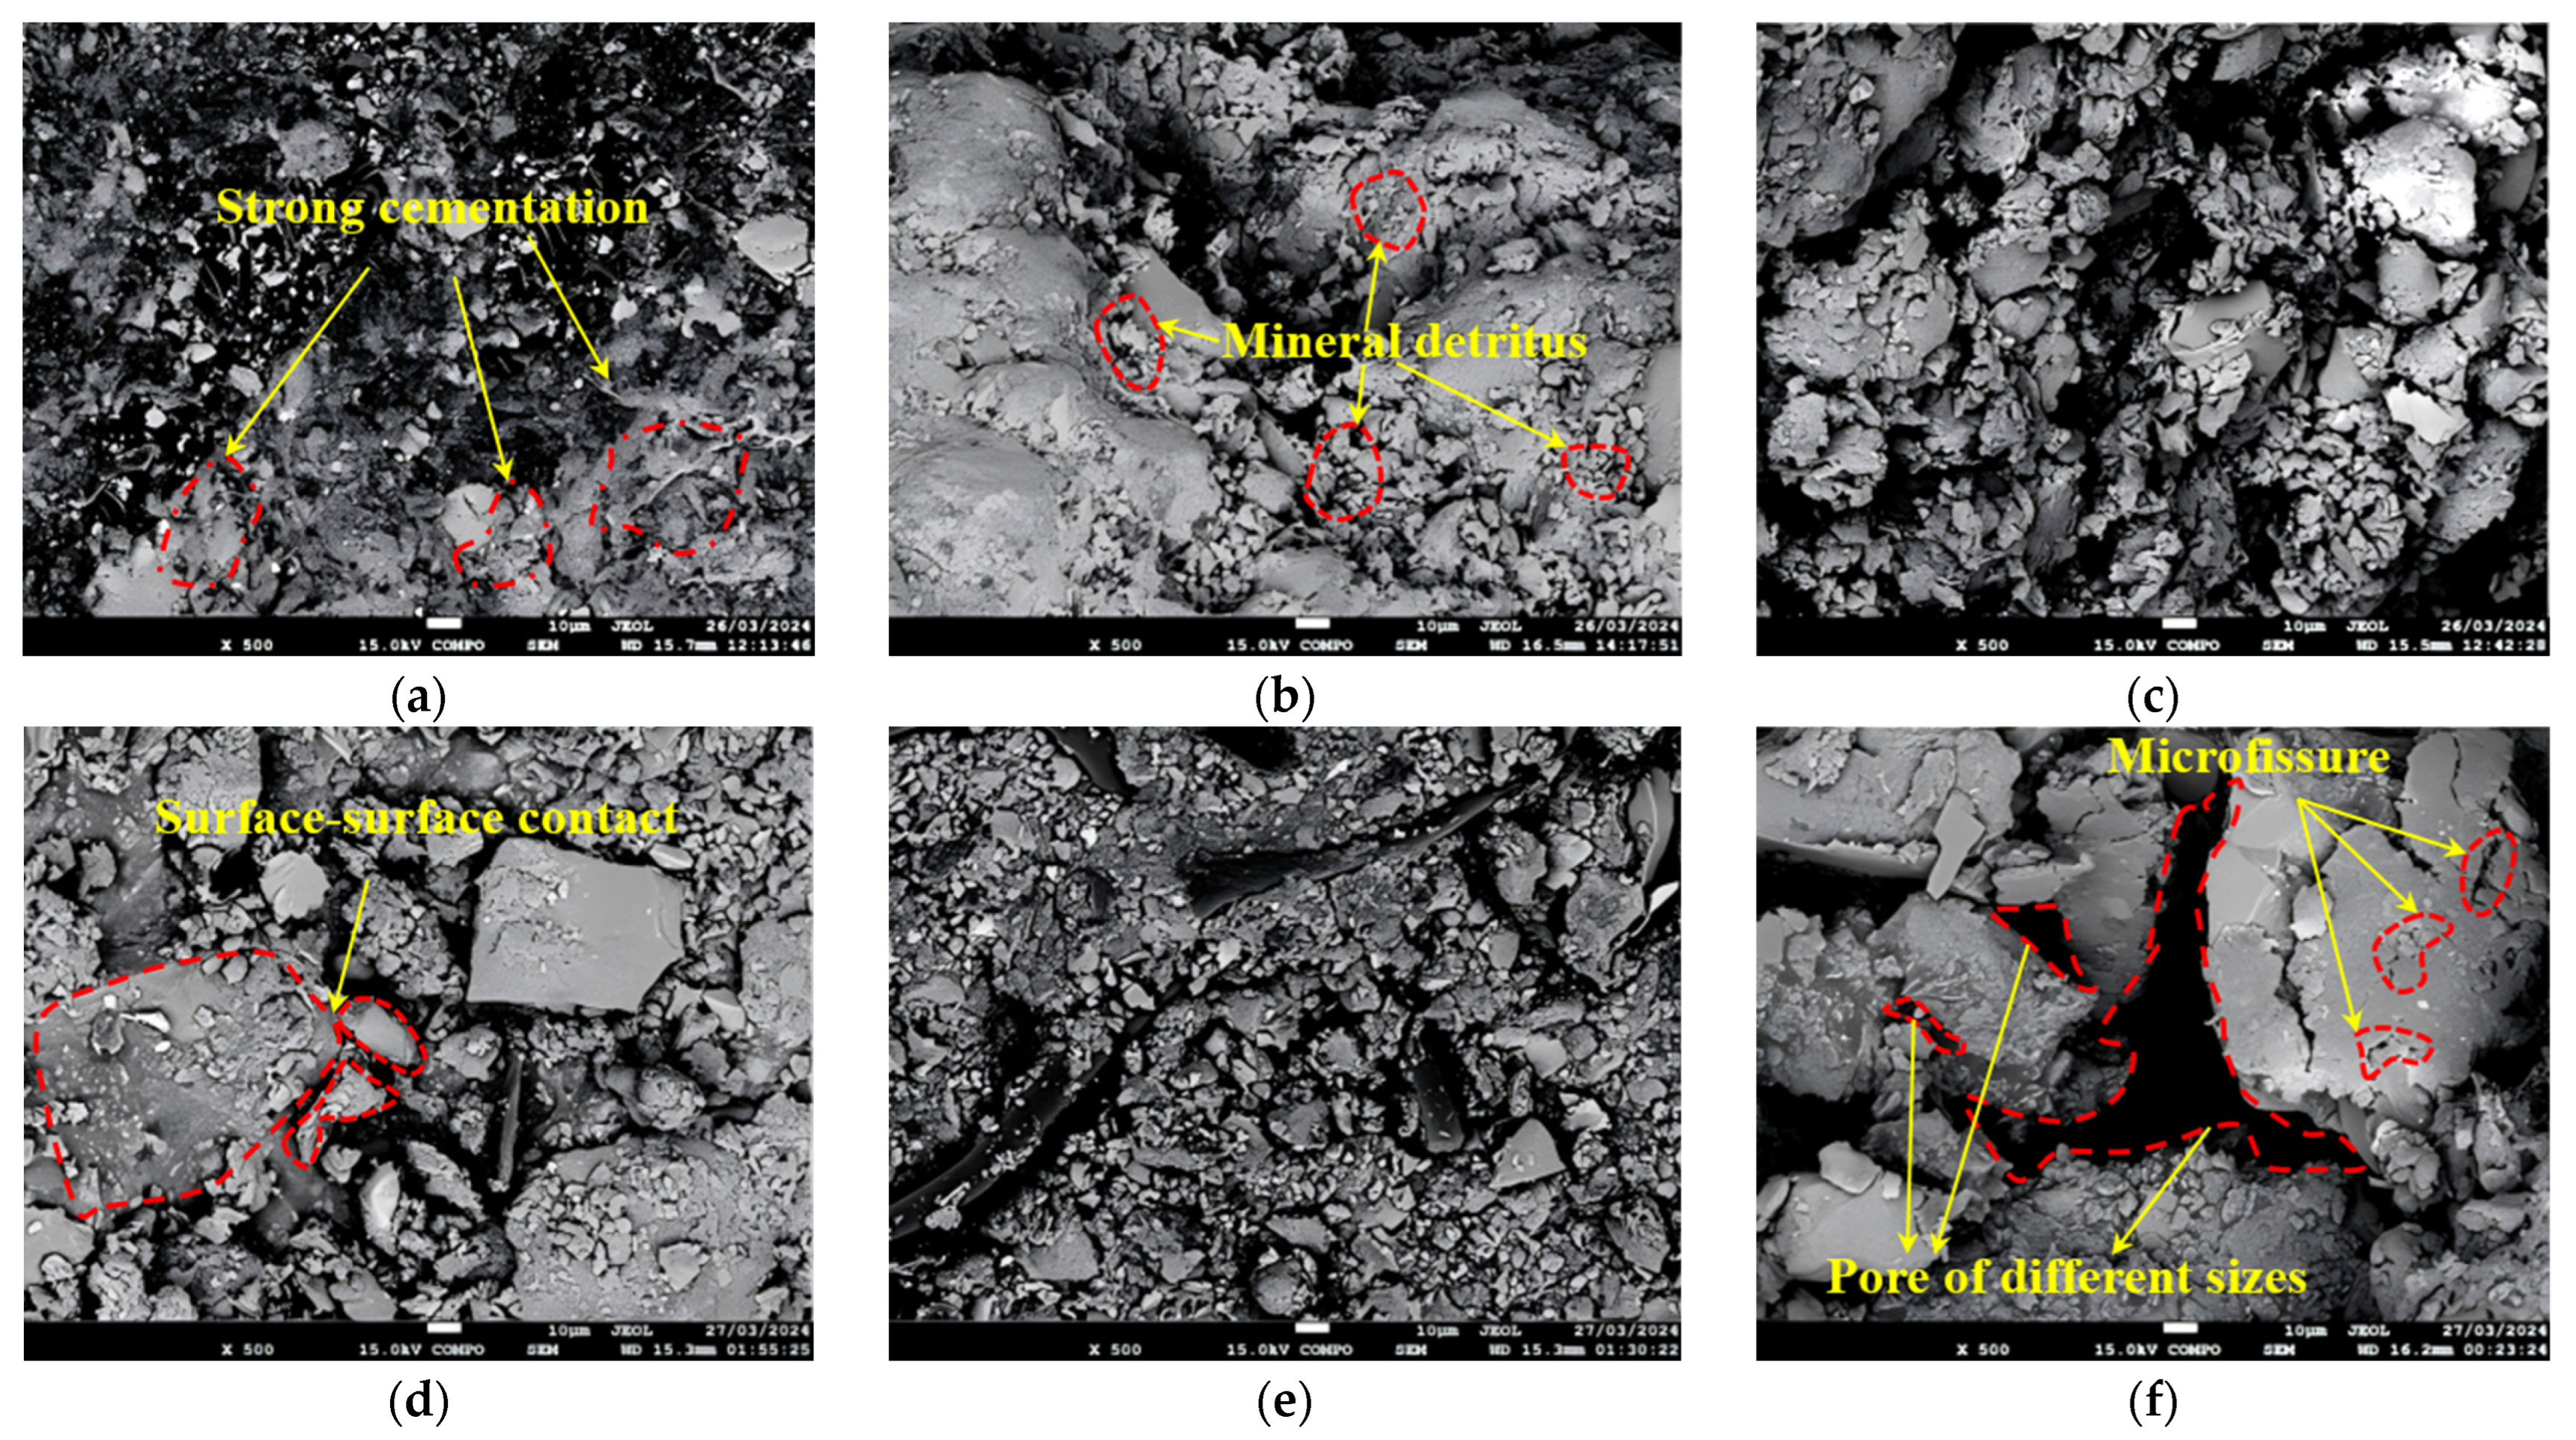
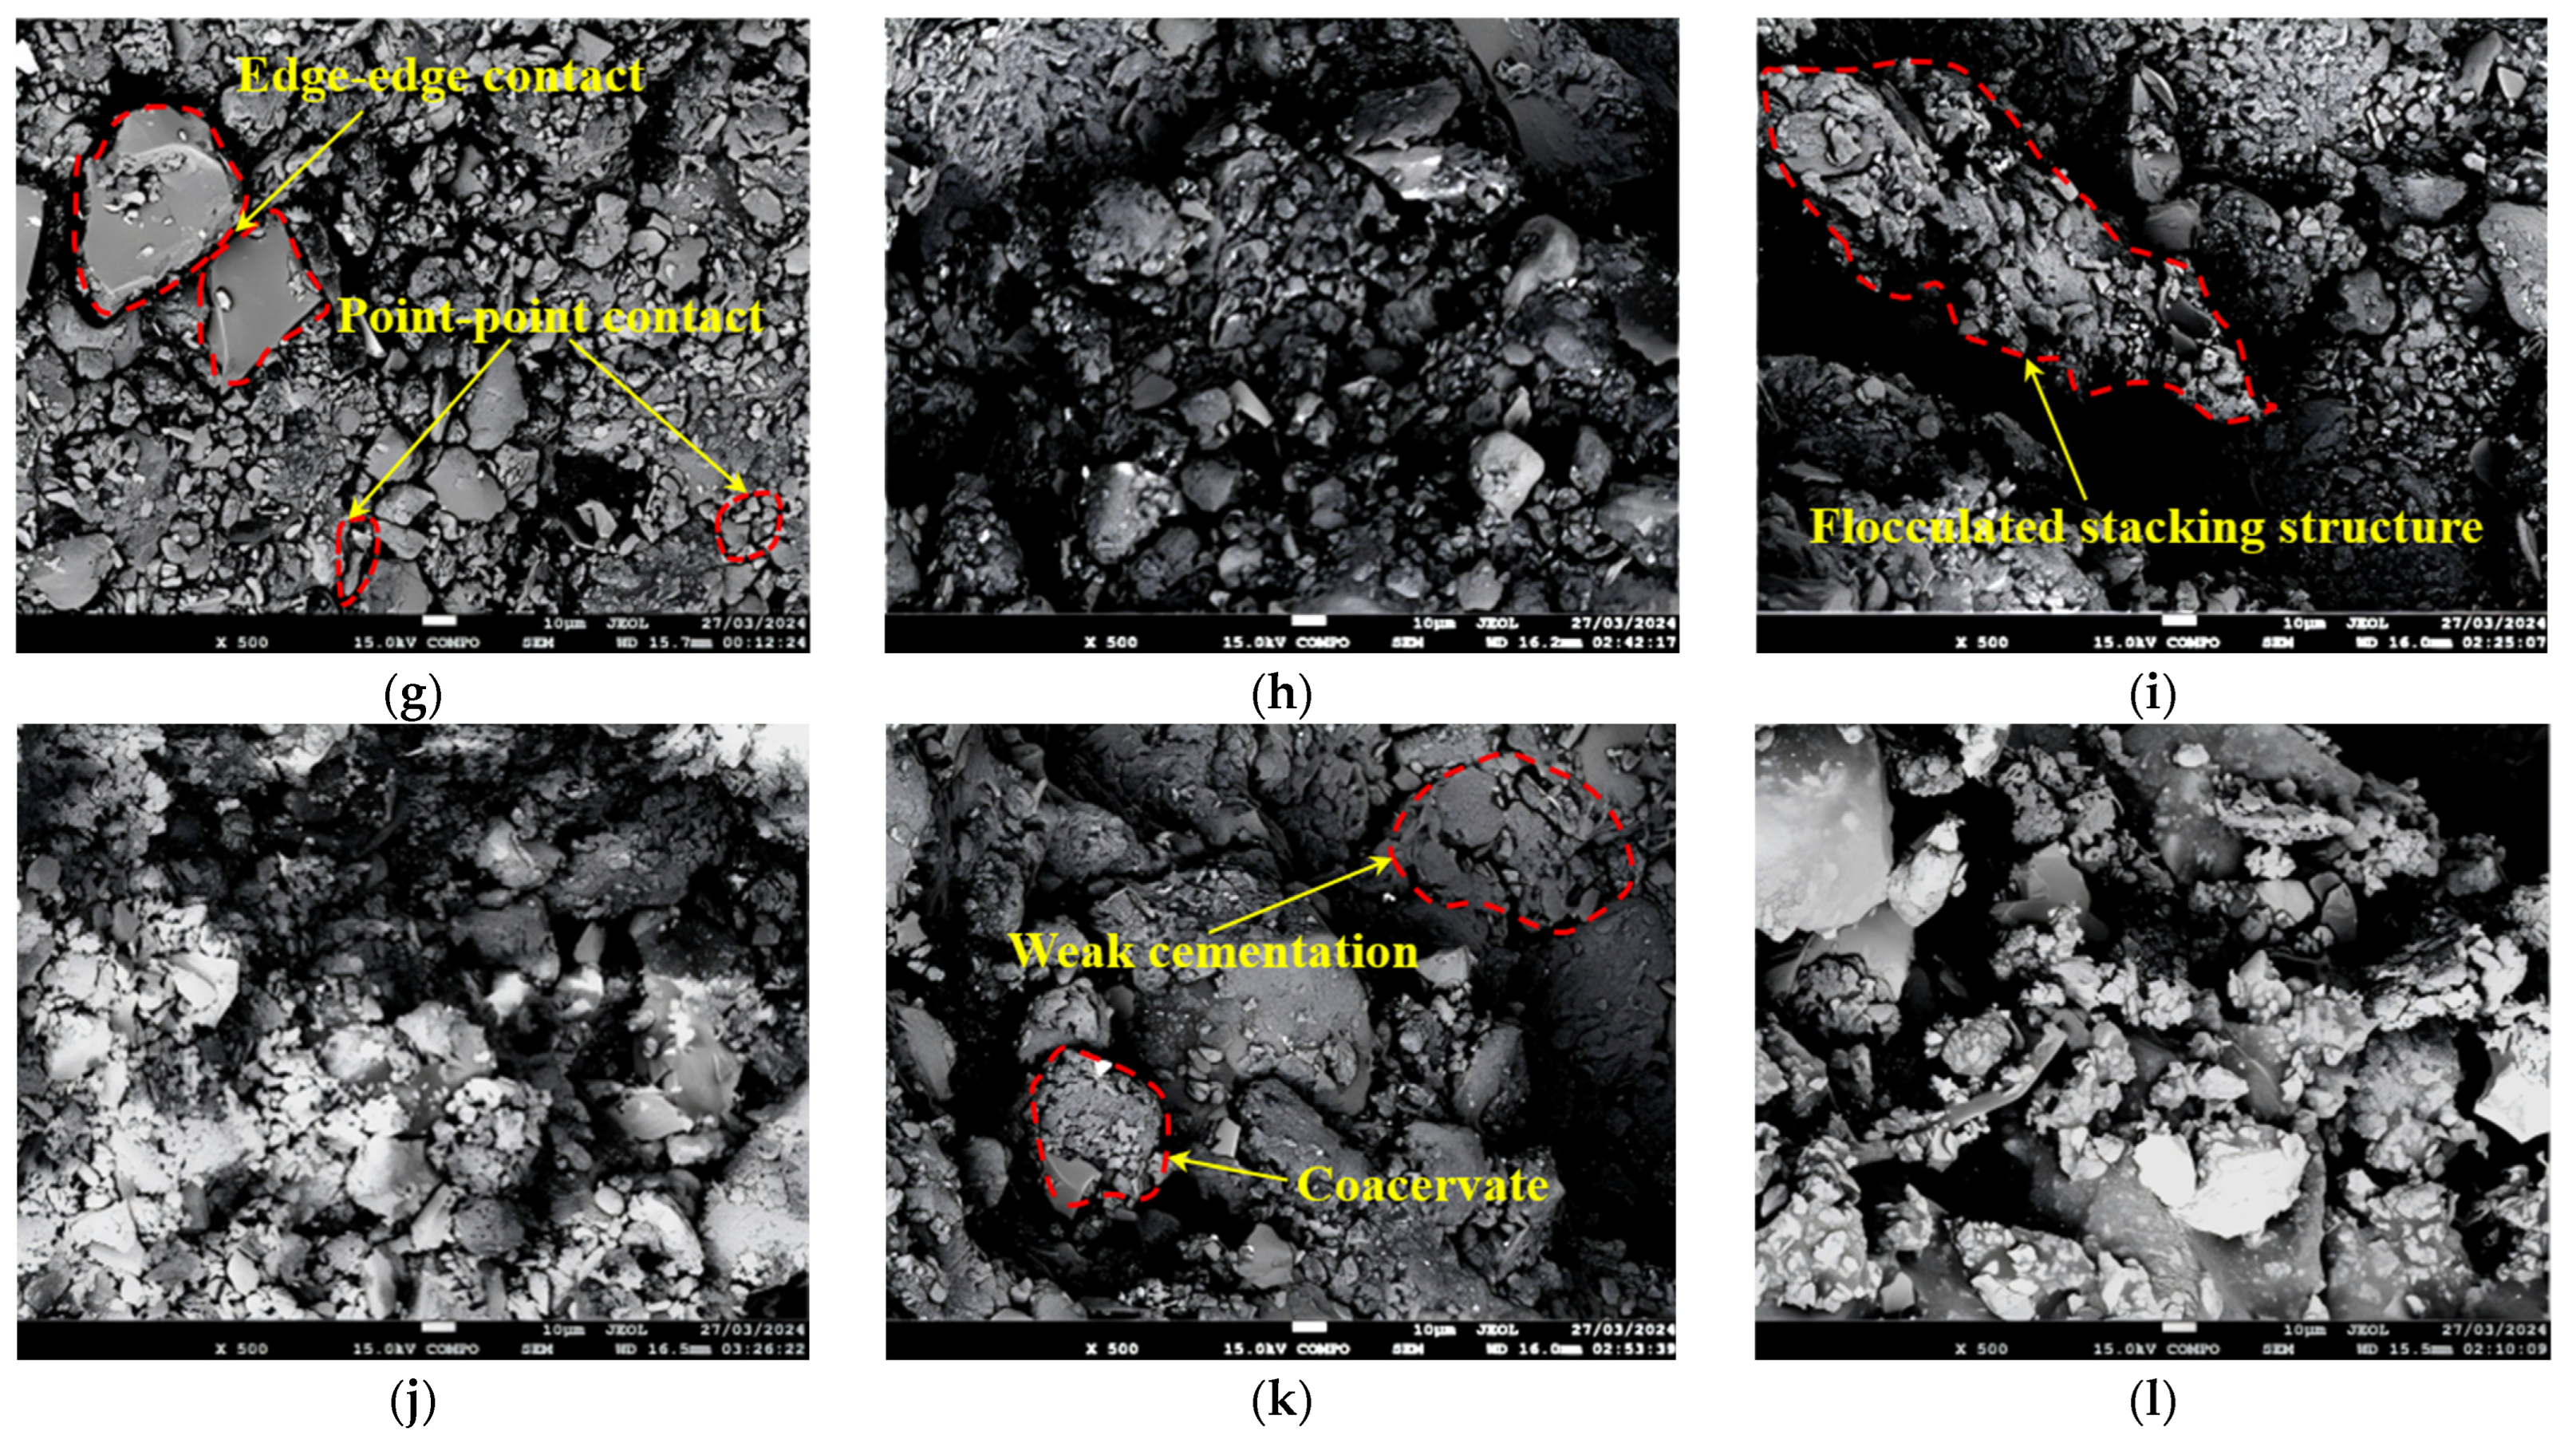
Figure 13 presents a total of 12 sets of SEM images of Hipparion laterite specimens with different initial moisture contents subjected to 0, 2, 6, and 10 F-T cycles at a normal stress of 200 kPa. The images were captured at an actual magnification of ×500.
Hipparion laterite specimens with a low moisture content (16% and 20%) in their unfrozen and thawed states exhibit a dense structure with high clay mineral content. Soil particles are primarily held together by the strong cementation of fine soil particles, such as clay and sand, mainly through face-to-face contact. In contrast, Hipparion laterite with a high moisture content (24%) exhibited a looser structure and higher pore content. In the early stage of F-T cycling, soil particles agglomerate into flakes and strips, with mineral fragments and fine particles adhering to the surface of coarse particles [
78]. This weakens the intergranular bonds, leading to the formation of pores, microfissures, and an increase in pore diameter. As the F-T effect intensifies, the content of fine particles decreases and their bonding weakens, transitioning to a form of weak cementation. Simultaneously, the content of coarse particles increases, leading to larger intergranular spaces. The contact mode between particles shifts from face-to-face to point-to-point contact and edge-to-edge contact. This process is accompanied by a continuous increase in the number of pores and secondary microfissures. After 10 F-T cycles, the soil structure becomes severely degraded, with particles exhibiting a flocculated structure and a high degree of dispersion. No significant changes are observed in the intergranular space.
To quantitatively analyze the microstructural changes induced by F-T cycles in Hipparion laterite specimens with different initial moisture contents, the 500× magnification micrographs were ultimately selected for analysis after comparing the clarity, quality, and microstructural parameter information within the observation areas of SEM images at different magnification levels. The images were analyzed in RGB mode to define statistical ranges, and key measurement indices were selected, including the pore direction angle, pore circumference and area, average pore diameter, and pore fractal dimension. The data were analyzed in conjunction with previous research and theoretical models.
The two-dimensional apparent porosity and pore size distribution of Hipparion laterite specimens subjected to varying initial moisture contents and F-T cycles were determined. Pore size was classified into four categories: large pores (D > 32 μm), medium pores (32 μm > D > 8 μm), small pores (8 μm > D > 2 μm), and micropores (D < 2 μm). As shown in
Figure 14, with the number of F-T cycles increased, the microporous content of the specimens decreased, whereas the proportions of medium and small pores increased [
35]. Although the macroporous content showed a slight upward trend, the overall change remained insignificant. Notably, specimens with a 24% moisture content exhibited a reduction in the percentage of small pores and had a higher total average pore size than specimens with a lower moisture content (16% and 24%). The apparent porosity increased with the number of F-T cycles, with a steeper slope for specimens with a higher initial moisture content [
38,
53]. This trend suggests that a higher soil moisture content intensifies the deterioration caused by F-T cycles, emphasizing moisture content as a key factor influencing pore microstructure changes. The changes in porosity and the percentage of each type of pore are summarized in
Table 4.
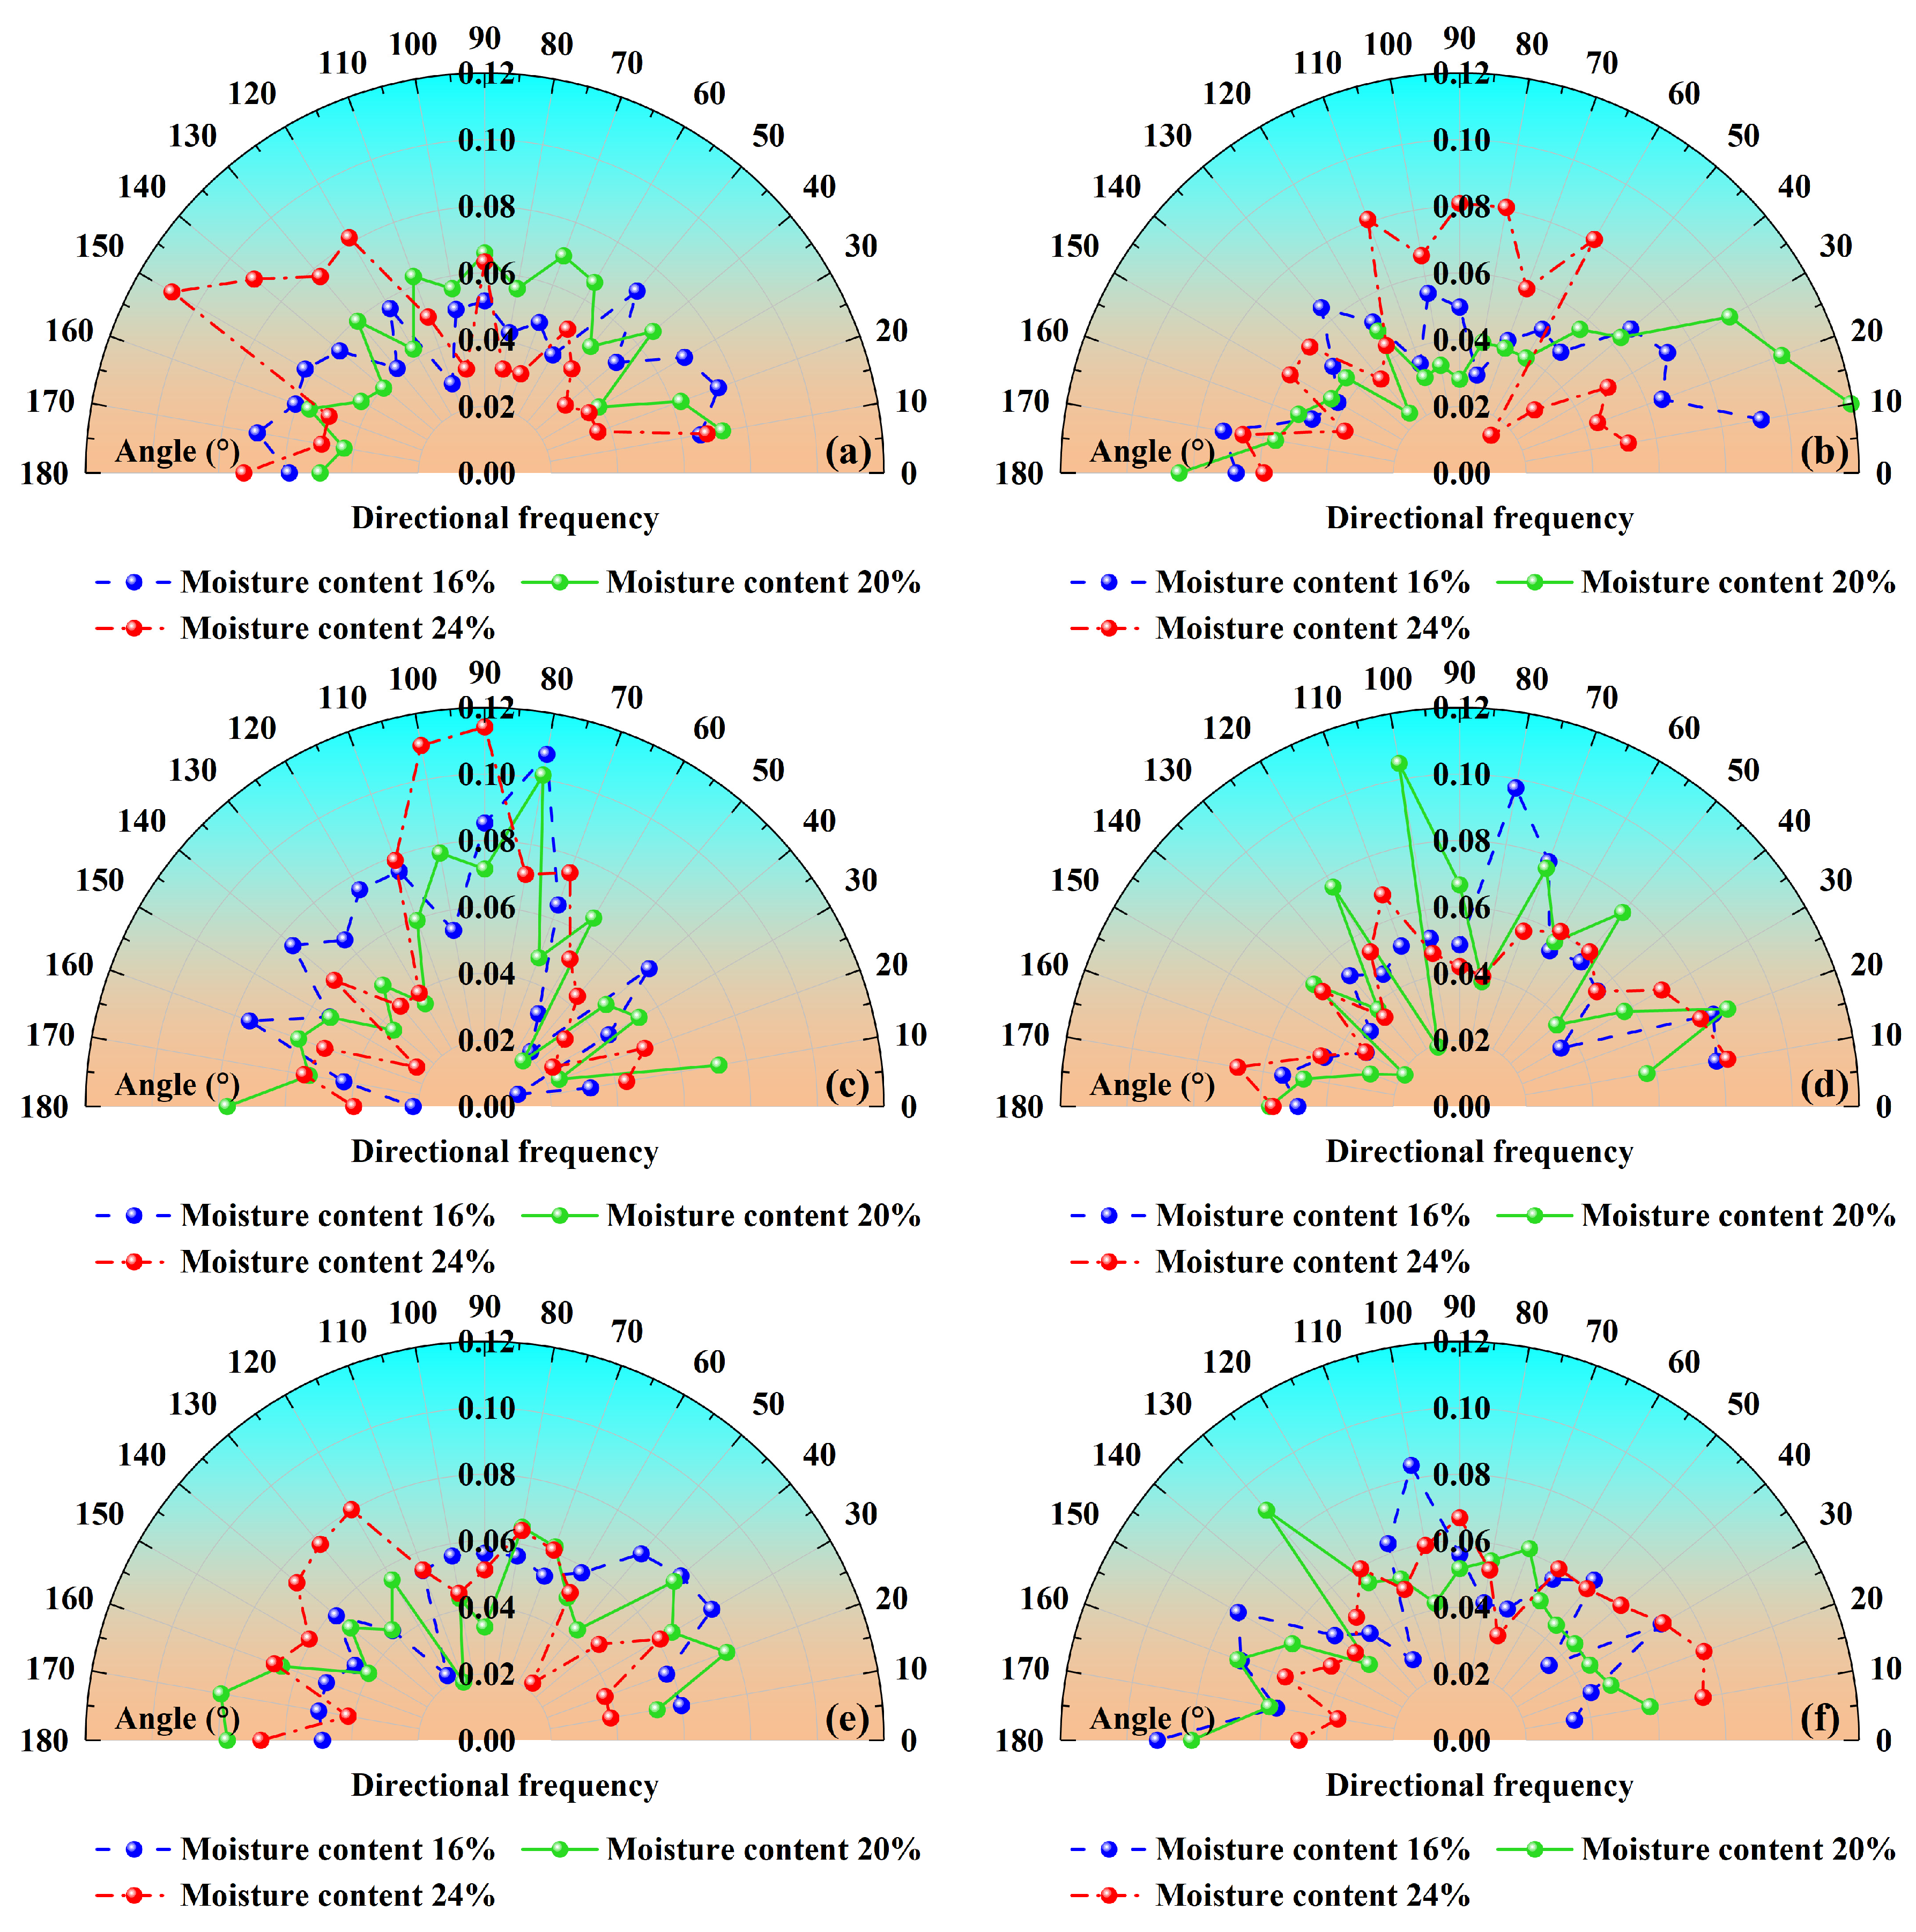
The combined effects of F-T cycles and moisture content disrupt the soil’s original structure, leading to particle rearrangement and changes in pore orientation. The pore orientation angle, calculated using Equation (6), represents the angle between the pore’s long axis and the positive x-axis. To analyze the pore orientation distribution, the range from 0° to 180° was divided into 18 intervals. The orientation frequency of each interval is determined by the percentage of pores within that range. The orientation frequency of pores is calculated and expressed by Equation (7) as follows:
In the equation,
α represents the pore orientation angle, defined as the angle between the major axis of a pore and the horizontal direction;
α′ denotes the adjusted pore orientation angle, derived through transformation scenarios ①, ②, and ③;
F(
α′) signifies the orientation frequency, where
nα′ corresponds to the number of pores within a specific orientation interval of
α′, and
n is the total number of pores in the analyzed region.
According to
Figure 15a,b, Hipparion laterite specimens with a low moisture content (16% and 24%) exhibit a more uniform degree of pore orientation in their unfrozen and thawed state. For specimens with 24% moisture content, the pore orientation angle was concentrated between 120° and 150°. After two F-T cycles, the low-moisture specimens exhibited a shift towards a 0–10° orientation, while the high-moisture specimens shifted to 60–110°. After 4 and 6 F-T cycles, the pore orientation angles for all moisture content specimens were concentrated in the near-vertical range of 70°–100° (
Figure 15c,d. As the F-T effect intensifies, the pore orientation angle is redistributed, gradually reaching equilibrium and stabilization after 8 and 10 cycles (
Figure 15e,f, accompanied by a significant weakening of the pore orientation.
Overall, the degree of pore orientation is a complex process influenced by moisture content and F-T cycles [
17,
18]. The probabilistic entropy and oriented fractal dimension serve as tools to visualize and quantify the orderliness of the pore orientation. These parameters are described by the following theoretical equations:
In the equation,
Pe denotes the probability entropy, which quantifies the organizational orderliness of pore arrangements, while
Df represents the directional fractal dimension, characterizing the preferential orientation degree of pores. This dual-parameter framework enables multiscale quantification of cryogenically altered pore networks, where
Pe inversely correlates with structural anisotropy and
Df reflects the hierarchical complexity of pore alignment patterns.
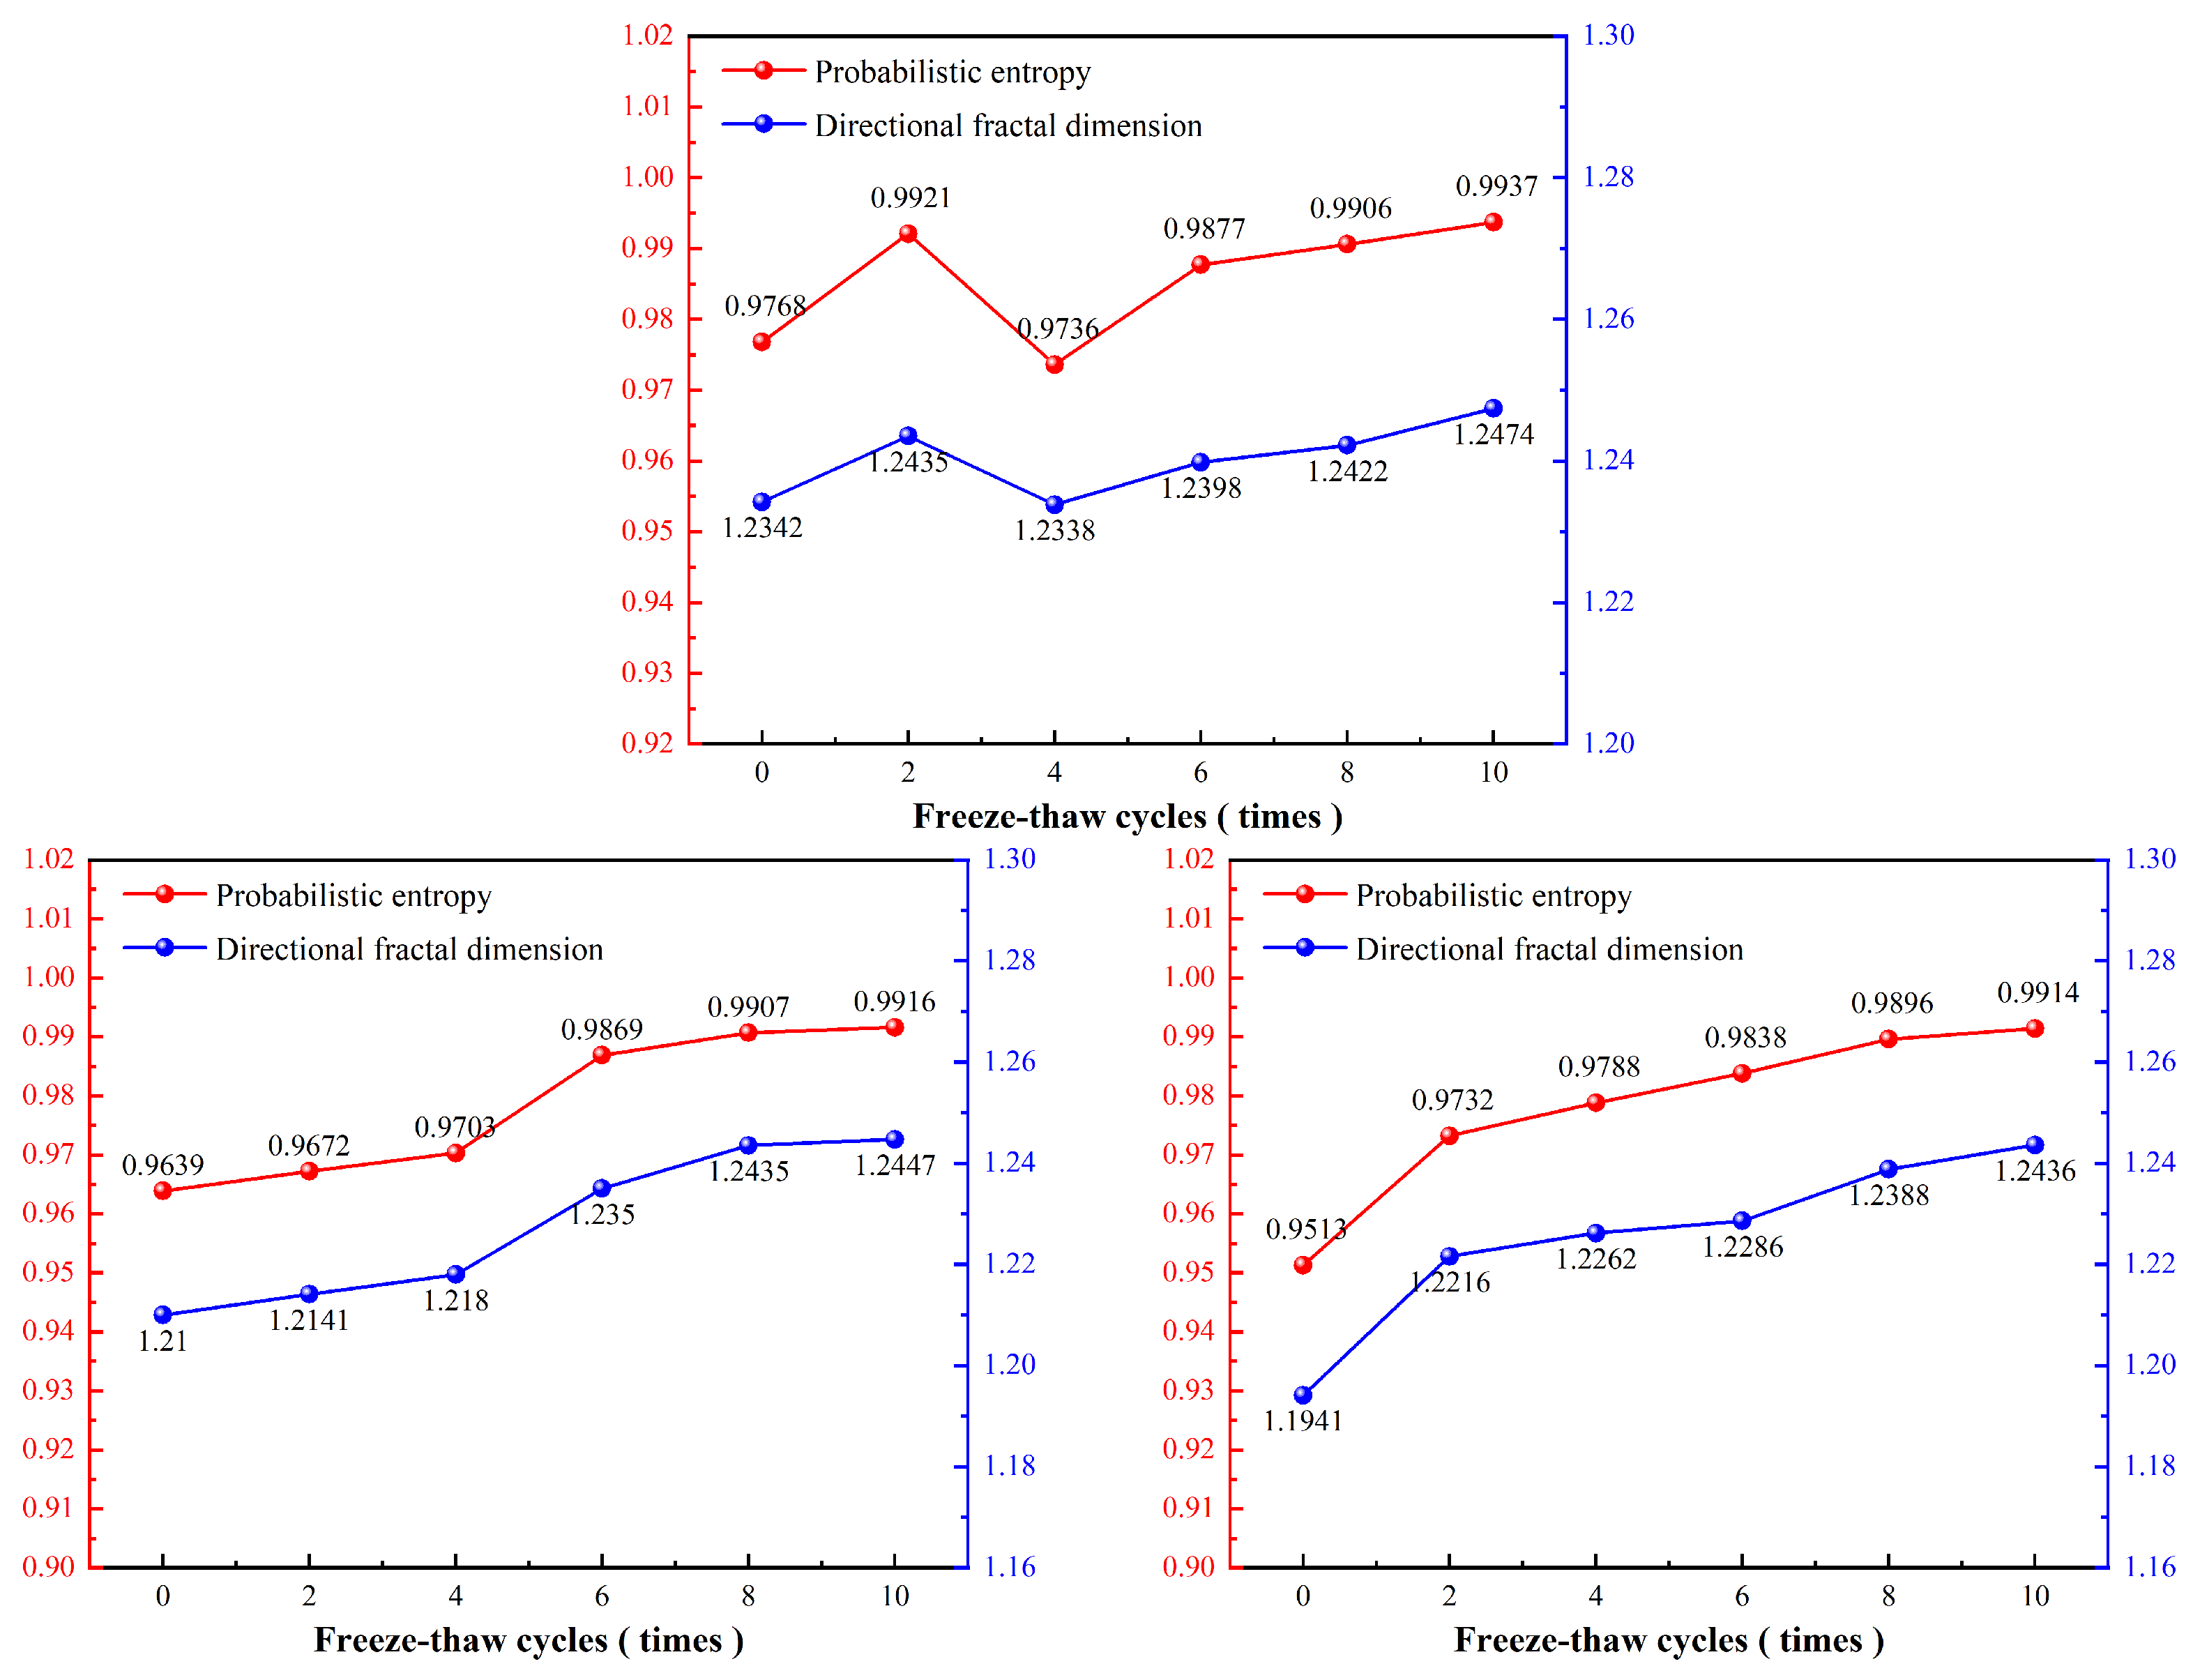
As shown in
Figure 16, the pore probability entropy of the sample ranges from 0.9513 to 0.9937, whereas the oriented fractal dimension varies between 1.1941 and 1.2474. As the moisture content and the number of F-T cycles increases, the probability entropy and the oriented fractal dimension exhibit a slow upward trend. This indicates that the arrangement of pore units becomes more complex and disordered, with no significant regularity, and that the degree of pore orientation remains poor. The increase in probability entropy values and fractal dimensions directly reflects the disordering progression of the pore–fissure network in Hipparion laterite. F-T cycles induce repeated ice crystal growth and melting within the soil, triggering the development and propagation of fissures and pores, which drives the transition of the soil structure from an ordered layered configuration (initially characterized by fractal dimensions) to a disordered porous network. This entropy-increasing process exhibits a significant positive correlation with shear strength attenuation under F-T effects. The variation patterns of these two microscopic parameters provide theoretical guidance for early warning of slope weakening.
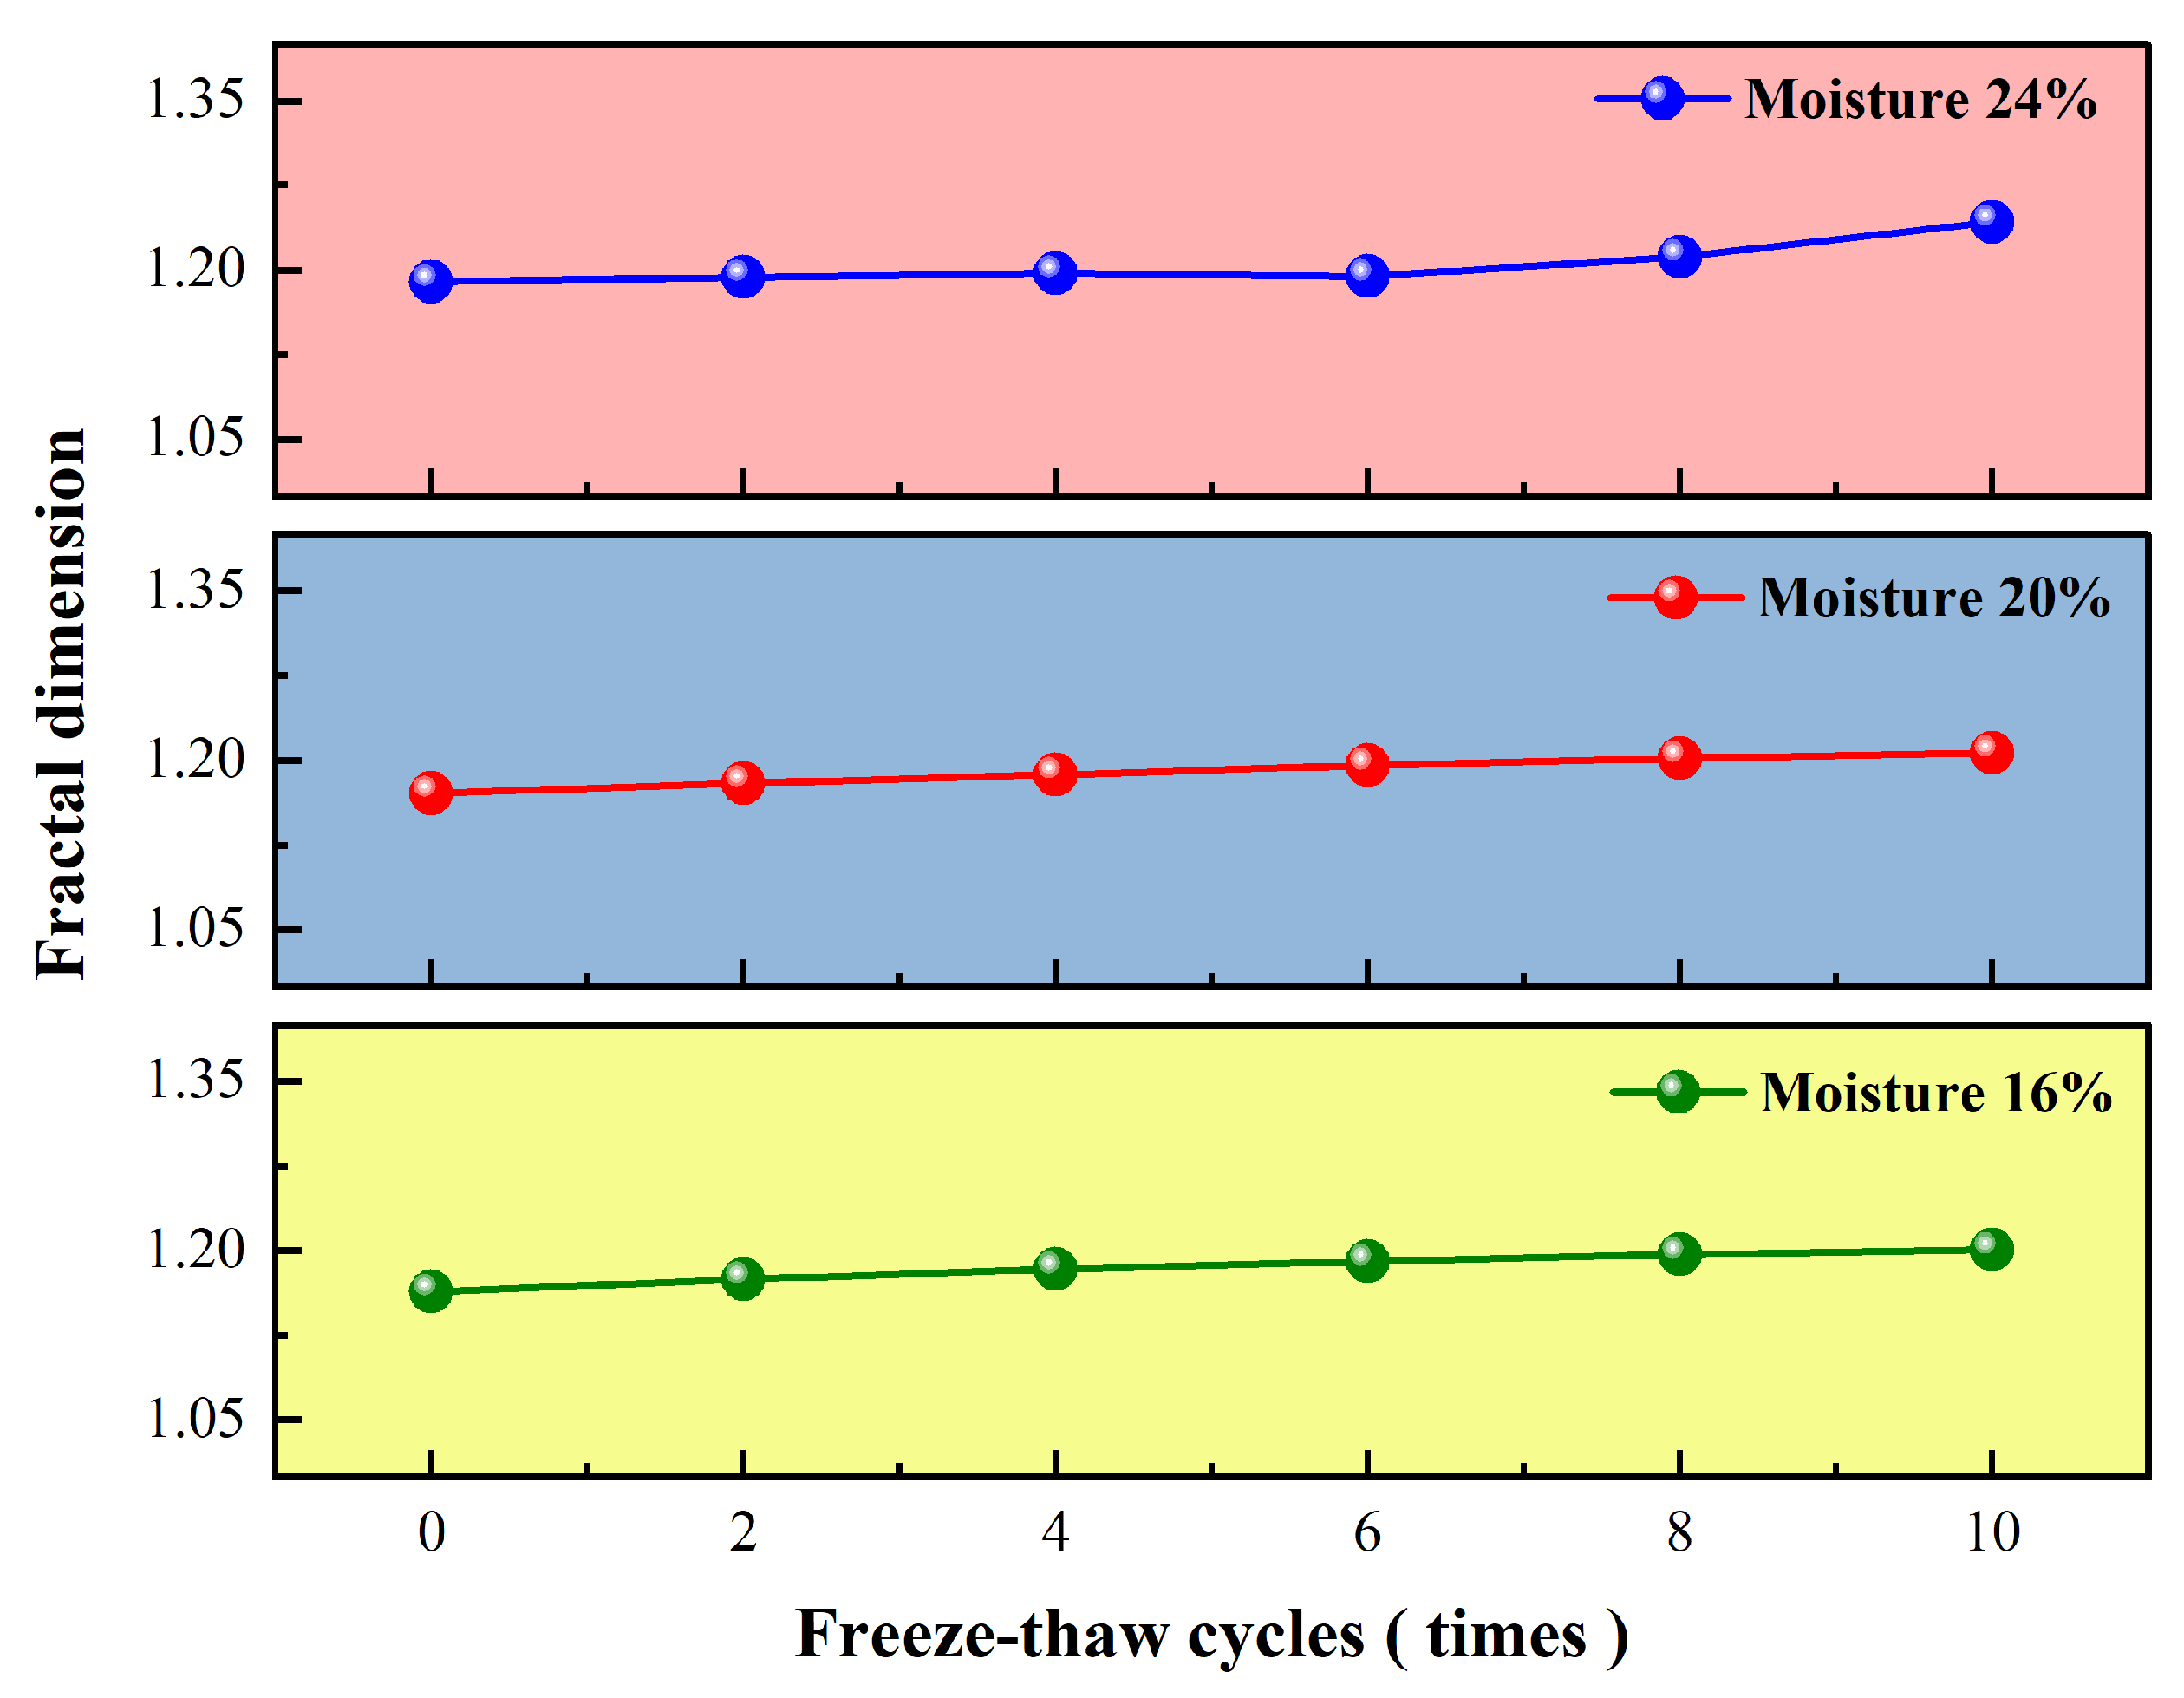
To better understand the influence of F-T cycles and moisture content on pore and fissure development, information such as the pore fractal dimension was extracted from these SEM images. Fractal dimension analysis was used to quantify the degree of pore and fissure development, with higher values indicating greater complexity and fragmentation. As shown in
Figure 17, the average fractal dimension increased with the number of F-T cycles, ranging from 1.1645 to 1.2478 at different initial moisture content levels. The Hipparion laterite specimen with 16% moisture content exhibited a linear increase in elasticity during the initial six F-T cycles, followed by a slower rate. Conversely, specimens with 20% and 24% moisture content showed greater sensitivity between 4 and 8 F-T cycles, while showing more stability at the beginning and end of the F-T period.
In general, F-T cycles have a significant impact on specimens with a higher moisture content, leading to accelerated pore and microfracture development and subsequent degradation of physical and mechanical properties.
4. Discussion
This study investigates the mechanical degradation of Hipparion laterite under F-T cycles and moisture variations through F-T ring-shear tests, with particular emphasis on cohesion and the internal friction angle. SEM analysis revealed that F-T actions significantly disrupt soil structure, fragmenting macro-aggregates into smaller particles and increasing pore volume. The high clay content enhances unfrozen water adsorption, expanding interparticle water film thickness and amplifying particle separation. Consequently, residual cohesion decreased by 49.61% after 10 F-T cycles—a trend consistent with intact loess at a lower moisture content (18%) [
8]. At elevated moisture levels (24%), cohesion loss reached 65.23%, whereas dispersive soils achieved comparable degradation at 16.76% moisture [
56], demonstrating the superior initial structural integrity and mechanical strength of Hipparion laterite. The marginal increase in the residual friction angle (<5°) was attributed to stress redistribution during cyclic water phase transitions, which promoted particle rearrangement and enhanced intergranular friction through optimized grain packing. These findings conclusively indicate that shear strength degradation primarily stems from cohesion loss, while moisture-induced structural weakening remains a critical contributing factor.
The sensitivity of clay particles to water leads to volumetric expansion and softening. F-T cycles disrupt the soil structure, causing surface and internal deformation and deterioration, ultimately reducing the mechanical strength of Hipparion laterite [
79].
Water flow under varying temperatures and stress conditions can disrupt interparticle bonds, leading to alterations in the intergranular and pore structure, which in turn affects the mechanical strength of soil. Essentially, free and bound water, distributed throughout the soil, undergoes infiltration, flow, diffusion, and migration driven by intergranular forces and water potential. This leads to changes in particle-to-particle contact and arrangement and to the dynamic evolution of intergranular pore spacing. After experiencing multiple F-T cycles, the structure and properties of Hipparion laterite soil transition from a super-consolidated state to a softer state. This change is accompanied by an increase in water absorption and a rapid decline in the mechanical strength.
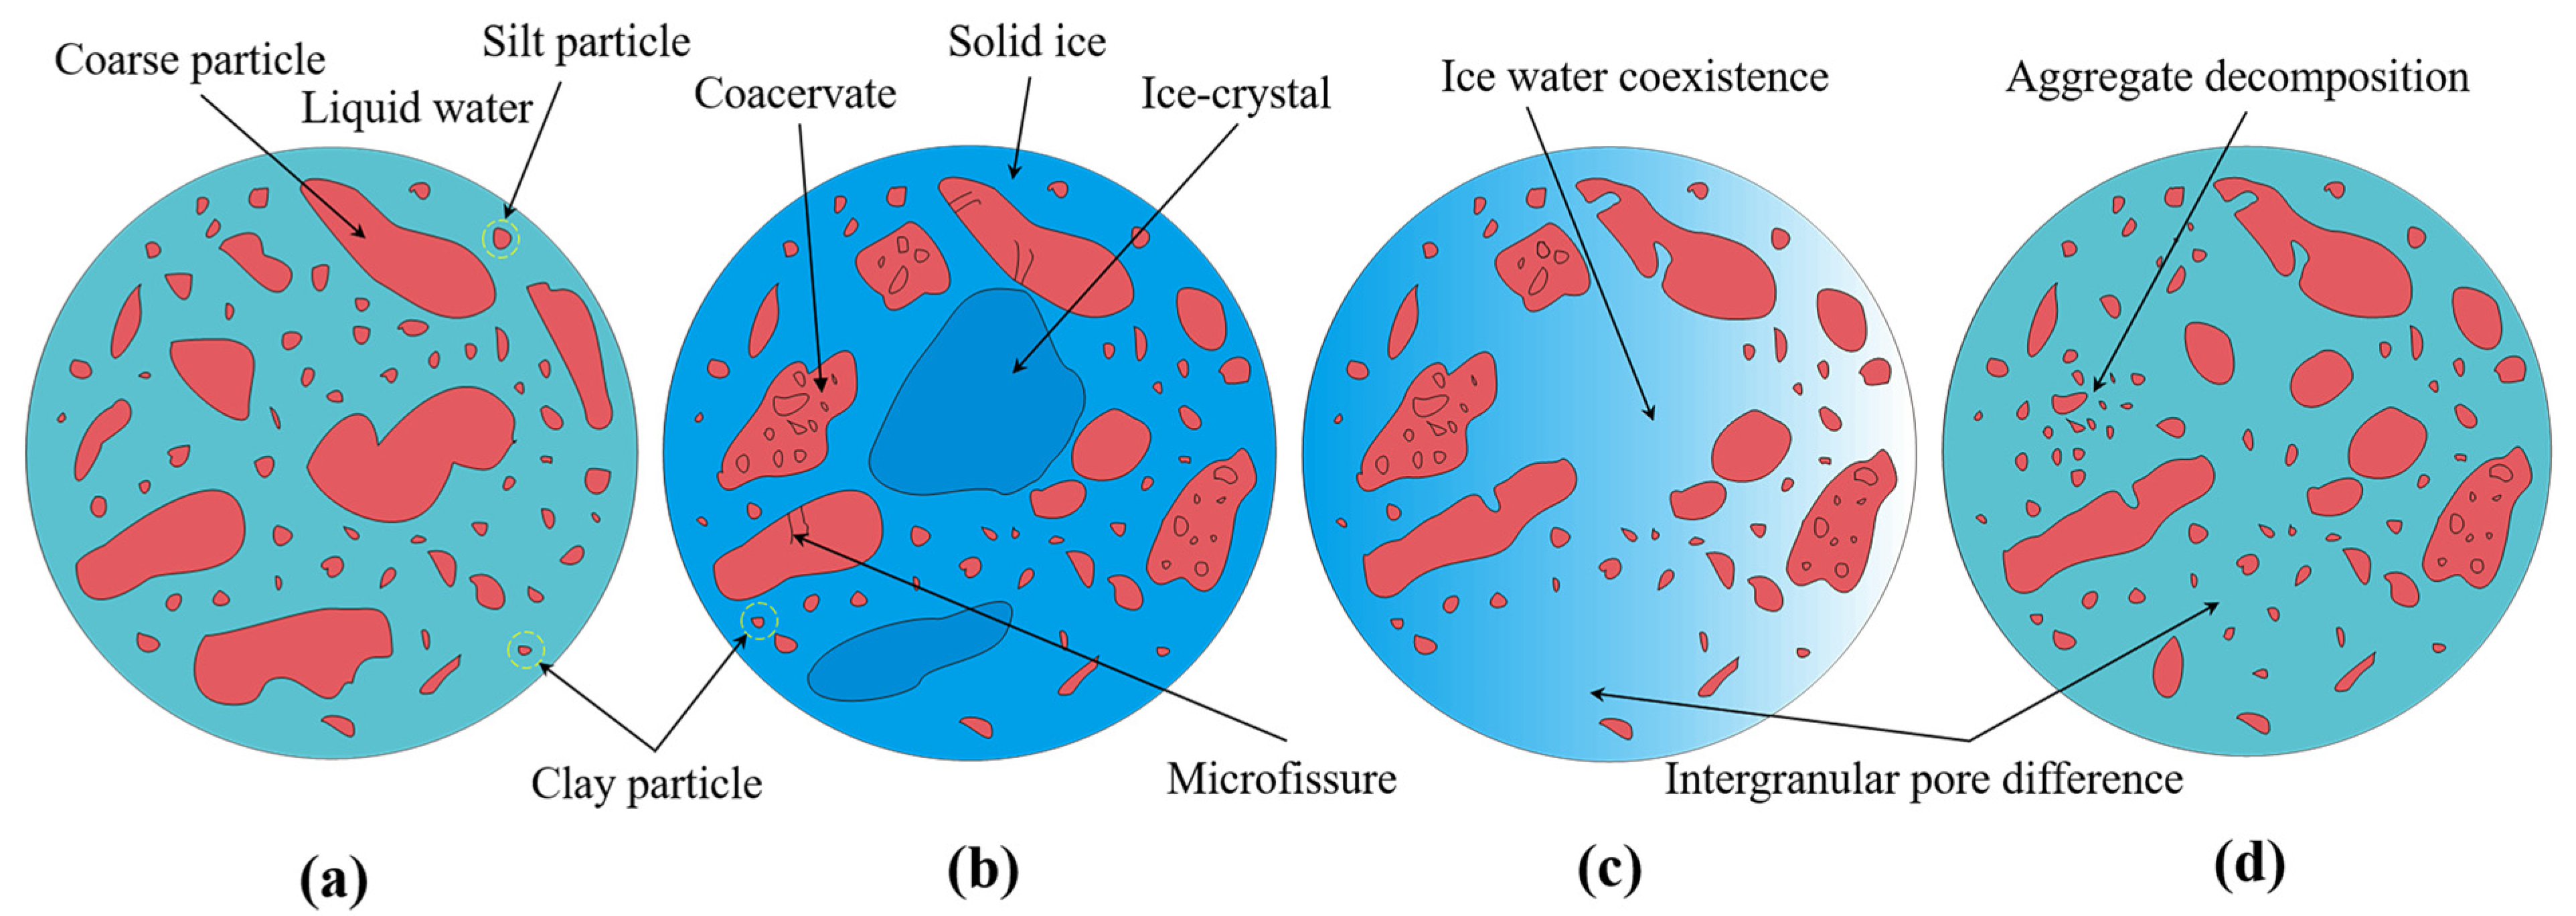
The single F-T cycle is divided into four stages: initial cooling, continuous freezing, post-freezing warming, and continuous thawing (
Figure 18). During initial cooling, the sample remained liquid, and the surface tension gradually increased. Water from small pores migrates to larger pores, and freezing initiates. As the temperature reaches its freezing point, water in larger pores freezes preferentially because of its higher freezing point than water in smaller pores. Unfrozen water from smaller pores migrates towards the freezing front, leading to ice crystal formation and subsequent expansion. This expansion exerts pressure on the surrounding soil particles, forming agglomerates of various sizes and shapes. The freezing and expansion forces, along with the water migration force, generate microcracks on the surface of the agglomerates. Additionally, the pore space between soil particles is increased. After freezing for a certain period, rising temperatures induce a phase change from solid to liquid. A small amount of meltwater erodes the pore wall and infiltrates the secondary fissures, weakening the intergranular cementation. During the subsequent thawing stage, the agglomerates and original particles are further decomposed by the abundant meltwater, leading to an increase in the volume of small pores and a decrease in the volume of large pores. However, the damage to the soil skeleton structure caused by the F-T cycles is irreversible. As the number of F-T cycles and initial moisture content increase, larger ice crystals form during freezing, intensifying the freezing effect. This leads to more severe structural damage and reduced shear strength.
The repeated F-T cycles induce multiple phase changes in pore water, leading to fragmentation, aggregation, re-fragmentation, and re-aggregation [
32]. Increased moisture content accelerates this process, promoting the decomposition of soluble salts and the development of microcracks. These changes manifest as increased pore spacing, decreased cohesion, and slight increases in the angle of internal friction.
5. Conclusions
This study primarily investigates the shear mechanical properties and microscopic pore characteristics of Hipparion laterite—the primary slip zone stratum controlling the initiation and evolution of loess landslides in the Northern Shaanxi region. Using a combination of indoor ring-shear tests and SEM analyses, the shear damage patterns and shear stress–mean linear displacement curves of Hipparion laterite specimens subjected to 0–10 F-T cycles under varying initial moisture contents were examined. Both qualitative and quantitative analyses of the pore microstructure were performed to understand the strength deterioration mechanism. The key findings are summarized below:
(1) The F-T-induced deformation patterns of Hipparion laterite manifest progressive structural degradation. During initial cycles, pore spaces and microfractures proliferate, followed by the development and coalescence of serrated and transverse cracks with subsequent cycles. Under prolonged cycling, interconnected diagonal fissures propagate across specimens alongside frost-induced crystalline networks, demonstrating persistent structural damage. Variations in moisture content and cycle intensity exacerbated this degradation, culminating in a total mass loss of 0.94%—notably lower than that observed in typical loess deposits.
(2) The shear stress–mean linear displacement curves of Hipparion laterite specimens revealed three characteristic stages: strain development (Stage I), strain-softening (Stage II), and sustained strain-hardening (Stage III). Specimens with 16% and 20% moisture content transitioned from Stage I to Stage II, while those with 24% moisture content entered Stage III after six F-T cycles. The peak and residual strengths decreased by 46.27–96.93 kPa and 48.72–70.66 kPa, respectively. Cohesion followed an exponential decay relationship with the F-T cycles, whereas the internal friction angle exhibited an exponential increase.
(3) F-T cycling weakens interparticle cementation, progressively transforming mineral contact modes from strongly bonded face-to-face interactions to weaker edge-to-edge and point-to-point configurations. Micropore proportion decreased to 23.57–28.62%, transitioning to dominance by small and mesopores, which increased the apparent porosity to a maximum of 0.3967. At 24% initial moisture content, pore orientation alignment diminished, while elevated probabilistic entropy (ΔH = 0.0401) and the fractal dimension (ΔD = 0.0589) indicated heightened structural disorder and complexity. Among factors influencing pore microstructure, moisture content emerged as the dominant controlling parameter.
(4) The internal architecture of the soil and the form of elements during the F-T stages (freezing, warming, and thawing) contributed to significant reductions in mechanical strength. This result was attributed to variations in internal and external temperatures, intergranular voids, and agglomerate sizes.


