1. Introduction
In grain processing operations, material transportation constitutes a critical component. The ongoing increase in wheat production and advancements in milling technology have made transportation efficiency enhancement a key research focus. Currently, flour transportation primarily employs two methods: screw conveyors and pneumatic pipeline systems. Screw conveyors, as traditional mechanical transport devices, frequently cause material degradation and mechanical wear during operation. Pneumatic pipeline systems utilize high-velocity airflow (reaching up to 15 m/s) to suspend and propel flour particles, but this dilute-phase conveying mode results in low transportation efficiency and high energy consumption. In contrast, air slides only require low-speed airflow to fluidize the flour, which then flows under gravity, significantly reducing particle–equipment collisions and wear while dramatically lowering energy consumption. Additionally, this system enables long-distance transportation with multiple discharge points. Due to these advantages, air-slide conveyors have found extensive applications across various industries, including chemical engineering, building materials, and coal processing.
Over the past decade, powder transportation has shifted from high-speed dilute-phase conveying to low-velocity dense-phase conveying, significantly increasing throughput while reducing energy consumption [
1]. However, due to the highly concentrated and turbulent nature of dense-phase powder flow, research in this area remains challenging [
2]. Consequently, gas–solid coupled simulation has become a primary method for studying dense-phase powder conveying [
3,
4]. Leveraging the transient simulation capabilities of computational models, researchers can effectively predict the time-dependent distribution characteristics of powder flow and obtain precise data that are difficult to measure experimentally [
5]. Current gas–solid coupled simulation studies primarily focus on pneumatic pipeline conveying, where simulation models are established based on material concentration [
6,
7]. By investigating empirical models for minimum conveying boundaries, researchers can accurately predict blockage conditions [
8]. Conveying simulations enables precise determination of powder distribution density at different locations within the system, helping to analyze the root causes of blockages [
9]. Additionally, by establishing particle–wall collision models, researchers can evaluate equipment wear and material degradation, optimizing designs to extend service life [
10,
11]. Real-time monitoring of conveying rates, combined with gas–solid interaction mechanisms, further enhances transportation stability [
12,
13].
In the study of gas–solid coupling simulation for wheat flour, the selection of turbulence models constitutes a critical factor affecting simulation accuracy. The working principle of air-slide conveyors resembles that of fluidized beds, where the k-ε model has been widely adopted for fluidized bed simulations [
14]. As a two-equation model, it offers high computational efficiency and broad applicability [
15,
16]. McDermott effectively predicted dust explosion risks by employing the CFD-DEM method to examine difficult-to-measure characteristics such as particle concentration in conveying equipment [
17]. Khawaja investigated the phenomenon of bubbling by using DEM-CFD simulations with different sizes of particles [
18]. This study revealed different types of fluidization regimes as stated in the literature. Khawaja studied the phenomenon of minimum fluidization by using DEM-CFD simulations with different sizes of particles [
19]. Wang developed a novel drag force model using CFD-DEM to analyze particle breakage and aggregation phenomena in fluidized beds [
20]. While significant progress has been made in the research on fluidized conveying of inorganic powders such as mineral powders, studies specifically addressing wheat flour transportation in air slides remain scarce. This research gap exists primarily because wheat flour exhibits relatively high adhesion properties, which substantially compromise its fluidization effectiveness in such conveying systems.
This study employs a CFD-DEM coupled approach using Fluent v2023 and Rocky v23R1 software to numerically simulate the conveying process in an air slide. The fluid dynamics data from Fluent are imported into Rocky to analyze its interaction with wheat flour particles, while the particle–fluid feedback is returned to Fluent to achieve bidirectional coupling. Rocky’s statistical methods are utilized to evaluate flour-conveying performance. The research focuses on investigating the effects of inclination angle, input air velocity, and air-permeable layer porosity on conveying ratio and material layer stability. Through multifactorial orthogonal experiments, the influence weights of different parameters were analyzed, leading to optimized air slide design. The findings provide practical guidance for engineering applications of air slide systems.
2. Three-Dimensional Model of the Air Slide
The air slides comprise upper and lower trough-shaped housings fabricated from thin steel plates, separated by a perforated partition plate. The entire assembly is installed with a slight inclination angle. Material enters the upper trough through the feed inlet while the blower delivers air into the lower trough. To ensure directional control and uniform distribution of airflow into the upper trough, a porous permeable layer is integrated into the partition plate structure. When air pressure in the lower trough reaches a predetermined threshold, gas progressively permeates through the permeable layer into the upper trough. Under the synergistic action of gravitational force and the established airflow field, the powdered material advances toward the discharge outlet. This aerated transport mechanism effectively reduces the friction coefficient, enabling highly efficient conveying operation.
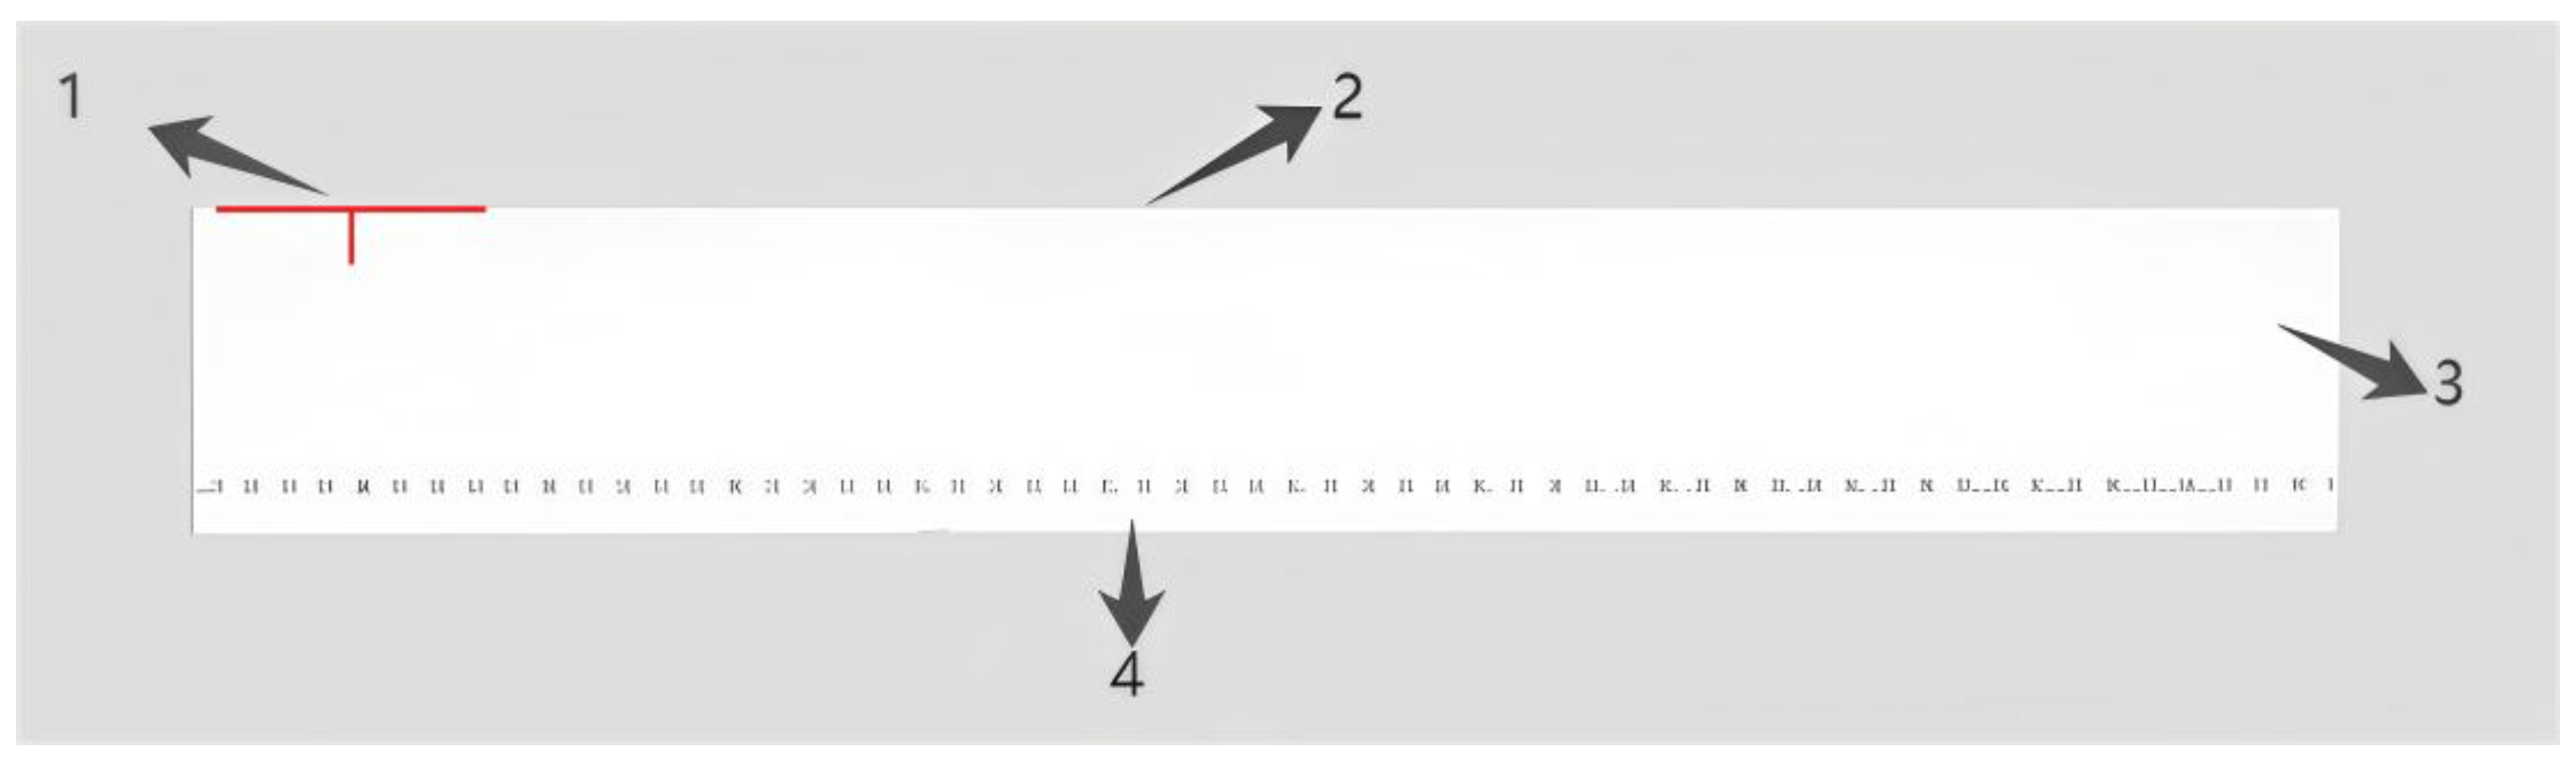
This study is based on the XZ200 air slide, with modeling completed using SolidWorks 2019 3D modeling software. The model was then imported into ANSYS Fluent 2023 and Rocky DEM 23R1 software for gas–solid two-way coupling simulation, as shown in
Figure 1. To reduce computation time for numerical simulation, the air slide model was simplified with the following specifications: total length of 200 mm, width of 28 mm, upper chamber height of 18 mm, and lower chamber height of 5 mm. A perforated plate was installed between the upper and lower chambers to investigate the effect of porosity (φ) on conveying performance, designed with four distinct porosity configurations: (1) staggered 1.0 mm diameter holes (φ = 37.84%), (2) in-line 1.5 mm diameter holes (φ = 47.24%), (3) staggered 1.5 mm diameter holes (φ = 50.60%), and (4) in-line 2.0 mm diameter holes (φ = 58.13%). In actual production equipment, the upper chamber is equipped with air suction and dust accumulation devices to minimize airflow disturbances caused by gas at the top. To simplify this setup, an open design was adopted for the upper chamber.
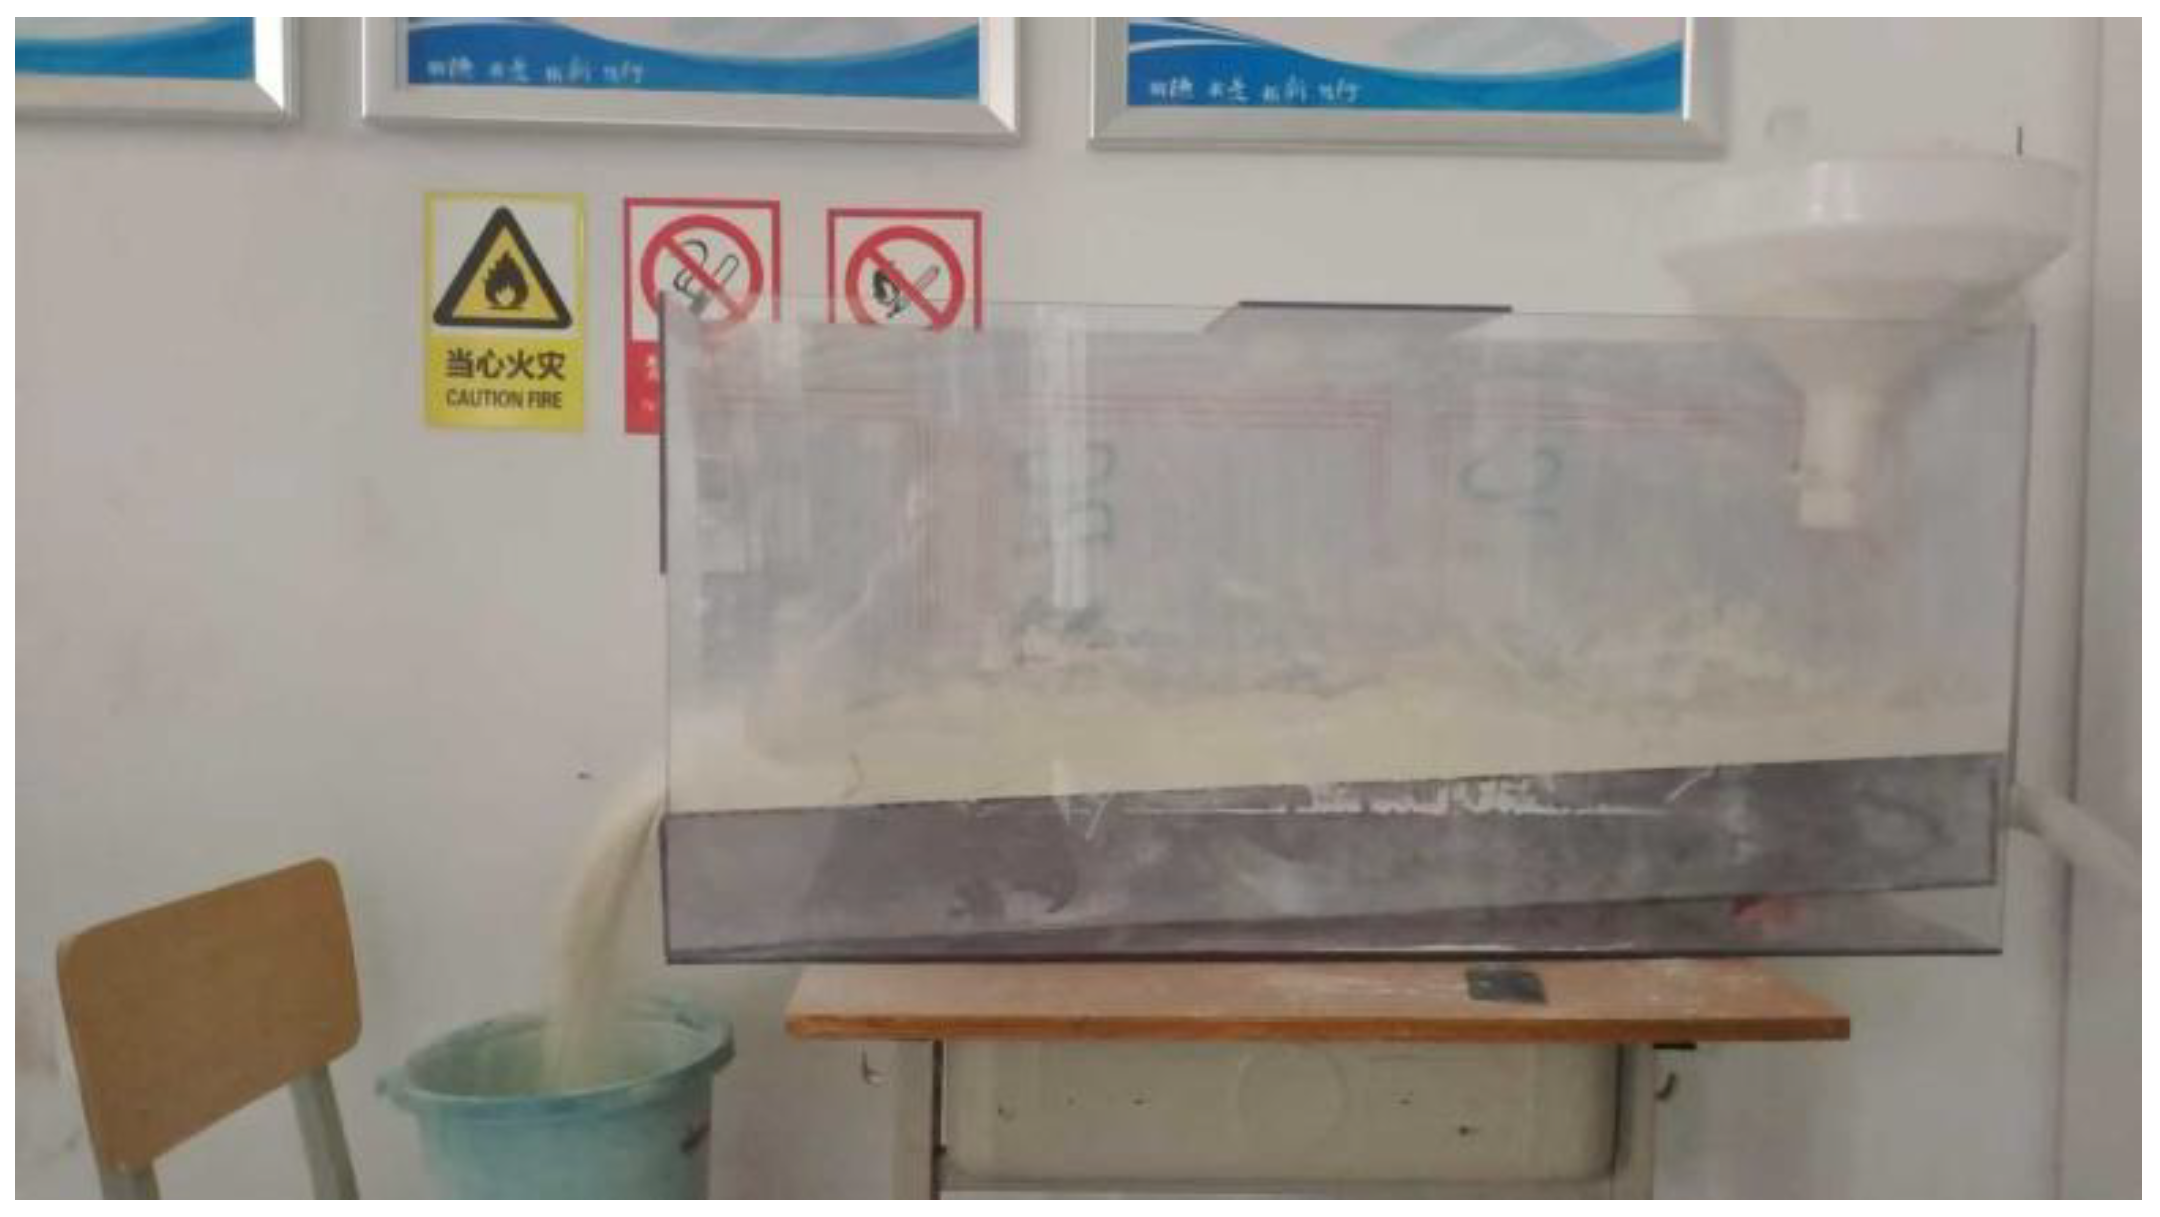
An experimental air slide model was constructed using acrylic plates for comparative studies. Based on the XZ200 air slide design, a single-section model was fabricated with the following dimensions: total length of 1000 mm, width of 28 mm, and lower chamber height of 50 mm. To minimize top airflow disturbances, the upper chamber height was adjusted to 450 mm. The perforated baffle plate was designed with 9 mm diameter holes in a staggered arrangement, achieving an open area ratio of approximately 50.60%. A canvas layer was installed between the two baffle plates as a porous permeable medium to ensure uniform gas distribution and directional flow into the upper chamber. The experimental setup is shown in
Figure 2 below.
3. Numerical Simulation of the Conveying Process
3.1. Fluid Parameter Settings
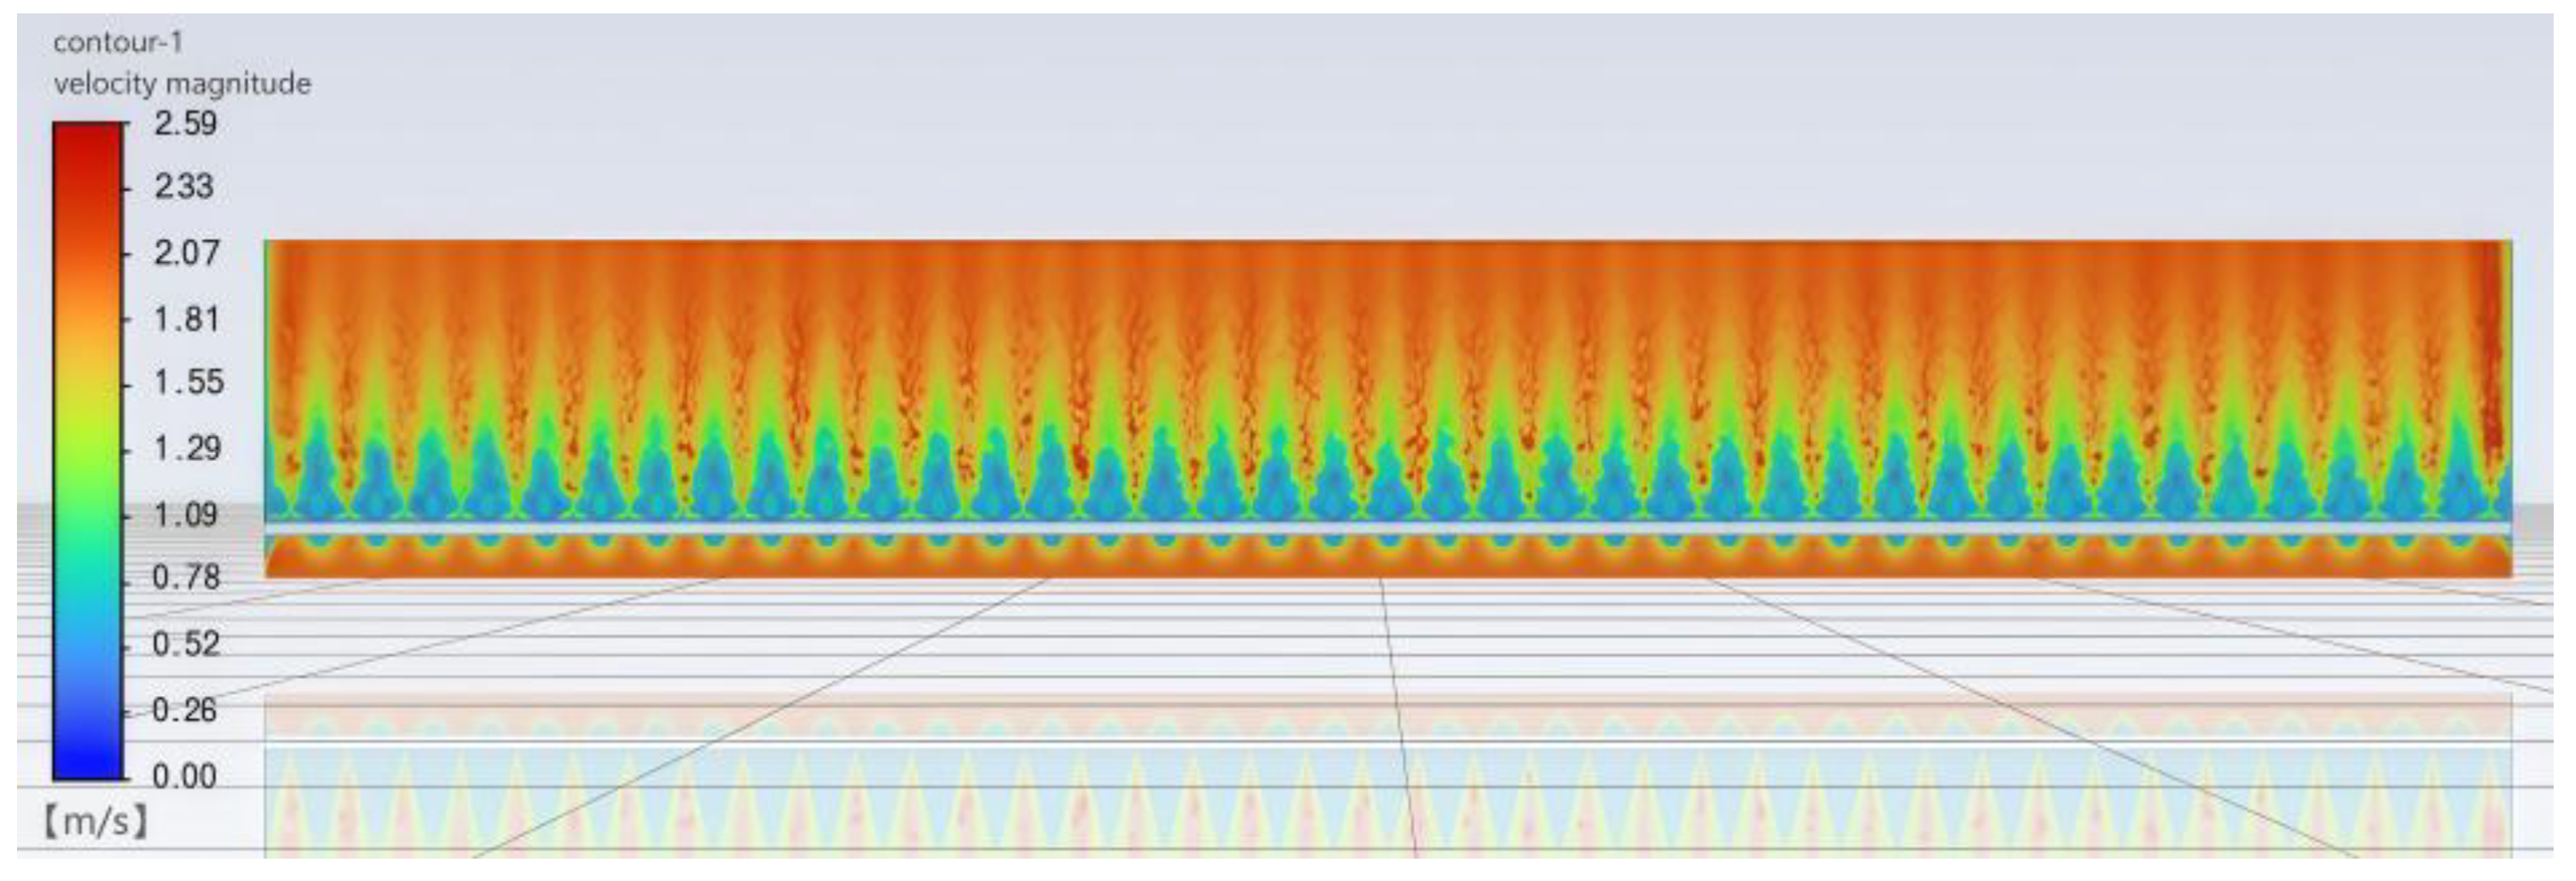
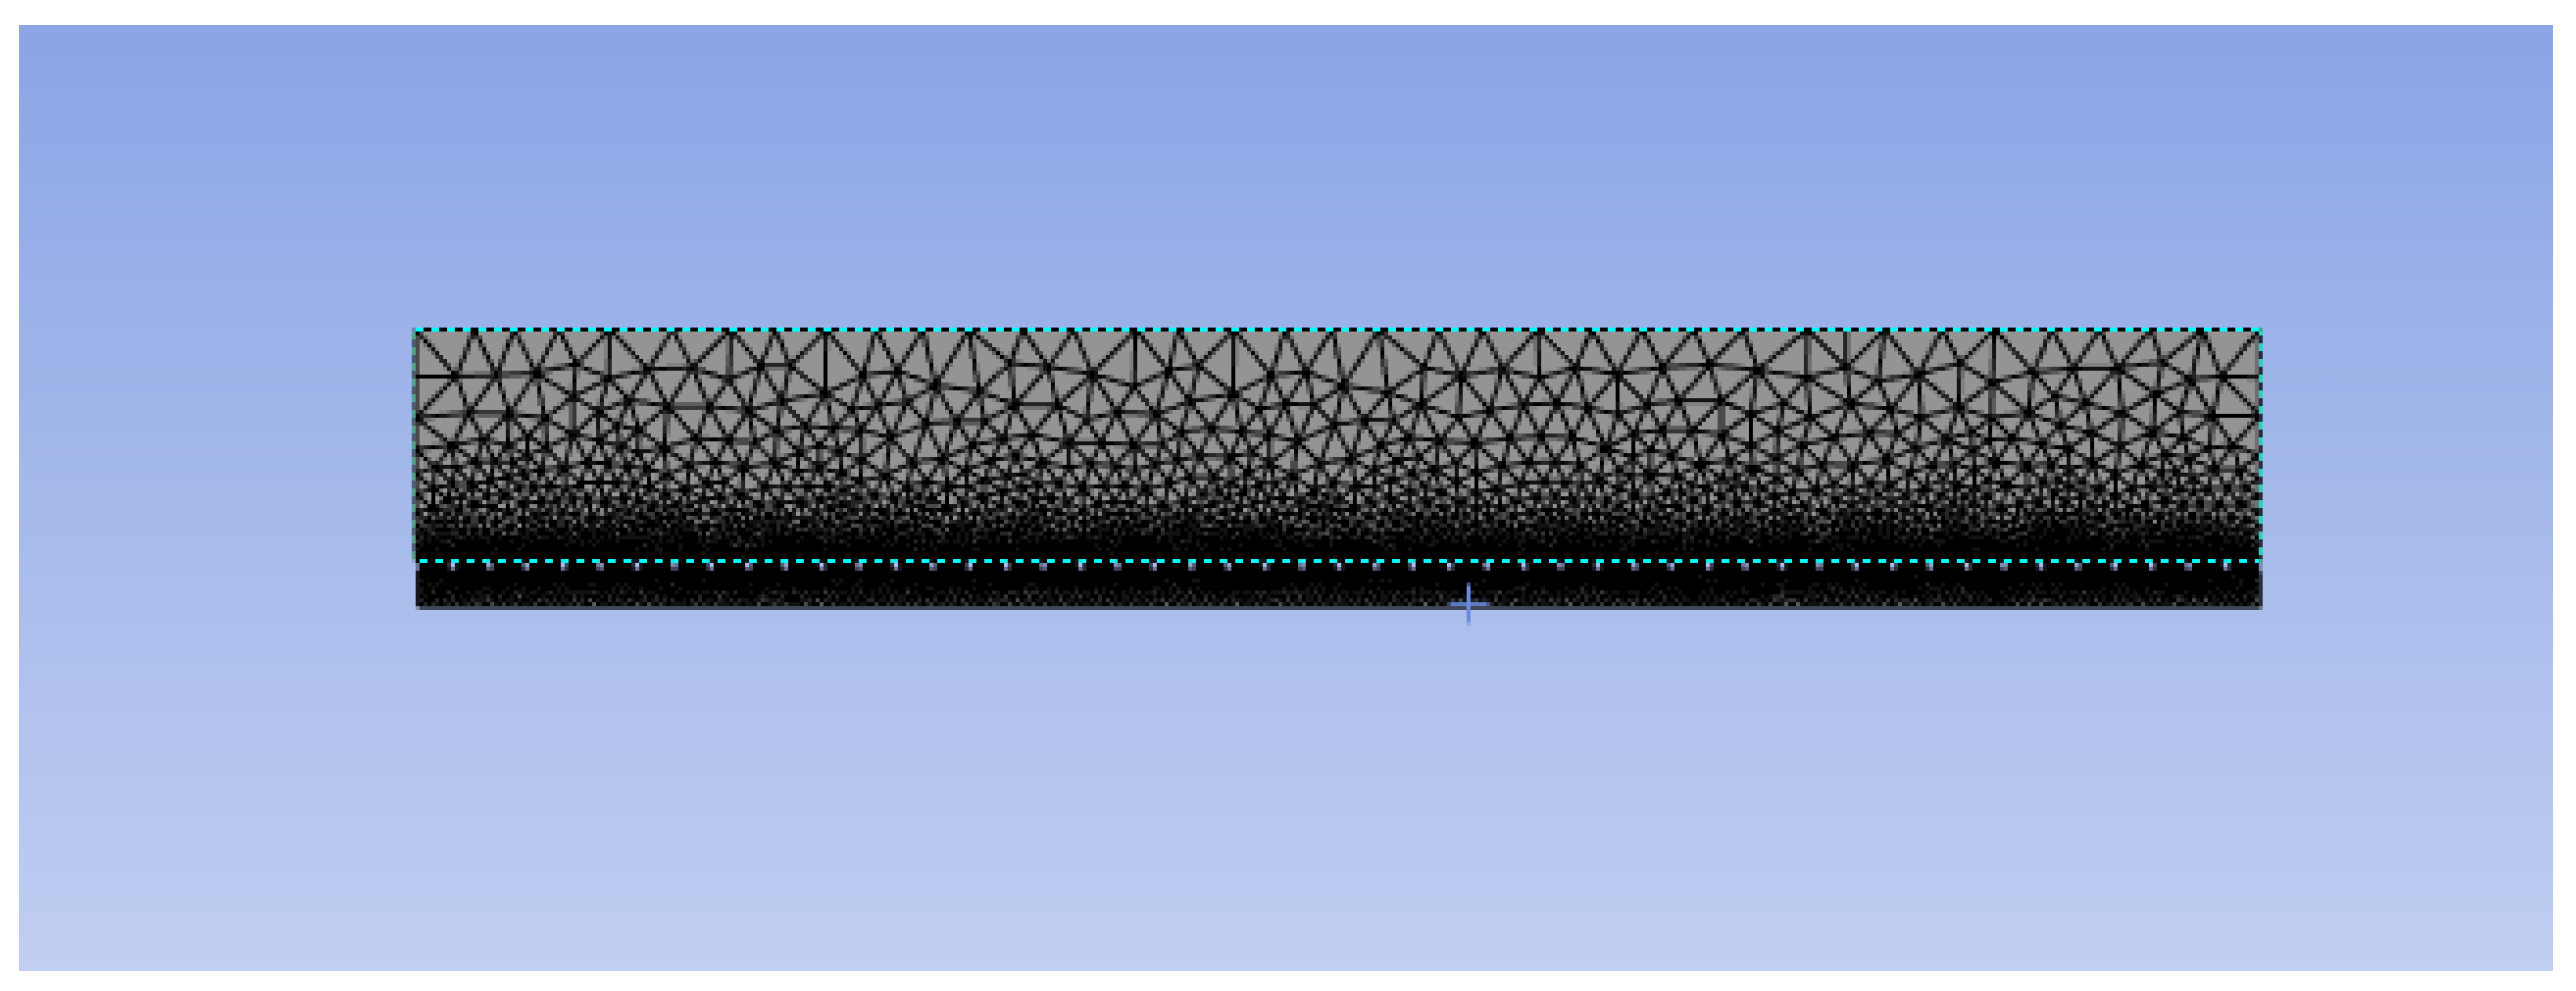
To enhance computational accuracy while minimizing computational overhead, the fluid domain mesh was optimized through a grid independence study involving the following three distinct meshing configurations: (1) a baseline coarse global mesh with 740,000 elements; (2) an adaptively refined mesh featuring localized encryption at critical regions (the orifice flow zone and chute junction) totaling 890,000 elements; and (3) a fine global mesh comprising 1,190,000 elements. Velocity contour analysis conducted at the mid-chute plane (
Figure 3) demonstrated that while the maximum flow velocities showed minimal variation between configurations 2 and 3 (
Figure 4), the computational resource requirements for configuration 3 were substantially higher. This trade-off analysis justified the selection of configuration 2 as the optimal meshing strategy (
Figure 5), achieving the target precision threshold with greater computational efficiency compared to the fine mesh alternative.
The numerical simulation employed a three-dimensional model, necessitating the adoption of double-precision calculation methods and a transient solver to handle the intense gas–solid two-phase turbulence. The computational parameters were set as follows: time step size of 0.05 s and automatic data saving every 10 steps (0.5 s interval). The simulation utilized a Eulerian multiphase flow model, with the standard k-epsilon model for turbulence and the Gidaspow model for drag force calculation. The physical properties of standard air at normal temperature and pressure were selected as the working fluid, with detailed parameters presented in
Table 1.
3.2. Wheat Flour Parameter Settings and Experimental Materials
Given the small particle size and large quantity of powder particles, some scholars have employed the injection method based on scaling theory to conduct dynamic angle of repose experiments with wheat flour, achieving simulation parameter calibration while reducing computational costs. Through this method, the researchers scaled up the irregular wheat flour particles (originally 0.212 mm in size) to spherical particles with a diameter of 1 mm and validated them using the tilting method, thereby obtaining the corresponding contact parameters [
21].
In this study, these parameters were adopted as reference values with the JKR (Johnson–Kendall–Roberts) contact model, which better simulates particle adhesion during pneumatic conveying. The simulation was configured with a particle inlet flow rate of 30 g/s and a duration of 5 s. Other relevant physical parameters are presented in
Table 2 below.
The experiment utilized three types of wheat flour with distinct particle size ranges: wheat flour A (0.21–0.212 mm), wheat flour B (0.125–0.149 mm), and wheat flour C (0.105–0.125 mm), all with a uniform density of 670 kg/m3. Employing a single-variable control method, this study analyzed the effects of inlet air velocity and chute inclination angle on the conveying ratio (δ), with the observed variation patterns serving to validate the simulation results.
3.3. Experimental Protocol
The simulation experiment considered inlet air velocity, aperture ratio (porosity), and chute inclination angle as influencing factors. Single-factor experiments were first conducted to analyze the impact of each factor on conveying performance, followed by orthogonal tests to optimize within the set parameter ranges. The initial design parameters were as follows: an inlet air velocity v of 1.8 m/s, a permeable baffle with staggered circular holes (diameter: 1.5 mm, porosity φ ≈ 50.61%), and a chute inclination angle θ of 7°. The first set of simulation experiments took the inlet air velocity v as the variable, with values set at 1.4 m/s, 1.6 m/s, 1.8 m/s, and 2.0 m/s. The second set of simulation experiments used the porosity φ of the permeable baffle as the variable, with values set at 37.84%, 47.24%, 50.60%, and 58.13%. The third set of simulation experiments used the chute inclination angle θ as the variable, with four test values of 5°, 6°, 7°, and 8°.
The experimental section considered inlet air velocity and chute inclination angle as influencing factors. The input air velocity and inclination angle of the chute were adjusted, respectively, through fan speed regulation and spacer blocks, corresponding to simulated settings of 1.4 m/s, 1.6 m/s, 1.8 m/s, and 2.0 m/s for air velocity and 5°, 6°, 7°, and 8° for inclination angle. The initial design parameters were as follows: an inlet air velocity v of 1.8 m/s, a permeable baffle with staggered circular holes (diameter: 9 mm, porosity φ ≈ 50.61%), and a chute inclination angle θ of 7°. The first set of experiments took the inlet air velocity v as the variable, with values set at 1.4 m/s, 1.6 m/s, 1.8 m/s, and 2.0 m/s. The second set of experiments used the chute inclination angle θ as the variable, with four test values of 5°, 6°, 7°, and 8°.
3.4. Selection of Indicators
Wheat flour exhibits certain adhesive properties that may lead to particle agglomeration and accumulation during conveying. The conveying ratio (
δ) directly reflects the clogging probability—higher δ values indicate lower clogging risks, while lower values suggest increased clogging potential. Therefore, the conveying ratio was adopted as the evaluation metric to investigate the feasibility of using air slides for wheat flour transportation. defined as the ratio of the output mass flow rate (
nout) to the input mass flow rate (
nin). In the simulation, Rocky DEM was utilized to monitor in real-time. A statistical domain measuring 4 × 28 × 18 mm was established at the chute outlet: (1) the average particle velocity (
vi) and (2) the corresponding mass flow rate (
mi) within the statistical domain at the chute outlet. The computational approach treated particles in each time interval as discrete clusters, recording their transit time (
ti) through the monitoring zone. The instantaneous output mass flow rate (
ni) was then calculated using Equation (1), with the mean output mass flow rate (
nout) determined through temporal averaging of these instantaneous measurements. This methodology provides a robust quantitative framework for assessing air slide performance while specifically addressing the critical clogging phenomenon through the derived conveying ratio metric.
where
ni is the average mass flow rate of material at time
i;
mi is total particle mass within the statistical domain at time
i;
ti is transit time of particle cluster through the domain at time
i;
s is length of the statistical domain;
vi is average particle velocity at time
i;
nout is output mass flow rate;
nin is input mass flow rate; and
δ is conveying ratio.
The fluctuation of the material layer surface is an important indicator of the stability of fluidized flow in the reacting material. Smaller fluctuations indicate weaker interactions between particles and less turbulent airflow generated at the material layer surface, leading to more stable fluidized flow. Conversely, larger fluctuations result in significant dust dispersion, causing pollution. Using the fluctuation of the material layer surface as the second indicator, the maximum height of particle splashing and its average value within the statistical domain of the material layer surface are measured. The difference between these two values, denoted as h, represents the surface fluctuation. A smaller h indicates greater stability of the material layer.
The fluctuation of the material layer surface is an important indicator of the stability of fluidized flow in the reacting material. Smaller fluctuations indicate weaker interactions between particles and less turbulent airflow generated at the material layer surface, leading to more stable fluidized flow. Conversely, larger fluctuations result in significant dust dispersion, causing pollution. Using the fluctuation of the material layer surface as the second indicator. A 100 × 28 × 18 mm statistical domain was configured at the air slide outlet, and the maximum height of particle splashing and its average value within the statistical domain of the material layer surface are measured. The difference between these two values, denoted as h, represents the surface fluctuation. A smaller h indicates greater stability of the material layer.
Due to experimental limitations, the fluctuation characteristics of the material layer were difficult to measure quantitatively. Therefore, the conveying ratio was selected as the primary evaluation metric. The feeding rate at the inlet funnel was maintained at 300 g/s, and the output material was collected at the chute outlet during stable operation to calculate the conveying ratio.
4. Experimental Results and Discussion
4.1. Single-Factor Analysis
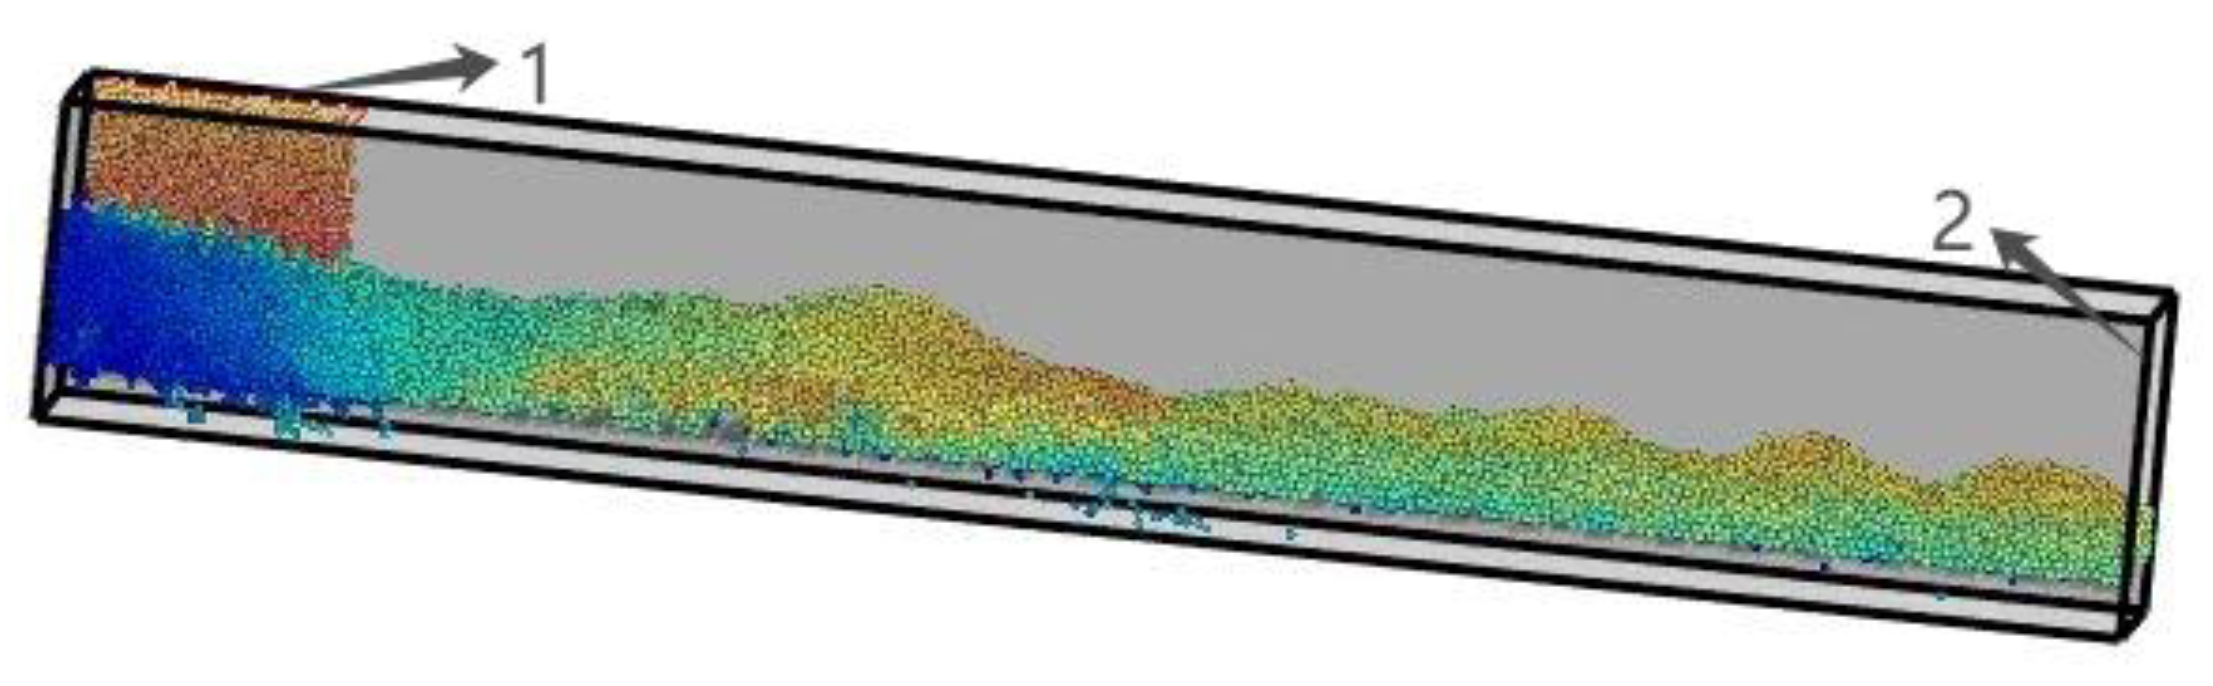
In the simulation, an inlet was positioned directly above the left end of the chute to introduce particles (
Figure 6). The generated particles were released with zero initial velocity, allowing them to fall freely into the inclined chute. The chute was oriented at a specific inclination angle θ relative to the horizontal plane. The particle size and physical parameters remained consistent with those described in previous sections.
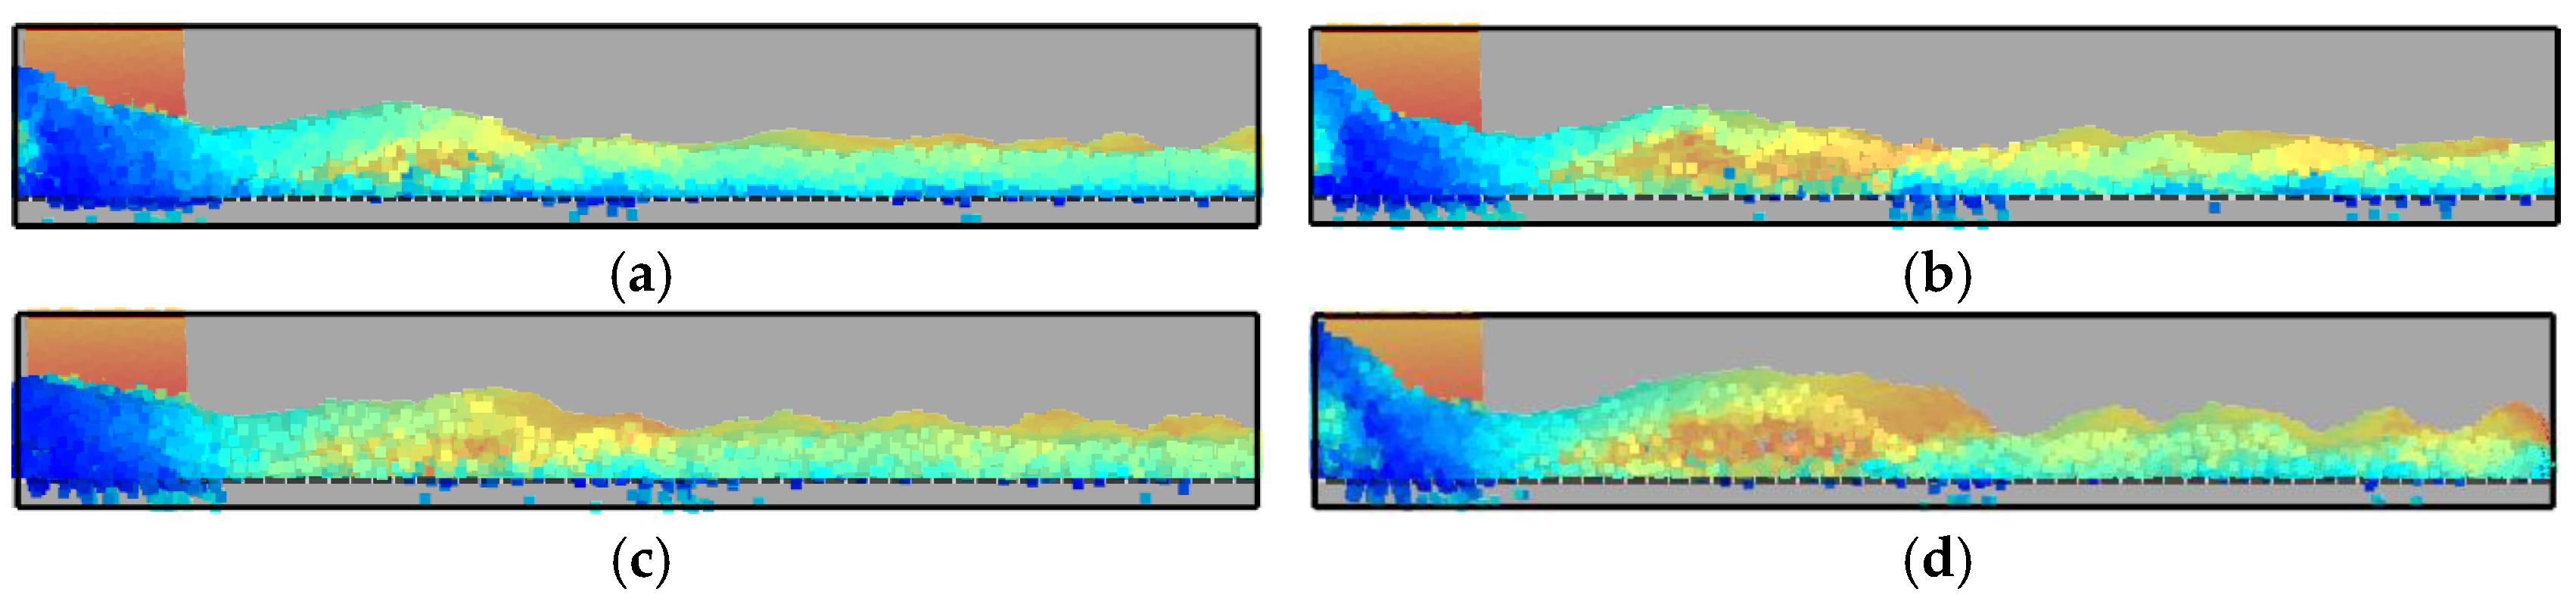
The simulation process is illustrated in
Figure 7. The conveying ratio of the air slide in both simulation and experiment and the oscillation amplitude obtained from simulation calculations are shown in
Figure 8.
As the input air velocity increased, the conveying ratio of the air slide improved accordingly, while the fluctuation difference in the material layer surface first increased and then decreased. This phenomenon occurs because, with higher input air velocities, the void fraction between particles increases, reducing interparticle interactions and increasing the average velocity of the particle group, thereby enhancing the conveying ratio. The material layer enters a bubbling bed stage similar to that in a fluidized bed, where the fluid tends to penetrate specific regions of the bed, causing surface particles to jump and resulting in significant fluctuation differences. As the input air velocity continues to rise, the material layer transitions from the bubbling bed stage to a stable phase, and surface fluctuations begin to diminish.
Due to the simplified treatment of the experimental platform, there were certain discrepancies between the conveying ratios of the three types of flour in experiments and the simulation results, though their variation trends remained consistent. This can, to some extent, validate the reliability of the simulation model. Overall, the conveying ratio of the air slide exhibits a positive correlation with the input air velocity, whereas the influence of input air velocity on surface fluctuations is more complex.
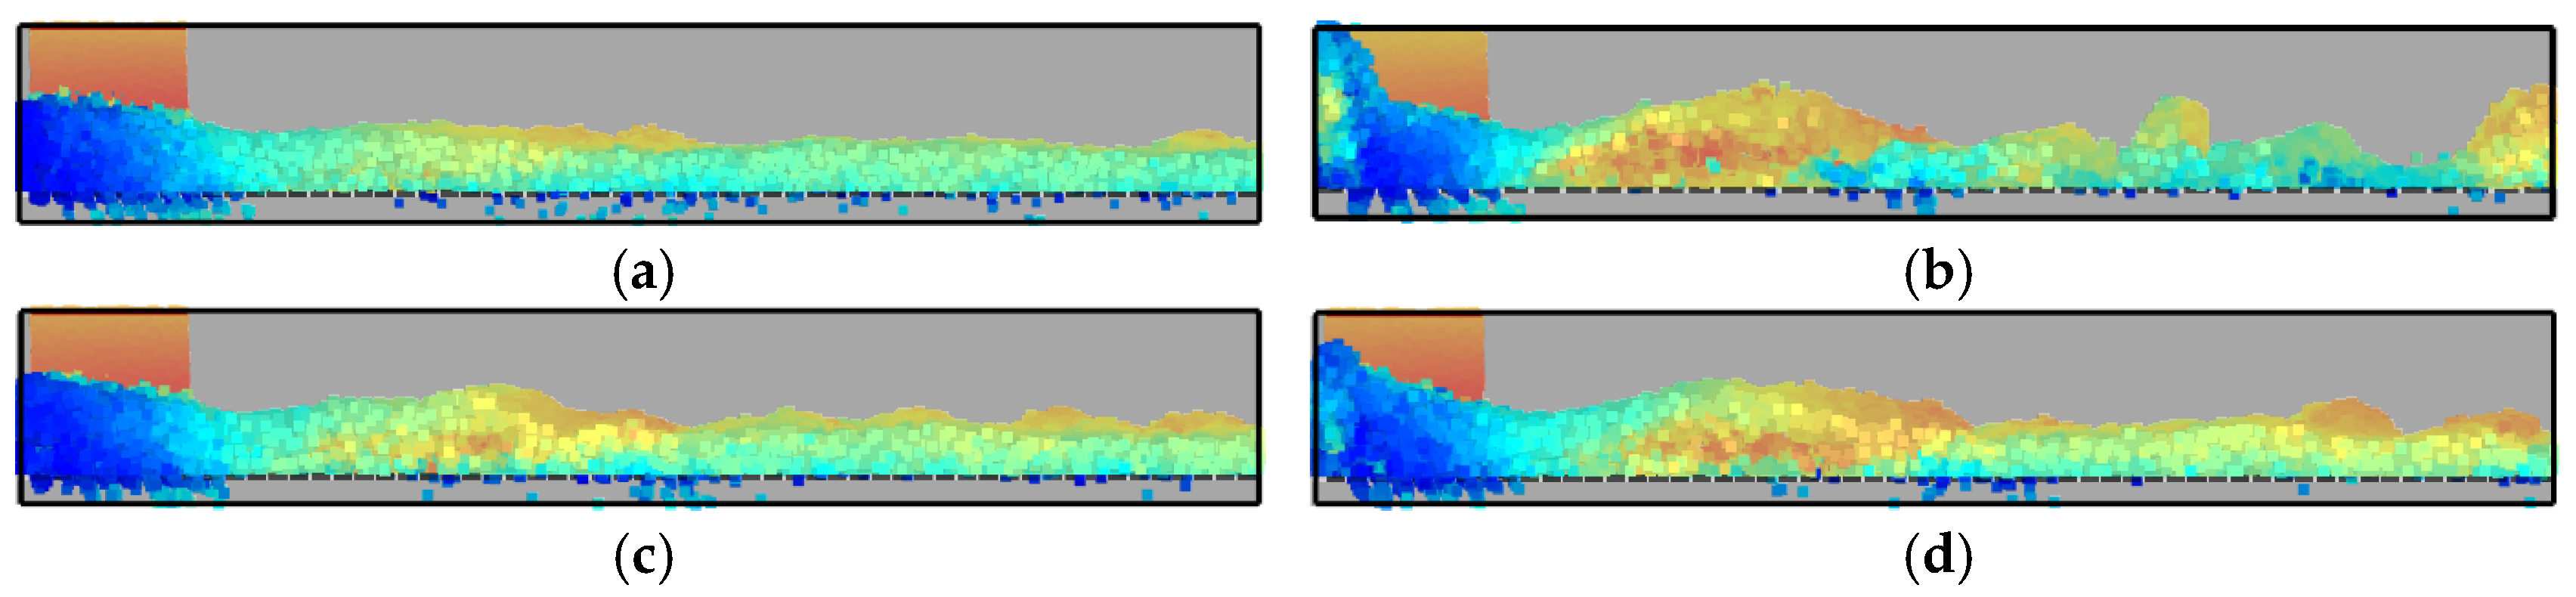
The simulation process is illustrated in
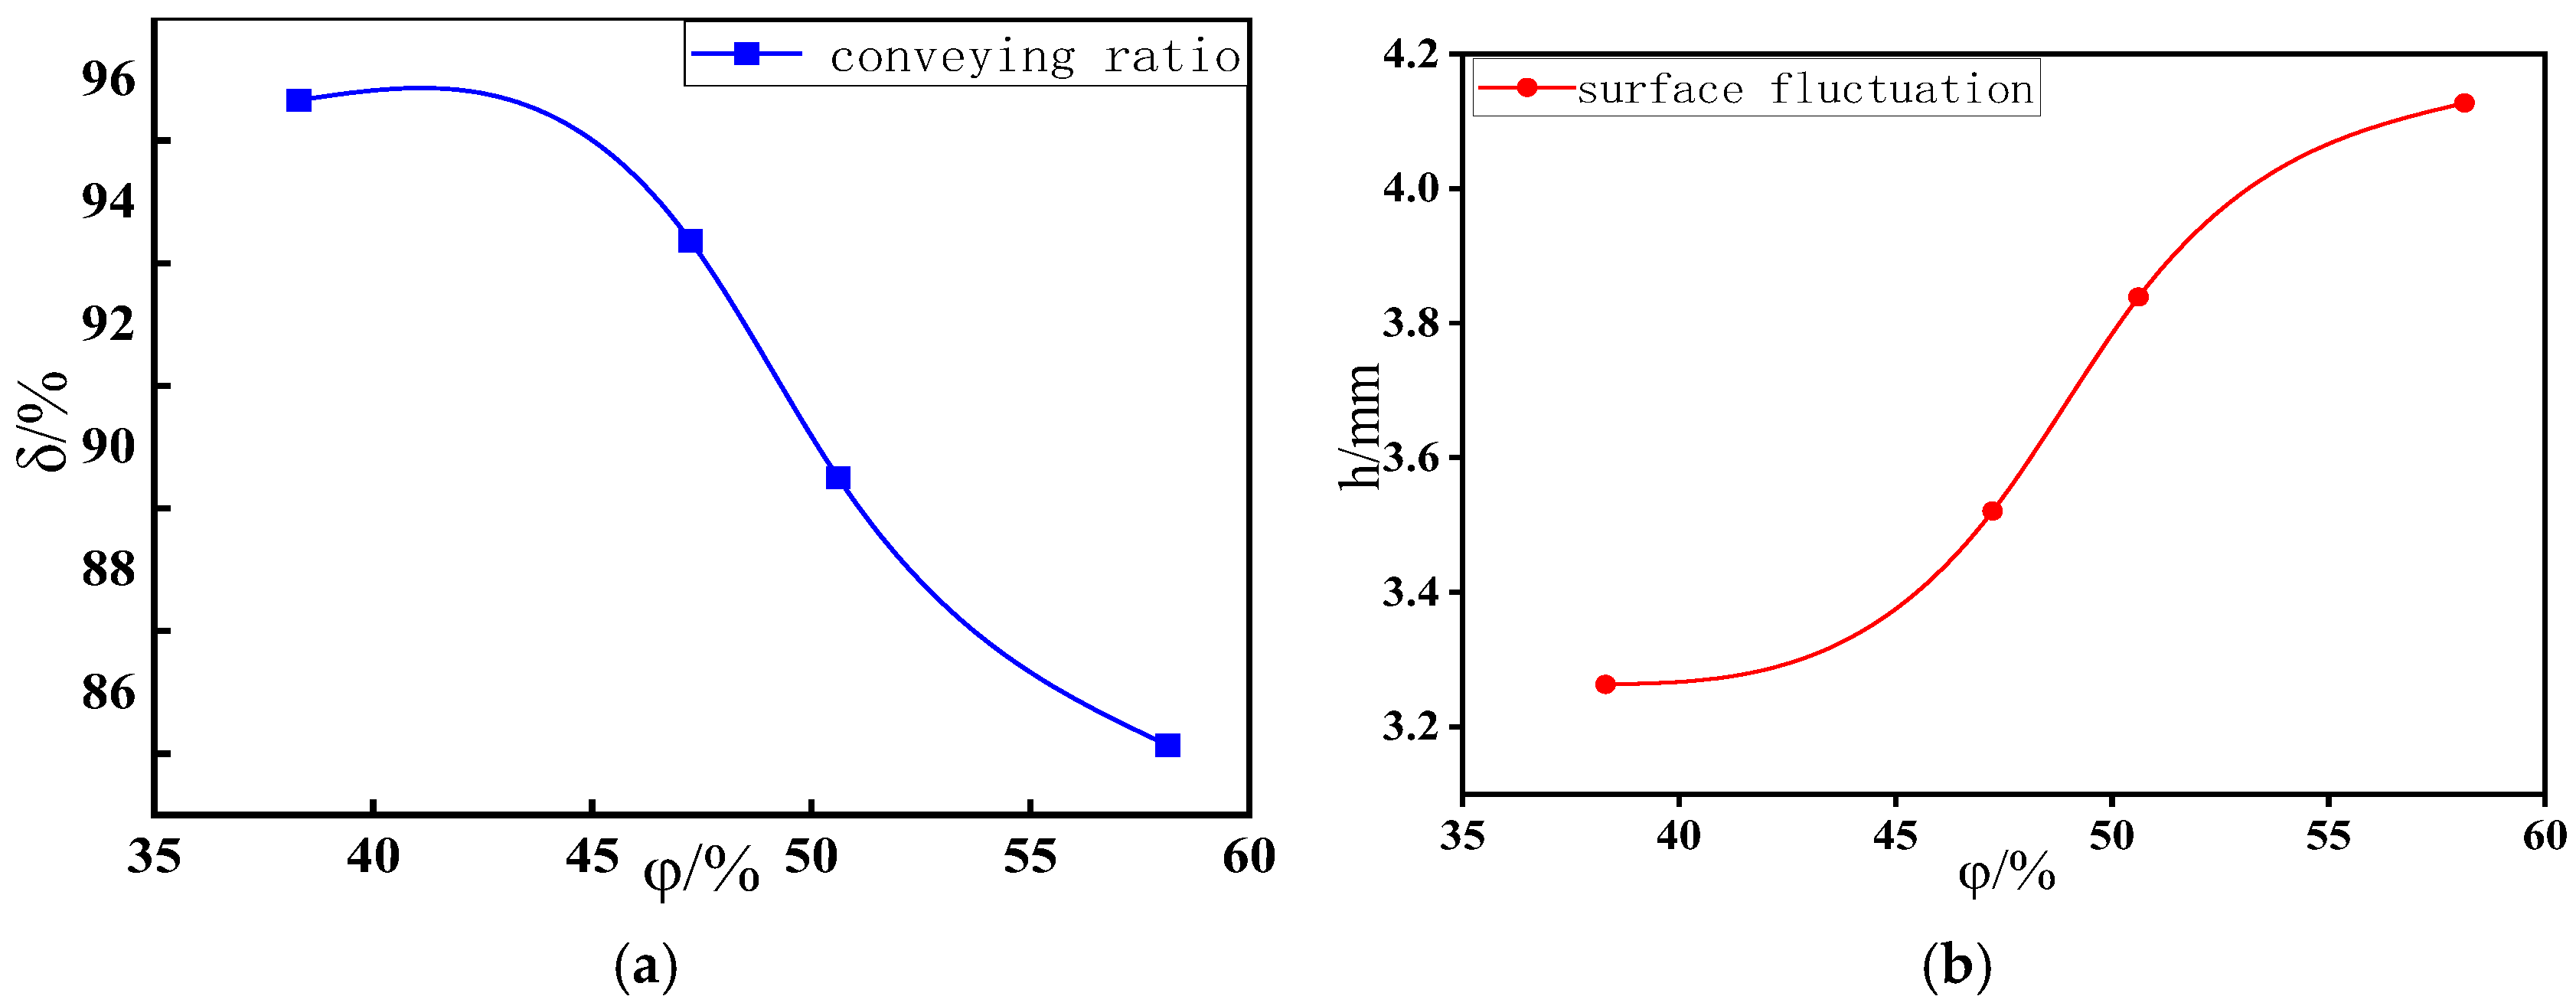
Figure 9. Analysis of the experimental results (
Figure 10) reveals that the conveying ratio of the air slide is negatively correlated with porosity, whereas the surface fluctuation difference in the material layer is positively correlated with porosity.
The underlying mechanism can be explained as follows: Since the input air velocity remains unchanged, the airflow velocity passing through the permeable layer decreases as porosity increases, leading to a decline in the conveying ratio. Meanwhile, the air velocity acting on the particles falls within the latter segment of
Figure 8b. The variation in porosity results in a more uniform fluid distribution inside the air slide, causing a slight reduction in fluctuation amplitude.
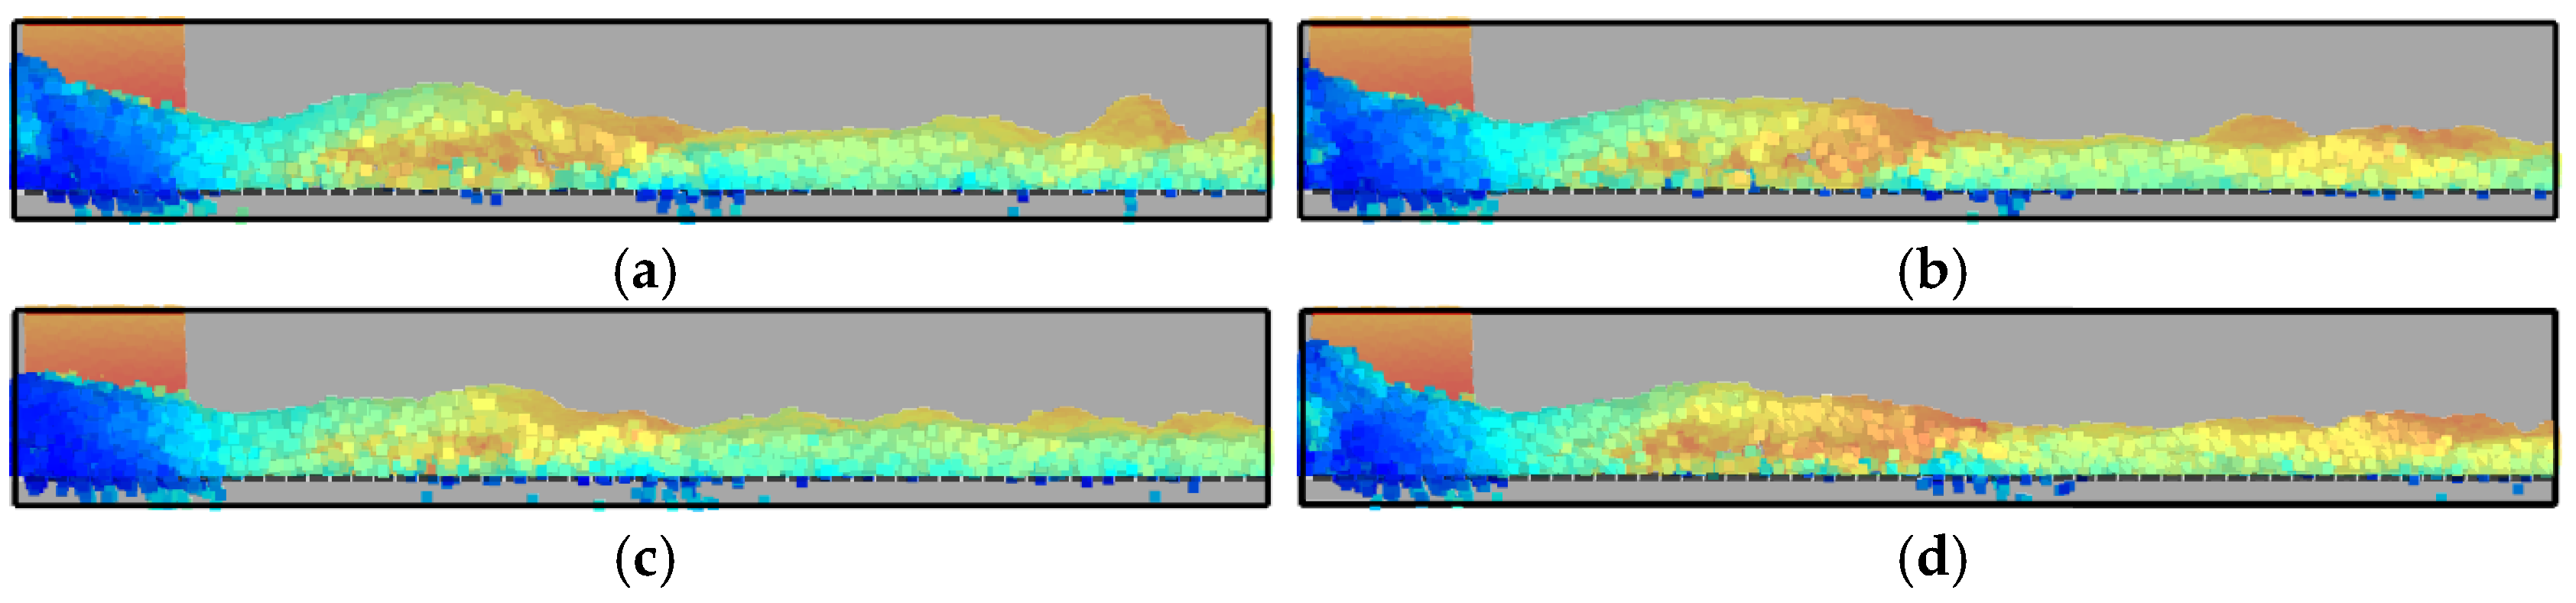
The simulation process is illustrated in
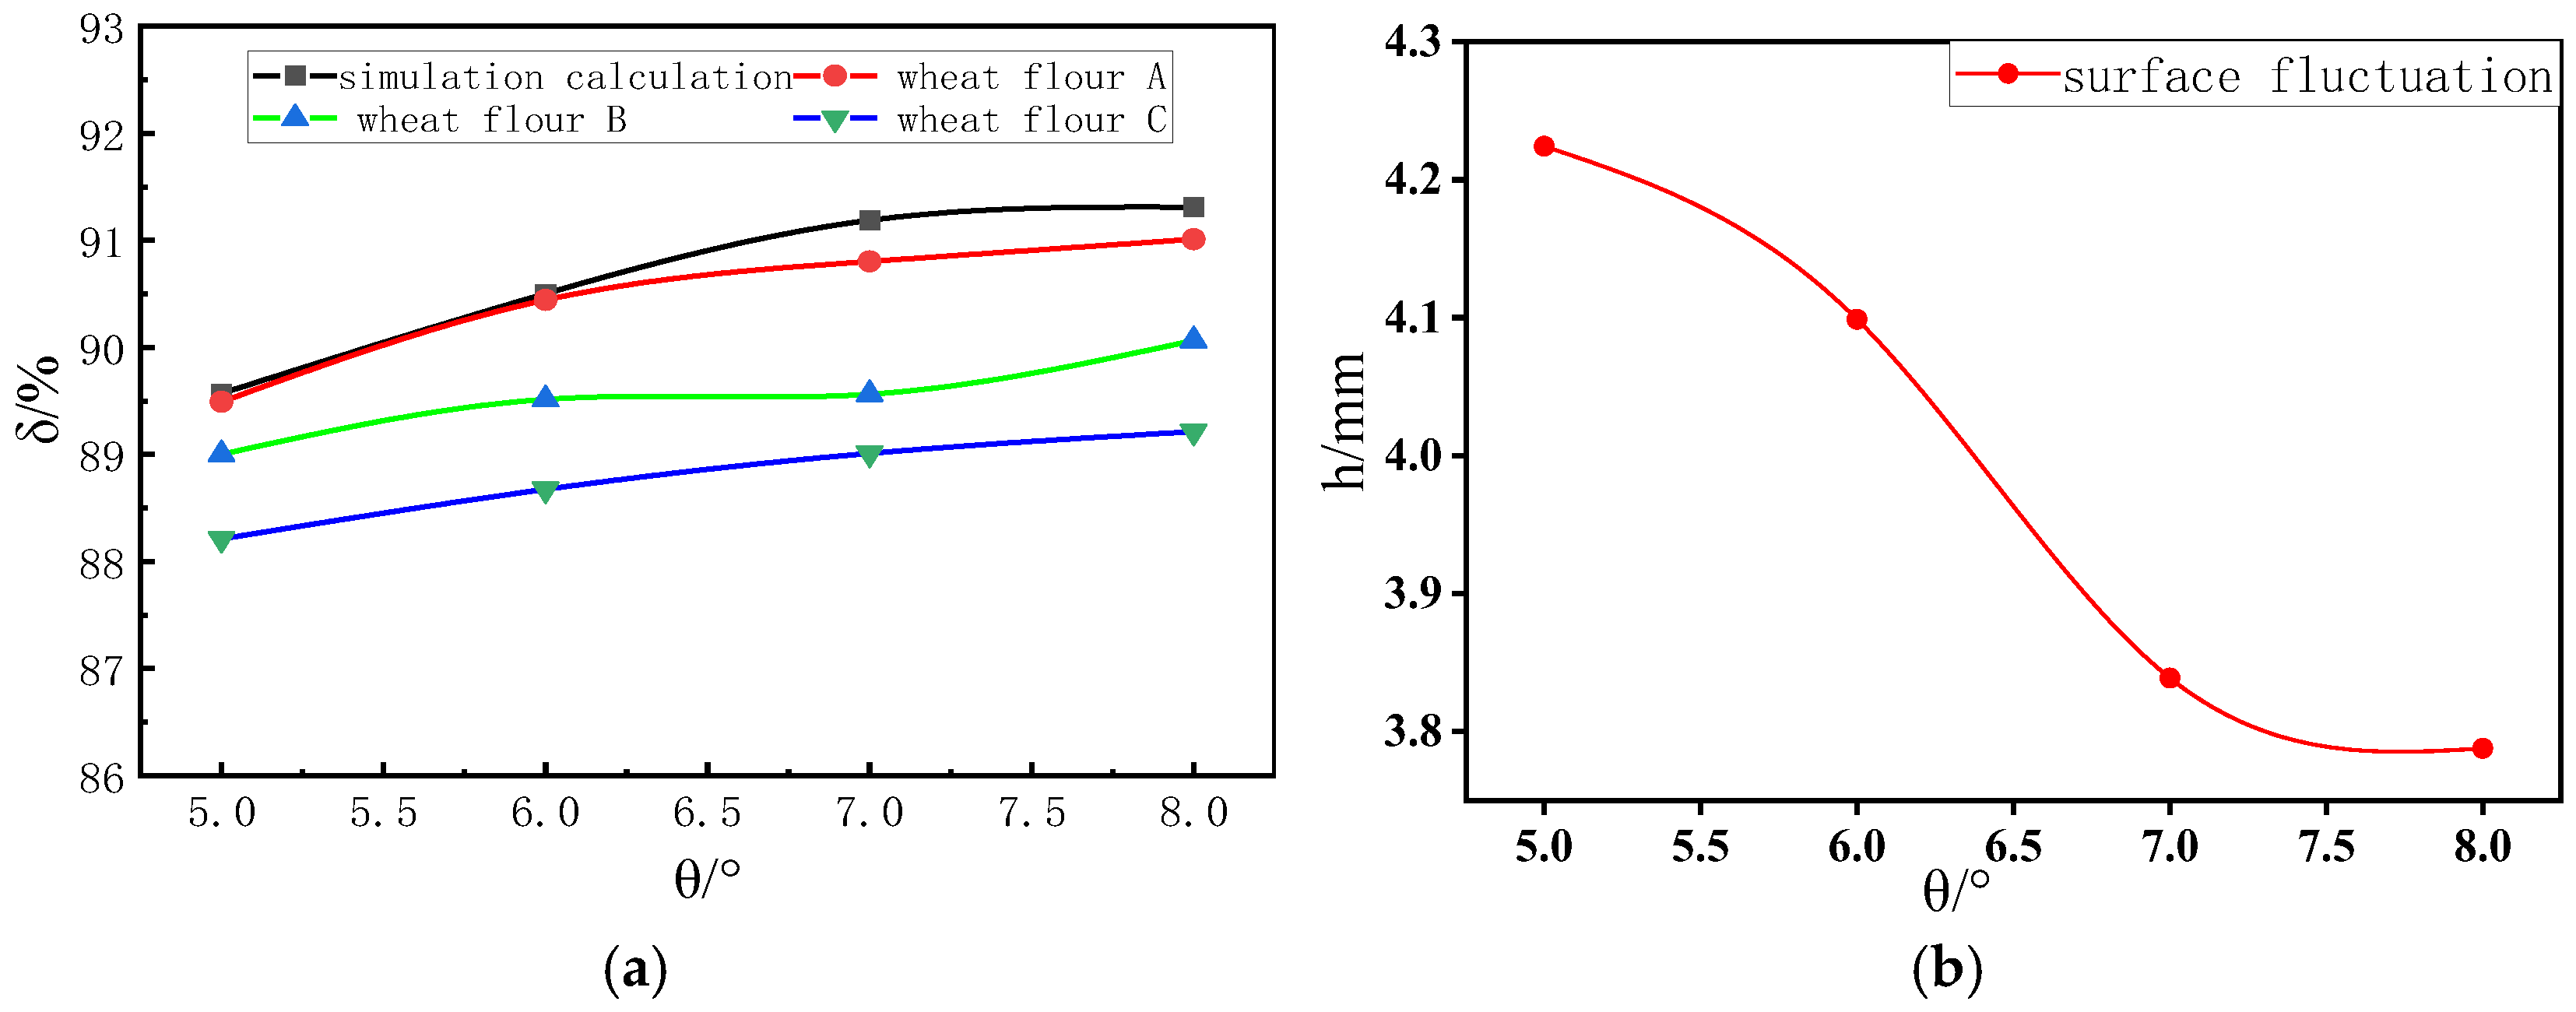
Figure 11. Analysis of the experimental results (
Figure 12) shows that as the inclination angle of the chute increases, the conveying ratio gradually improves, while the surface fluctuations of the material layer decrease. This occurs because the gravitational component of the material particles along the chute direction increases with the inclination angle, enhancing particle acceleration and velocity in that direction, thereby improving the conveying ratio.
Additionally, as the inclination angle increases, the gravitational component perpendicular to the chute decreases, reducing the particles’ suspension velocity. This leads to an increase in interparticle voidage and a rise in the average height of the material layer. Consequently, the difference between the maximum height and the average height of the material layer diminishes, resulting in reduced surface fluctuations.
A comparison between simulation and experimental results reveals that the variation curve of wheat flour A shows the closest agreement with simulation data. This correlation exists precisely because wheat flour A’s properties most closely match those of the wheat flour used in the earlier parameter calibration process. These findings collectively demonstrate the reliability of both the parameter calibration methodology and the simulation experiments.
4.2. Orthogonal Experimental Analysis
Through single-factor experiments, the influence of each parameter on the evaluation indicators was obtained, along with an analysis of the underlying causes for these variations. Considering the potential interactions among these factors, orthogonal experimental design was subsequently employed based on the single-factor tests to further investigate the possible multi-factor interactions affecting both conveying ratio and stability, thereby facilitating parameter optimization. The orthogonal experiment considered the following three factors: chute inclination angle (
θ), inlet air velocity (
v), and porosity (
φ), analyzing the effects of different factor-level combinations on the two evaluation indicators. The orthogonal array and corresponding results are presented in
Table 3 and
Table 4, respectively. To more intuitively illustrate the degree of influence of these three factors on the two evaluation indicators, range analysis was conducted, as shown in
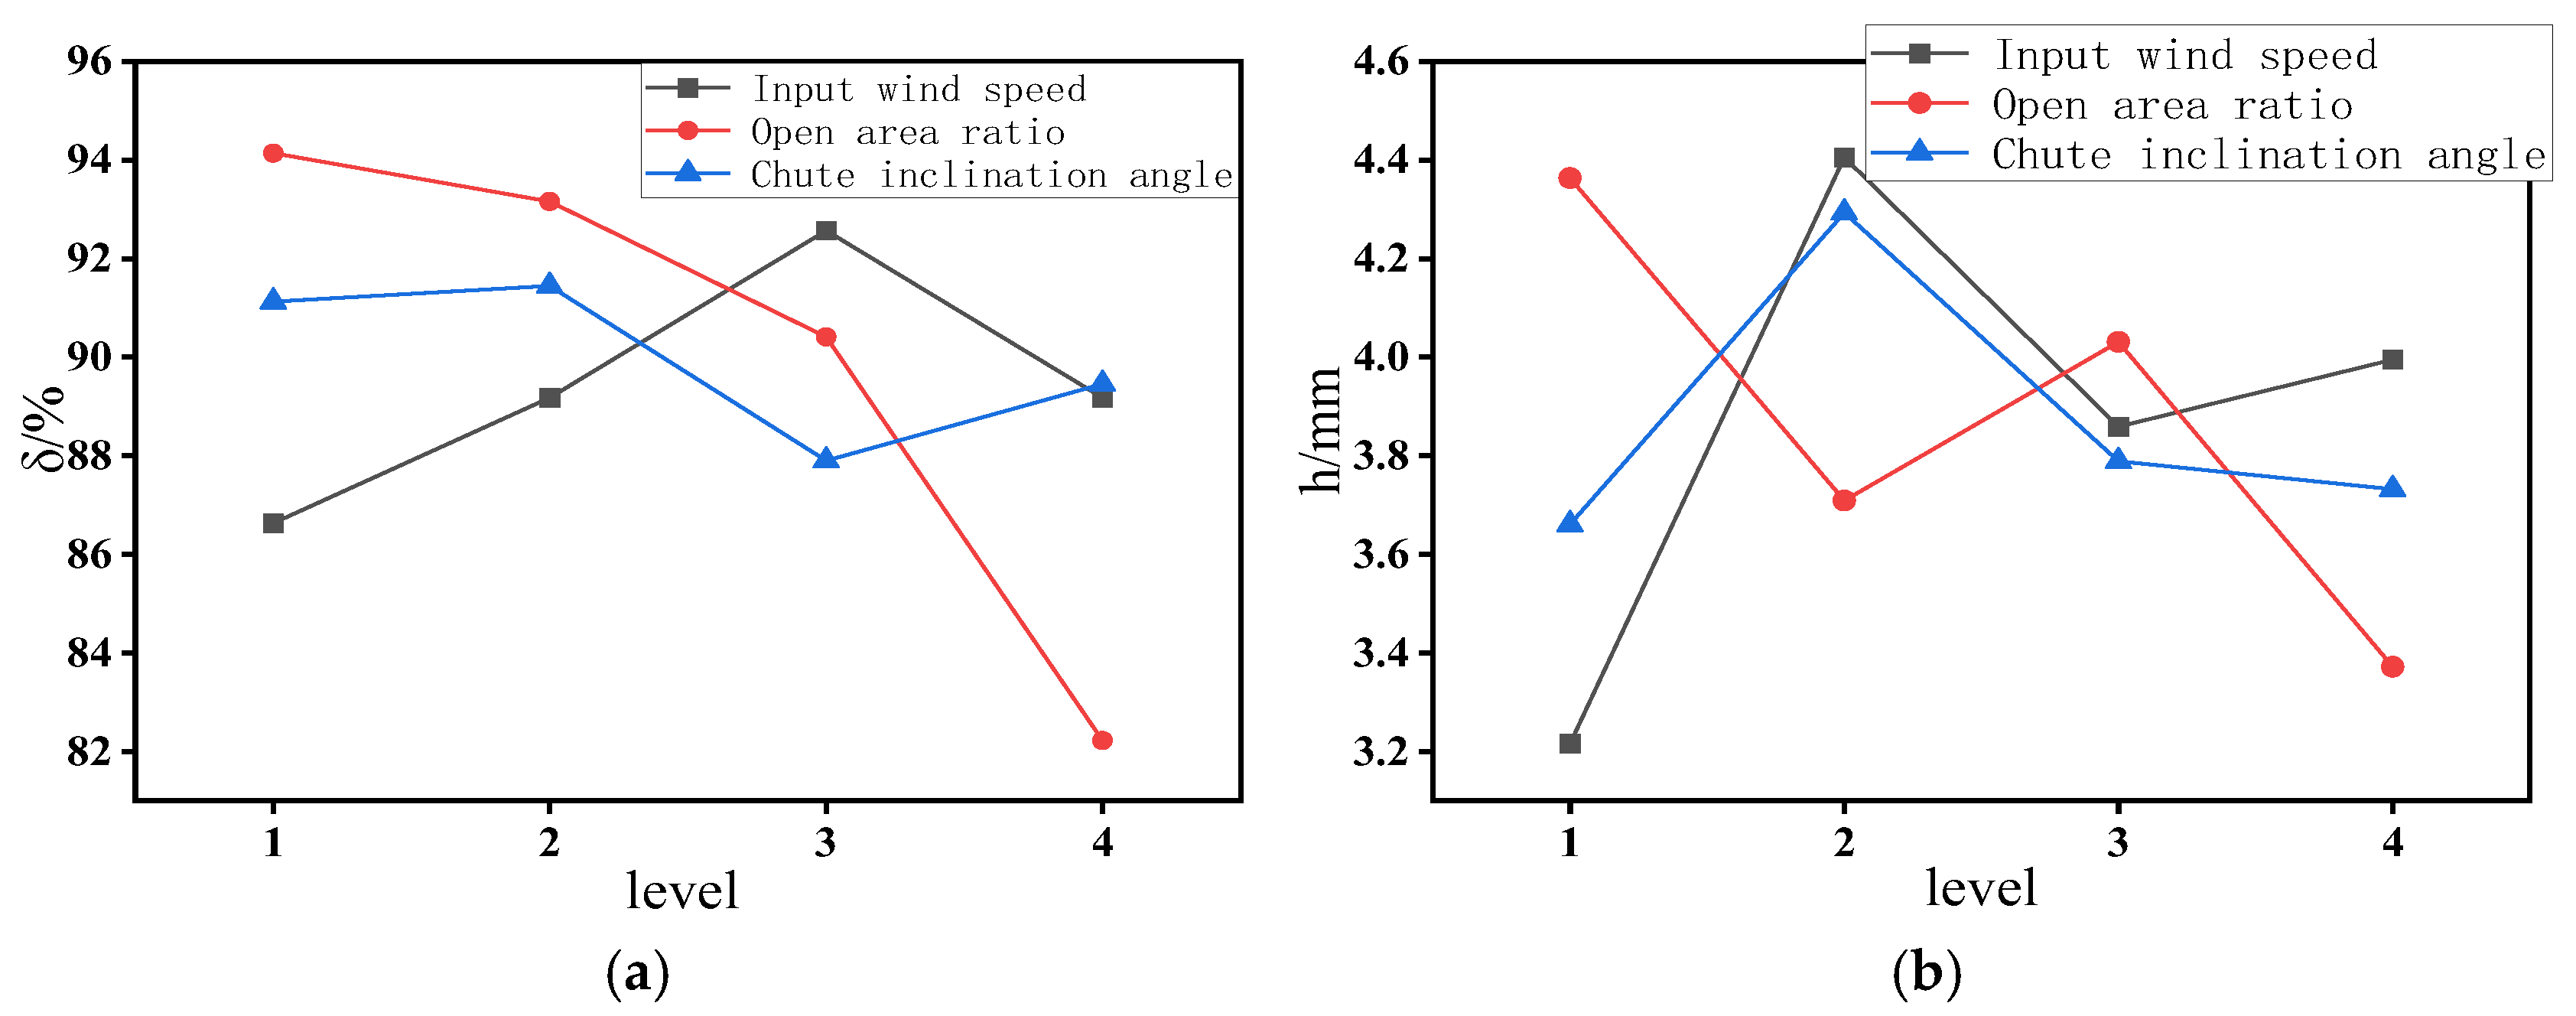
Figure 13.
Analysis of
Figure 13a reveals that through comparative range analysis of each influencing factor on the two indicators, the primary-to-secondary ranking of the three factors affecting the conveying ratio is permeable baffle porosity > inlet air velocity > chute inclination angle.
Figure 13b demonstrates that the ranking of factors influencing surface fluctuation difference is as follows: inlet air velocity > baffle porosity > chute inclination angle. The observed trend variations differ from those in the single-factor analysis due to inherent interactions among the three factors. Orthogonal analysis (
Table 4) indicates that the optimal parameter combination for maximizing conveying ratio is A3B1C2. For minimizing surface fluctuations and enhancing layer stability, the optimal combination is A1B4C1.
4.3. Multi-Index Orthogonal Test Weight Analysis
Through range analysis of the orthogonal experiments above, it was found that all three factors significantly influence the evaluation indicators, and the optimal parameter combinations for each of the two evaluation indicators were determined. To achieve the goal of optimizing the chute design, it is necessary to identify a common optimal parameter combination that satisfies both evaluation indicators. Therefore, a matrix analysis method was employed to assess the influence of factor levels on the weights of experimental results. Following the methodology described in the reference, a matrix analysis model was constructed, and the experimental data from
Table 4 were incorporated into the calculations. The detailed computational procedure is as follows:
where
M1 is the test indicator layer matrix;
T1 is the factor layer matrix;
S1 is the level layer matrix; and
W1 is the weight matrix of indicator values.
According to the matrix analysis method, when evaluating indicators where smaller values are preferable, the
Kij values in the test indicator layer matrix
M2 should be taken as 1/
Kij. The calculation methods for the factor layer matrix
T2 and level layer matrix
S2 follow the same principle as Equation (4). The total weight matrix
W is then computed as shown in Equation (5).
The matrix analysis results from Equation (5) reveal the following comprehensive influence ranking of the three factors on the evaluation indicators: B > A > C, indicating that permeable baffle porosity exerts greater influence than inlet air velocity, which in turn surpasses chute inclination angle. Further analysis of Equation (5) demonstrates the following among different levels: for factor B (porosity), level B1 carries the highest weight; for factor A (air velocity), level A3 shows maximum influence; and for factor C (inclination angle), level C2 dominates. The comprehensive weight evaluation identifies A3B1C2 as the optimal multi-objective parameter combination for the air slide operation. Simulation tests under this optimal configuration yielded a conveying ratio of 96.52% and a surface fluctuation of 4.39 mm. Comparative analysis with orthogonal experiment results shows both performance metrics maintain relatively high values, confirming that the two key performance indicators of the air slide cannot be simultaneously optimized to their respective peak levels.


