1. Introduction
Nuclear fusion has the potential to provide a consistent and cost-effective energy source, thereby offering a viable solution to the current energy crisis. Additionally, it can effectively achieve carbon neutrality and address environmental concerns. The economic viability of a nuclear fusion reactor [
1,
2] lies in its ability to generate more energy than it consumes, which can be achieved through device enlargement and increasing magnetic field strength. The International Thermonuclear Experimental Reactor (ITER), a giant multinational project costing over USD 20 billion [
3,
4], represents a significant step towards this goal. Conversely, compact fusion devices [
5], leveraging advancements in high-temperature superconducting (HTS) technology [
6,
7,
8], have garnered considerable attention due to their high magnetic field strength and affordability. This approach has the potential to accelerate the commercialization of fusion technology by reducing device size and cost. Realigning with this prevailing trend, China’s compact fusion device planned for construction by the Institute of Plasma Physics Chinese Academy of Sciences (ASIPP) serves as China’s next milestone in the development of magnetic confinement fusion before the China Fusion Engineering Test Reactor (CFETR) [
9]. The ASIPP’s expertise in the construction and operation of the Experimental Advanced Superconducting Tokamak (EAST) [
10] will significantly contribute to the successful implementation of this project.
The large magnetic field generated by the CS magnet will impose high stress on the jacket of the conductor for the magnet. To address this challenge, a specialized high-strength jacket named CHSN01 has been developed for the device, featuring a yield strength of up to 1500 MPa. Further details regarding this development will be presented subsequently. One cycle of alternating current operation in the CS magnet can excite the plasma to discharge electricity once. The current variation in the CS magnet results in stress fluctuations in the CS magnet jacket. The device is designed to discharge plasma 60,000 times, thereby requiring the CS magnet jacket to endure the same number of stress cycles. Cracks that form during the manufacturing of the jacket are prone to grow under such stress cycles, leading to deterioration in mechanical properties and even fractures, posing significant risks for its safe operation.
Fracture mechanics suggests that cracks [
11,
12] of a certain size can exist safely in any structure and grow during load cycles up to a critical size where structural strength is compromised. This approach which is applied to engineering design can reduce the costs related to the components of enormous size without affecting safety by providing information such as the maximum allowable crack size or the maximum number of sustainable loading cycles. The fatigue crack growth rate (FCGR),
da/
dN [
13], which is the change rate of crack length
a with cycle times
N under the action of a fatigue load, reflects the speed of crack growth and plays an important role in estimating the fatigue life of cracked bodies. Therefore, the maximum allowable defect area should be obtained based on the required number of cycles experienced and FCGR. When conducting non-destructive testing on the jacket, the crack area must not exceed this value.
The simulation of FCGR can employ various techniques, including the finite element method (FEM), the extended finite element method (XFEM), cohesive zone modeling (CZM), and the virtual crack closure technique (VCCT). Compared to the traditional FEM, the XFEM eliminates the need for mesh repartitioning and does not require a higher density mesh in regions of high stress concentration. Verma et al. [
14] used the XFEM to study the tensile, fracture, and fatigue properties of the Ti6Al4V alloy, simulated the crack propagation process, and analyzed the fatigue life of the samples with a central crack and a double-face crack. Gomez et al. [
15] benchmarked the XFEM and the boundary element method (BEM), giving close results, with the latter using less computational power. CZM is a phenomenological model that avoids the stress singularity of a crack tip in linear elastic fracture mechanics (LEFM) and predicts the failure behavior of materials by calculating the stress and fracture energy during the cracking process. Zhang et al. [
16] simulated the multi-crack behavior of ultra-high-performance fiber-reinforced concrete (UHPFRC) by using CZM. The cracks of mortar of structural members were simulated by using a discrete cohesive crack model, which was realized by using a six-node three-dimensional cohesive interface element in ABAQUS. The VCCT has the advantages of no special treatment for the crack tip element and a low requirement for mesh size, and it can clearly separate the crack of mixed mode. Martulli and Bernasconi [
17] proposed an algorithm based on VCCT to predict the three-dimensional fatigue delamination behavior of laminated composites, which was called Sequential Static Fatigue (SSF). A concrete example was used to simulate the fatigue expansion process of lamination defects in laminated composites. Compared with the direct cycle (DC) algorithm based on ABAQUS, it has higher calculation accuracy and efficiency. There are several modern finite element simulation tools for fatigue crack propagation problems, including ANSYS, ABAQUS, FRANC3D, etc. Relevant models and technical methods have been added to these simulation software; therefore, researchers can efficiently perform FCGR analysis [
18,
19,
20,
21,
22].
Three primary methods have been widely applied to analyze material fatigue life: the fracture mechanics method developed by Paris and Erdogan [
23], the strain–life method introduced by Coffin [
24], and the stress–life method proposed by Wöhler [
25]. In this study, the fracture mechanics approach is utilized to predict fatigue life, allowing for the detailed characterization of the crack tip using stress intensity factor
K. Under typical conditions, the stress intensity factor range ∆
K is dependent on the crack configuration in addition to applied stress range ∆
σ and crack size
a:
where
Y is the crack configuration factor, which takes into account variables such as crack shape, location, and specimen geometry.
The jacket material for ITER is JK2LB, and FCGR analysis [
26] has been conducted on this jacket under the principal stress that is caused by the electromagnetic force generated in one cycle plasma operation of ITER using a single-jacket model. FCGR tests [
27] indicate that the JK2LB material exhibits significantly lower crack growth rates compared to the Cefival 316LN jacket material. Additionally, the fracture toughness of the JK2LB material is approximately 35% lower than that of the Cefival 316LN jacket material. FCGR data for the Nitronic
® 50, JK2LB, and 316LN stainless steels have been compiled into one study [
28] for a comparison, and N50 in particular contains several significant outliers that warrant further investigation.
Firstly, this paper introduces the key parameters of the device as well as the research and development progress of the jacket. Then, the combination of FEM and the maximum likelihood estimation method (MLEM) [
29] is used to evaluate the maximum tolerance threshold for initial defects in the fusion CS magnet jacket. To achieve a more precise characterization of the dependence of the stress intensity factor range ∆
K on jacket defect depth
a, a full model incorporating 12 coils is utilized under the actual cyclic loads. FCGR measurements are conducted experimentally for the
R ratio (representing the proportion between the minimum and maximum stresses during cyclic loading conditions) equal to 0.1 at 4.2 Kelvin (K) using full-size jackets made from the CHSN01 material. The parameters
C and
m of the Paris equation shown in Equation (4) are derived by fitting the FCGR data while considering modifications due to the
R ratio. MLEM is utilized to compute the probability equation of FCGR with a random variable description. The plots depicting the relationship between the number of cycles and the initial crack area for CS jackets are obtained by integrating the FCGR uncertainty equation of the jacket with a probability of
P = 99%. Finally, the maximum tolerable initial defect areas for jackets to sustain 60,000 plasma pulses are determined and discussed, which should be detectable through non-destructive testing methods.
2. Development of the CHSN01 Jacket
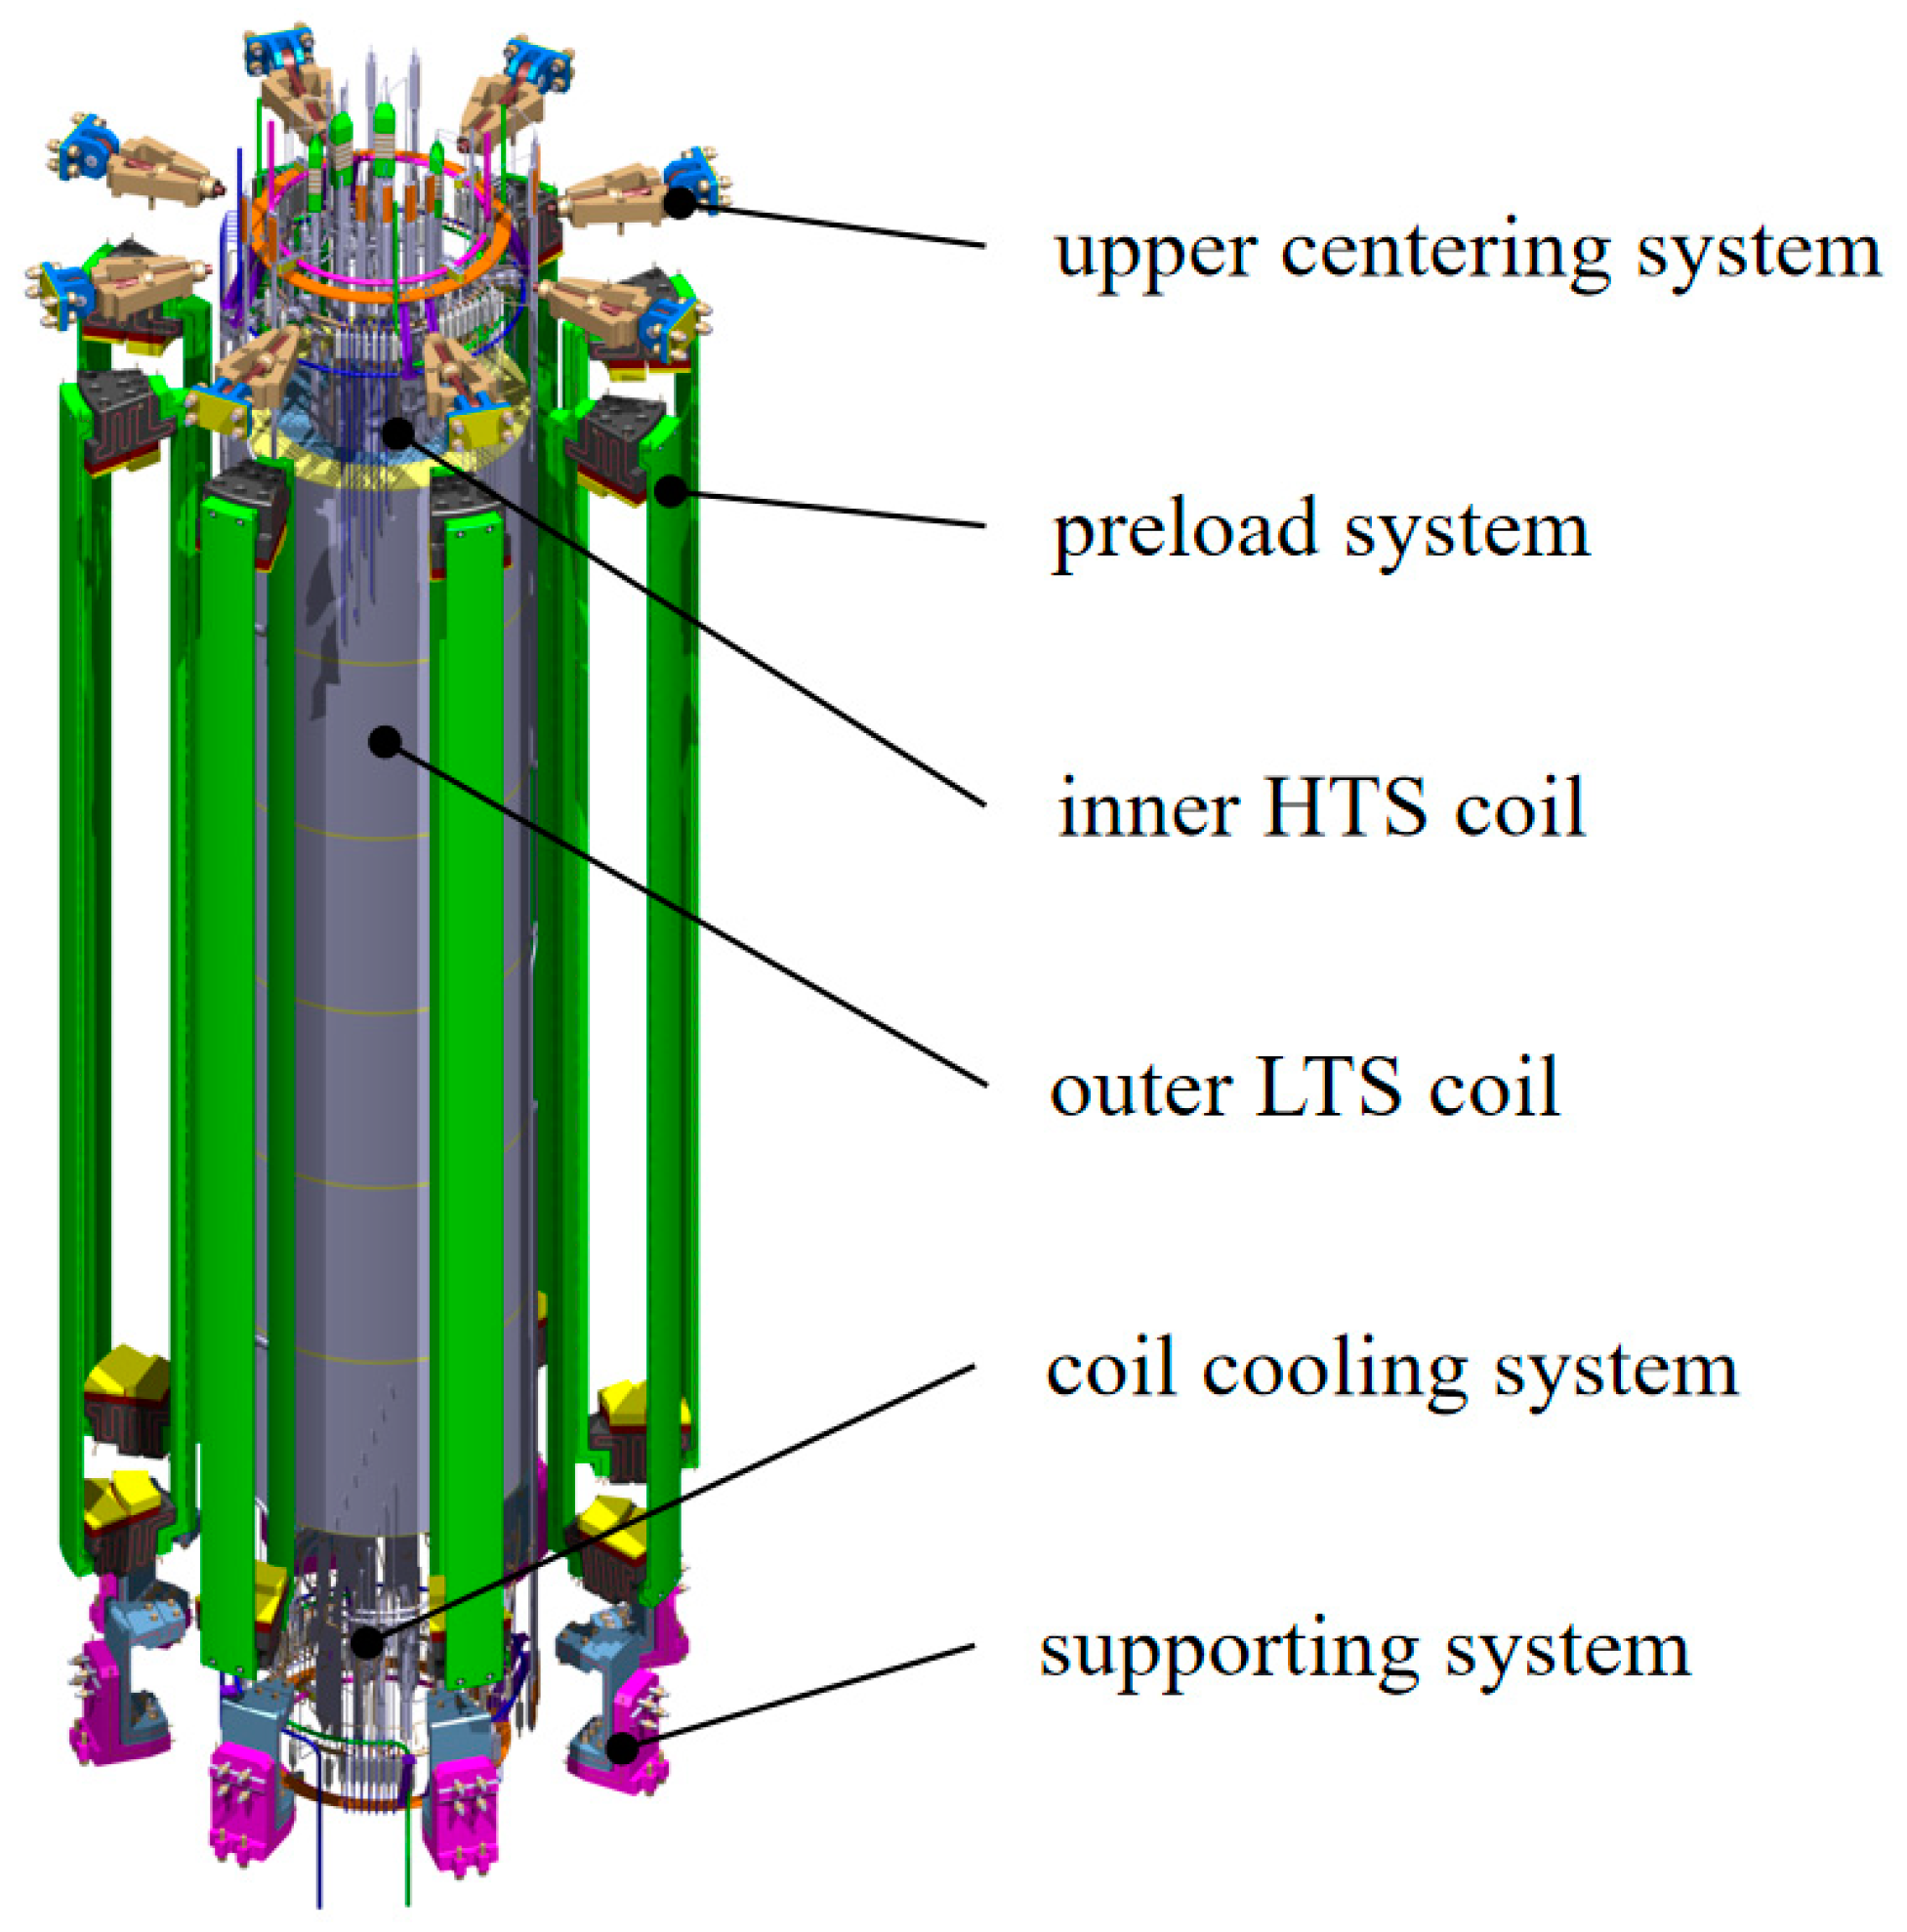
The objective of China’s compact fusion device is to demonstrate fusion energy production with a fusion power of 40–200 MW and a fusion power gain (Q) exceeding 1. To accomplish this, the central solenoid (CS) must provide more than 50 volt-seconds to induce and sustain a plasma current of 4–7 MA. The CS magnet, which should generate a high magnetic field, is composed of six vertically stacked modules, each containing an inner HTS coil and an outer low-temperature superconducting (LTS) coil. The schematic diagram and the key parameters of the CS magnet are presented in
Figure 1 and
Table 1. The HTS coil is wound by a rare-earth barium copper oxide (REBCO) cable-in-conduit conductor (CICC) [
30], which comprises six conductor on round core (CORC) sub-cables helically wound around a copper tube.
With a maximum magnetic field strength reaching 20 T and electromagnetic stress on the CS magnet jacket up to 1300 MPa, employing high-strength stainless steel as the jacket material becomes imperative. Developed in China and based on the N50 nitrogen-controlled austenitic stainless steel material, modified N50 (CHSN01, formerly known as N50H) [
31,
32] exhibits exceptional low-temperature mechanical properties by the approaches compared with the standard UNS S20910 (N50) as follows:
- (1)
The C content in CHSN01 is less than 0.01, while the C content in UNS S20910 is less than 0.06. The presence of carbon elements in steel will lead to the precipitation of M23C6 carbides in the matrix during the long aging process, which seriously deteriorates the low-temperature plastic toughness and corrosion resistance of steel; therefore, the ultra-low carbon content is controlled in CHSN01;
- (2)
Ni, as one of the most important alloying elements in austenite formation, can enlarge the austenite phase region and inhibit the formation of high-temperature δ ferrite. In addition, Ni can improve the low-temperature performance of austenitic nickel–chromium stainless steel, and the low-temperature toughness is significantly improved with the increase in nickel. Overall, the Ni content (14.5–15.5) in CHSN01 is slightly higher than the UNS S20910 specification of 11.5–13.5;
- (3)
In addition, the O content in CHSN01 is about 20 ppm, which is not mentioned in the UNS S20910. If the oxygen content is too high, oxygen will exist in the form of various inclusions, which will seriously reduce the plastic toughness, fatigue properties, and cold–hot processing properties of steel.
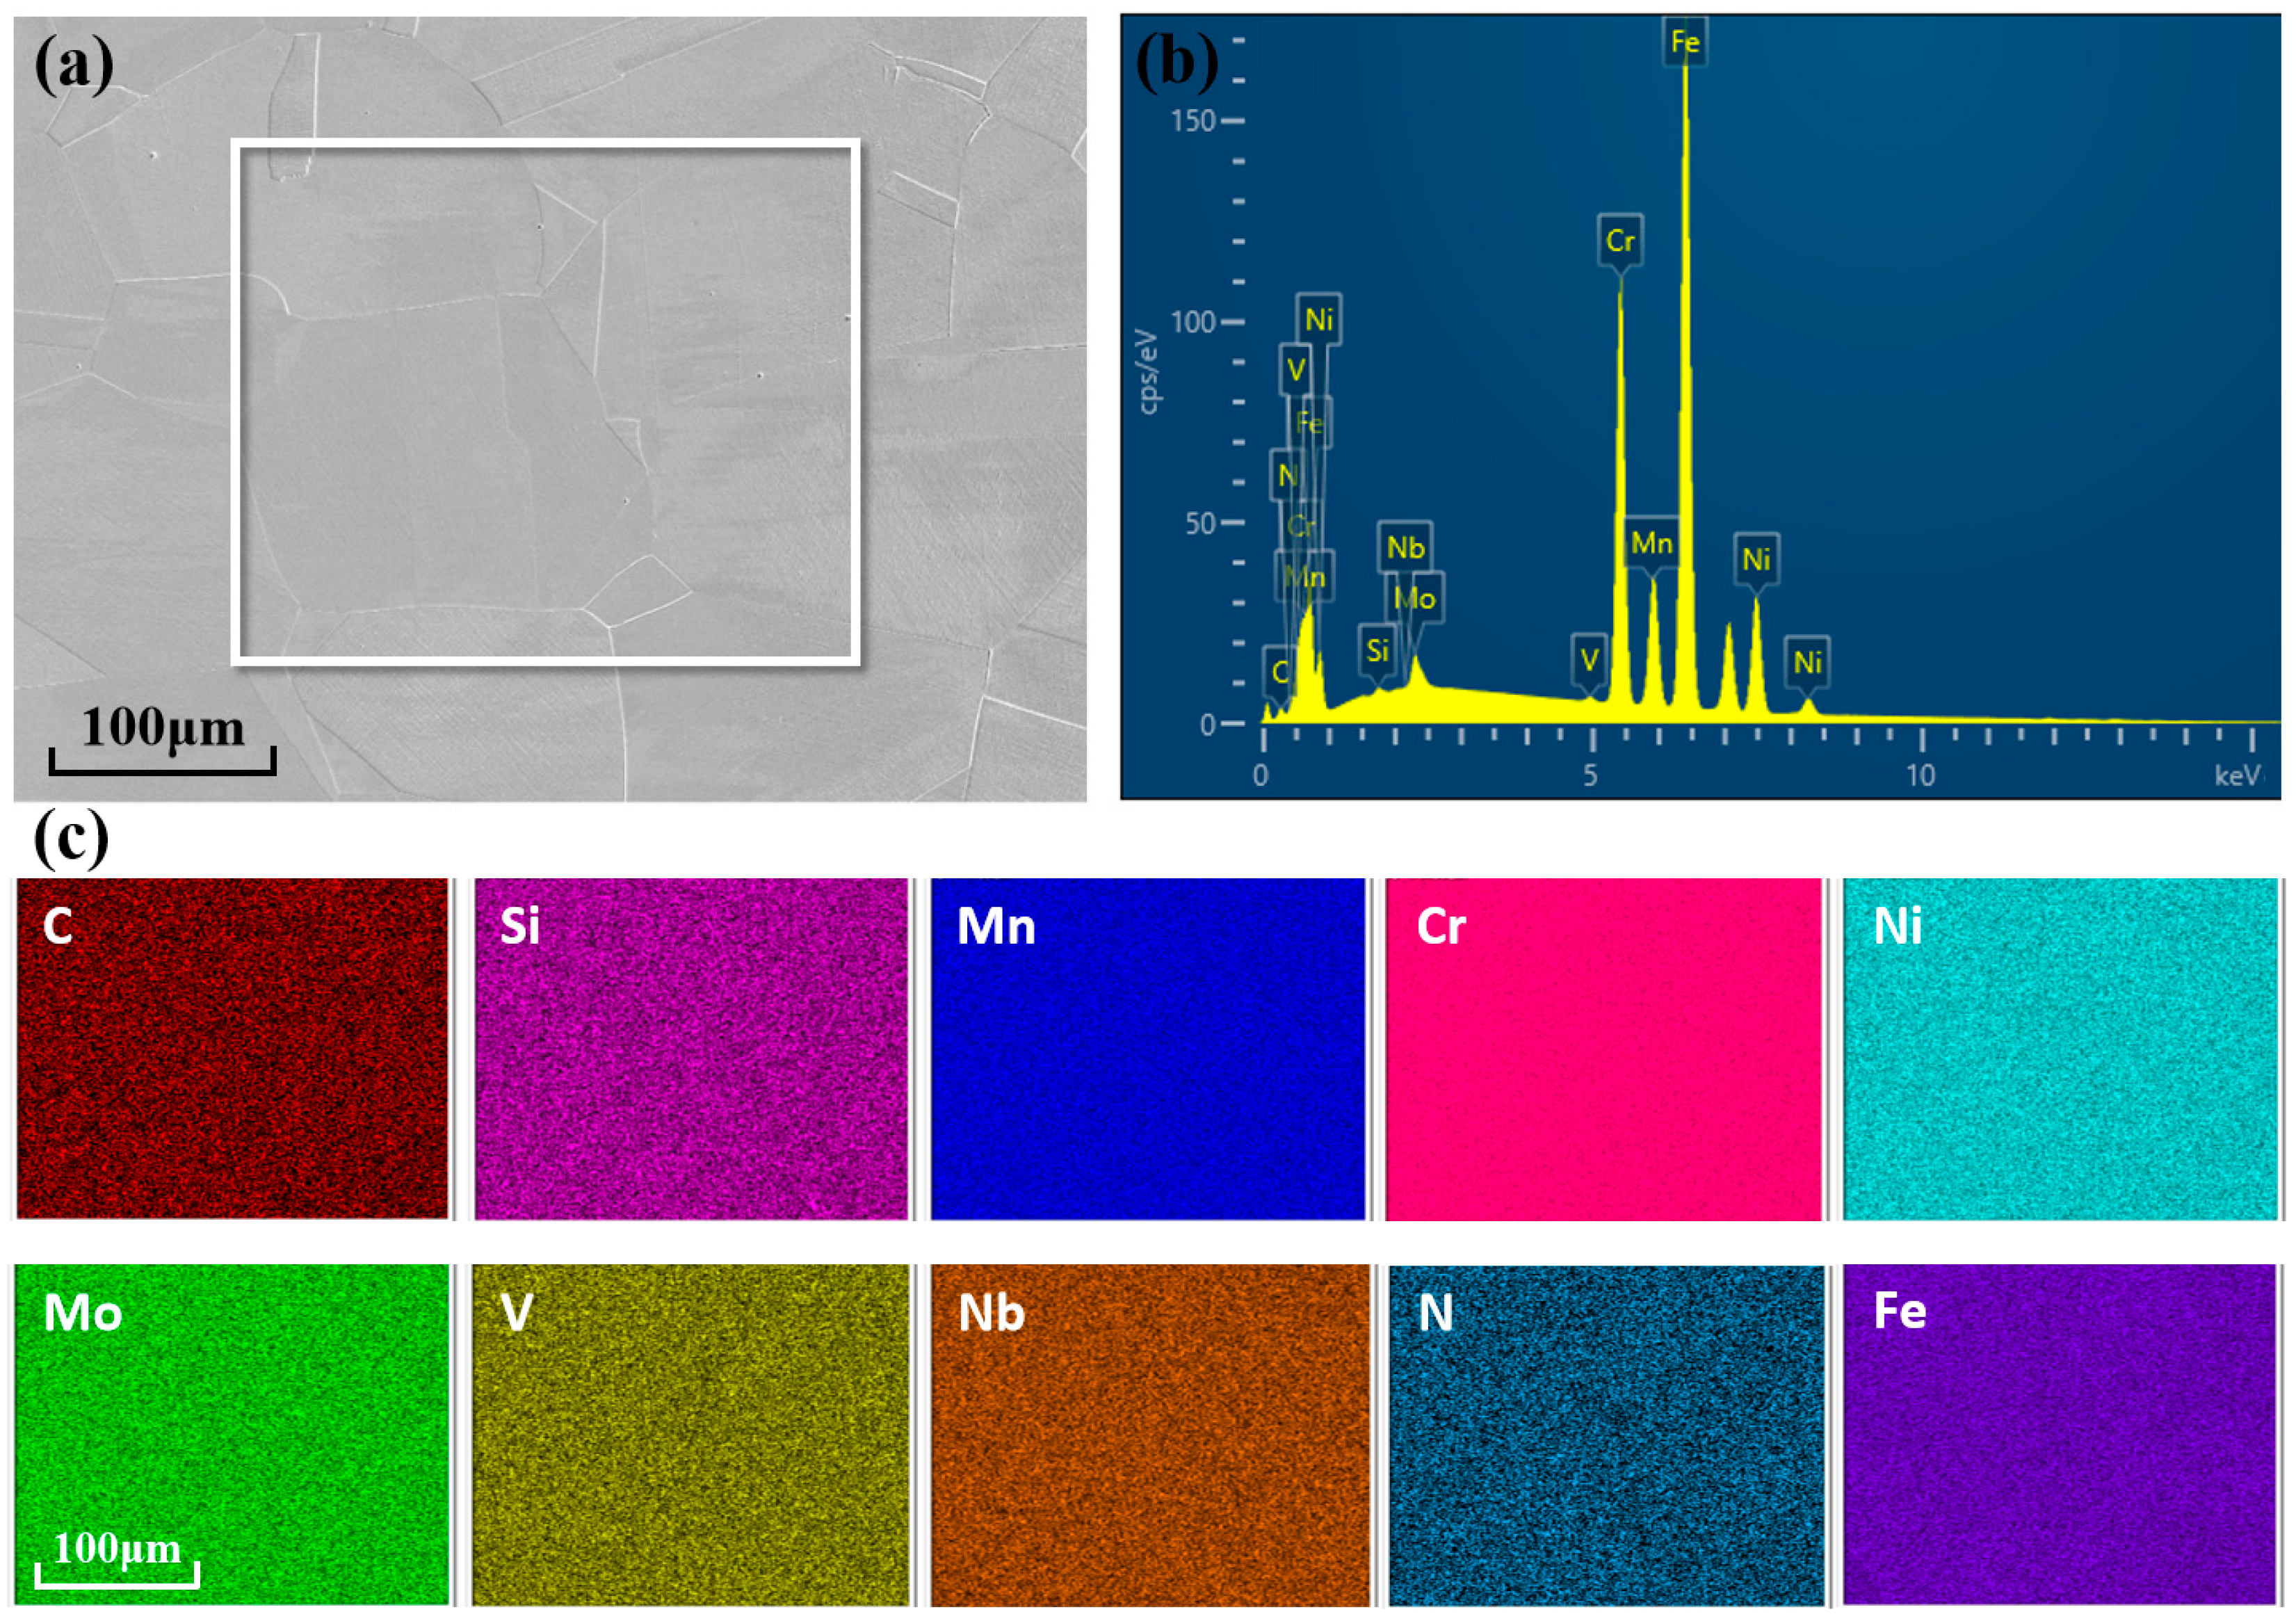
With a yield strength of over 1500 MPa at 4.2 K, which meets the stress requirements, CHSN01 is utilized as the CS jacket material. An FEI Quanta 600 (Thermo Fisher Scientific Inc., Waltham, MA, USA) scanning electron microscope (SEM) equipped with energy-dispersive spectroscopy (EDS) was used for the observations. As shown in
Figure 2, the SEM–EDS elemental mapping results indicate that the spatial distribution of each CHSN01 element is homogeneous.
Table 2 lists the chemical composition of CHSN01 after at least five measurements.
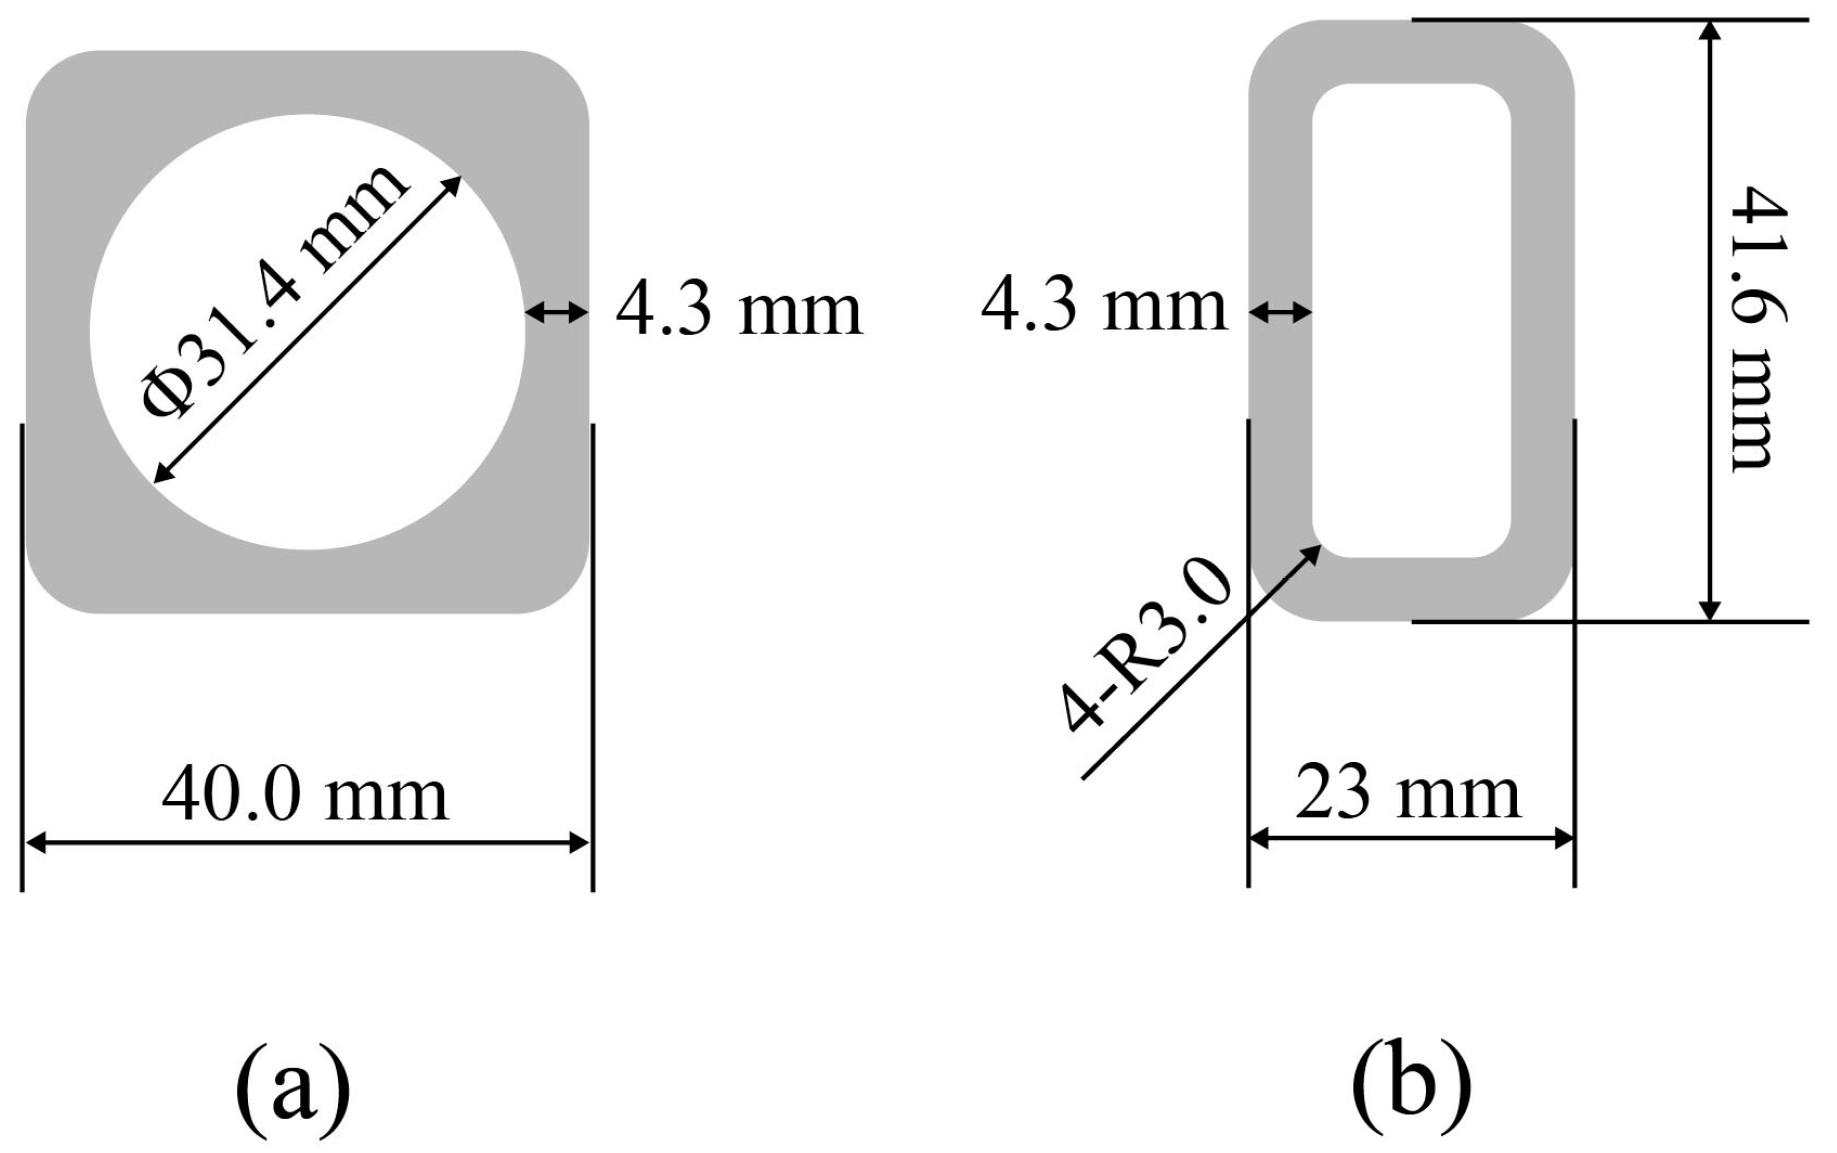
Figure 3 illustrates the cross sections of the REBCO jacket and the Nb
3Sn jacket; although they possess different geometries, their thickness remains uniform at 4.3 mm. Both the REBCO and Nb
3Sn jackets must undergo 4% cold working (CW) according to the CICC preparation process; additionally, the Nb
3Sn conductor requires further heat treatment (HT), known as “650 °C Nb
3Sn superconductor reaction aging”, after CW.
Table 3 lists the mechanical properties of CHSN01 such as yield strength (YS), ultimate tensile strength (UTS), elongation (EL), and fracture toughness (K
IC), which were obtained via the tensile test. Samples were taken from five batches of jackets, respectively, for tensile tests. It can be found that no significant degradation is observed in the CHSN01 jacket after the aging process, and both jackets fulfill the stress requirement.
3. FCGR Experiment
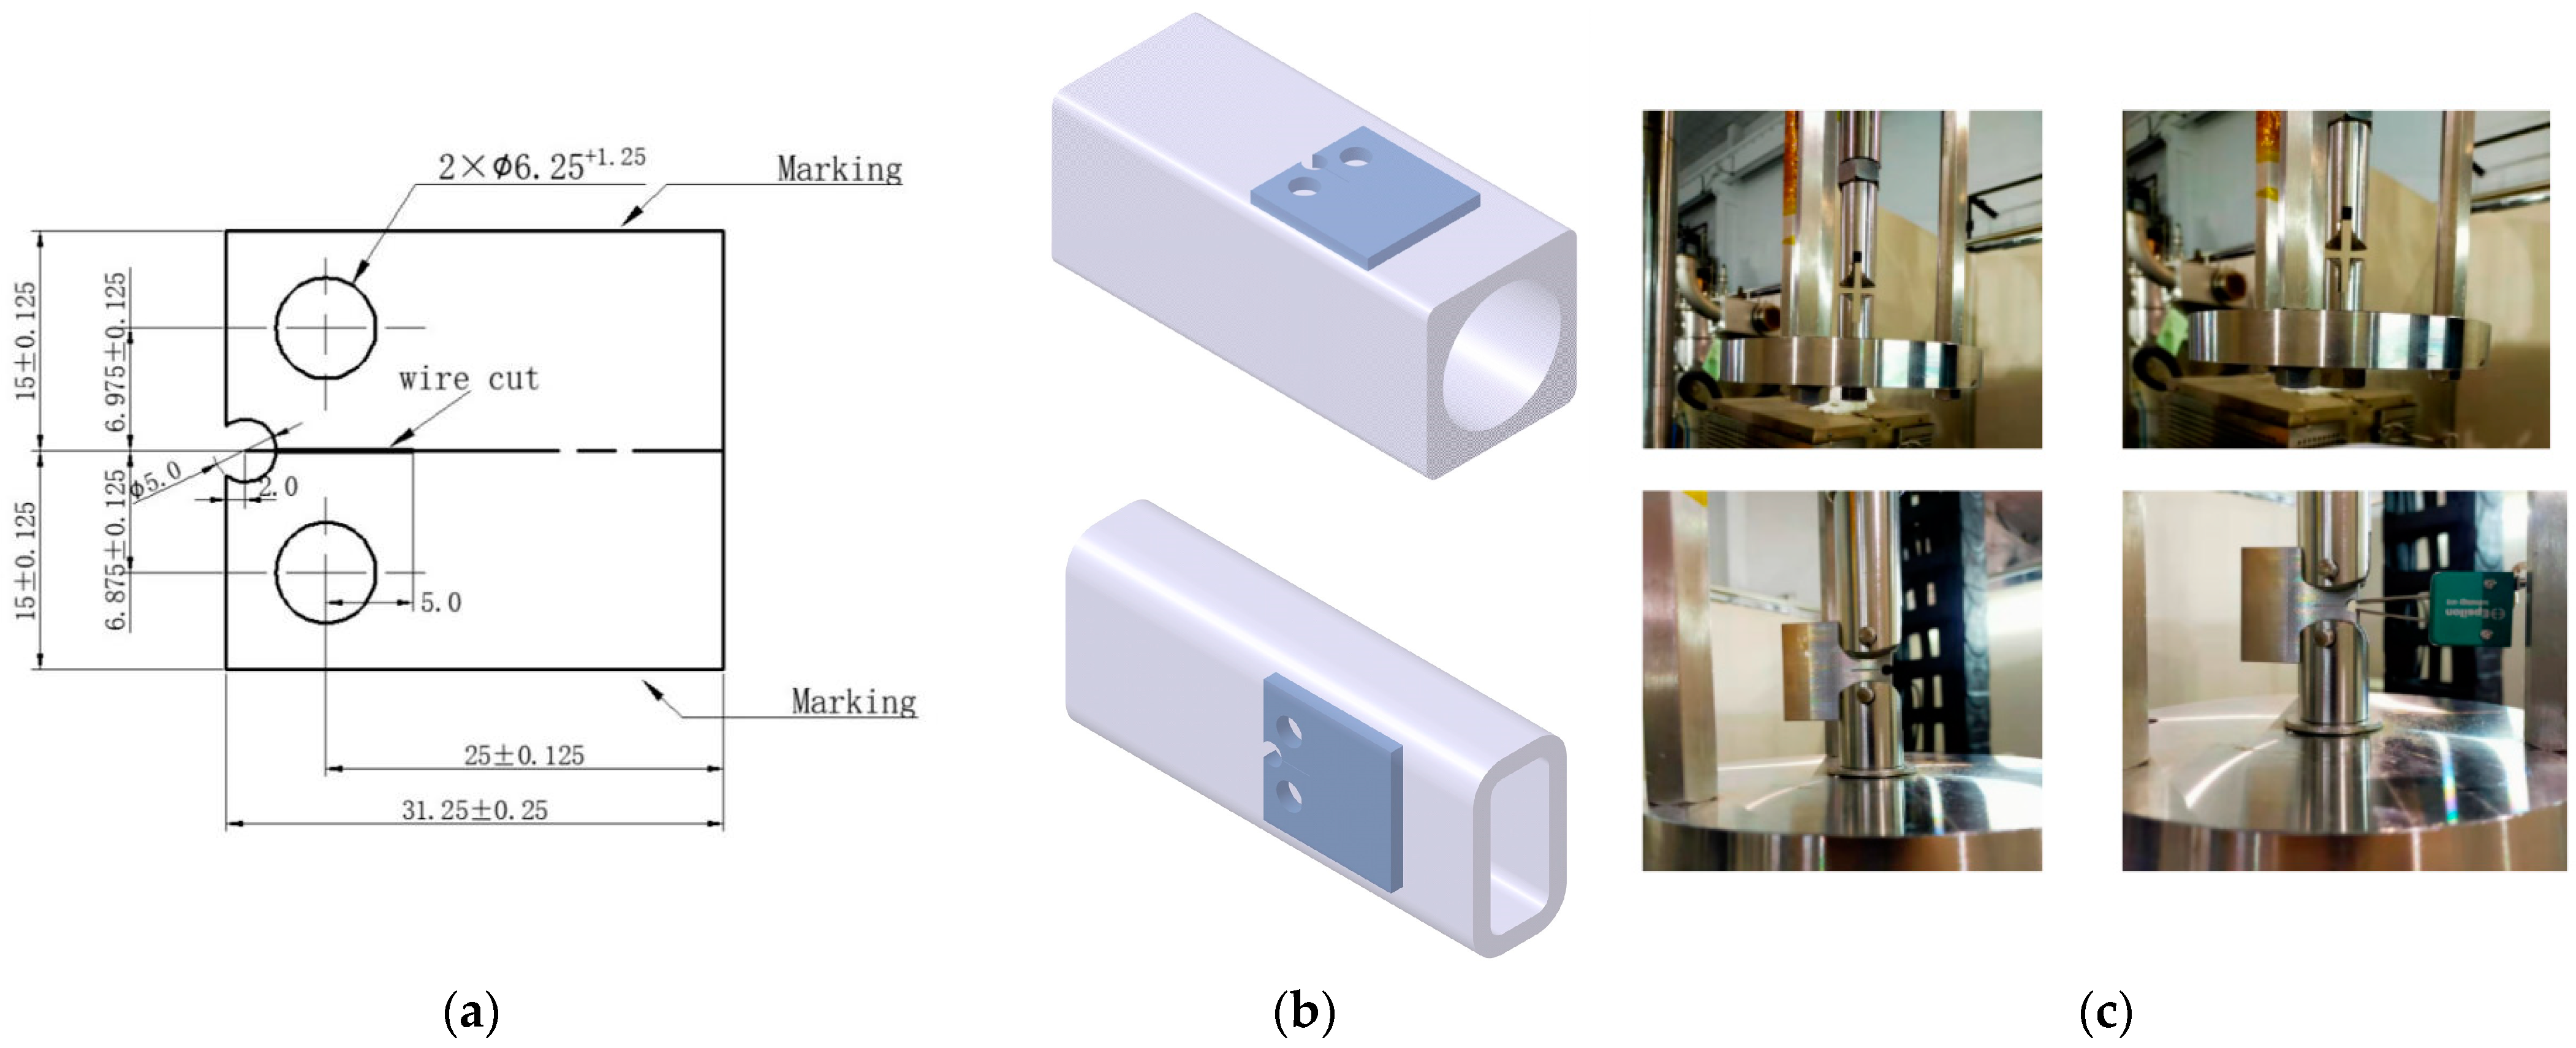
The sample size is shown in
Figure 4; its thickness is 4 mm, and the initial slit width introduced into the CT specimen is 0.2 mm. The FCGR test was carried out by a servo hydraulic power testing machine (Instron Model 8802, Illinois Tool Works Inc., Norwood, MA, USA) with a capacity of 100 kN. In the first step, the fatigue crack was prefabricated at room temperature, and in the second step, the FCGR test was performed at 4.2 K. In order to obtain a low-temperature environment of 4.2 K, the fixture and sample were first put into a low-temperature Dewar filled with liquid nitrogen for pre-cooling. After a period of time, the liquid nitrogen was poured out, and liquid helium was transferred into the low-temperature Dewar to cool the fixture and sample. When the sample temperature reached 4.2 K, the transfer of liquid helium was stopped, and the FCGR experiment was started. The relevant experiments for pre-cracked CT specimens followed the procedures described in the ASTM E647 standard [
33], employing a constant load control mode with a load ratio
R of 0.1 and a constant frequency of 15 Hz to obtain classic FCGR behavior for the CHSN01 material. An Elipon clamping crack opening displacement COD (3541-005M-025M-LHT) meter was used to monitor the load displacement data, and the crack length was measured using the compliance method. Tests were performed with an initial stress intensity factor of around 10 MPa·m
0.5, which increased to approximately 80 MPa·m
0.5 by the end.
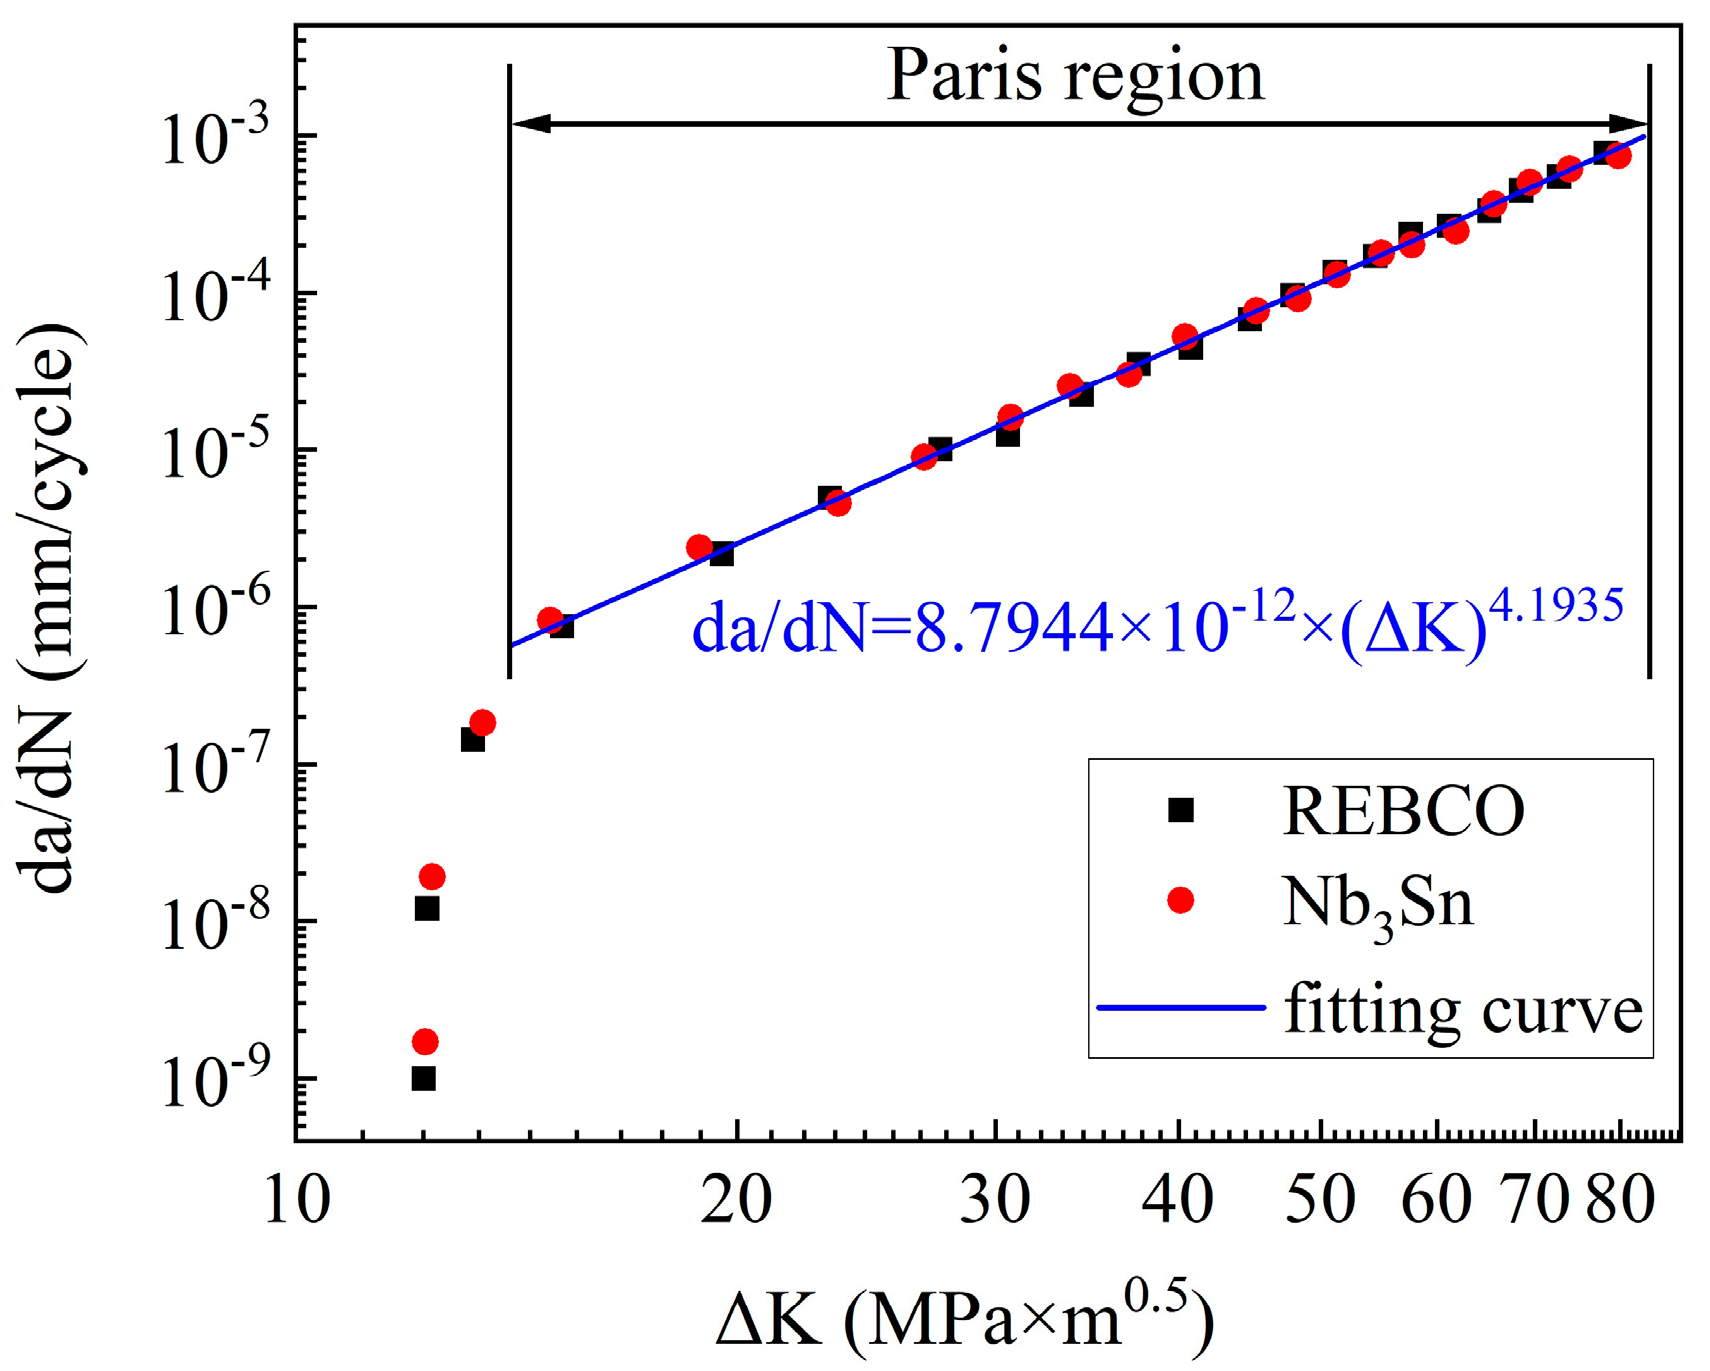
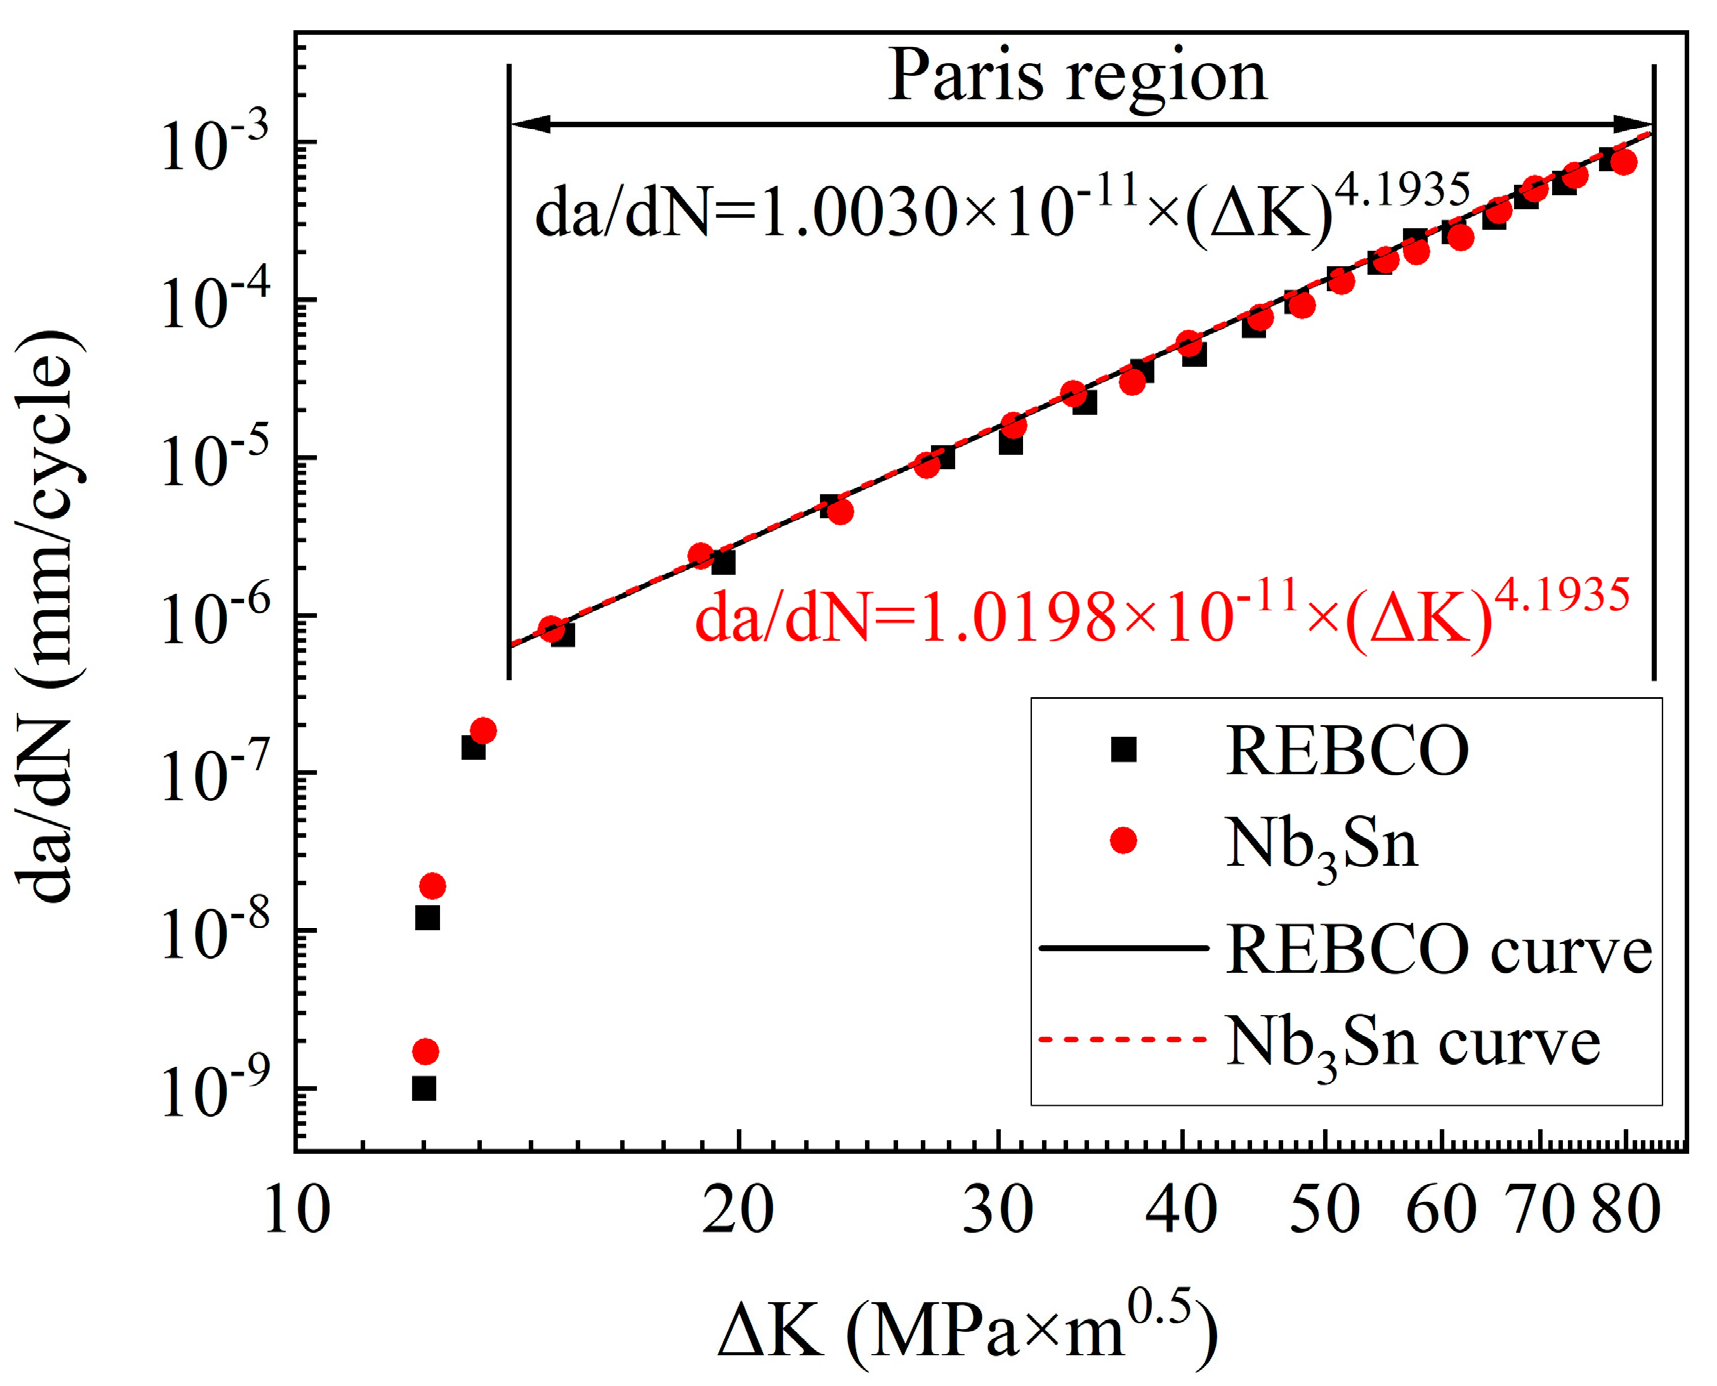
Figure 5 illustrates FCGR versus the stress intensity factor range for two types of developed CHSN01 jackets. Both the REBCO and Nb
3Sn jackets must undergo cold working, and the Nb
3Sn conductor requires additional 650 °C heat treatment aging after cold working. It can be found that no significant degradation in FCGR was observed in the CHSN01 jacket after the aging process. Consequently, fitting one curve represents data from both the REBCO and Nb
3Sn jackets within the Paris region. The FCGR test data presented in
Figure 5 were obtained through experimental measurements conducted on over 10 independent production batches. To ensure a conservative assessment of FCGR performance, the maximum values observed across all batches were adopted as the results in
Figure 5.
Generally, the fatigue crack growth behavior of any material is represented by the well-known Paris equation as follows:
where
da/
dN is the fatigue crack growth rate, ∆
K is the stress intensity factor range (∆
K =
Kmax −
Kmin),
Kmax and
Kmin are the maximum and minimum stress intensity factors, respectively, the exponent m is constant which depends on the material, and
C(R) is the value of
C at a certain
R ratio.
The coefficient
C(R) is determined based on the following set of equations:
where
C0 is the
C value of the material at
R = 0 and
mw is the Walker coefficient which is calibrated to 0.5 by experiments mentioned later. It is usually difficult to determine
C0 experimentally, and
C0.
1 is applied instead in many cases. The data points in
Figure 5 are fitted to obtain
C0.
1 = 8.7944 × 10
−12 and
m = 4.1935 for the CHSN01 jacket.
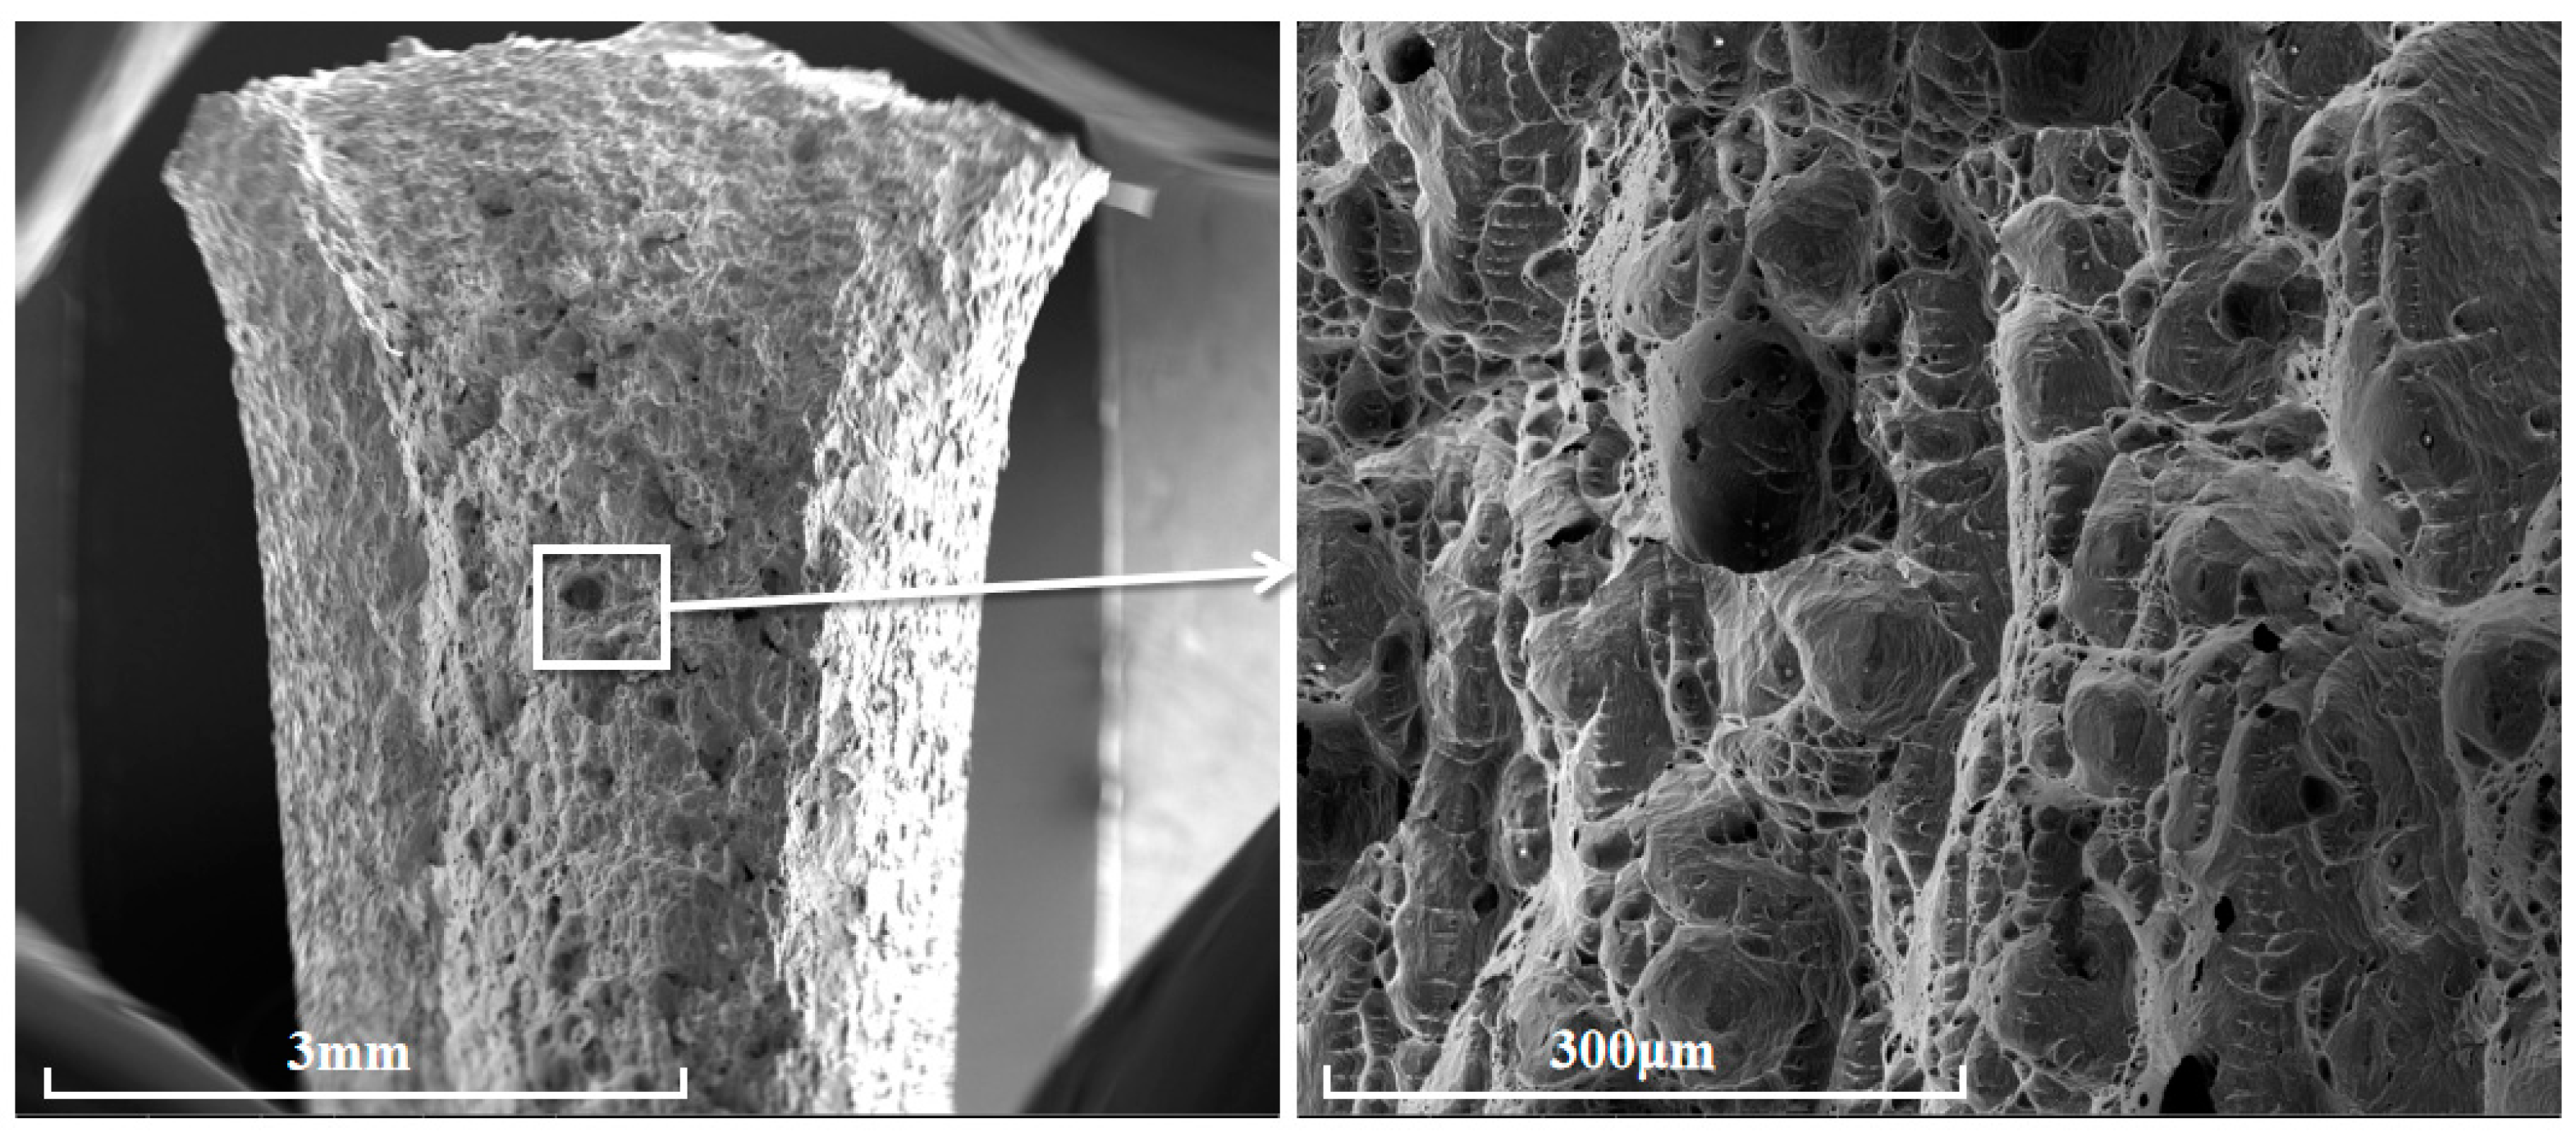
Figure 6 shows the microstructure of the CHSN01 specimen’s fracture surface. It can be seen that the dimples are relatively deep and densely distributed, which indicates that the material has undergone ductile fracture.
The FCGR tests in this study were performed under a standardized stress ratio of R = 0.1, which is consistent with ASTM testing protocols. Experimental evidence from our prior investigations indicates a positive correlation between the Paris law coefficient C and the stress ratio R, while the exponent m demonstrates remarkable stability across varying R conditions. Through systematic experimental validation, we have calibrated the mw coefficient in Equation (4). By combining Equations (3)–(5), the experimentally determined C value at R = 0.1 can be extrapolated to predict C values under actual operational R conditions.
4. Simulation of the Crack Model
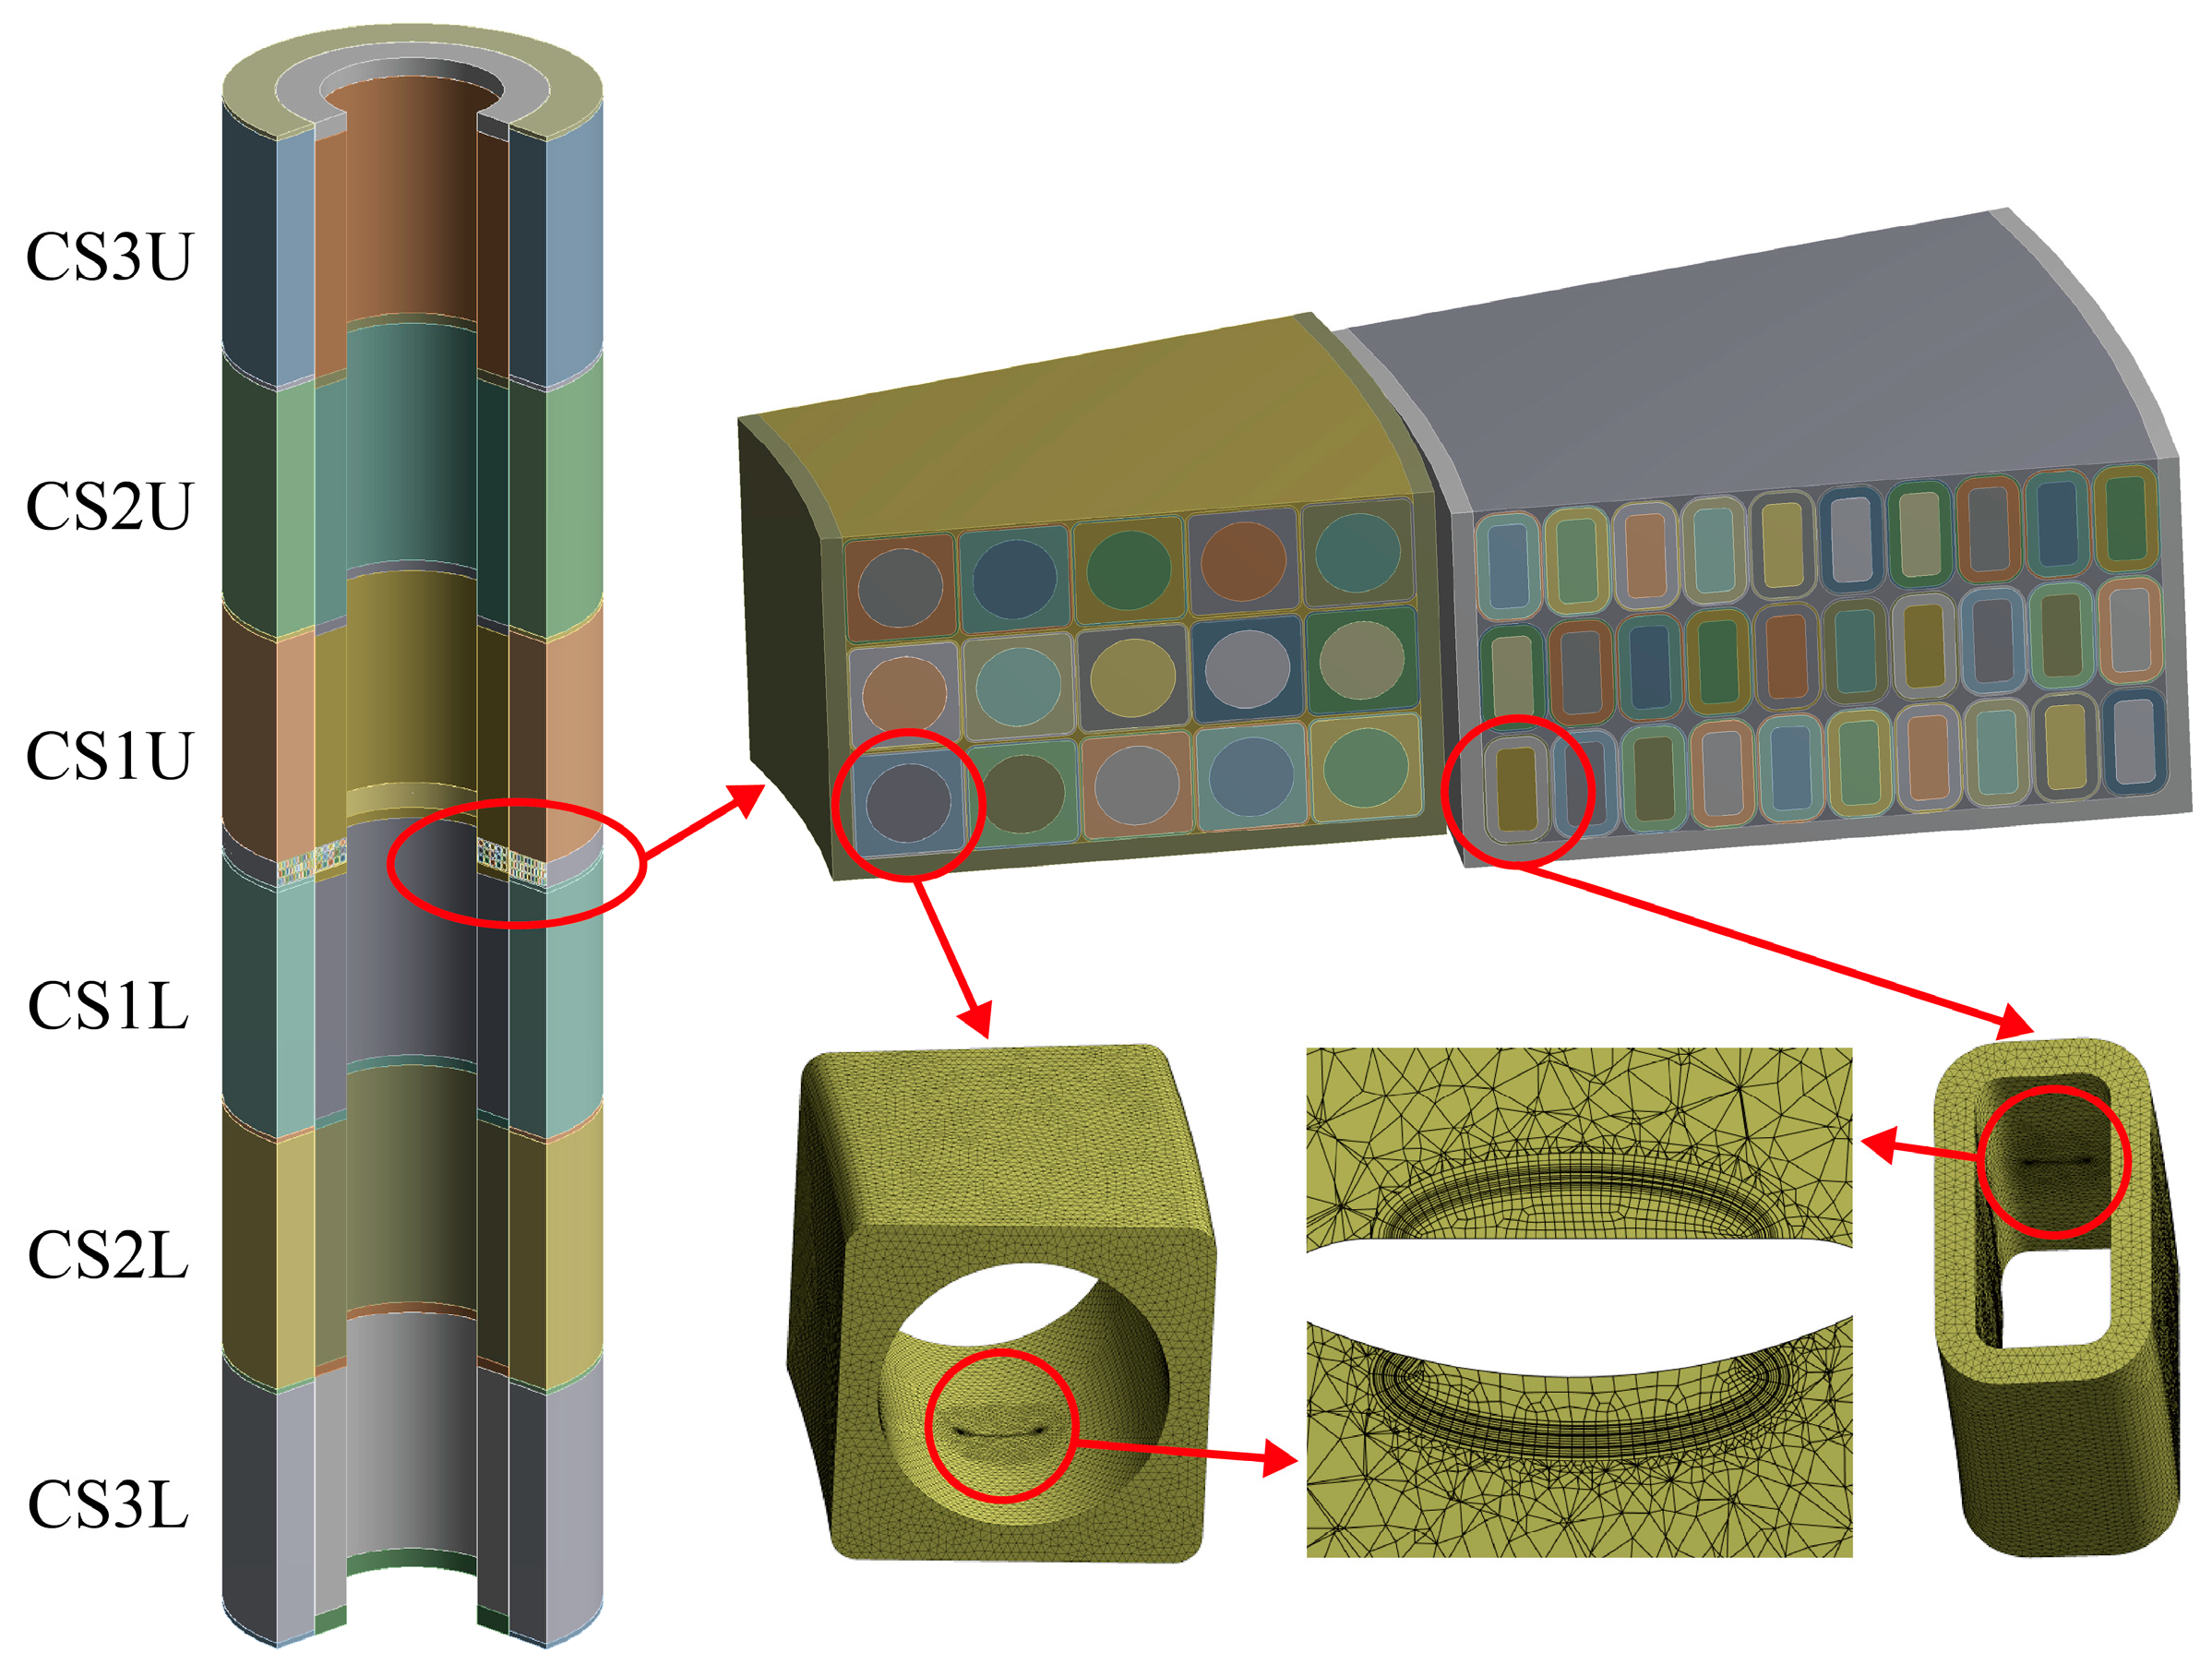
As shown in
Figure 7, a finite element model is built using the ANSYS 19.2 software to establish a more precise functional relationship between stress intensity factor range ∆
K and jacket defect depth
a. This model consists of six REBCO coils and six Nb
3Sn coils. In the lower CS1U module which experiences high levels of stress due to vertical compression and hoop expansion, the detailed structure of three pancakes comprising REBCO cables, Nb
3Sn cables, CHSN01 jackets, turn insulation, layer insulation, pancake insulation, and ground insulation is built. The innermost turns of both the REBCO coil and the Nb
3Sn coil are configured with a semi-elliptical surface defect.
In this model, frictional contact is considered between adjacent coils. At the bottom surface, axial displacement is constrained, while radial displacement remains free. Consequently, during cool-down and energization processes, the CS magnet is supported in its axial direction but can move radially. Mechanical analyses are performed under the following load conditions: (1) gravity, (2) preload at room temperature, (3) cooled down from room temperature to 4.2 K, and (4) the energization of the CS magnet at the start of waveform operation. After conducting the mesh independence analysis and accounting for a reasonable computational cost, the element size is set to 0.5 mm. And the numerical convergence threshold is set to 0.5%.
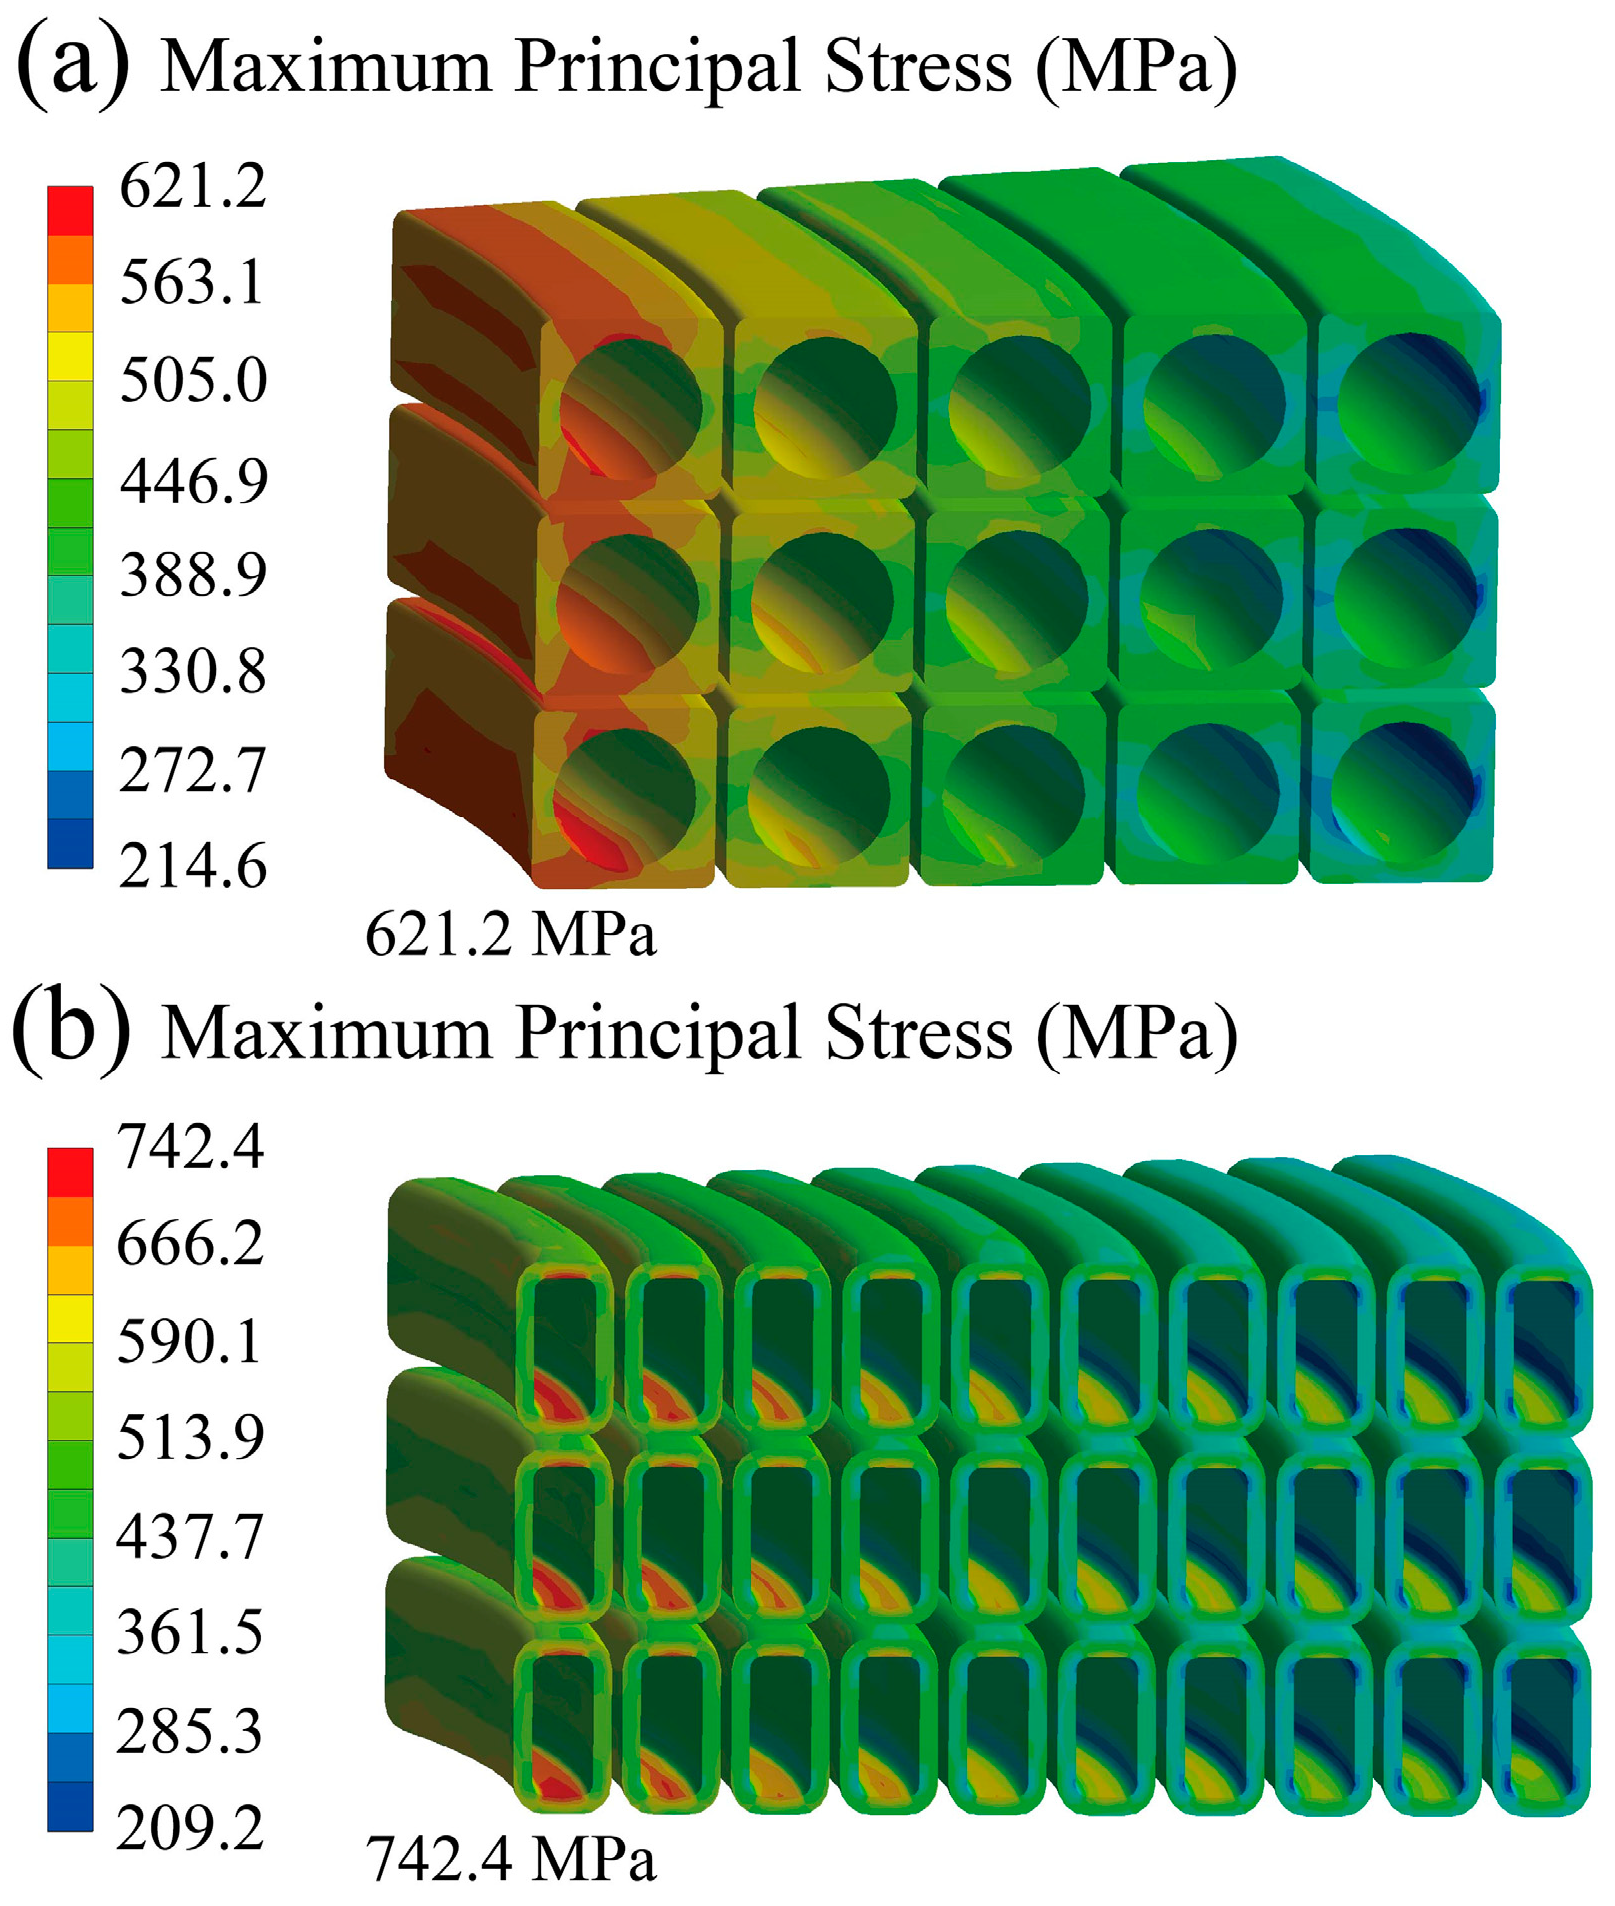
Due to pulsed plasma operation during plasma scenarios, the fatigue assessment for the CS conductor jacket involves two stress cycles from cool down to the initial magnetization state.
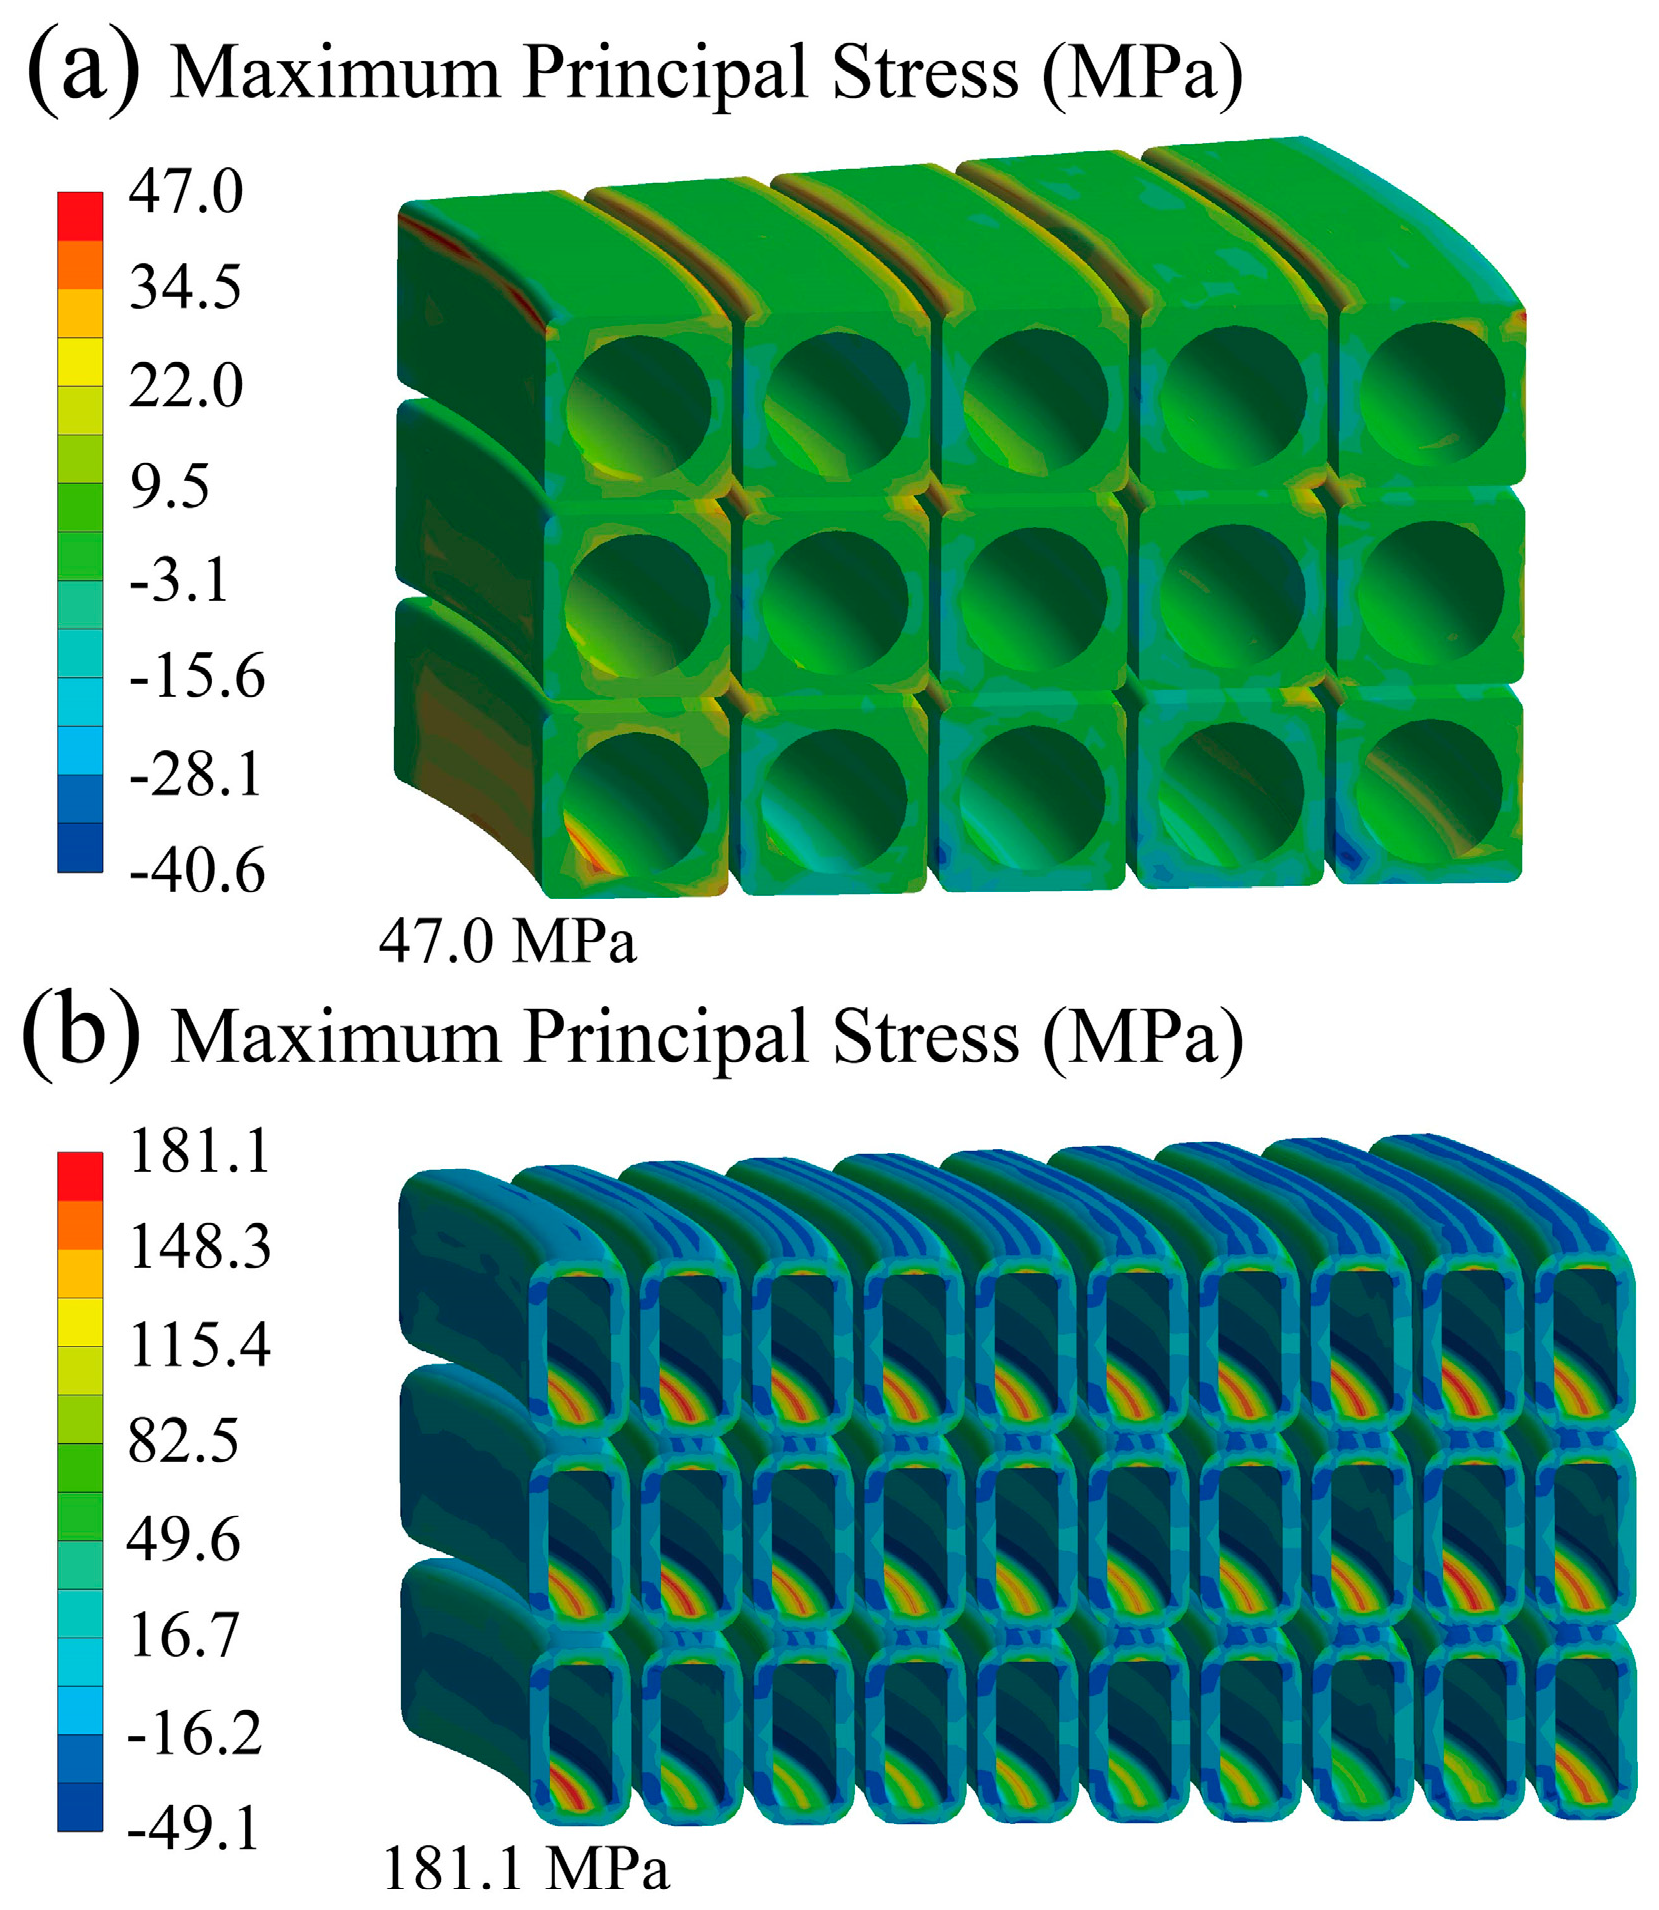
Figure 8 and
Figure 9 depict the maximum principal stress during the cool down and initial magnetization states for CS jackets, respectively. The maximum principal stress S
cool down in the cool down state of the REBCO and Nb
3Sn jackets is 47.0 MPa and 181.1 MPa, respectively. In the initial magnetization state, the maximum principal stress S
initial magnetization is 621.2 MPa for the REBCO jacket and 742.4 MPa for the Nb
3Sn jacket. The
R ratios (S
cool down/S
initial magnetization) are calculated and are used in the Paris equation mentioned later.
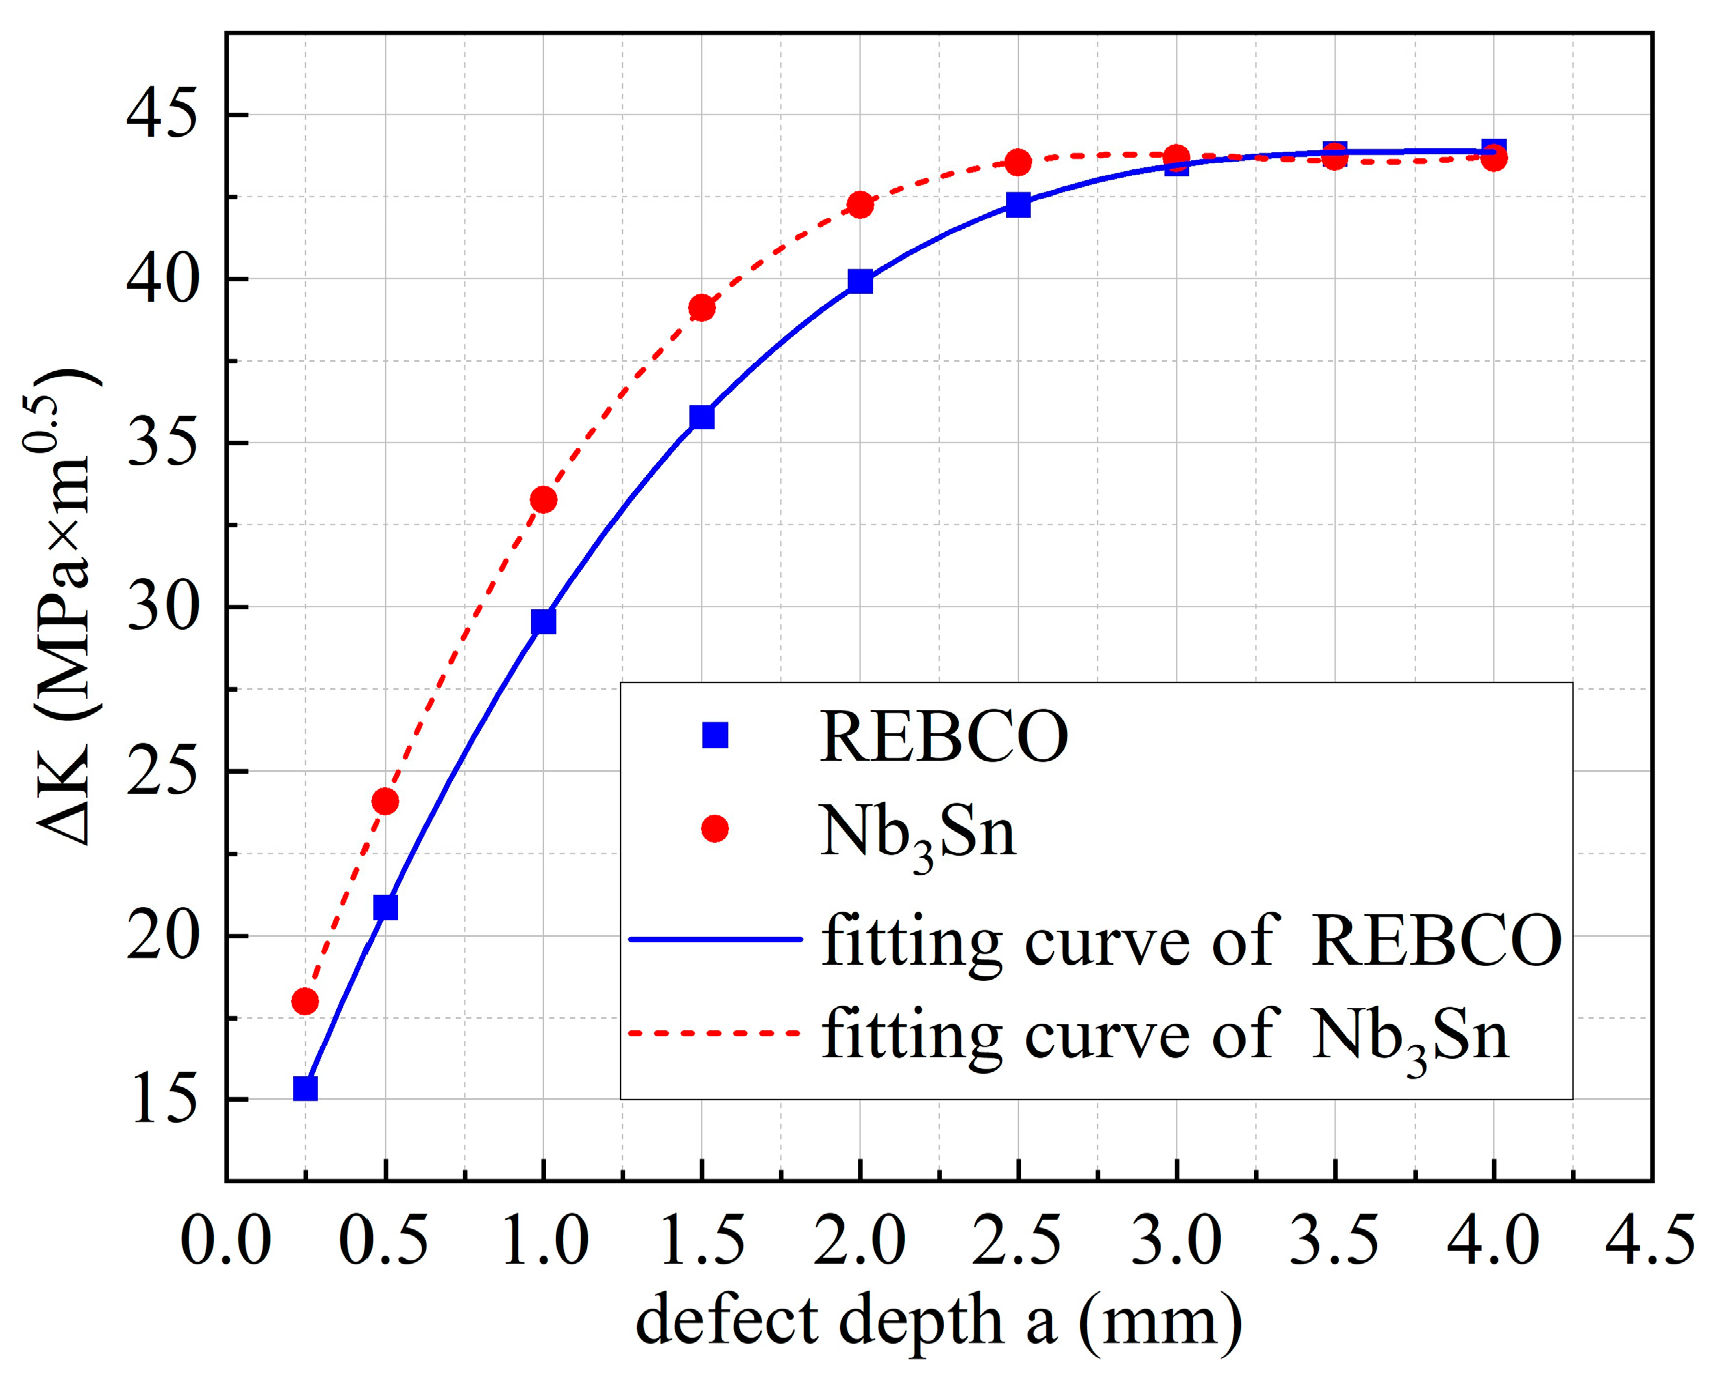
The initial elliptical defect at various dimensions starts from depth
a = 0.25 mm up to
a = 4 mm. The data points of (depth
a, ∆
K) obtained from these models are fitted into ∆
K = f(
a), which is then used in the Paris equation for LEFM.
Figure 10 shows
∆K as a function of defect size
a in the REBCO and Nb
3Sn jackets. The function ∆
K =
f(
a) is as follows:
It can be observed from
Figure 10 that the CS operational region of ∆
K is approximately between 15 and 43 MPa·m
0.5, which is located in the blue line fitting curve (Equation (2)) in
Figure 5. Therefore, only Equation (2) is considered in the model.
5. Result and Discussion
In the Paris equation, as
C and
m are treated as constants, they fail to capture the inherent uncertainty associated with fatigue crack propagation. To address this limitation, this article proposes a modification to the Paris equation by introducing a lognormal random variable to Equation (2), which is then incorporated into Equation (8). The probability distribution of FCGR with the random variable is calculated using the MLEM to accurately represent the uncertainty in fatigue crack propagation.
where
The uncertain FCGR equations of the REBCO jacket and the Nb
3Sn jacket are calculated using Equation (8).
Assuming that the lower quantile of the standard normal distribution with a probability
P is denoted as
, the FCGR equation for achieving a failure probability of
1 −
P (reliability
P) can be derived as follows:
When the probability
P is set to 99%,
2.33 can be obtained from the standard normal distribution. The FCGR uncertainty equation with a probability of
P = 99% can be derived using Equation (11):
The FCGR curve in
Figure 11, with a probability of 99% (failure probability of 1%), provides a more comprehensive characterization of the dispersion law observed in the experimental data and effectively captures the influence of probability on the uncertainty associated with the FCGR curve. The derived uncertainty equation for crack propagation aligns well with the experimental results.
Using Equations (2)–(5), Equations (12)–(13), and the R value derived from the actual cyclic load during CS magnet operation, the C(R) for the CHSN01 jackets is obtained, where the C(R) of the REBCO jacket is 1.1158 × 10⁻¹¹ and the C(R) of the Nb3Sn jacket is 1.6851 × 10⁻¹¹.
Substitute Equations (6) and (7) into Equations (12) and (13) and perform the following integration:
where
ai is the initial defect depth and
af is the critical defect depth, which is the jacket thickness here.
Nif is the number of cycles required for crack growth from
ai to
af.Figure 12 shows the relationship between the number of cycles and the maximum tolerable initial defect area. The results indicate that for a wall thickness of 4.3 mm, the maximum allowable initial defect areas to sustain 60,000 plasma pulses are 6.18 mm
2 and 4.07 mm
2 for the REBCO and Nb
3Sn jackets, respectively. Due to its larger ∆
K = f(
a) and
R value compared to the REBCO jacket, the Nb
3Sn jacket has a much smaller initial defect area.
Table 4 presents the maximum acceptable defects for different cycles. When the number of cycles required by the design decreases, the maximum tolerable initial defect area increases rapidly as expected. Nevertheless, our laboratory’s non-destructive testing capability (0.5 mm
2) can meet the requirements for detecting initial defects in Nb
3Sn jackets undergoing up to 60,000 loading cycles.
Note that the CS magnet jacket of ITER also undergoes 60,000 cycles. We have conducted FCGR analysis on the CS jacket of ITER using the method mentioned in this study, and the maximum tolerated defect area obtained for the CS jacket is 1.9 mm
2. The deviation between our analysis and the ITER result (2 mm
2) is 5%, which is acceptable, and our result is more conservative. Meanwhile, it can be seen that under the same cycle times, the maximum tolerated defect area of our device is larger than that of ITER, which is attributed to the excellent FCGR performance of the new material, CHSN01, as shown in
Table 5.
A comparison has been made between CHSN01 and other materials used in fusion projects. The mechanical test results of stainless steel materials used in fusion projects at 4.2 K are listed in
Table 5. Due to its higher yield strength compared to other stainless steel materials used in fusion projects, CHSN01 can withstand greater stress, thereby reducing the number of jackets required. This contributes to the economic feasibility of compact fusion devices. Additionally, the FCGR properties of this material are superior to those of existing materials.
Considering design margin, the stress ratio
R is assumed to exhibit an allowable variation of ±10% relative to the design value during service. The maximum tolerated crack areas under different
R values at 60,000 cycles are calculated, as shown in
Table 6. The quantitative analysis reveals an inverse relationship between the maximum allowable crack area and the stress ratio
R. Meanwhile, it can be seen that in the extreme case, the maximum tolerated crack area is still greater than our detection capability.


