Abstract
To address the issue of the low precision in detecting defects in aluminum alloy weld seam digital radiography (DR) images using the current target detection algorithms, a modified algorithm named YOLOv8-ELA based on YOLOv8 is proposed. The model integrates a novel HS-FPN feature fusion module, which optimizes the parameter efficiency and enhances the detection performance. For better identification of small defect features, the CA attention mechanism within HS-FPN is substituted with the ELA attention mechanism. Additionally, the first output layer is enhanced with a SimAM attention mechanism to improve the small target recognition. The experimental findings indicate that, at a 0.5 threshold, the YOLOv8-ELA model achieves mean average precision (mAP@0.5) values of 93.3%, 96.4%, and 96.5% for detecting pores, inclusions, and incomplete welds, respectively. These values surpass those of the original YOLOv8 model by 1.4, 2.3, and 0.1 percentage points. Overall, the model attains an average mAP of 95.4%, marking a 1.3% improvement over its predecessor, confirming its superior defect detection capabilities.
1. Introduction
Aluminum alloys are crucial in modern manufacturing due to their light weight, high strength, and corrosion resistance. However, welding defects like pores and slag inclusions frequently occur during processing, compromising the structural integrity even with advanced laser welding. Digital radiography (DR) enables defect visualization through X-ray absorption differences, but manual inspection poses radiation risks and requires specialized expertise. To address these limitations, researchers are developing deep learning-based automated detection systems to achieve rapid, high-precision defect identification in X-ray images [1]. Given the critical importance of aluminum alloy welds in industrial applications, achieving near-perfect defect detection accuracy is of paramount significance. Enhancing the precision of deep learning models for detecting defects in aluminum alloy welds has become a primary focus in terms of model optimization [2].
Early deep learning models in the field of object detection are exemplified by the region-based convolutional neural network (R-CNN) series. The R-CNN model, proposed by Ross Girshick et al. in 2014, marked the first integration of convolutional neural networks (CNNs) with region proposal algorithms (e.g., selective search). This approach enabled object localization and classification by generating candidate regions and extracting CNN features, significantly enhancing the detection accuracy of object detection models and establishing the foundation for the two-stage detection framework [3]. Subsequent improvements, such as Faster R-CNN, further advanced the detection accuracy [4,5].
These two-stage models frequently demonstrate reduced detection velocities, rendering them less amenable to industrial applications. In 2016, Redmon and his team introduced the single-stage detection model You Only Look Once (YOLOv1) [6], and in the same year, the Single Shot MultiBox Detector (SSD) algorithm was proposed [7]. Although these single-stage algorithms do not match the accuracy of two-stage models like the RCNN, their detection speed has met the requirements for real-time detection. Nowadays, scholars continue to enhance deep learning algorithms, with the widespread adoption of object detection models such as YOLOv5 [8,9,10,11,12,13,14,15], YOLOv6 [16], YOLOv7 [17], YOLOv8, and DETR [18,19]. Thanks to research on these models, deep learning algorithms have continually improved in terms of the speed, accuracy, and parameter efficiency. Liu Jiayi and colleagues enhanced the object detection accuracy by incorporating convolutional block attention mechanism (CBAM) modules [20] into the convolutional layers of the YOLOv5 backbone network. They further applied the K-means clustering algorithm to reduce the sensitivity to initial clustering centers, thereby improving the localization accuracy and reducing the network loss [21]. Raja Sunkara designed a deep separable convolutional module (SPD Conv) and integrated it into YOLOv5 and Residual Network (ResNet), constructing new CNN architectures that achieved significant improvements in accuracy [22]. In this experiment, ResNet, a landmark deep learning model introduced by He Kai-ming et al. in 2015, addresses the issue of the “accuracy decreasing rather than increasing when the number of network layers grows” caused by the gradient explosion and vanishing gradients in deep neural networks [23].
In order to further enhance the detection performance of current mainstream target detection algorithms and assist the target detection model in identifying defects in aluminum alloy welds via DR images in the future, this study focuses on optimizing the model parameters and improving the detection accuracy. Moreover, to tackle the issue of the low recall rates during the detection process, particularly for small defects such as pores and inclusions with pixel sizes below a certain threshold that are especially difficult to detect, an enhanced YOLOv8 network is proposed.
First, the feature fusion module is redesigned into a Hierarchical Scale-based Feature Pyramid Network (HS-FPN), which boosts the model’s ability to generalize while reducing the number of parameters and improving the accuracy. Next, the Coordinate Attention (CA) attention mechanism [24] is replaced with the Efficient Local Attention (ELA) mechanism [25], which improves the detection of small defects such as porosity, inclusions, and incomplete welds in DR images of aluminum alloy welds, thus meeting the requirements for real-time performance, including the model speed, accuracy, and efficiency. Furthermore, the Simple Attention Mechanism (SimAM) module is incorporated into the framework to enhance the detection performance for micro-defects, particularly in complex industrial inspection scenarios where subtle surface anomalies are easily obscured by background noise. The experimental results show that the proposed model achieves enhanced detection accuracy and speed, making it suitable for most industrial applications.
2. Methodology
2.1. YOLOv8-ELA Model Architecture
The proposed YOLOv8 model retains the Darknet53 structure [26] as the main trunk network for feature extraction, a design that has been used since YOLOv3. However, it replaces the residual modules in the original Darknet53 with the C2f module. The proposed C2f module synthesizes the architectural characteristics of YOLOv5’s C3 component through its hierarchical topology while incorporating the multi-branch connectivity paradigm from YOLOv7’s ELAN architecture [27]. This hybrid configuration enhances the gradient flow propagation through residual shortcut connections and optimizes the multi-scale feature fusion via parallel computation branches, achieving balanced computational efficiency and representational capacity compared to conventional aggregation approaches. This design ensures a lightweight architecture while providing richer gradient flow information. For hierarchical feature integration, YOLOv8 maintains the architectural paradigm of PANet-based cross-scale feature aggregation, which establishes a bidirectional information flow between the feature pyramids through top-down and bottom-up pathways. In the prediction head, YOLOv8 adopts a decoupled head with separate branches for classification and regression, abandoning the anchor-based strategy in favor of an anchor-free approach. The architectural framework of the YOLOv8 network is visually represented in Figure 1.
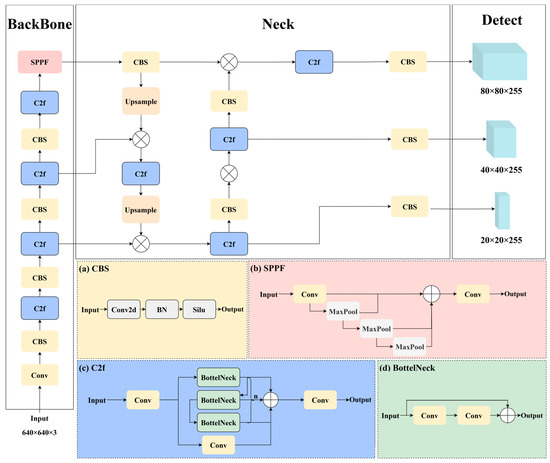
Figure 1.
YOLOv8 frame diagram.
The architectural framework of the enhanced YOLOv8 network, demonstrating its modified topology and connectivity patterns, is visually represented in Figure 2. The primary architectural innovation involves superseding the conventional Darknet53 backbone with an ELA-HS-FPN configuration, embedding the ELA attention mechanism [28,29] to optimize the feature representation within the hierarchical scale-aware pyramid framework. This structural refinement achieves simultaneous improvements in the model parameters by 34.1% (from 3.01 M to 1.98 M) through the implementation of depthwise separable convolutions and parameter-sharing mechanisms, while maintaining competitive performance metrics (1.3% mAP@0.5 increase). Furthermore, the integration of SimAM’s dynamic channel–spatial attention mechanism [30,31] introduces an adaptive receptive field adjustment, significantly enhancing the feature discriminability for sub-30-pixel objects in low-resolution scenarios through its energy-function-driven weight allocation strategy.
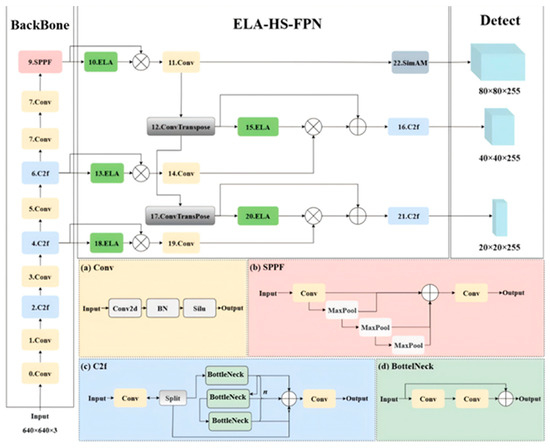
Figure 2.
YOLOv8-ELA frame diagram.
2.2. HS-FPN Feature Fusion Module
The Hierarchical Scale-based Feature Pyramid Network (HS-FPN) improves the multi-scale feature extraction through a hierarchical framework, thereby enhancing the detection of small defects. In this architecture (Figure 2), S3, S4, and S5 in the backbone section denote feature maps at three distinct scales. The CA attention mechanism refers to channel attention, while SFF represents the Selective Feature Fusion module (Figure 3). At the initial stage, multi-scale feature representations are processed through a gated attention-based selection mechanism, which dynamically filters and weights the informative channels based on their spatial–semantic significance. Subsequently, an adaptive cross-layer fusion module with learnable connection weights is employed to establish the context-aware feature interactions across different hierarchical levels, enabling the network to preserve both high-resolution spatial details and semantically rich contextual information.
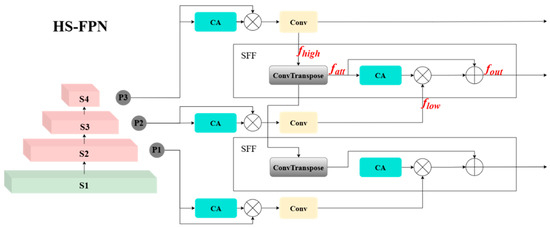
Figure 3.
HS-FPN feature fusion module.
The key distinction between HS-FPN and traditional FPN/PANet lies in the introduction of a channel attention mechanism and a multi-level fusion strategy in HS-FPN. Traditional FPN employs a top-down one-way path to fuse multi-layer features, while PANet further enhances this by adding a bottom-up path to supplement finer details. However, both approaches rely on simple addition or concatenation for feature fusion, which can easily result in semantic gaps and information losses. In contrast, HS-FPN leverages a channel attention module to dynamically weight low-level features using high-level features as guidance, and it then integrates them with high-level features to effectively enhance the feature representation, particularly for multi-scale targets. Additionally, HS-FPN incorporates a deformable self-attention mechanism in the encoder to extract global context features, addressing the issue of feature sparsity more effectively. Compared with FPN/PANet, HS-FPN demonstrates superior multi-scale modeling capabilities in complex scenarios, such as medical image analysis and small object detection.
Feature Selection Module: In this module (Figure 4), the CA mechanism first processes the input feature map , where C represents the number of channels, H is the height, and W signifies the width. The input features are processed by two pooling layers: max pooling and average pooling. The pooled features from each channel are aggregated and passed through a Sigmoid activation function to determine the weight for each channel, resulting in the channel-wise attention map .
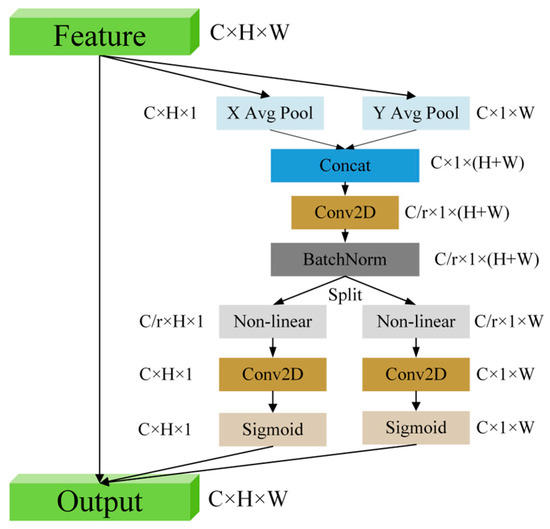
Figure 4.
CA mechanism structure diagram.
Feature Integration Module: The hierarchical feature representations extracted from the backbone network exhibit a characteristic trade-off between semantic richness and localization precision. While high-level features demonstrate enhanced semantic abstraction with compromised spatial resolution, their low-level counterparts maintain superior localization accuracy at the expense of semantic expressiveness. Traditional fusion methodologies typically employ direct element-wise summation of upsampled high-level features with their low-level counterparts, which inevitably leads to information redundancy and suboptimal feature interaction. To address these limitations, the proposed Selective Feature Fusion (SFF) mechanism implements a weighted attention-guided fusion paradigm, where high-level semantic descriptors serve as adaptive attention weights to selectively amplify the informative patterns in low-level features while suppressing redundant or noisy activations. This hierarchical attention mechanism enables context-aware feature enhancement without compromising the spatial fidelity of low-level representations.
In the SFF module, the high-resolution feature representation and the low-resolution feature representation are input. The high-resolution feature is first processed by a transposed convolution module (ConvTranspose) with a stride of 2 and a 3 × 3 convolution kernel to obtain an upsampled feature map . To align the dimensions of the high-resolution feature with the low-resolution feature, the high-resolution feature is first resized using bilinear interpolation to match the dimensions of the low-resolution feature, resulting in an aligned feature . Then, the high-resolution feature is converted into the corresponding attention weights using the CA mechanism to filter the low-resolution feature, ensuring consistent dimensions. Finally, the filtered low-resolution feature is fused with the aligned high-resolution feature to enhance the model’s representation ability and produce the final output feature .
2.3. ELA Mechanism
To optimize the feature integration, the CA module in HS-FPN is replaced with an ELA module. Figure 5 illustrates the attention mechanism structure of ELA. The ELA mechanism fundamentally differs from CA in its directional sensitivity to elongated defect patterns. In DR images of aluminum welding seams, certain defects, such as unpenetrated defects, exhibit an aspect ratio greater than 5, appearing as dark quasi-linear discontinuities. ELA employs axial strip pooling with 1 × 7 (horizontal) and 7 × 1 (vertical) kernels, creating directional receptive fields that match the typical defect dimensions. This contrasts with CA’s isotropic 3 × 3 spatial compression, which leads to signal dilution in high-aspect-ratio regions.
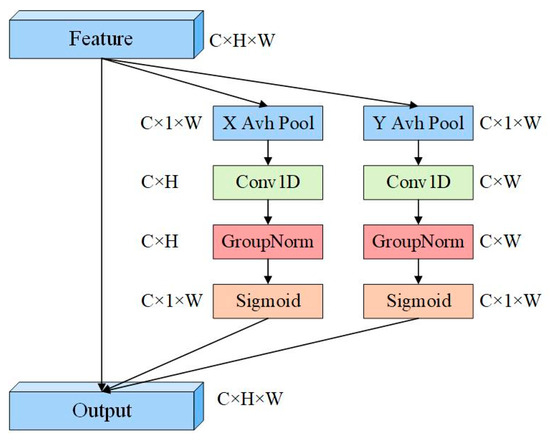
Figure 5.
ELA attention mechanism structure diagram.
The ELA attention mechanism primarily consists of two steps. In the first step, strip pooling operations are performed on the output of the convolutional module, which is represented by , where H, W, and C represent the height, width, and channel dimensions, respectively. Before the strip pooling operation, average pooling is performed separately along the horizontal direction and the vertical direction for each channel in the two spatial dimensions. Then, each output with height h and width w is represented as follows:
Formulas (1) and (2) yield the and features, which not only capture the global perceptual field but also capture precise position information. To effectively utilize these features, a one-dimensional convolutional method is employed to enhance the position information in both the horizontal and vertical directions. Subsequently, the GroupNorm module processes the enhanced position information, thereby representing the position attention in both directions, as illustrated by Formulas (4) and (5).
2.4. SimAM Attention Mechanism
The SimAM attention mechanism introduces a parameter-free 3D attention framework that synergistically integrates the spatial–channel interdependencies. This biologically inspired mechanism enables dynamic feature recalibration by quantifying the neuronal importance through energy minimization principles, effectively amplifying the discriminative features without introducing additional learnable parameters. Given an input feature map , the module evaluates the significance of each target neuron through an energy function defined as:
where denotes a regularization term to prevent numerical instability, and and represent the mean and variance of the neurons within the corresponding channel, respectively. The energy metric inversely correlates with the neuronal significance: lower energy values indicate stronger statistical divergence between the target neuron and its spatial neighbors , implying higher saliency. Consequently, the attention weight for neuron is derived as , establishing an adaptive feature enhancement mechanism that prioritizes distinctive patterns while suppressing redundant activations.
Figure 6 illustrates the attention mechanism structure of SimAM. SimAM employs a neural energy minimization principle to provide physics-aware feature selection without learnable parameters. For defects such as stomatal and slag inclusion with pixel values smaller than 30 px, it quantifies the significance of each neuron through the energy metric , where low-energy neurons correspond to statistically divergent defect features relative to the background. This dynamic feature recalibration suppresses the redundant activations while amplifying the discriminative defect patterns, thereby enhancing the small target detection and improving the performance on small target defects.
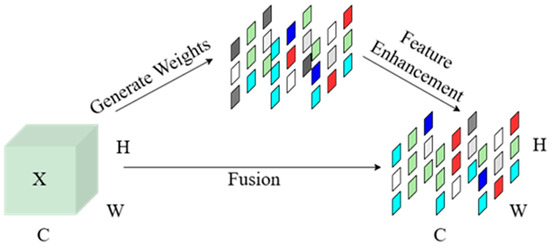
Figure 6.
Schematic diagram of the SimAM attention mechanism.
3. Experiments and Results
3.1. Experimental Platform
The experimental platform is equipped with an INTEL(R) XEON(R) SILVER 4510 CPU and an NVIDIA GeForce RTX 3090 24 GB GPU. The platform, with 128 GB of memory, can handle most deep learning tasks and is suitable for medium-complexity deep learning models. The experimental dataset consists of 3098 images, and the memory size meets the basic training requirements. The operating system is CentOS7(version CenOS7-7.9-2009), the Python version is 3.8.1, the deep learning framework is PyTorch 1.8.1, and the CUDA version is 12.1.
To ensure the validity of the comparative experiment, the same parameters are used during the training stage. Specifically, the input image size is set consistently, and the optimizer chosen is SGD. Although the Adam optimizer may offer faster convergence, it might not yield as optimal results as SGD. Therefore, to ensure the best performance, SGD is selected as the optimizer. The default learning rate is set to 0.01, the momentum to 0.937, and the weight decay coefficient to 0.0005. The number of iterations is set to 300, and the batch size is 16.
3.2. Dataset Collection and Processing
The dataset consists of DR defect images of aluminum alloy welds acquired by the Shanghai Nuclear Power Group through non-destructive testing between 2018 and 2022. A total of 823 defect images are included, among which 415 images contain air holes, 295 images exhibit incomplete welding, and 113 images show slag inclusion. Figure 7 illustrates the DR images of the different defects, revealing distinct imaging characteristics. Table 1 summarizes the imaging characteristics and potential causes of defects.
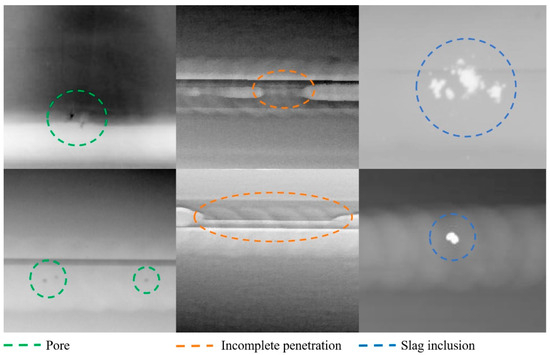
Figure 7.
A defects dataset of weld radiographs.

Table 1.
DR characteristics of pores, slag inclusions, and incomplete penetrations.
The dataset was labeled by Labelimg (version 1.8.1) software, and the text of the training data required in the training process can be generated by drawing rectangular boxes for the defects in the image. Each picture will generate a text file. Figure 8 shows the data-labeling interface and the corresponding target box information after labeling, and each rectangular box marked with defects will generate a column of data. From left to right are the category of the defect, the x-coordinate of the center point of the target box, the y-coordinate of the center point of the target box, the width of the target box w, and the height of the target box h.
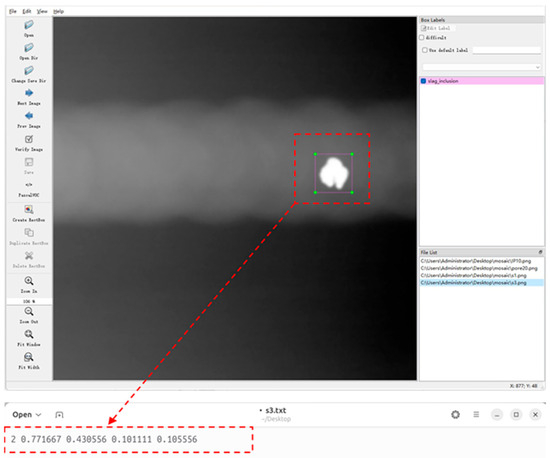
Figure 8.
Data-labeling procedure.
Due to the limited dataset of 823 defect images causing suboptimal model performance, data augmentation techniques were applied to expand it. The dataset was expanded to 5724 images through horizontal rotation, vertical flipping, random brightness adjustments, and the addition of speckle noise and Gaussian noise. These methods enriched the dataset and strengthened the model robustness.
Speckle noise is generated by randomly modifying the RGB values of the pixels to produce a noisy effect similar to salt-and-pepper noise. Gaussian noise is created by generating random values from a normal distribution and adding them to the input data. For a three-channel RGB image, represented as a three-dimensional matrix, a normally distributed three-dimensional matrix is generated and added to the input data to produce a new image with added Gaussian noise. Figure 9 shows an example of a tungsten slag defect image after data augmentation.
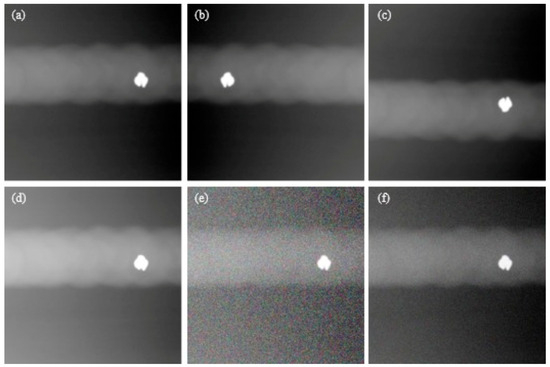
Figure 9.
Schematic diagram of data augmentation. (a) Original drawings of defects; (b) Horizontal rotation; (c) Vertical flipping; (d) randomly adjust the image brightness; (e) salt and pepper noise; (f) Gaussian noise.
Our dataset was split into training, validation, and test sets in a 9:1:1 ratio. The distribution of the object classes across the sets is shown in Figure 10. It is important to note that the data used for the subsequent comparison experiments were obtained from the test set.
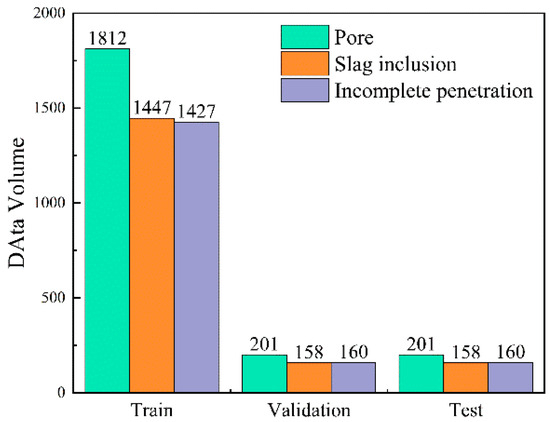
Figure 10.
Partitioning of the dataset.
Additionally, in the course of training, the Mosaic data augmentation method was employed to further enhance the diversity of the dataset. This approach involves randomly arranging four images and merging them into one by cropping, effectively increasing the richness of individual images and improving the training efficiency.
3.3. Comparative Experiments
The model’s performance is assessed using the mAP@0.5 metric in the experimental results. The mAP@0.5 (mean average precision at an IoU threshold of 0.5) represents the average precision (AP) calculated at an intersection over union (IoU) threshold of 0.5. Both the AP and mAP are metrics used to evaluate the average precision of the object detection model.
In the context of object detection, Formula 8 establishes the evaluation metrics as follows: true positives (TPs) represent accurately localized defect instances, true negatives (TNs) denote correctly identified background regions, false positives (FPs) indicate erroneous detections in non-defective areas, and false negatives (FNs) correspond to undetected defect instances. The inherent challenge of precise localization in object detection tasks frequently results in zero TP values, particularly when the intersection over union thresholds are strictly enforced.
In terms of the processing speed, the FPS (frames per second) metric is adopted to evaluate the real-time performance. A higher FPS value indicates faster processing capability, representing the number of images that can be processed per second. The FPS calculation is derived from the total processing latency per image, as expressed in Formula (9):
Specifically, represents the time for image pre-processing, represents the inference time, and NMS represents the post-processing time. Additionally, the model’s parameter count is denoted by Parameters, and the model’s computational resource consumption is measured by the FLOPs.
As shown in Table 2, the YOLOv8 algorithm outperforms the RT-DETR, YOLOv5s, and YOLOv7-Tiny models in terms of all the parameters, achieving the highest precision. The improved YOLOv8-ELA model increases the average precision for pores, slag inclusions, and incomplete penetration by 1.4%, 2.3%, and 0.1%, respectively, compared to the original YOLOv8 model, while maintaining a minimal impact on the detection speed (FPS), parameter count (#Params), and floating-point operations (FLOPs). It also achieves a 1.3% improvement in the overall mAP. Compared with manual detection that relies on operator experience, acquiring a single DR image takes an average of 5–8 s (including moving, focusing, and recording time), and operator fatigue can lead to an increased missed detection rate. The FPS of YOLOv8-ELA measured in the experiment is 93.5, which is significantly higher than that of traditional manual detection.
Table 2.
Comparison of the results of the different models.
Table 2 shows the comparison of the precision and recall of the model, in which the calculation formulas for the precision and recall are shown in Equations (10) and (11), where the higher the precision, the lower the probability of error detection, and the higher the recall, the lower the probability of omission detection. Table 3 shows the F1 index, which is essentially the harmonic mean of the precision and recall, which is used to measure the balance ability of the model between reducing missed detection (recall) and suppressing false detection (precision), and its formula is shown in Equation (12).
Table 3.
Comparison of the precision and recall across the different models.
By integrating the data from Table 3 and Table 4, it is evident that YOLOv8ELA demonstrates superior performance compared to other models in terms of the recall rate and F1 score. Specifically, for accuracy, the model performs exceptionally well on slag inclusion and incomplete penetration defects, surpassing the other models. However, its accuracy for detecting pores is lower than that of YOLOv8, indicating that the improved model exhibits reduced accuracy for this specific defect type. This discrepancy arises due to an increased number of false detections during stomata detection, likely caused by misclassification of certain background textures as positive samples. Such misclassification may stem from the weight allocation shifts induced by the attention mechanism during the feature extraction of tiny stomata. This phenomenon provides a clear direction for subsequent optimization efforts. Overall, the comprehensive performance of the improved model remains superior to that of current mainstream object detection models.
Table 4.
F1 scores of the different models.
Figure 11 presents a comparative analysis of the detection performance between the baseline model and the enhanced model. In the figure, the green regions indicate pore defects; the orange regions represent tungsten slag inclusion defects; and the pink regions correspond to incomplete penetration defects. The results clearly indicate that the improved model is capable of detecting slag inclusion defects and stomatal defects that were overlooked by the original model. By comparing the heat maps (The darker the color, the higher the level of interest the model has in that particular region.) in Figure 12, it is clear that the improved model exhibits a greater focus on small defects. However, certain misdetection phenomena remain, such as the misclassification of air holes as unpenetrated defects. Despite this, the overall detection performance of the improved model surpasses that of the original model.
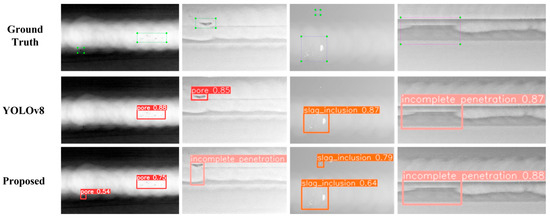
Figure 11.
Comparison of the model detection effects.
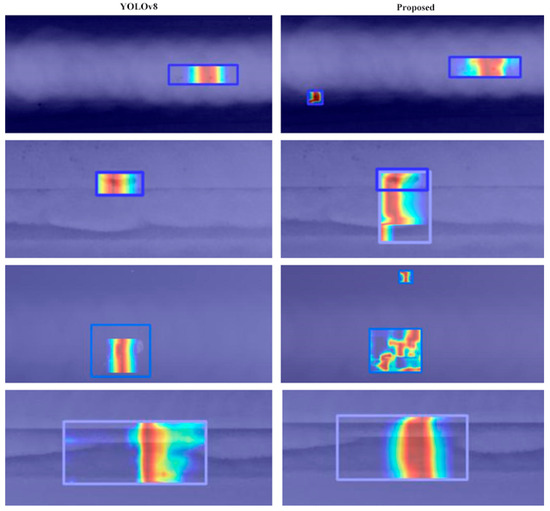
Figure 12.
Comparison of the heat map effects. The green regions indicate pore defects; the orange regions represent tungsten slag inclusion defects; and the pink regions correspond to incomplete penetration defects.
3.4. Ablation Experiments
To verify the effectiveness of the improved components in enhancing the model’s detection performance, ablation experiments were conducted to compare the detection outcomes of the improved modules. The accuracy and speed of the model detection were evaluated using the overall mAP@0.5 value obtained on the test set. Additionally, the impact of the improved modules on the model complexity was assessed by measuring the number of parameters and floating-point operations (FLOPs). Figure 13 illustrates the training curves for mAP@0.5 over 200 epochs on the training set, showing that the improved model consistently outperforms the original model in this metric.
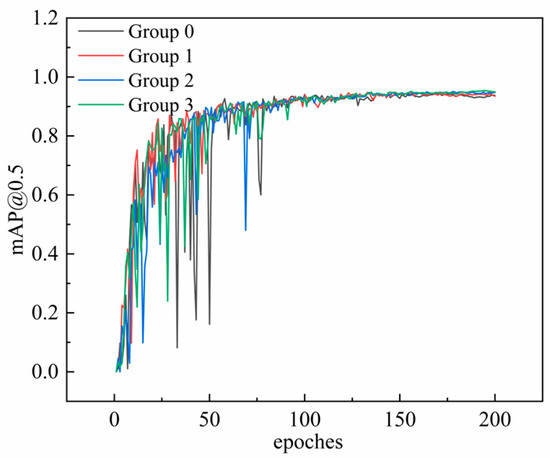
Figure 13.
mAP@0.5 change curve.
In Table 5, the results of the ablation experiments are presented. Group 0 shows the performance of the original YOLOv8 network without any enhancements. Group 1 incorporates the HS-FPN structure, resulting in a significant reduction in both the floating-point operations and the model parameters, while concurrently enhancing the accuracy. Building on Group 1, Group 2 implements the ELA attention mechanism in place of the CA attention mechanism, resulting in a 1% accuracy gain compared to the original model. Group 3 further incorporates the SimAM attention module, resulting in a 1.3% increase in the mAP@0.5, alongside a reduction in the parameter count and an improved detection speed.
Table 5.
Comparison of the ablation experiments.
4. Conclusions
Through comparative experiments, the improved YOLOv8-ELA model significantly enhanced the precision of detecting aluminum alloy weld seam DR defects, with its overall performance being markedly superior to that of the other models. Specifically, compared to the original YOLOv8 models, the proposed YOLOv8-ELA architecture establishes a new state-of-the-art approach in terms of weld defect detection, outperforming existing methods by 1.3% mAP@0.5 on the benchmark dataset. The detection accuracy for pores, slag inclusions, and incomplete penetration was notably improved.
The core reason for the YOLOv8-ELA model achieving improved accuracy while reducing the parameters by 34.1% lies in its efficient co-design of structural optimization and attention mechanisms: depthwise separable convolutions were introduced via the HS-FPN module to reconstruct the feature pyramid network. The standard convolution is decomposed into two steps—channel-wise spatial filtering and cross-channel fusion—significantly reducing the computational complexity. Specifically, the parameters of 3 × 3 convolutions are reduced by 89% (e.g., a 256-channel convolution is reduced from 589,824 to 65,792), and redundant calculations in multi-scale branches are avoided through a cross-layer parameter sharing strategy. Meanwhile, the ELA attention mechanism replaces traditional CA’s global compression with 1 × 7 and 7 × 1 axial strip pooling, accurately capturing the anisotropic characteristics of elongated defects in aluminum welding seam DR images with only a 3.5K parameter increase. The SimAM module dynamically enhances the small target feature responses using a parameter-free energy function. These three components work synergistically to achieve a balance between reducing the model parameters and improving the detection accuracy. Although there is a slight increase in the detection speed, it remains within an acceptable range. Compared with most commercial detection models, the YOLOv8-ELA model demonstrates superior overall detection performance and is better suited for industrial applications.
Although the overall performance of the model has been enhanced through structural optimization and the integration of attention mechanisms, detecting small targets such as tiny pores and small slag inclusions remains a significant challenge. For example, the recall and precision for identifying pores are still relatively low. Nonetheless, this limitation provides a clear direction for future optimization efforts. Future work will focus on introducing dynamic receptive field modules or implementing targeted data augmentation strategies to address these challenges.
Author Contributions
Conceptualization, validation, writing—original draft preparation, Y.C., L.W. and Y.H.; writing—review and editing, Y.C. All authors have read and agreed to the published version of the manuscript.
Funding
This research was funded by the National Natural Science Foundation of China (no.51809161).
Institutional Review Board Statement
Not applicable.
Informed Consent Statement
Not applicable.
Data Availability Statement
The original contributions presented in this study are included in the article. Further inquiries can be directed to the corresponding author.
Conflicts of Interest
The authors declare that they have no conflicts of competing financial interests in this paper.
References
- Lin, J.; Yao, Y.; Ma, L.; Wang, Y. Detection of a casting defect tracked by deep convolution neural network. Int. J. Adv. Manuf. Technol. 2018, 97, 573–581. [Google Scholar] [CrossRef]
- Yang, L.; Wang, H.; Huo, B.; Li, F.; Liu, Y. An automatic welding defect location algorithm based on deep learning. NDT E Int. 2021, 120, 102435. [Google Scholar] [CrossRef]
- Girshick, R.; Donahue, J.; Darrell, T.; Malik, J. Rich feature hierarchies for accurate object detection and semantic segmentation. In Proceedings of the IEEE Conference on Computer Vision and Pattern Recognition, Columbus, OH, USA, 23–28 June 2014; pp. 580–587. [Google Scholar]
- Ren, S.; He, K.; Girshick, R.; Sun, J. Faster R-CNN: Towards real-time object detection with region proposal networks. IEEE T Pattern Anal. 2016, 39, 1137–1149. [Google Scholar] [CrossRef]
- He, K.; Gkioxari, G.; Dollár, P.; Girshick, R. Mask r-cnn. In Proceedings of the IEEE International Conference on Computer Vision, Venice, Italy, 22–29 October 2017; pp. 2961–2969. [Google Scholar]
- Redmon, J.; Divvala, S.; Girshick, R.; Farhadi, A. You only look once: Unified, real-time object detection. In Proceedings of the IEEE Conference on Computer Vision and Pattern Recognition, Las Vegas, NV, USA, 27–30 June 2016; pp. 779–788. [Google Scholar]
- Li, Y.D.; Han, D.; Li, H.G.; Zhang, X.; Zhang, B.; Xiao, Z.F. Multi-block SSD based on small object detection for UAV railway scene surveillance. Chin. J Aeronaut. 2020, 33, 1747–1755. [Google Scholar] [CrossRef]
- Prabhu, B.B.; Lakshmi, R.; Ankitha, R.; Prateeksha, M.S.; Priya, N.C. RescueNet: YOLO-based object detection model for detection and counting of flood survivors. Model. Earth Syst. Environ. 2022, 8, 4509–4516. [Google Scholar] [CrossRef]
- Tang, Z.; Zhou, L.; Qi, F.; Chen, H. An improved lightweight and real-time YOLOv5 network for detection of surface defects on indocalamus leaves. J. Real-Time Image Process. 2023, 20, 14. [Google Scholar] [CrossRef]
- Lee, J.; Hwang, K.I. YOLO with adaptive frame control for real-time object detection applications. Multimed. Tools Appl. 2022, 81, 36375–36396. [Google Scholar] [CrossRef]
- Xu, L.; Dong, S.; Wei, H.; Ren, Q.; Huang, J.; Liu, J. Defect signal intelligent recognition of weld radiographs based on YOLO V5-IMPROVEMENT. J. Manuf. Process. 2023, 99, 373–381. [Google Scholar] [CrossRef]
- Liu, B.; Wang, H.; Cao, Z.; Wang, Y.; Tao, L.; Yang, J.; Zhang, K. PRC-Light YOLO: An efficient lightweight model for fabric defect detection. Appl. Sci. 2024, 14, 938. [Google Scholar] [CrossRef]
- Qi, J.; Liu, X.; Liu, K.; Xu, F.; Guo, H.; Tian, X.; Li, M.; Bao, Z.; Li, Y. An improved YOLOv5 model based on visual attention mechanism: Application to recognition of tomato virus disease. Comput. Electron. Agric. 2022, 194, 106780. [Google Scholar] [CrossRef]
- Li, X.; Te, R.; Yi, F.; Xu, G. TCS-YOLO model for global oil storage tank inspection. Opt. Precis. Eng. 2023, 31, 246–262. [Google Scholar] [CrossRef]
- Liang, Y.; Feng, S.; Zhang, Y.; Xue, F.; Shen, F.; Guo, J. A stable diffusion enhanced YOLOV5 model for metal stamped part defect detection based on improved network structure. J. Manuf. Process. 2024, 111, 21–31. [Google Scholar] [CrossRef]
- Li, C.; Li, L.; Jiang, H.; Weng, K.; Geng, Y.; Li, L.; Ke, Z.; Li, Q.; Cheng, M.; Nie, W.; et al. YOLOv6: A single-stage object detection framework for industrial applications. arXiv 2022, arXiv:2209.02976. [Google Scholar]
- Wang, C.Y.; Bochkovskiy, A.; Liao, H.Y.M. YOLOv7: Trainable bag-of-freebies sets new state-of-the-art for real-time object detectors. In Proceedings of the IEEE/CVF Conference on Computer Vision and Pattern Recognition, Vancouver, BC, Canada, 17–24 June 2023; pp. 7464–7475. [Google Scholar]
- Chen, Y.; Zhang, C.; Chen, B.; Huang, Y.; Sun, Y.; Wang, C.; Fu, X.; Dai, Y.; Qin, F.; Peng, Y.; et al. Accurate leukocyte detection based on deformable-DETR and multi-level feature fusion for aiding diagnosis of blood diseases. Comput. Biol. Med. 2024, 170, 107917. [Google Scholar] [CrossRef]
- Dai, X.; Chen, Y.; Yang, J.; Zhang, P.; Yuan, L.; Zhang, L. Dynamic detr: End-to-end object detection with dynamic attention. In Proceedings of the IEEE/CVF International Conference on Computer Vision, Montreal, QC, Canada, 10–17 October 2021; pp. 2988–2997. [Google Scholar]
- Woo, S.; Park, J.; Lee, J.Y.; Kweon, I.S. CBAM: Convolutional block attention module. In Proceedings of the European Conference on Computer Vision (ECCV), Munich, Germany, 8–14 September 2018; pp. 3–19. [Google Scholar]
- Liu, J.; Zhu, X.; Zhou, X.; Qian, S.; Yu, J. Defect detection for metal base of TO-Can packaged laser diode based on improved YOLO algorithm. Electronics 2022, 11, 1561. [Google Scholar] [CrossRef]
- Sunkara, R.; Luo, T. No more strided convolutions or pooling: A new CNN building block for low-resolution images and small objects. In Proceedings of the Joint European Conference on Machine Learning and Knowledge Discovery in Databases, Grenoble, France, 19–23 September 2022; pp. 443–459. [Google Scholar]
- He, K.; Zhang, X.; Ren, S.; Sun, J. Deep Residual Learning for Image Recognition. In Proceedings of the IEEE/CVF Conference on Computer Vision and Pattern Recognition, Las Vegas, NV, USA, 27–30 June 2016; pp. 770–778. [Google Scholar]
- Hou, Q.; Zhou, D.; Feng, J. Coordinate attention for efficient mobile network design. In Proceedings of the IEEE/CVF Conference on Computer Vision and Pattern Recognition, Nashville, TN, USA, 19–25 June 2021; pp. 13713–13722. [Google Scholar]
- Xu, W.; Wan, Y. ELA: Efficient local attention for deep convolutional neural networks. arXiv 2024, arXiv:2403.01123. [Google Scholar]
- Redmon, J.; Farhadi, A. Yolov3: An incremental improvement. arXiv 2018, arXiv:1804.02767. [Google Scholar]
- Wang, C.Y.; Bochkovskiy, A.; Liao, H.Y.M. Scaled-yolov4: Scaling cross stage partial network. In Proceedings of the IEEE/CVF Conference on Computer Vision and Pattern Recognition, Nashville, TN, USA, 19–25 June 2021; pp. 13029–13038. [Google Scholar]
- Madhvacharyula, A.S.; Pavan, A.V.S.; Gorthi, S.; Chitral, S.; Venkaiah, N.; Kiran, D.V. In situ detection of welding defects: A review. Weld. World 2022, 66, 611–628. [Google Scholar] [CrossRef]
- Xu, H.; Yan, Z.H.; Ji, B.W.; Huang, P.F.; Cheng, J.P.; Wu, X.D. Defect detection in welding radiographic images based on semantic segmentation methods. Meaurement 2022, 188, 110569. [Google Scholar] [CrossRef]
- Sazonova, S.A.; Nikolenko, S.D.; Osipov, A.A.; Zyazina, T.V.; Venevitin, A.A. Weld defects and automation of methods for their detection. J. Phys. Conf. Ser. 2021, 1889, 022078. [Google Scholar] [CrossRef]
- Leo, M.; Del Coco, M.; Carcagnì, P.; Spagnolo, P.; Mazzeo, P.L.; Distante, C.; Zecca, R. Automatic visual monitoring of welding procedure in stainless steel kegs. Opt. Lasers Eng. 2018, 104, 220–231. [Google Scholar] [CrossRef]
Disclaimer/Publisher’s Note: The statements, opinions and data contained in all publications are solely those of the individual author(s) and contributor(s) and not of MDPI and/or the editor(s). MDPI and/or the editor(s) disclaim responsibility for any injury to people or property resulting from any ideas, methods, instructions or products referred to in the content. |
© 2025 by the authors. Licensee MDPI, Basel, Switzerland. This article is an open access article distributed under the terms and conditions of the Creative Commons Attribution (CC BY) license (https://creativecommons.org/licenses/by/4.0/).