Article

Spatial Distribution, Source Identification, and Risk Assessment of Heavy Metals in Sediments of the Yellow River Basin, China

1
State Key Laboratory of Water Engineering Ecology and Environment in Arid Area, Xi’an University of Technology, Xi’an 710048, China
2
College of Agricultural Medicine, Hebei Open University, Shijiazhuang 050080, China
3
Geology and Environment, Xi’an University of Science and Technology, Xi’an 710048, China
*
Authors to whom correspondence should be addressed.
Appl. Sci. 2025, 15(9), 5188; https://doi.org/10.3390/app15095188
Submission received: 24 March 2025 / Revised: 1 May 2025 / Accepted: 5 May 2025 / Published: 7 May 2025
(This article belongs to the Section Environmental Sciences)

Abstract

:
Heavy metals (HMs), characterized by their non-biodegradable nature, are prone to enrichment in river sediments, thereby severely jeopardizing the equilibrium of ecosystems and human health. Given the critical importance of safeguarding valuable water resources, it is of utmost urgency to initiate research on HMs within the Yellow River Basin (YRB). This study collected river sediment samples from the Yellow River Basin and analyzed the distribution characteristics, health risks, and pollution sources of HMs utilizing the pollution index method, health risk assessment, and positive matrix factorization (PMF) model. The results demonstrate that arsenic (As), zinc (Zn), and cadmium (Cd) are the primary elements contributing to heavy metal (HM) pollution in the sediments of the YRB. The proportions of sediment samples with low HM pollution in the upstream, midstream, and downstream are 36.48%, 71.43%, and 72.73%, respectively, whereas the proportions of samples with moderate pollution are 63.16%, 28.57%, and 27.27%, respectively. The health risk assessment reveals that the non-carcinogenic risks posed by HM pollution in the sediments to adults are negligible, whereas those to children are not. Regarding carcinogenic risks, the carcinogenic risk index of As is significantly higher than that of the other HMs. The primary sources of HM pollution in the sediments are identified as traffic–industrial sources, agricultural–industrial sources, and industrial sources, with respective contribution rates of 32.47%, 44.87%, and 22.66%. As and Zn are prioritized as elements for health risk control, while agricultural–industrial sources are highlighted as the priority sources for pollution control.

1. Introduction

Heavy metals (HMs) are recognized as ubiquitous elements in nature, present as trace constituents across various environmental media [1]. The predominant origins of HMs in river sediments have been identified as both natural accumulation processes (soil erosion, atmospheric deposition, rock weathering, etc.) and anthropogenic activities (agricultural practices, industrial operations, domestic discharges, etc.) [2,3]. When concentrations exceed specific thresholds, HMs are known to undergo bioaccumulation within trophic networks, with subsequent transformation into more toxic organic species, ultimately posing persistent threats to aquatic ecosystems and human health [4,5]. Upon entering the riverine environment, HMs are dispersed into runoff and sediments during the migration process. Within aquatic systems, sediments are recognized as the primary reservoirs for HMs, demonstrating dual functionality in their geochemical cycling by acting as both sinks and latent sources of metallic contaminants [6,7]. These metallic species, characterized by their adsorption capacity, hydrolytic behavior, and precipitation potential, have been progressively concentrated through biogeochemical processes [8,9,10]. Furthermore, HMs in sediments are highly responsive to human activities; thus, their species and concentrations can reflect the characteristics of regional pollution and its potential sources [11,12]. Therefore, the investigation of heavy metal (HM) pollution, health risks, and potential sources in river sediments is of significant importance for ensuring water security at the basin, national, and global levels.
Currently, various methods have been employed to evaluate the pollution levels and risks associated with HMs in the environment, including the geoaccumulation index, contamination load index, and potential ecological risk index [13]; owing to their scope of application and assessment purposes, the application of any single method has notable drawbacks [14]. Even so, the majority of researchers have confirmed that an integrated analysis using multiple methods is more accurate and effective [15,16]. Regarding the methods for HM source analysis, they primarily consist of multivariate statistical methods, geostatistical analysis, and isotopic tracing methods [17,18]. Among these approaches, the positive matrix factorization (PMF) model endorsed by the United States Environmental Protection Agency (US EPA) has proven to be an effective and straightforward method for source analysis, as it reduces high-dimensional variables into a limited number of comprehensive factors. There has been widespread application of this model in environmental studies [19,20]. Simultaneously, the four-step method for assessing environmental health risks suggested by the US EPA coupled with the Monte Carlo probabilistic risk evaluation method can quantify and mitigate the uncertainties associated with traditional assessment methods, thereby enhancing the accuracy and scientific rigor of HM contaminant risk assessment [21]. Systematic sediment surveys have become key to shaping transboundary water governance, and global sediment quality assessments are increasingly informing environmental policy-making [22]. The Rhine 2020 program demonstrated how lead (Pb) isotope fingerprinting in sediments enabled precise tracing of mining emissions, resulting in a 23% reduction in permitted emissions under the revised EU Water Framework Directive [23]. In the Mississippi River basin, the spatial correlation between sediment mercury (Hg) concentrations (0.08–1.45 mg/kg) and agricultural land use prompted a revision of the Hypoxia Action Plan, requiring 30 m riparian buffers in high-risk areas [24]. India’s “Namami Gange” program used arsenic (As)/chromium (Cr) distribution patterns to establish a “red zone” industrial licensing system, which led to an 18.7 ± 3.2% reduction in metal loads after implementation [25]. Through pollution risk assessment and source apportionment studies, accurate and effective environmental management strategies can be formulated, and the potential sources of HMs can be elucidated.
Serving as China’s second-longest river, the Yellow River (YR) is a vital water source in northern China, supporting around 12% of the national population and irrigating approximately 15% of the agricultural land [26,27]. Since the 1880s, it has been a primary water supply for industries and agriculture along its banks [12]. However, due to the dense anthropogenic activities along the riverbanks that have discharged a large amount of pollutants, the YR has been severely polluted at times, resulting in high concentrations of HMs in certain areas [26,28,29]. For instance, the concentrations of heavy metals in the Yellow River Basin are significantly higher in the upper and middle reaches than in the lower reaches [30]. Despite extensive research on heavy metal pollution in the sediments of the Yellow River Basin (YRB), the majority of existing studies have predominantly focused on analyzing heavy metals in sediments from individual rivers, regions, or lakes, with limited assessments of heavy metal pollution at the basin-wide scale, particularly in the areas of pollution source identification and integrated risk assessment of multiple heavy metals.
This study took the YRB as the research object, collected 44 sediment samples, and measured the concentrations of chromium (Cr), nickel (Ni), copper (Cu), zinc (Zn), arsenic (As), cadmium (Cd), and lead (Pb) in the sediments. The objectives of this study are to (1) investigate the characteristics of HM concentrations in sediments of the YRB, (2) evaluate the pollution status and HM risks of HMs in the sediments, and (3) elucidate the potential sources of HMs in the sediments. The findings of this study can provide a theoretical basis and data support for the ecological and environmental management of regional socio-economic sustainable development.

2. Materials and Methods
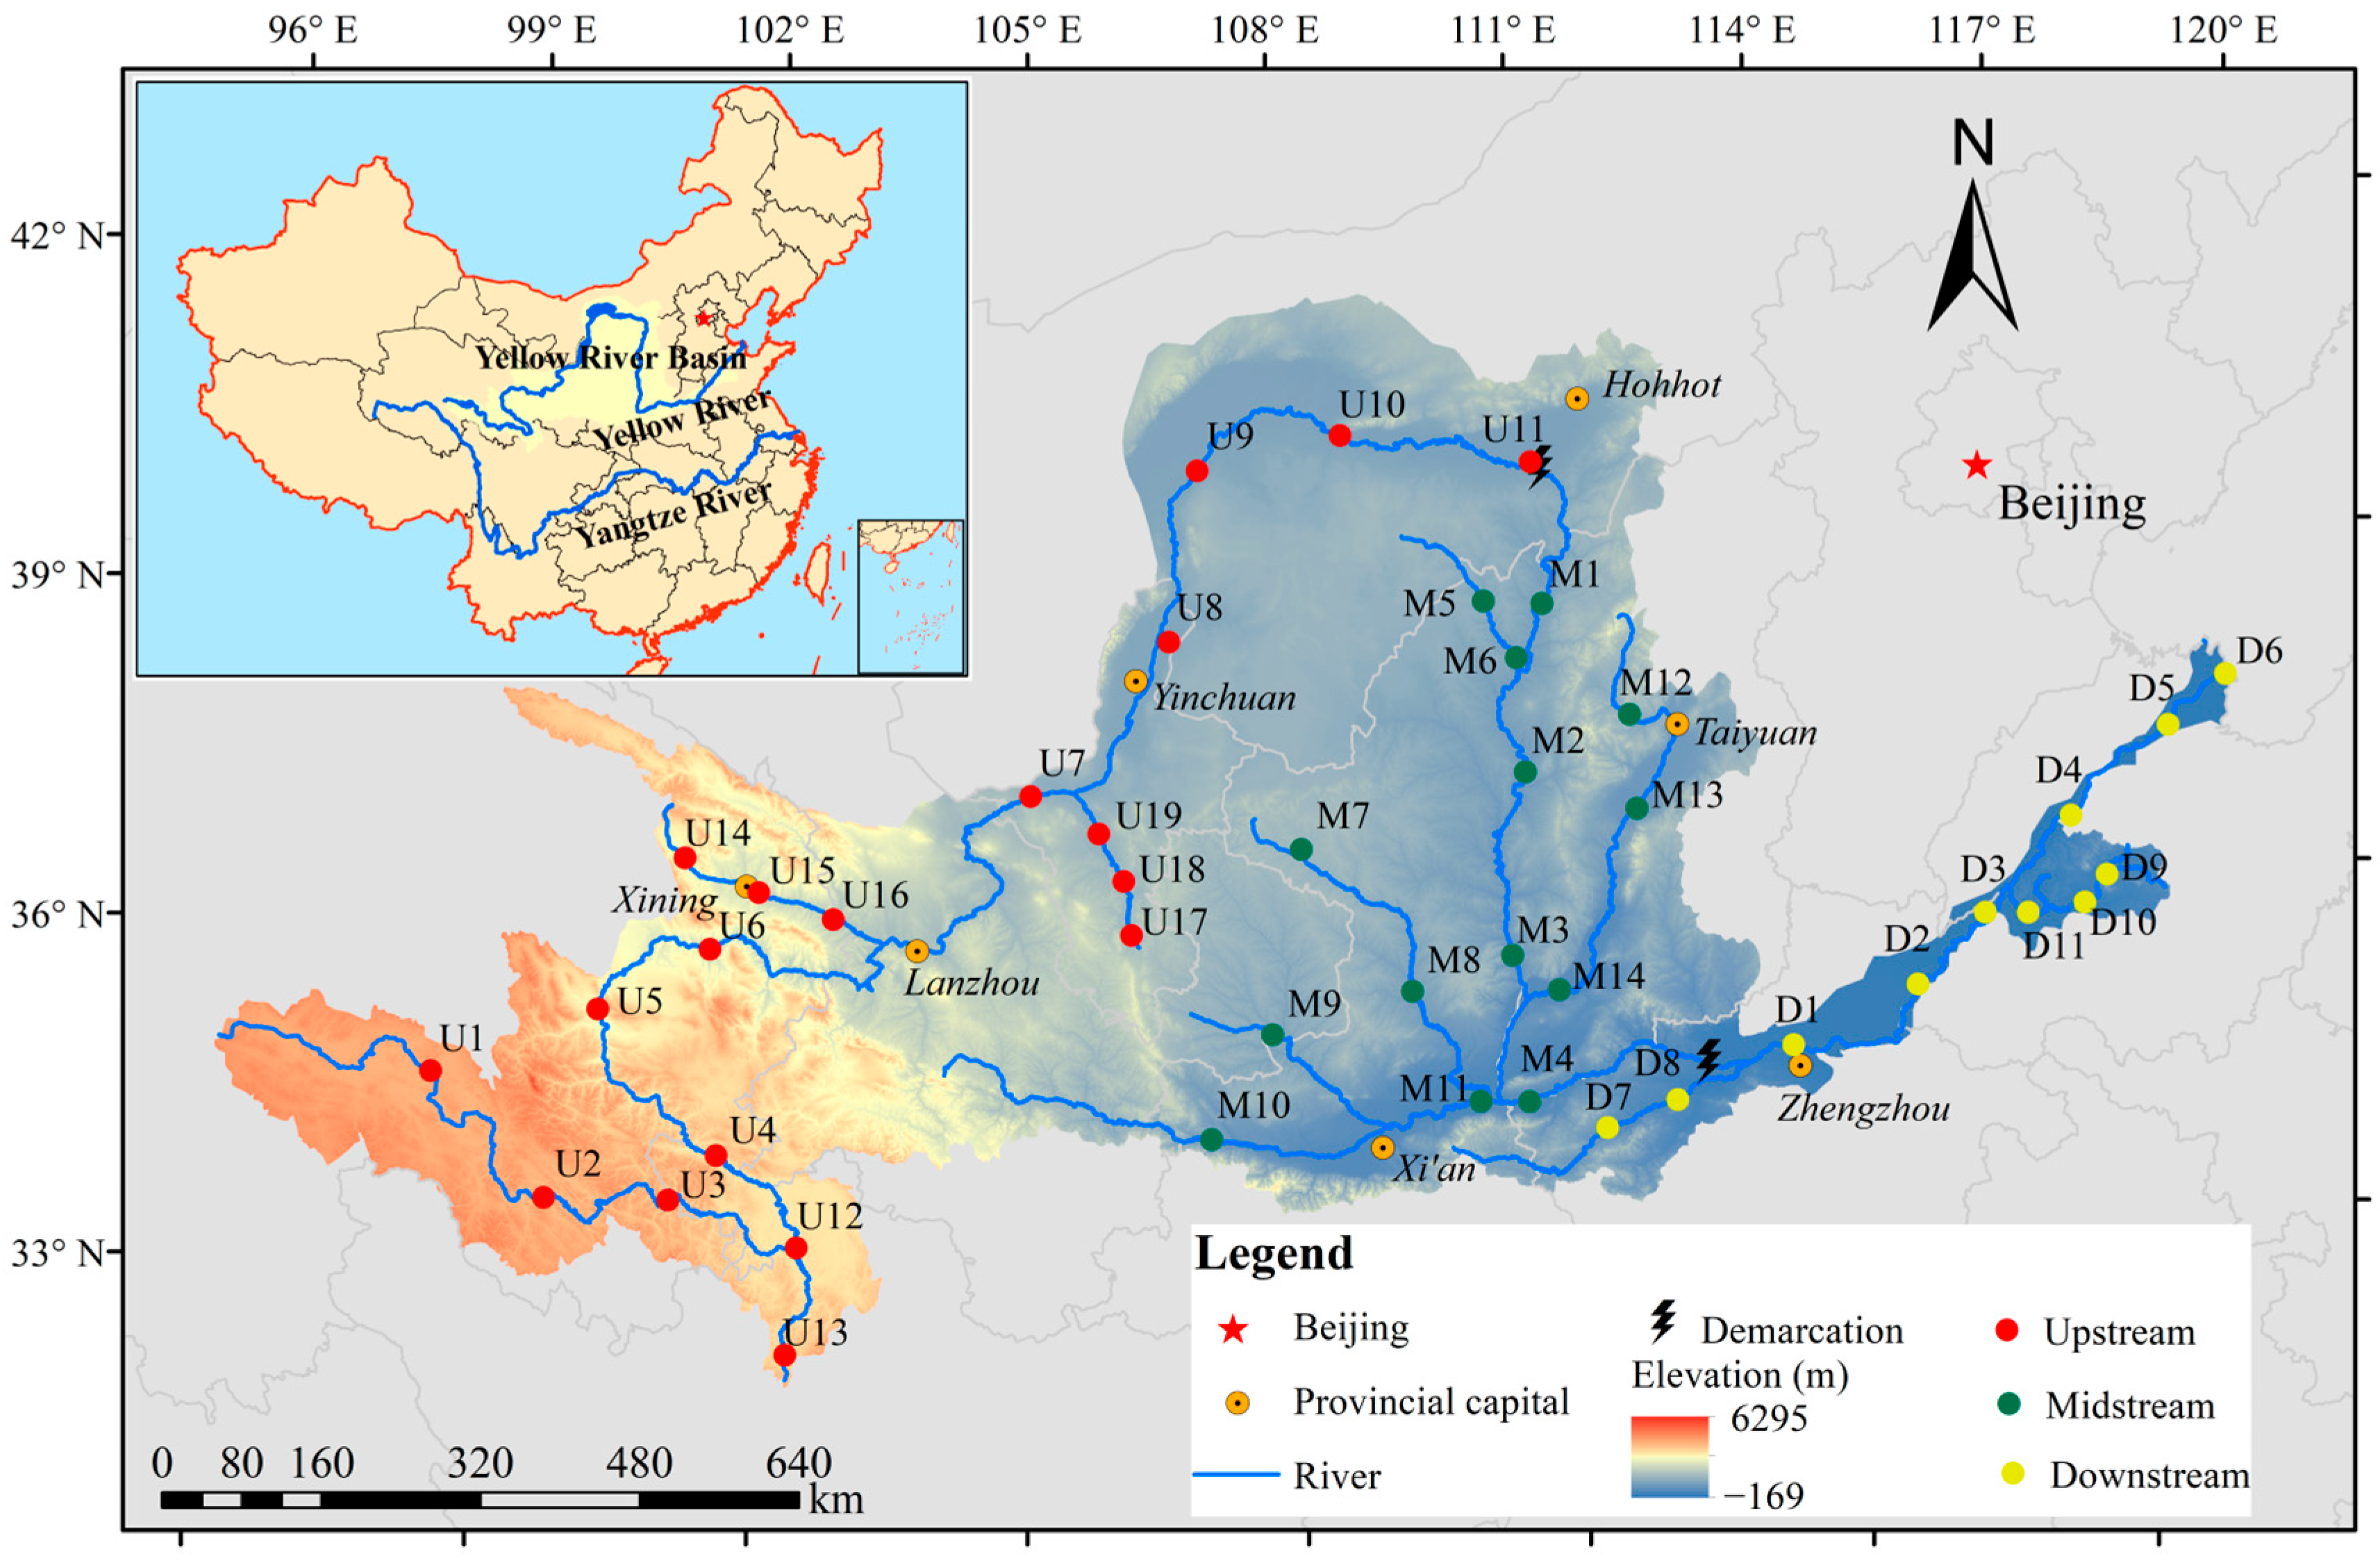
2.1. Study Area

The Yellow River, which is China’s second-longest watercourse with a length of approximately 5464 km, originates from the Tibetan Plateau and flows through the Loess Plateau as well as the densely populated North China Plain before finally discharging into the Bohai Sea. Encompassing 95°53′45″–119°12′48″ E and 32°9′33″–41°50′20″ N, the YRB spans 1900 km longitudinally and 1100 km latitudinally, covering a total drainage area of 795,000 km2. A distinct topographical gradient is observed across the basin, descending from elevated western highlands to depressed eastern lowlands. The basin exhibits a continental climate with distinct regional differences: the southeastern region is semi-humid, the central region is semi-arid, and the northwestern region is arid. Precipitation and temperature patterns exhibit similar gradients, decreasing from the southeast to the northwest. Mean annual precipitation varies between 200 and 1000 mm, while temperatures fluctuate from −3 to 15 °C [31]. The basin contains substantial coal deposits and hydrocarbon reserves, with select regions hosting significant metallic mineral deposits. Intensive resource extraction operations in these areas have resulted in significant ecological pressures within the study area [32].

2.2. Sample Collection and Metal Concentration Measurement

Sediment samples were collected from 44 sites in the YRB during July and August 2022 (Figure 1), including 19 upstream (U1–U19), 14 midstream (M1–M14), and 11 downstream (D1–D11) sampling sites. The main stream sampling sites were situated at hydrological stations, with additional sites established in the upstream, midstream, and downstream of each tributary. Sediment samples weighing 500 g were collected from a depth of 0–10 cm on the riverbed using a grab sampler, with each site sample consisting of three parallel subsamples [33,34]. After processing (detailed in Supplementary Material), HM concentrations were quantified through inductively coupled plasma mass spectrometry (iCAP Q; Fisher Thermo Scientific, Waltham, MA, USA).

2.3. Methods for HM Pollution Assessment

2.3.1. Pollution Index Method

The enrichment degree of individual metals and the extent of HM contamination in the sediments were evaluated using the contamination factor (CF) and pollution load index (PLI), with reference to average background values of Chinese river sediments established by Shi et al. [35], following the methodology described in Xie et al. [30]. These indices were mathematically defined through the following equations:
CF = C s C ref
PLI   = CF 1   ×   CF 2   ×   CF 3   ×   CF n   n
where Cs is the measured concentration of metal i in the sediment sample, Cref is the average background value of the element in Chinese river sediments, and n is the number of relevant metals. The CF is used to assess single-metal pollution and is classified into four grades: low pollution (CF < 1), moderate pollution (1 ≤ CF < 3), high pollution (3 ≤ CF < 6), and severe pollution (CF ≥ 6). The PLI is employed to provide an overall assessment of the comprehensive contamination status of HMs in the studied sediments. When PLI > 1, it indicates the presence of HM pollution; otherwise, if PLI < 1, it suggests that there is no HM pollution at the sampling site.

2.3.2. Human Health Risk Assessment Based on Monte Carlo Simulation

A comprehensive environmental health risk assessment was conducted using the four-step methodology endorsed by the U.S. Environmental Protection Agency [36,37,38,39], encompassing both non-carcinogenic and carcinogenic risk quantification through oral ingestion and dermal exposure pathways for adult and pediatric populations. To enhance the scientific rigor and statistical reliability of the health risk evaluation, a probabilistic risk assessment was implemented through Monte Carlo simulations, with computational parameters standardized at 10,000 iterations and a 95% confidence interval for probabilistic determination of HM-induced health impacts [39,40].
The daily average exposure doses via hand-to-mouth ingestion and dermal contact are calculated using the following equations [41,42]:
CDD ing = C i × IR ing × ED × EF BW × AT × K
CDD derm = C i × SA × AF × ABS × ED × EF BW × AT × K
where CDDing and CDDderm are the daily average exposure doses via hand-to-mouth ingestion and dermal contact (mg·(kg·d)−1), respectively; Ci is the measured concentration of HM i (mg·kg−1); IRing is the hand-to-mouth ingestion rate (mg·d−1); ED and EF are the exposure duration (a) and exposure frequency (d·a−1), respectively; BW is the average body weight (kg); SA and AF represent the skin exposure surface area (m2) and skin adherence factor (mg·(cm2·d)−1), respectively; AT denotes the average exposure time (d); ABS is the dermal absorption factor (dimensionless); and K is the unit conversion factor. The probabilistic distributions of exposure parameters based on Monte Carlo simulation and the values of parameters involved in Equations (3) and (4) are presented in Table S1.
HMs such as As, Cd, Cr, Cu, Ni, Pb, and Zn pose non-carcinogenic risks to human health, among which As, Cd, Cr, Ni, and Pb also have carcinogenic risks [43]. The non-carcinogenic risks associated with HM elements can be determined using the following calculation formula [36,41]:
H I = H Q i j = C D D i j R F D i j
where HI is the total non-carcinogenic risk (dimensionless) and HQij and RFDij are the non-carcinogenic risk value and reference dose value (mg·(kg·d)−1) of HM i via exposure pathway j, respectively, with specific reference values presented in Table S2. Generally, when HQ or HI ≤ 1, it indicates no non-carcinogenic risk; when 1 < HQ or HI ≤ 10, it indicates the presence of non-carcinogenic risk; when HQ or HI > 10, it indicates a significant non-carcinogenic risk.
The carcinogenic risk of the HMs As, Cd, Cr, and Pb in the sediments to different populations is calculated using the following equation [36]:
T C R = C R i j = C D D i j × S F i j
where TCR is the total carcinogenic risk value (dimensionless) and CRij and SFij are the carcinogenic risk value and carcinogenic slope factor value (mg·(kg·d)−1) of HM i via exposure pathway j, respectively. The RFD and SF values for different HMs via hand-to-mouth ingestion and dermal contact exposure pathways are presented in Table S2. In terms of carcinogenic risk, a TCR or CR ≤ 10−6 is considered to pose no carcinogenic risk; when 10−6 < TCR or CR ≤ 10−4, the risk is deemed acceptable; a TCR or CR > 10−4 indicates significantly elevated carcinogenic risk.

2.4. Positive Matrix Factorization (PMF) Model

The PMF model, a receptor-based multivariate factor analysis method for pollution source apportionment [44], mathematically decomposes the target sample concentration matrix (X) into three constituent matrices through factorization: the source contribution matrix (G), source profile matrix (F), and residual matrix (E). The mathematical representation is expressed as follows:
X i j = k = 1 p G i k × F k j + E i j
where Xij denotes the concentration of element i in sample j; Gik represents the contribution of element i to source factor k; Fjk corresponds to the content of element i in source factor k; Eij indicates the residual error for element i in sample j; and p is defined as the number of pollution factors.
The optimal solution for matrix optimization through iterative computation via the multilinear engine (ME) model is identified when the objective function Q reaches its minimum value [44]. The mathematical formulations are expressed as follows:
Q = i = 1 n j = 1 m E i j U i j
U ij   = 5 6   ×   MDL where   c MDL δ × c 2 + MDL 2 where   c > MDL
where Q denotes the objective function; n indicates the number of samples; m represents the number of element species; Uij is defined as the uncertainty value; δ corresponds to the relative standard deviation; c signifies the measured concentration of HMs; and MDL refers to the method detection limit.

2.5. Data Processing and Analysis

Statistical analyses including normality tests and Spearman correlation analysis of HMs were performed using SPSS 23 (IBM, Armonk, NY, USA). The coefficient of variation (CV) is a statistical measure that reflects the relative dispersion of data [45]. It is categorized into three types: low variability (CV < 15%), moderate variability (15% ≤ CV < 36%), and high variability (CV ≥ 36%) [46]. Geospatial visualizations depicting the study area location, sampling site distribution, and HM concentration patterns were constructed through the application of ArcMap 10.2. Origin 2021 (OriginLab Corporation, Northampton, MA, USA) was used to generate bar charts, box plots, and pie charts. Quantitative source apportionment analysis was conducted utilizing the PMF 5.0 receptor model. Probabilistic modeling through Monte Carlo simulations was implemented using Oracle Crystal Ball software (https://www.oracle.com).

3. Results

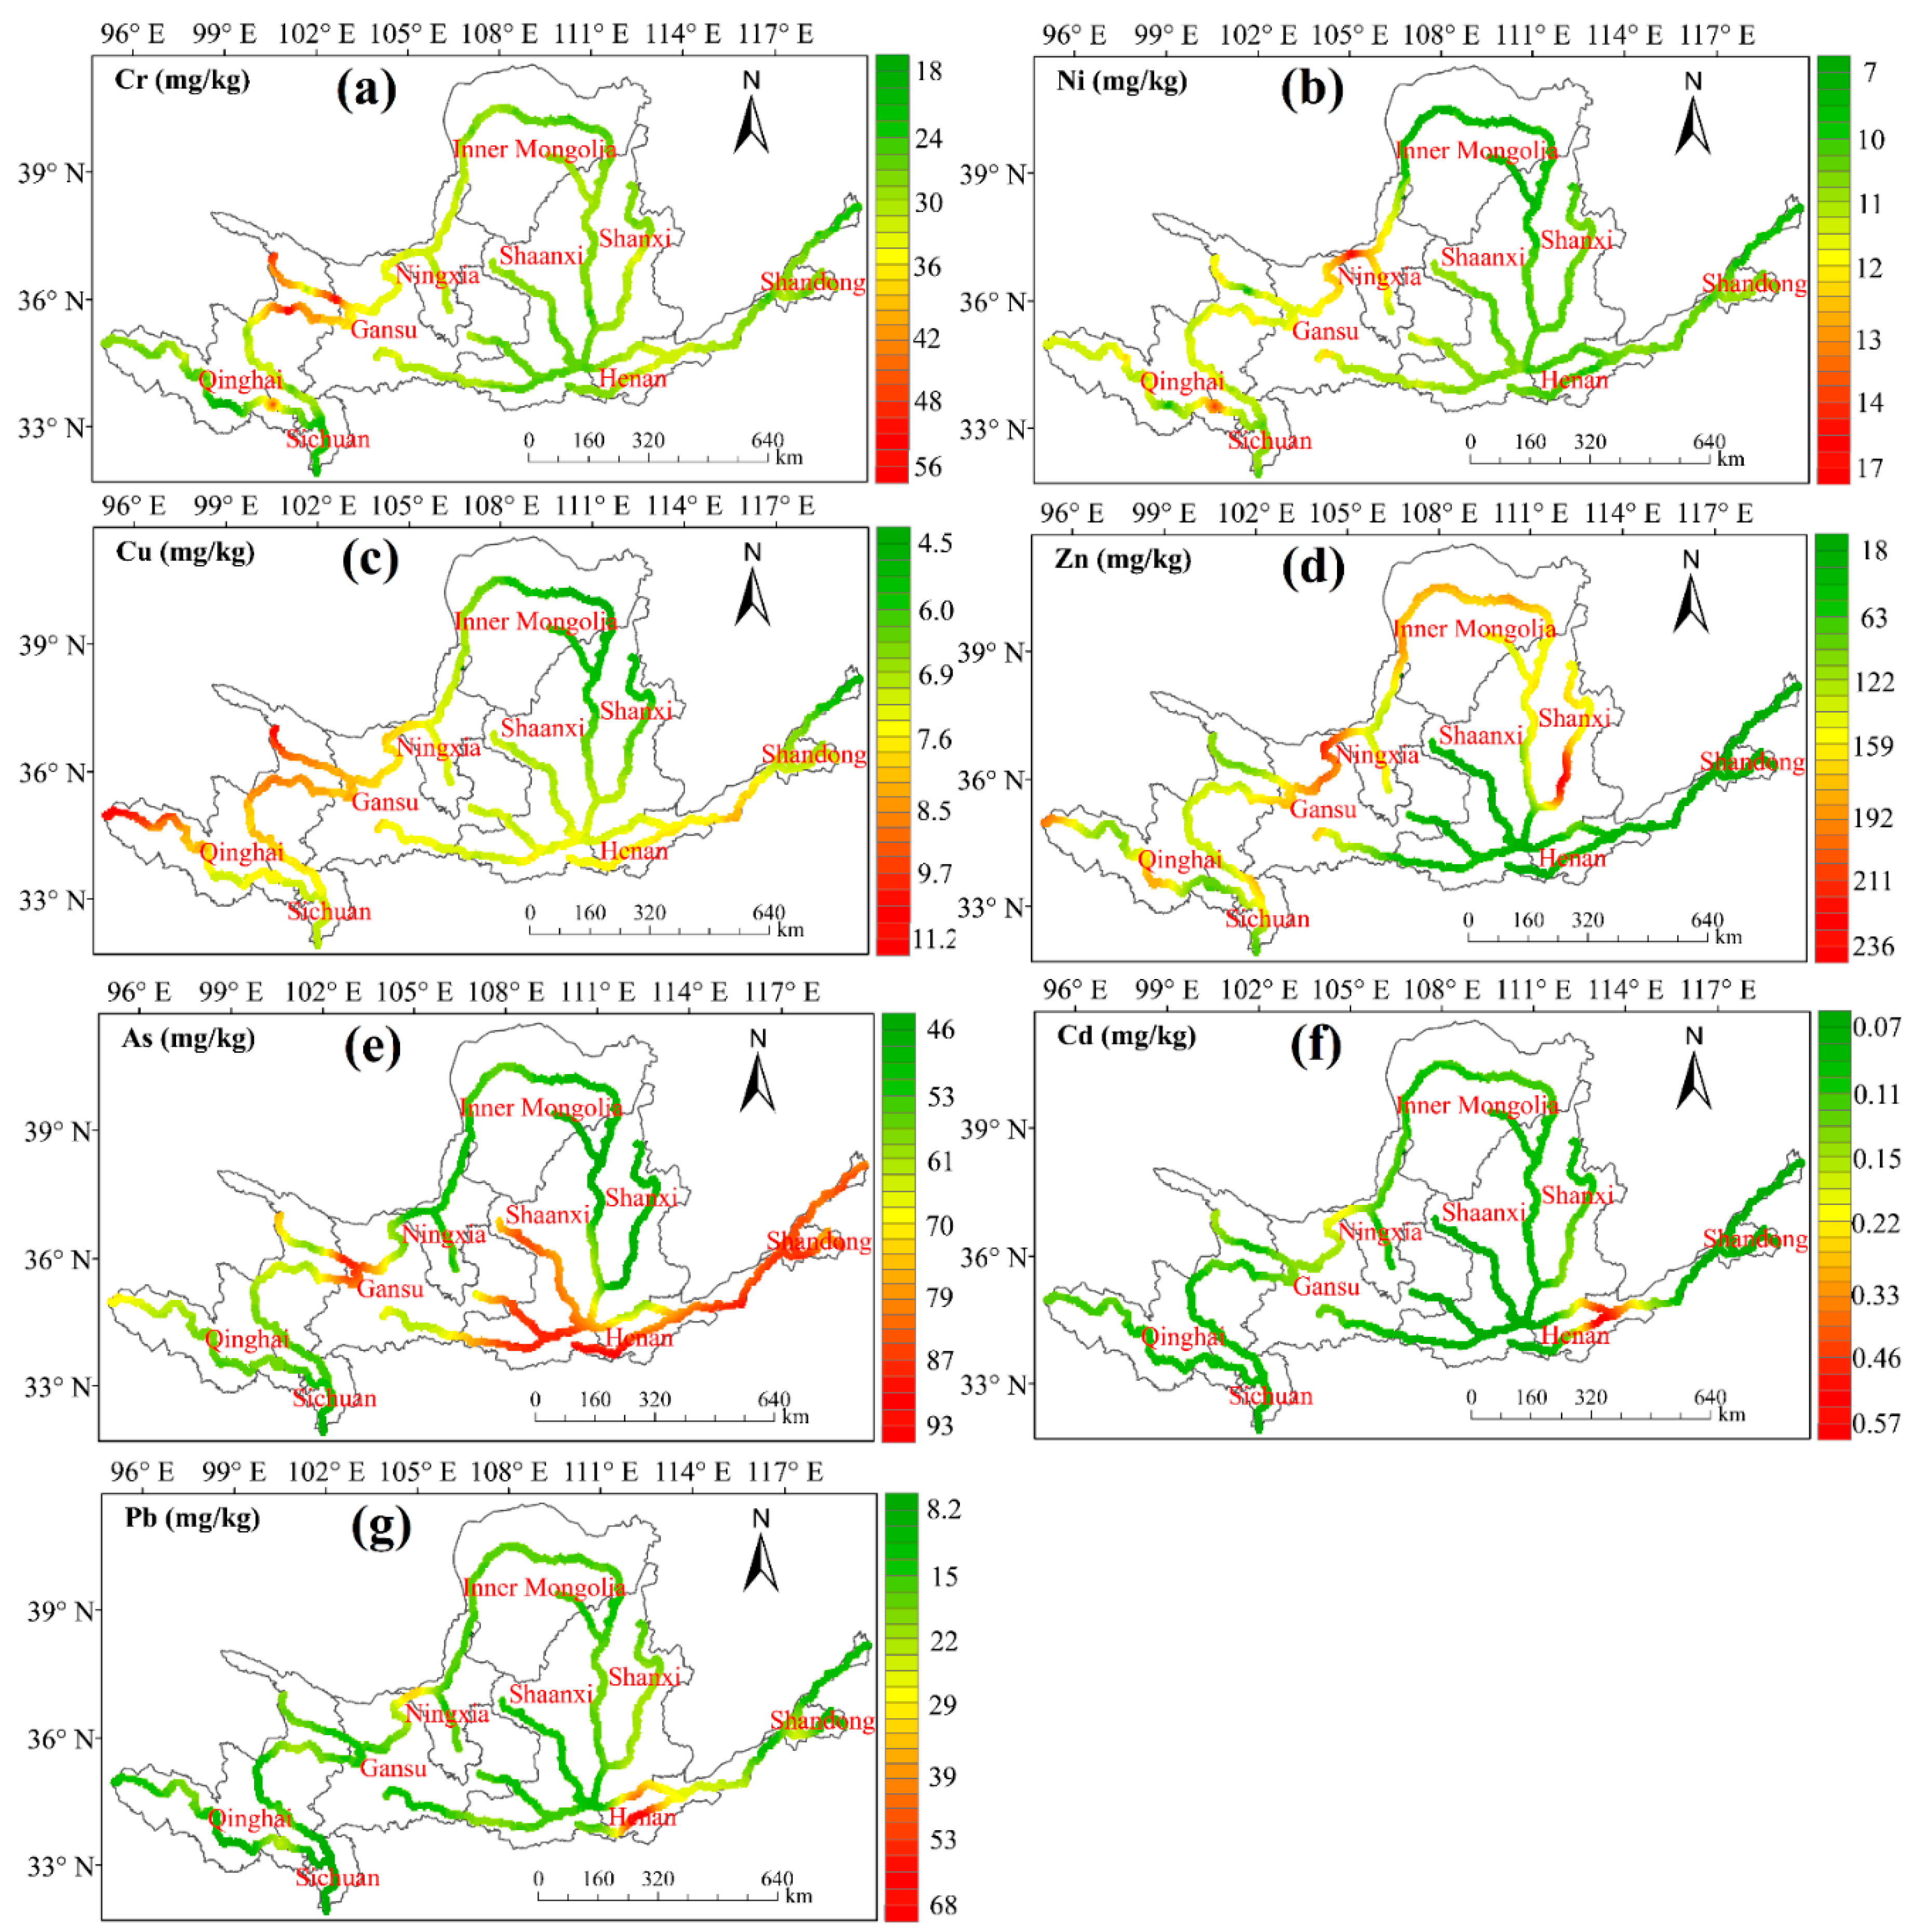
3.1. Distribution Characteristics of HMs in Sediments

The statistical characteristics of HM concentrations in YRB sediments are presented in Table S3. The mean concentrations were observed in the following descending order: Zn (109.73 ± 71.89 mg/kg) > As (68.32 ± 16.06 mg/kg) > Cr (28.92 ± 7.3 mg/kg) > Pb (21.73 ± 9.49 mg/kg) > Ni (12.18 ± 3.77 mg/kg) > Cu (7.66 ± 2.68 mg/kg) > Cd (0.14 ± 0.08 mg/kg). Notably, the CV values exhibited significant spatial heterogeneity across river reaches. The maximum CV for Zn (66.02%) was recorded in middle reaches, while the peak CV for Cd (87.58%) was identified in lower reaches. The variability classification revealed moderate variation for Cr (25.25%), Ni (30.94%), Cu (35.06%), and As (23.51%), contrasted with high variation patterns for Zn (65.52%), Cd (58.47%), and Pb (43.65%).
The spatial distribution patterns of HMs in YR sediments are presented in Figure 2. HMs in the sediments exhibited significant spatial differences (p < 0.05). The spatial distribution patterns of Cr, Cu, and Ni were similar, with larger fluctuations in the upstream and smaller changes in the midstream and downstream. In contrast, Pb exhibited larger fluctuations in the upstream and downstream. The spatial distribution patterns of As and Zn were completely different. The concentration of As gradually increased from the upstream to the downstream, while that of Zn gradually decreased. The concentration of Cd was relatively low compared to other HMs, with smaller changes in the upstream to the downstream.

3.2. Heavy Metal Pollution Assessment

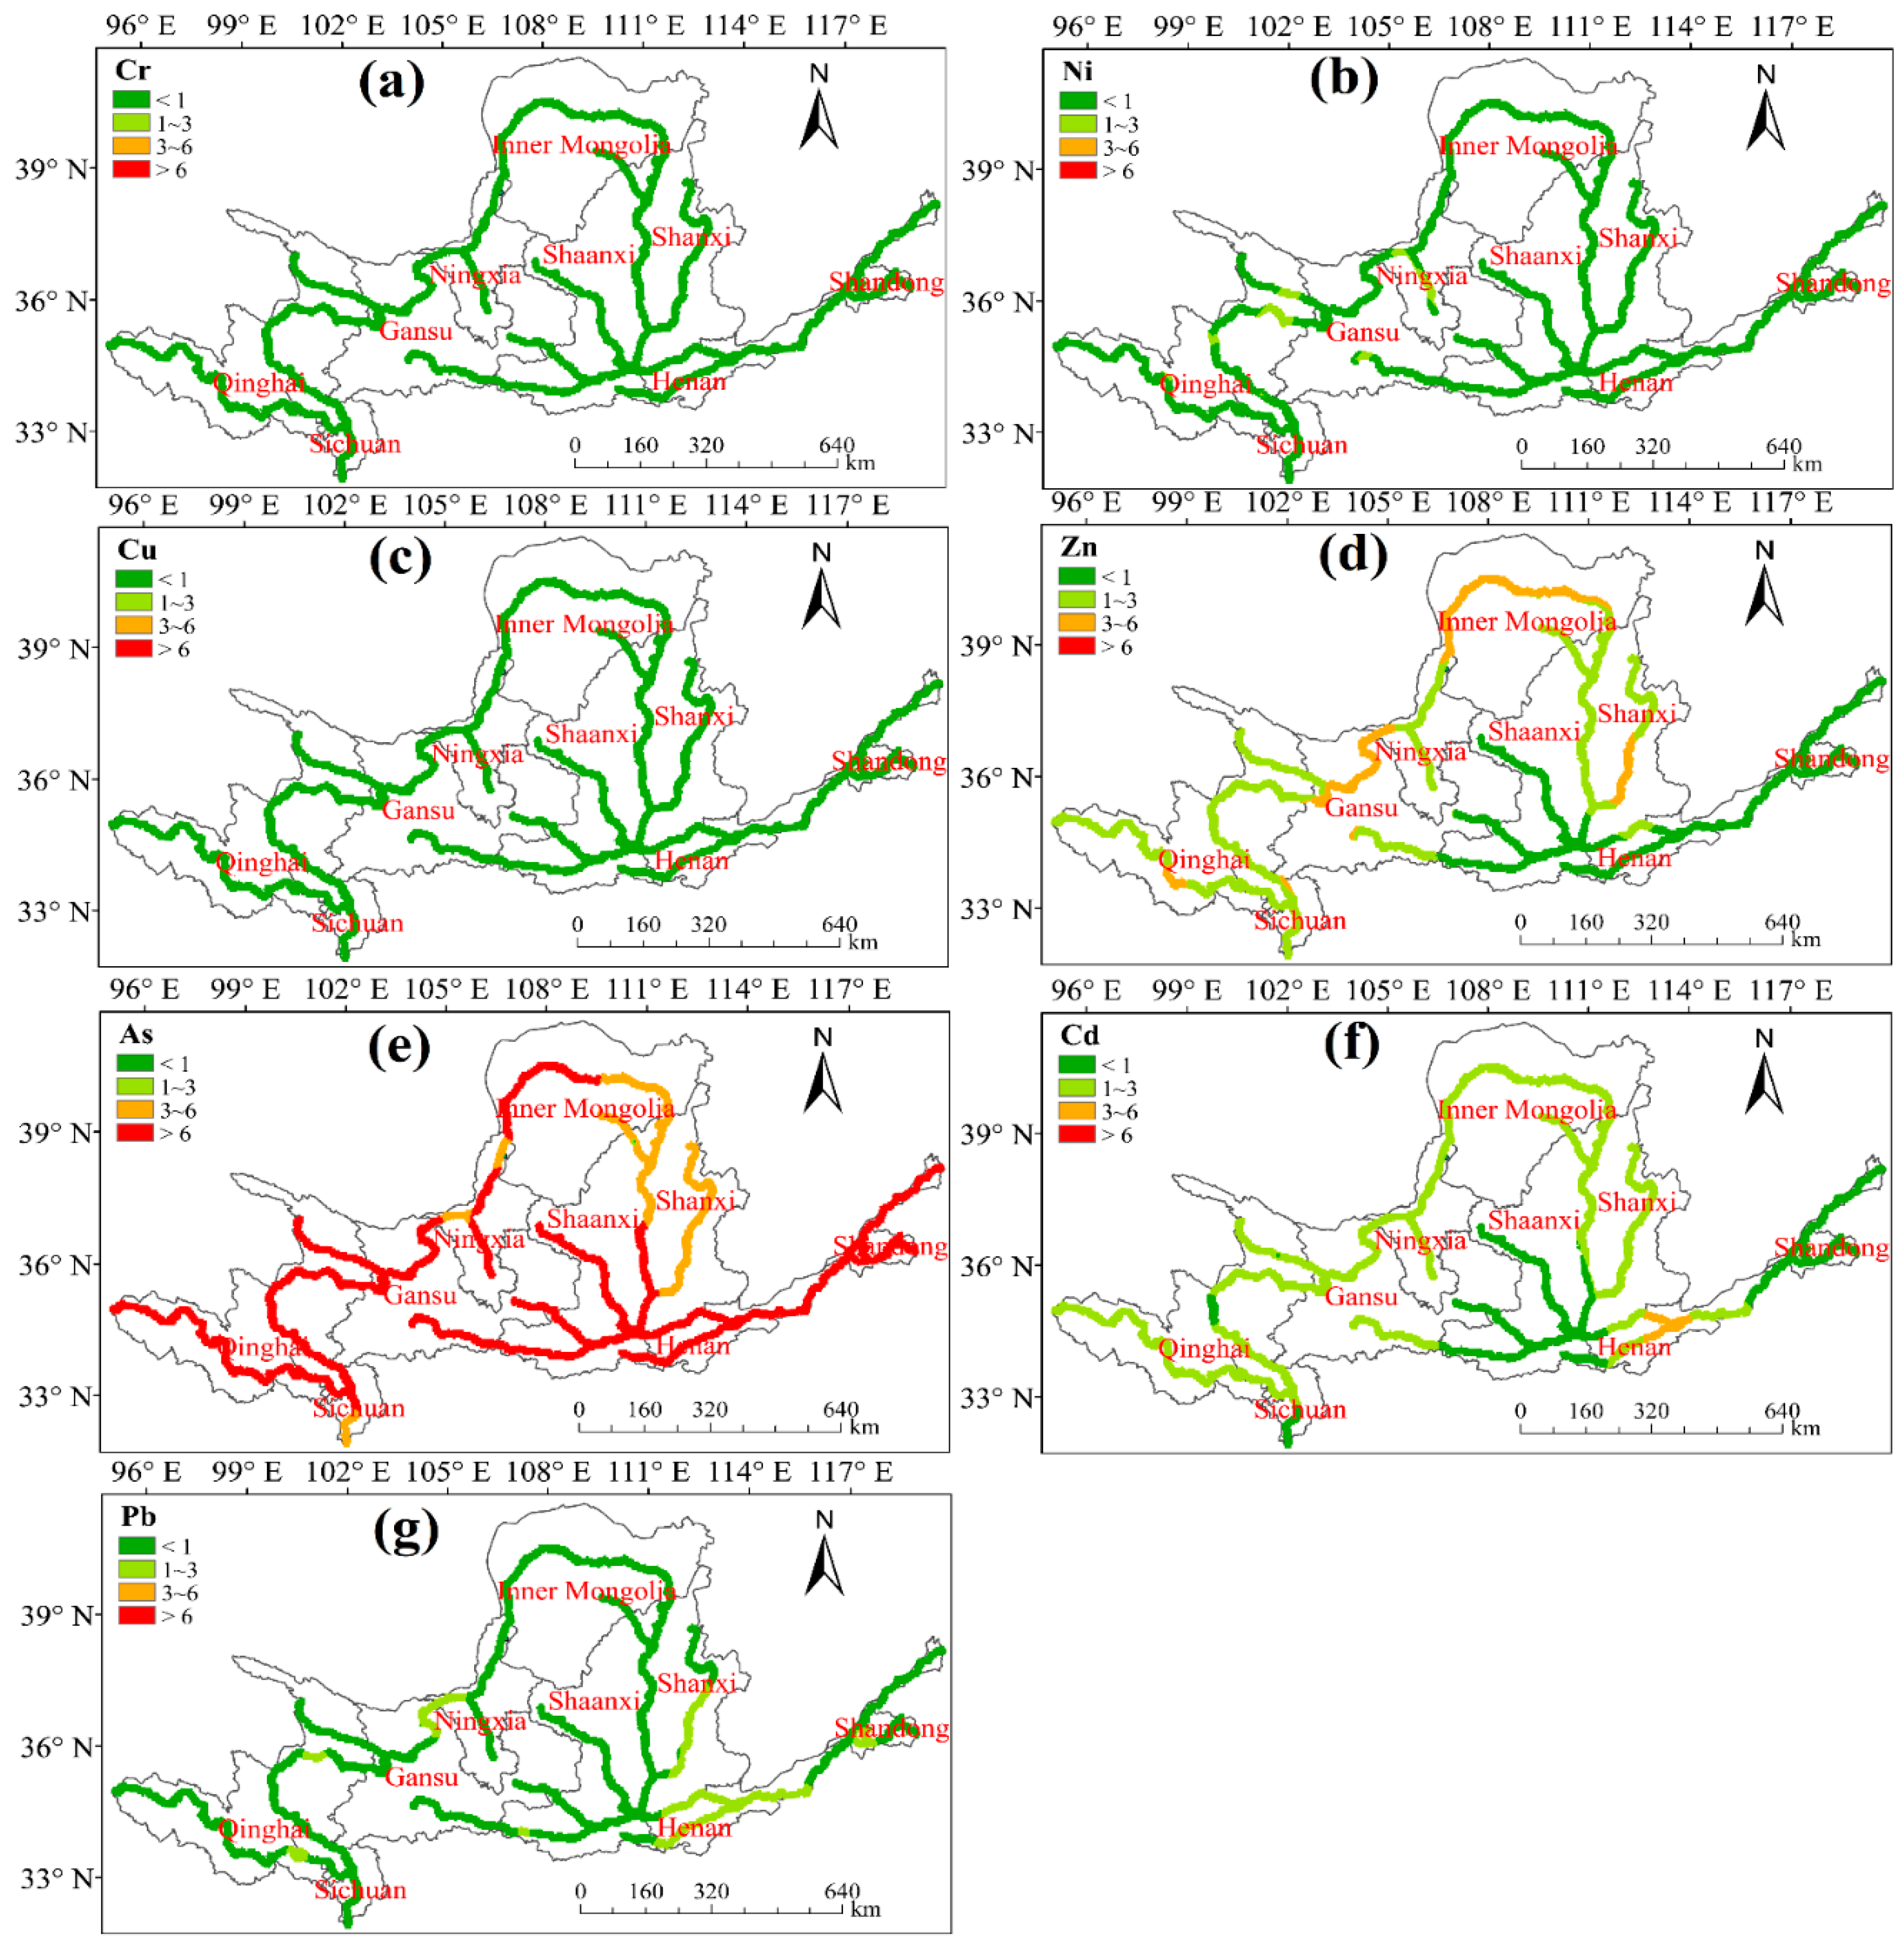
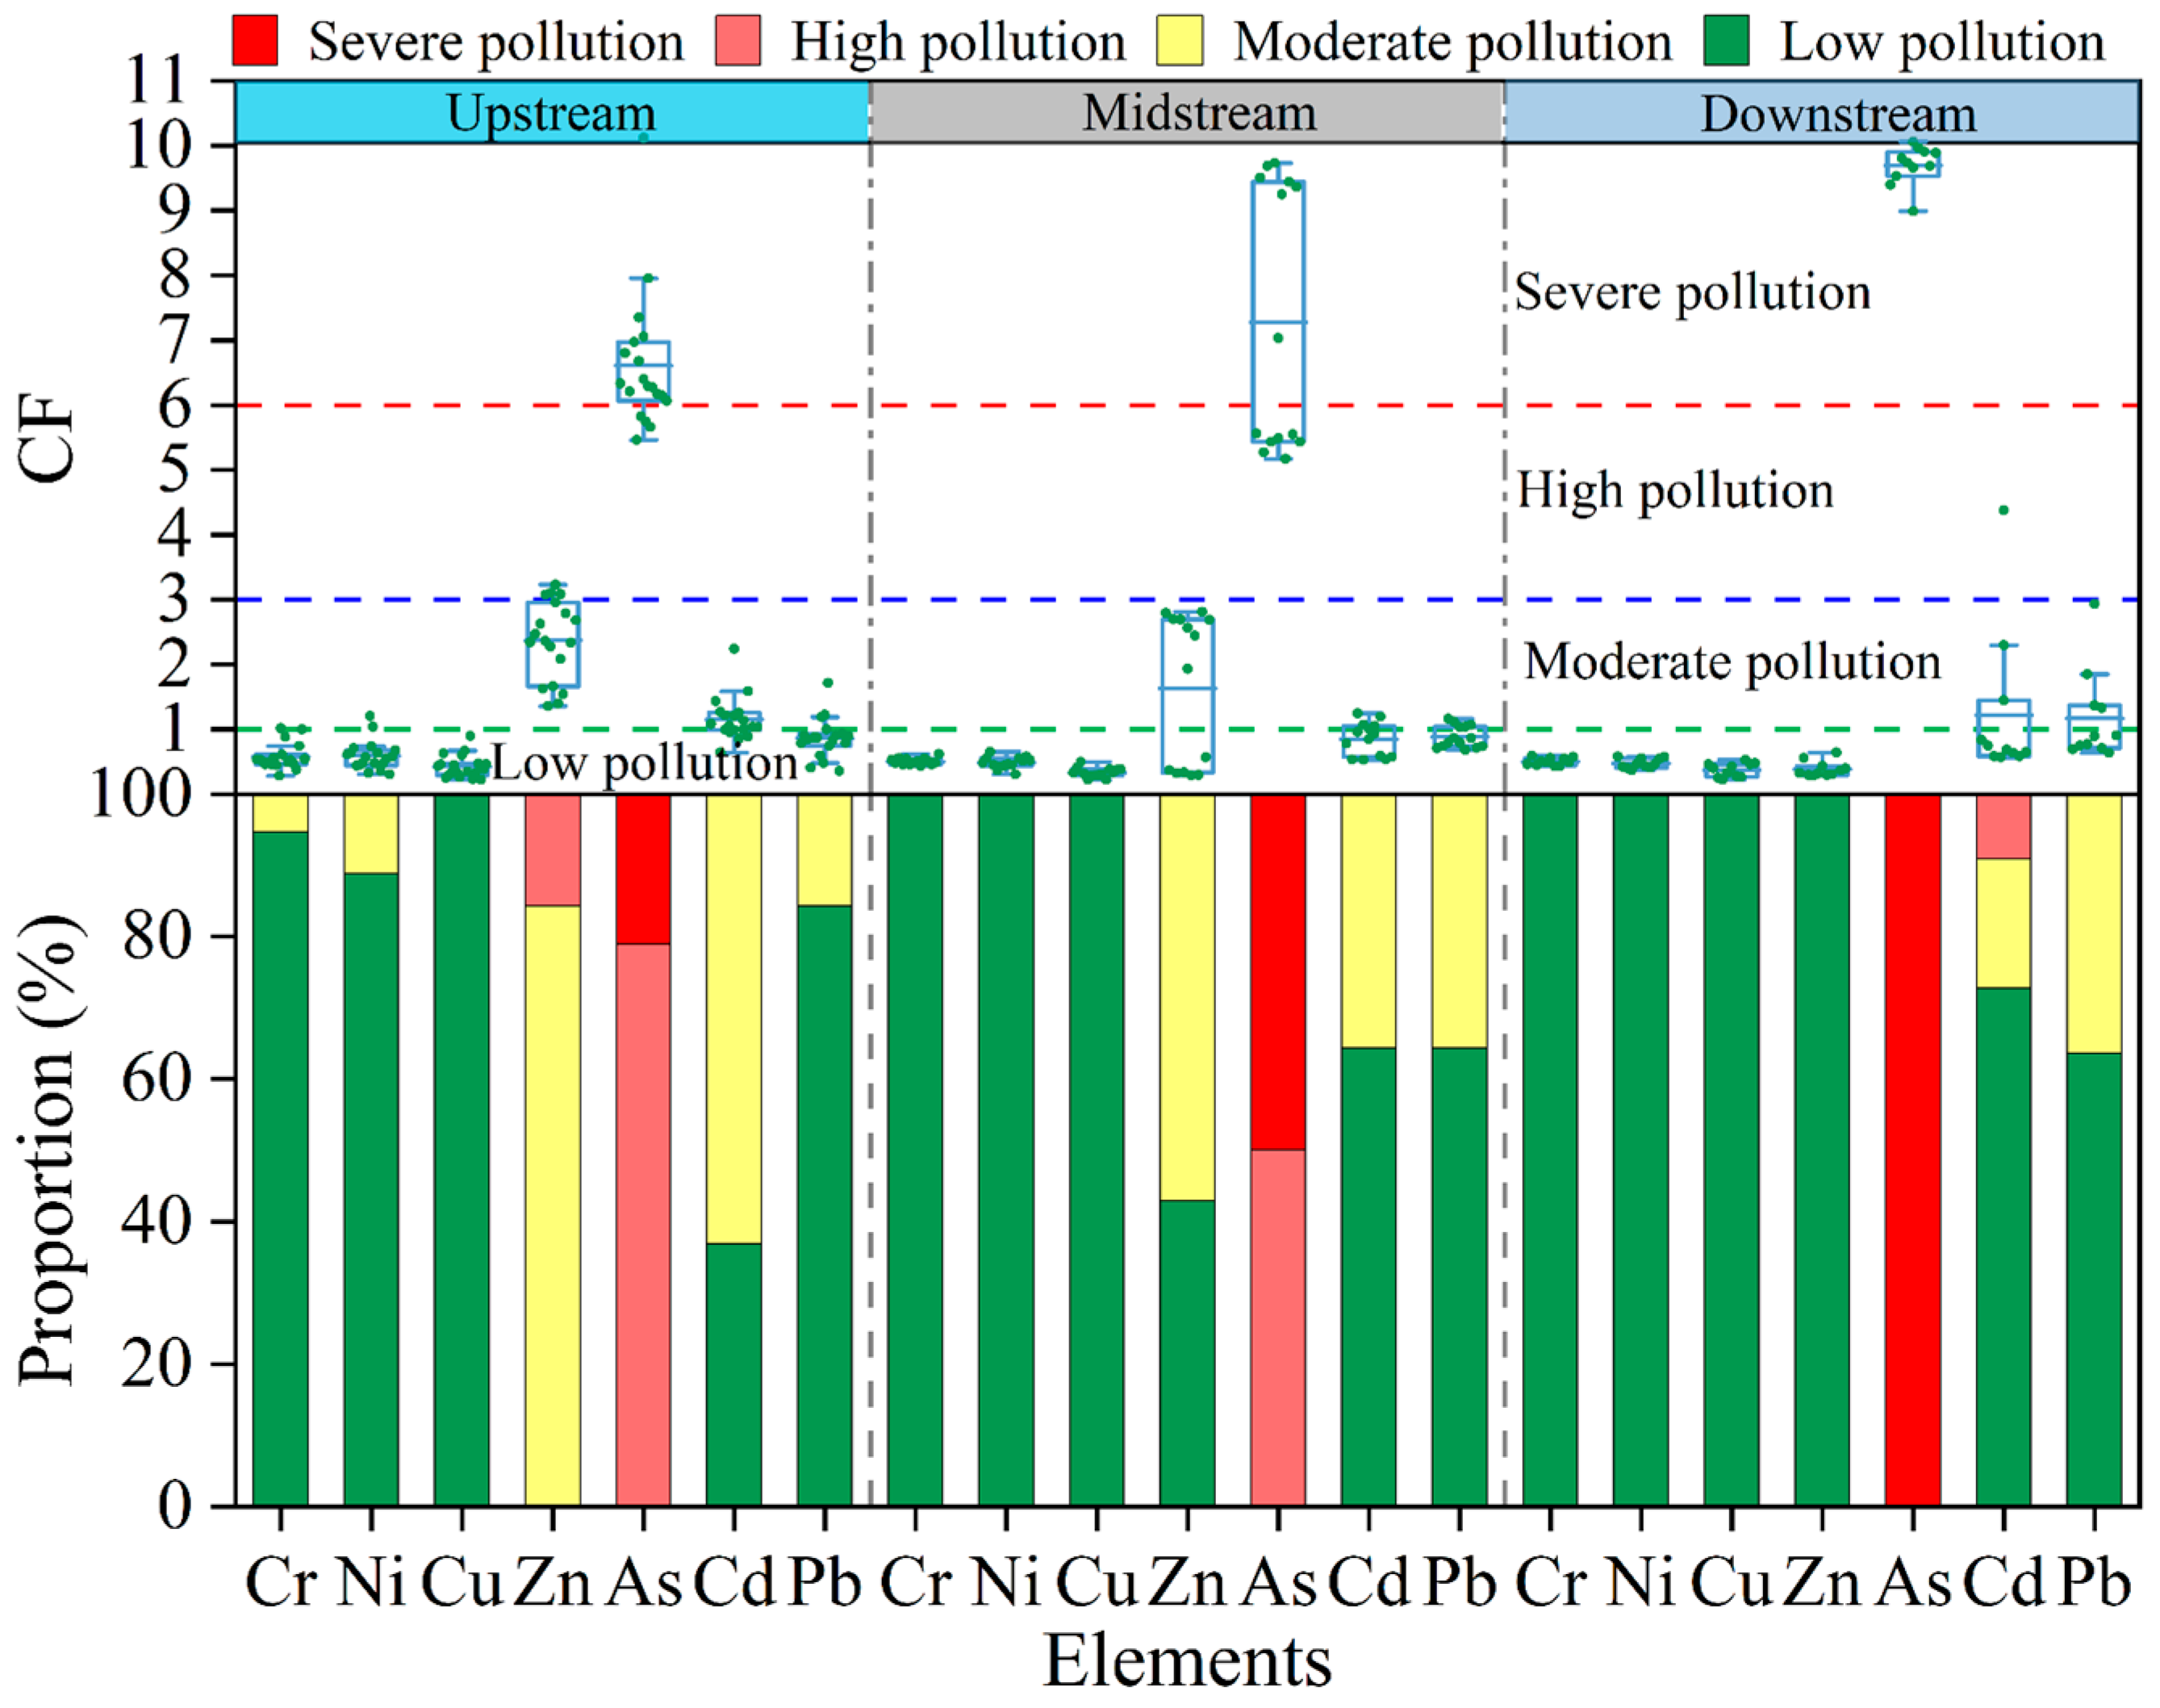
3.2.1. Contamination Factor (CF)

The spatial distribution characteristics of CF for HMs in sedimentary deposits are presented in Figure 3. The degree of pollution of As, Zn, Cd, and Pb in the sediments was higher than that of Cr, Ni, and Cu. Cr, Ni, and Cu were basically unpolluted, while Zn and Cd had similar pollution levels, with lower pollution in the upstream and downstream and higher pollution in the lower reaches. The pollution level of As in the sediments was relatively high, with most areas being highly polluted. In addition, the pollution status of Pb in the sediments was mainly low, with some areas experiencing moderate pollution.
Based on the measured concentrations of seven heavy metals in the sediments at 44 sampling points, we used the contamination factor (CF) method to evaluate the degree of heavy metal pollution (Figure 4). Most HMs in the sediments are in the “low to moderate” pollution range. Zinc (Zn) has a higher pollution level in the upstream area, while arsenic (As) has a higher pollution level in the downstream area. In the upstream area, the average order of CF results is the following: As (6.61), Zn (2.37), Cd (1.15), Pb (0.86), Ni (0.59), Cr (0.58), Cu (0.43). In the upstream, As was found at severe pollution levels in 21.05% of the sampling points and at high pollution levels in 78.95% of the sampling points. Zn was detected at high pollution levels in 15.79% of the sampling points and at moderate pollution levels in 84.21% of the sampling points.
In the midstream area, As was found at severe pollution levels in 50% of the sampling points and at high pollution levels in the remaining 50%. Additionally, Zn was found at moderate pollution levels in 57.14% of the sampling points. In the downstream area, the average order of CF values is the following: As (9.69), Cd (1.22), Pb (1.17), Cr (0.50), Ni (0.47), Zn (0.38), Cu (0.37). All sampling points in the downstream area are severely polluted with As, and 18.18% of the sampling points of Cd are in the high pollution state.

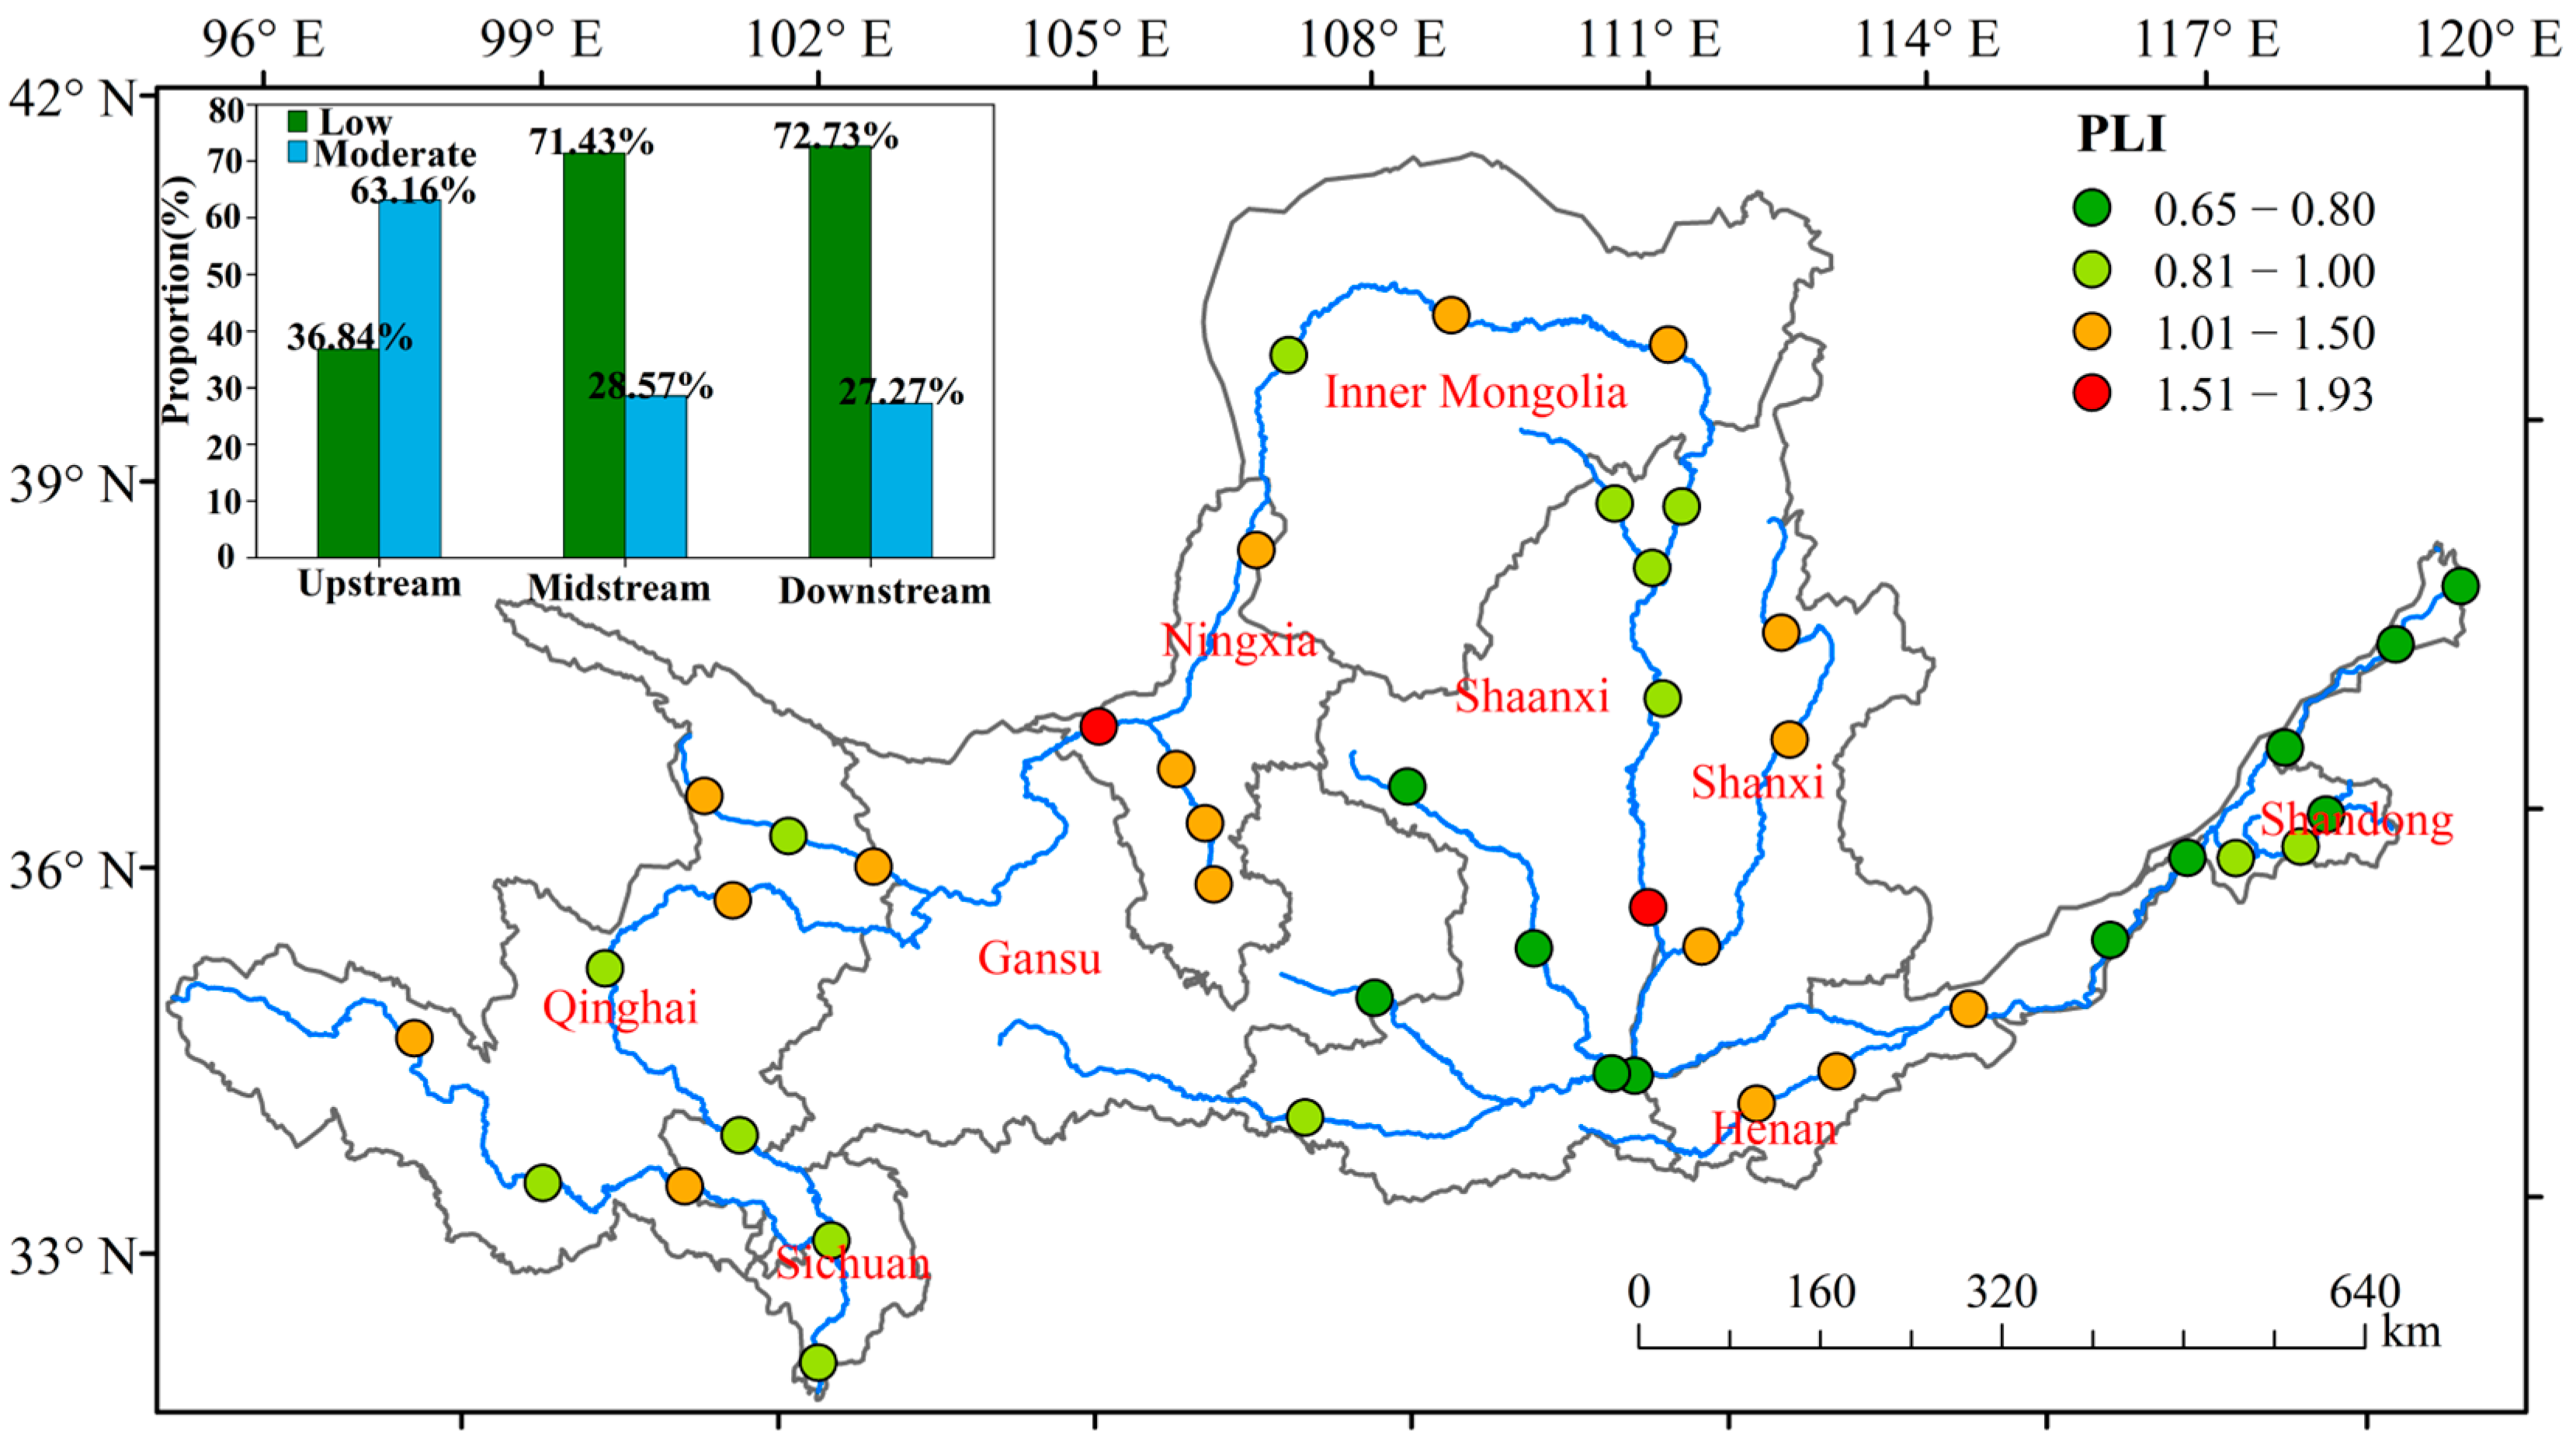
3.2.2. Pollution Load Index (PLI)

The spatial distribution of the PLI for HMs in the sediment samples is presented in Figure 5. PLI values ranged from 0.65 to 1.93, with an arithmetic mean of 1.00. The mean PLI values were calculated to be 1.10 ± 0.22, 0.97 ± 0.30, and 0.86 ± 0.20 for the upstream, midstream, and downstream regions, respectively. Sampling sites with PLI values exceeding 1.00 (metal pollution exists) were recorded at 36.84%, 28.57%, and 27.27% in upstream, midstream, and downstream regions, respectively. A higher degree of HM contamination was identified in upstream sediments compared to midstream and downstream sediments. Furthermore, elevated pollution levels were observed in tributaries relative to the main stream, with all sampled tributaries in Ningxia, Shanxi, and Henan exhibiting PLI values exceeding 1.00.

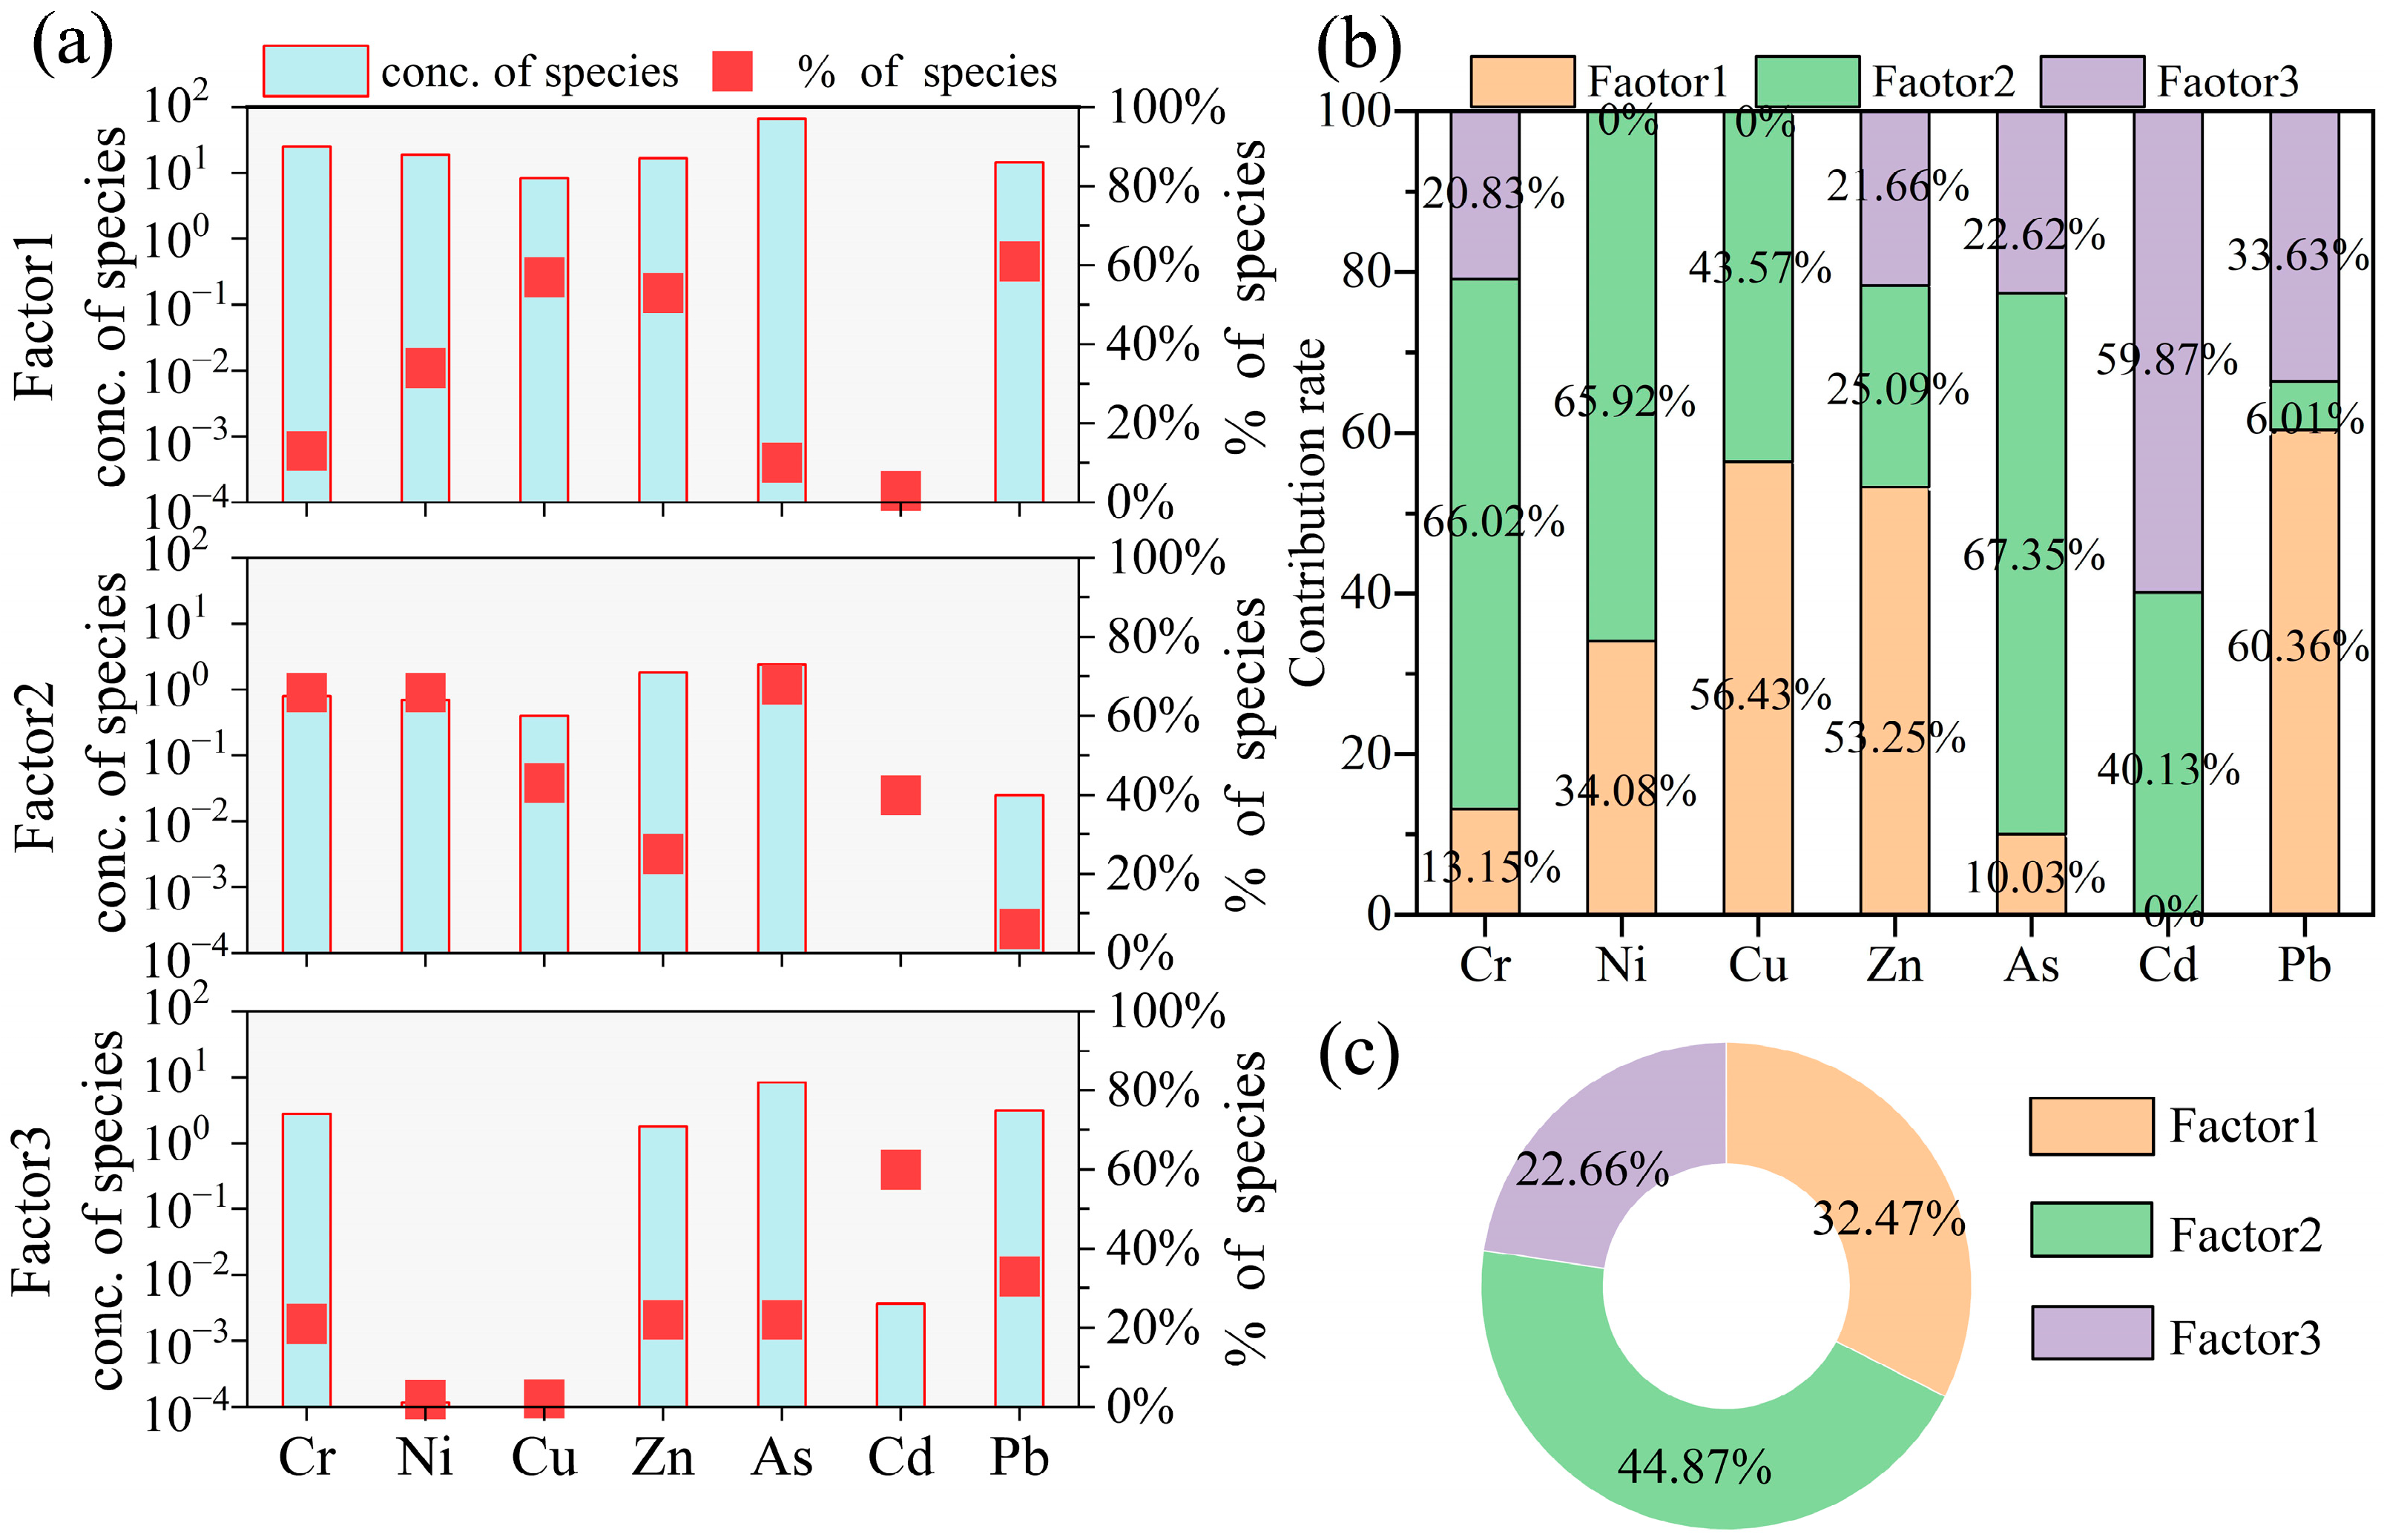
3.3. Identification of the Sources of HMs in Sediments

In recent years, the PMF model, recognized as a typical receptor model and an effective approach for pollutant source apportionment, has gained widespread application [20,44,47,48]. An analysis of HM sources in sediments from the YRB using the PMF model revealed that the average concentrations of seven HMs at 44 sample points in the study area were all above the detection limit. The number of runs was set to the system-recommended 20 times, with the factor number ranging from 3 to 6. Calculations were performed by selecting random initial iteration numbers. When the factor number was 3, the QRobust/QTrue reached the minimum convergence value, and the source apportionment model for the seven HMs exhibited a normal distribution. The fitting R2 value was higher than 0.8, effectively elucidating the pollution source information. The results of the model run are shown in Figure 6a. The results of HM pollution sources in the YRB obtained through PMF model analysis are presented in Figure 6b,c.
Factor 1 accounted for 32.47% of the HM sources in the sediments, with high loadings of Pb (60.36%), Cu (56.43%), and Zn (53.25%). It has been reported that Pb is considered a significant indicator of pollution from the transportation industry; this is not only related to the residual effects of leaded gasoline widely used in China before 2000 [49] but also due to tire and component wear in the traffic sector [50]. Additionally, during processes such as rust removal and acid washing in metal mining, processing, and smelting, waste liquids containing HMs like copper and zinc are generated. Furthermore, certain chemical enterprises produce wastewater or residues containing HMs such as copper and zinc during production. If these wastes are improperly handled, they may enter river environments and accumulate in sediments [51,52]. Therefore, Factor 1 represents a traffic–industrial source, explaining 32.47% of the HM sources in the sediments.
Factor 2 accounted for 44.87% of the HM sources in the sediments, with high loadings of As (67.35%), Cr (66.02%), Ni (65.92%), and Cd (40.13%). Factor 3 explained 22.66% of the HM sources in the sediments, primarily due to the high loading of Cd (59.87%). The sediments in the study area showed moderate variation in Ni content and high variation in As content (Table S3), indicating that both elements are significantly influenced by human activities. Pollution assessment results also revealed severe As contamination in the sediments within the study area. Studies have shown that coal combustion, industrial activities, and weathering of soil-forming parent materials are the primary sources of Ni in soils [53,54], while As mainly originates from fossil fuel combustion, wastewater emissions from coal-fired power plants, and smelters [55]. Continuous wastewater discharges from smelters and coal-fired power plants inevitably lead to increased As and Ni concentrations in river sediments [56]. Additionally, previous studies have indicated that the enrichment of Ni and Cr in soil environments is associated with the weathering of rock parent materials and coal combustion emissions, whereas the accumulation of Cr and Cd is closely related to long-term agricultural practices, such as the application of phosphate fertilizers, insecticides, pesticides, and organic fertilizers. Therefore, it can be inferred that Factor 2 represents an agricultural–industrial source, while Factor 3 represents an industrial source, explaining 44.87% and 22.66%, respectively, of the HM sources in the sediments.

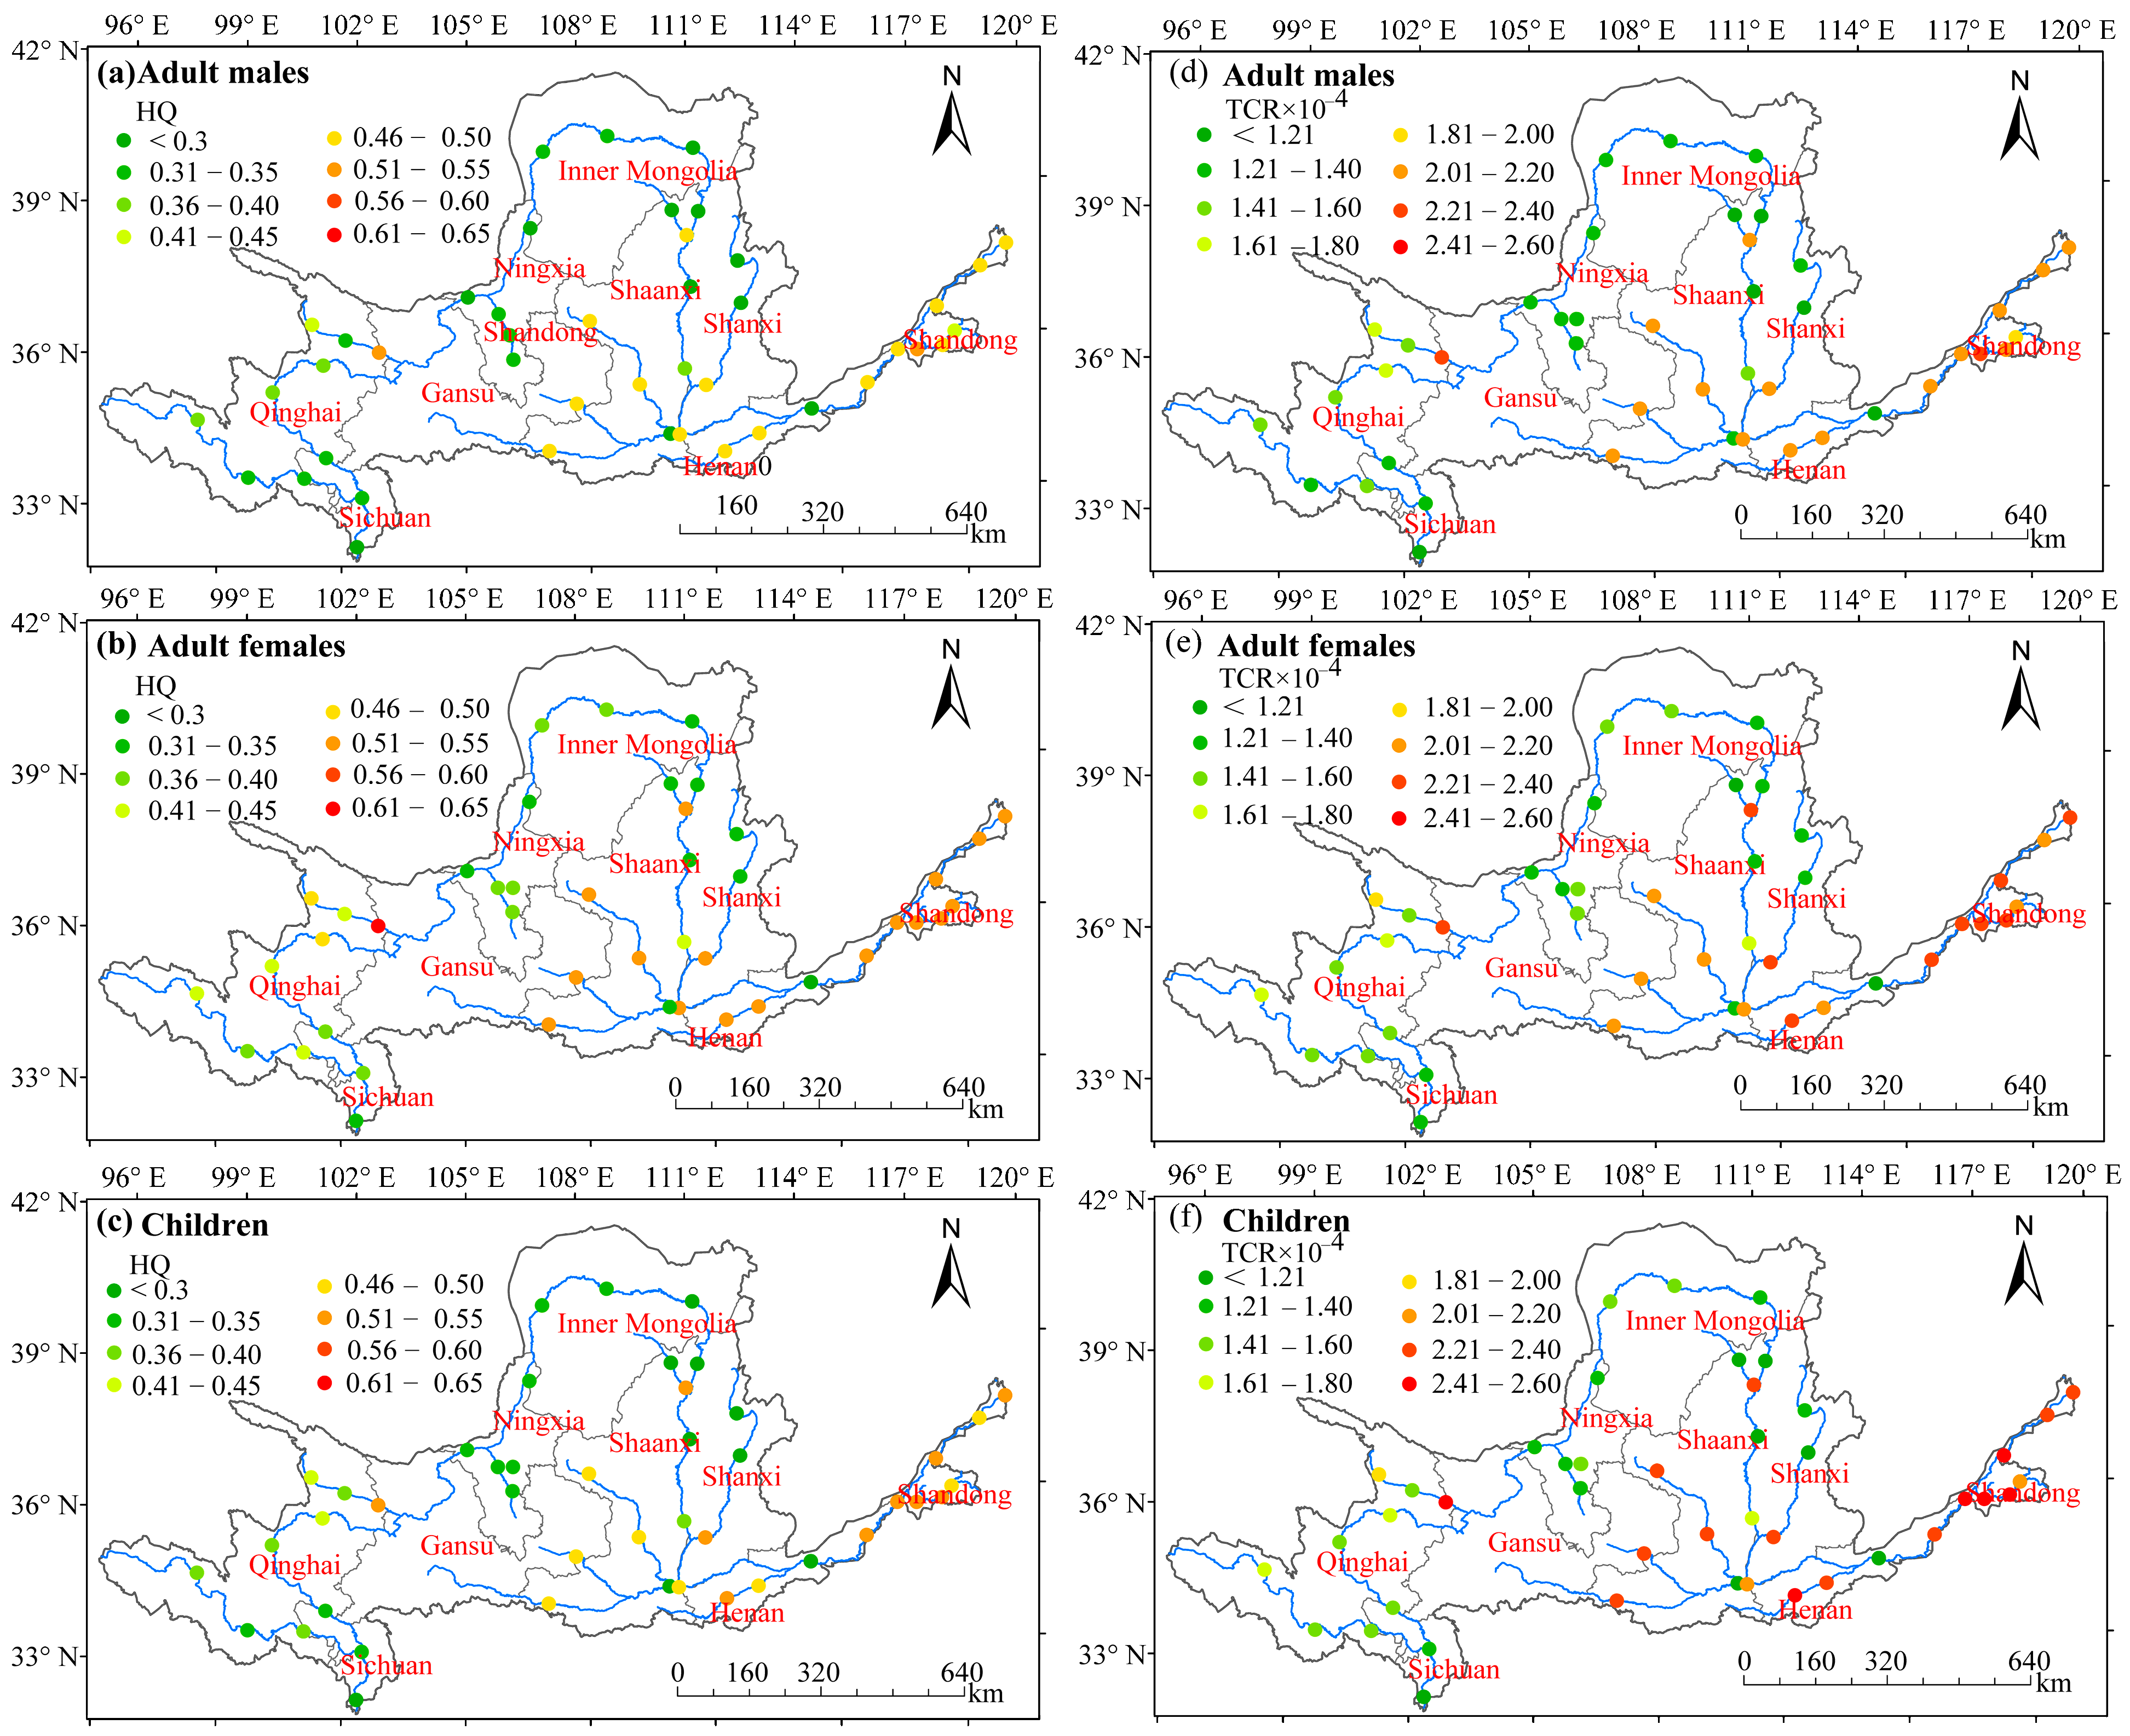
3.4. Assessment of Human Health Risks Associated with HMs

The results of non-carcinogenic and carcinogenic risk assessments for HMs in the sediments are presented in Figure S1 and Figure 7. A descending hierarchy of non-carcinogenic risk was observed across demographic groups: adult males < adult females < children. Quantitative analysis revealed non-carcinogenic hazard indices of 0.40, 0.45, and 1.79 for adult males, females, and children, respectively, with carcinogenic risk values quantified at 3.04 × 10⁷, 4.54 × 10⁷, and 1.16 × 10⁶ for the corresponding groups, suggesting elevated health risks in pediatric populations from both non-carcinogenic and carcinogenic pathways (Figure S1). For all groups (adult men, adult women, and children), the ranking of non-carcinogenic risk indices of different HMs was As > Cr > pb > Ni > Zn > Cu > Cd, while the ranking of carcinogenic risk indices for different HMs was As > Cr > pb > Ni > Cd (Table S4).
In terms of non-carcinogenic risks, the hazard quotient of arsenic (HQAs) was the highest via the hand-to-mouth ingestion pathway, while the hazard quotient of chromium (HQCr) was the highest via the dermal contact pathway, indicating that As and Cr are the primary non-carcinogenic factors (Table S4). The non-carcinogenic risks of HMs to adults are negligible (HI < 1). The non-carcinogenic risk index of As for children is 1.47, which is higher than 1, while the non-carcinogenic risks of the other HMs to children are negligible (HI < 1). This indicates that As poses a non-carcinogenic risk to children. Moreover, the non-carcinogenic risks of HMs to children are higher than those to adults via both exposure pathways, indicating that children are more susceptible to the impacts of HM pollution. The non-carcinogenic risks for different populations are higher via hand-to-mouth ingestion than via dermal contact, suggesting that hand-to-mouth ingestion is the main pathway affecting health risks. In terms of carcinogenic risks, only the carcinogenic risk index of As is significantly higher than 1.00 × 10⁴ (Table S4). The carcinogenic risk indices of As for adult males, adult females, and children are 1.09 × 10⁴, 1.13 × 10⁴, and 1.28 × 10⁴, respectively, indicating that As is the primary carcinogenic element.

4. Discussion

4.1. Spatial Distribution Characteristics of HMs in Sediments

River sediments act as both sources and sinks of water pollution, with a significant accumulation of pollutants in contaminated rivers [57,58,59]. The average concentrations of various HMs in the sediments of the YR are presented in Table S3. The average concentrations of Cr, Ni, Cu, and Pb are lower than the average background values of HMs in Chinese river sediments, while the average concentrations of Zn, As, and Cd exceed the average background values of HMs in Chinese river sediments. Higher concentrations of Cr, Ni, Cu, and Zn in sediments are observed in the sections of Qinghai and Ningxia, which may be attributed to local mineral resource exploitation and economic development. For example, the high rate of HM pollution in the Huangshui River in the economically developed Xining section has been reported [60], and pollution in the Ningxia section may also be due to the discharge of agricultural and industrial wastewater [61]. The higher concentration of Zn in the Inner Mongolia section is a result of the development of the steel manufacturing and rare earth mining industries, which has led to an increase in the concentration of Zn in sediments [62]. In addition, high levels of HMs are observed from Sanmenxia City to Zhengzhou City, which is due to the extensive gold mining and agricultural activities in Lingbao City, located near Sanmenxia City [63].
In this study, PMF was used to identify the sources of HMs, and the results indicated that traffic–industrial sources, agricultural–industrial sources, and industrial sources are potential contributors of HMs in the sediments, with contribution rates of 32.47%, 44.87%, and 22.66%, respectively. Previous studies have shown that the extensive use of fertilizers and pesticides in agricultural production leads to the entry of HM elements from these chemicals into rivers through rainwater runoff, thereby increasing the HM content in water bodies [64,65]. Phosphate rock and potash fertilizers often contain HM impurities, and HM components in pesticides may also enter the soil and water bodies during application [66,67]. Industrial emissions are one of the main sources of HM pollution in river sediments. Wastewater and slag emissions from high-energy-consuming and highly polluting industries, such as chemical, steel, and nonferrous metals, contain a large number of HM elements [51,52]. Transportation is also an important source of HM pollution in river sediments [68]. HM elements in the fuel and coatings used during ship navigation may be discharged into rivers through exhaust gases, wastewater, and solid waste. The results of this study show that the HMs Pb, Cu, and Zn in the sediments originate from a mixed source of traffic and industry; As, Cr, Ni, and Cd originate from a mixed source of agriculture and industry; and Cd originates from agriculture (Figure 6). Therefore, source control should be the primary strategy for HM pollution control in sediments, fundamentally reducing the potential threats of HMs to river ecosystems and human health. In addition, different strategies should be developed for different pollution sources to form a comprehensive and systematic governance situation.
The dynamics of HMs in the YRB are influenced by both natural and anthropogenic factors [12,69]. Hydrological conditions, such as river flow and sediment transport, affect the distribution and deposition of HMs [70]. During the flood season, the resuspension and transport of sediments increase, which may lead to the redistribution of HMs within the basin [71,72]. The texture of sediments and their organic matter content also play important roles in the adsorption and desorption processes of HMs [73]. Fine-grained sediments, which are rich in organic matter, have a stronger adsorption capacity for HMs, and therefore, higher concentrations of HMs are found in these areas [74]. In addition, the chemical properties of water, such as pH and redox potential, affect the speciation and mobility of HMs, thereby influencing their bioavailability and potential environmental impacts [75].

4.2. Analysis of Population Health Risks and Environmental Factors

In recent years, there has been an increasing interest in the assessment of human health risks [76]. In this study, we considered two exposure pathways: hand-to-mouth and dermal contact. Hand-to-mouth ingestion is one of the important pathways for HM exposure from sediments, especially for children and workers who frequently come into contact with sediments [77]. Children, due to their frequent finger-sucking behavior, are prone to ingesting contaminated sediments, and workers in the construction, mining, and agricultural sectors may also ingest HMs through sediment particles on their hands and clothing [78,79]. Dermal contact is also another important pathway for HM exposure from sediments. Direct contact with contaminated sediments may occur during recreational activities, occupational exposure, and daily activities [80,81]. This study’s results show that the non-carcinogenic and carcinogenic risks of hand-to-mouth ingestion are both higher than those of dermal contact, which is consistent with the results of Chen’s study, indicating that the exposure pathway through hand-to-mouth ingestion is much higher than that through dermal contact [1].
The risk assessment of HMs in the sediments of the YRB indicates that the non-carcinogenic risk of HMs in the sediments to adults is negligible, while the non-carcinogenic risk to children is significant. In terms of carcinogenic risk, the main carcinogen is As, which is consistent with the conclusions of previous studies [39]. This is due to the relatively high content of the HM As in the sediments (Table S3) and the large carcinogenic slope factor (SF) of As in the model [82] (Table S1). For example, in the downstream area D2-D9, the carcinogenic risk to children exceeds the carcinogenic risk threshold (TCR > 10−4), indicating that the local child population may be at health risk. The downstream area of the YR is economically developed, with a focus on manufacturing, chemical, and service industries [83]. Despite the dense economic activities, the level of HM pollution is relatively low, which may be related to stricter environmental regulation and pollution control measures [84].
The distribution of HMs in river sediments is controlled by natural factors and human activities, resulting in significant spatial variations. The degree of HM pollution in the YR sediments is “low to moderate”, and it decreases gradually from the upstream to the downstream, which is similar to previous studies that found higher pollution levels in the upper and middle reaches than in the lower reaches [30]. Areas with higher pollution levels have specific environmental and socio-economic characteristics. The concentrations of Cr, Ni, Cu, Zn, and Cd are higher in the upstream, mainly due to the abundant mineral resources in the upper reaches of the YR, especially nonferrous metals and rare earths [85]. For example, the reserves of nonferrous metals and rare earths in Qinghai and Gansu account for a relatively high proportion of the national total. The economic output of the upper reaches is mainly concentrated in the mining and processing of nonferrous metals and rare earths [32]. In the middle reaches, the sampling sites M12, M13, and M14 are located in the Fen River (Shanxi), with an increased HM content in the sediments caused by mining and frequent industrial activities in Shanxi Province [86]. In the downstream areas, the HM content in the sediments is relatively low, but there are still some moderately polluted areas. For example, As and Cd pollution is relatively severe in Luoyang, Henan.
To mitigate the risks associated with HM pollution in the YRB, it is essential to implement a comprehensive set of measures. This includes strengthening industrial pollution control, promoting sustainable agricultural practices, and improving water quality management. Targeted interventions should be prioritized in high-risk areas, such as the installation of water treatment facilities and public awareness campaigns on the risks of HM exposure. Additionally, long-term monitoring programs should be established to track the dynamics of HMs in sediments and evaluate the effectiveness of pollution control measures. Collaboration among environmental scientists, policymakers, and local communities is crucial for developing and implementing sustainable management strategies for HM pollution in the YRB.

5. Conclusions

A systematic analysis was conducted to investigate the spatial distribution characteristics, pollution sources, and health risks associated with HMs in sediments of the YRB. The results show that As, Zn, and Cd are the main elements causing HM pollution in sediments of the YRB, and the pollution levels of the studied HMs in the sediments are mostly “low to moderate”. Source apportionment results demonstrated that HM contamination originated from three principal pathways: traffic–industrial sources (32.47%), agricultural–industrial sources (44.87%), and industrial emissions (22.66%). The clarification of the spatial distribution, main sources, and human health risk assessment of HMs indicates that As and Zn are the priority elements for human health risk control, and agricultural–industrial sources are the priority sources for pollution prevention and control.
Given that the concentrations and sources of HMs in sediments of the YRB may be influenced by a variety of factors, it is recommended that long-term, site-specific monitoring studies be conducted across the entire basin in the future. Through monitoring data accumulated over several years, it will be possible to more accurately assess the dynamic trends in HM concentrations and their sources and to reveal their long-term interactions with human activities and climate change within the basin. In addition, current research has mainly focused on the characteristics of HM concentrations in sediments. In the future, the scope of research can be further expanded to conduct comprehensive studies of HMs in multiple media, such as water, soil, and biota. By analyzing the concentrations, speciation, and transformation relationships of HMs in different media, a comprehensive assessment system for HM pollution at the basin scale can be established.

Supplementary Materials

The following supporting information can be downloaded at: https://www.mdpi.com/article/10.3390/app15095188/s1, Figure S1: Non-carcinogenic risk and total carcinogenic risk probability of HMs in the sediments of the Yellow River. Table S1: Parameter values of health risk assessment model in sediments via Monte Carlo simulation. Table S2: Slope factor and reference dose of HMs. Table S3: HM content in sediments. Table S4: Average non-carcinogenic and carcinogenic risks of HMs in sediments via different exposure pathways.

Author Contributions

Conceptualization, K.F. and G.X.; methodology, K.F. and X.C.; software, G.X. and Y.W.; validation, K.F., J.L., Y.W. and G.X.; formal analysis, K.F., B.W. and G.X.; investigation, K.F. and G.X.; resources, G.X.; data curation, Y.W., Y.C. and B.W.; writing—original draft preparation, K.F. and X.C.; writing—review and editing, K.F. and X.C.; visualization, J.L. and Y.C.; supervision, Y.C.; project administration, G.X.; funding acquisition, G.X. All authors have read and agreed to the published version of the manuscript.

Funding

This research was supported by the National Natural Science Foundation of China (Nos. 42377344, 42277191), and the Shaanxi Provincial Department of Education Project (Grant No. 23JY057).

Institutional Review Board Statement

Not applicable.

Informed Consent Statement

Not applicable.

Data Availability Statement

The raw data supporting the conclusions of this article will be made available by the authors on request.

Conflicts of Interest

The authors declare that they have no known competing financial interests or personal relationships that could have appeared to influence the work reported in this paper.

References

  1. Chen, X.; Fu, X.Y.; Li, G.L.; Zhang, J.M.; Li, H.B.; Xie, F.Z. Source-specific probabilistic health risk assessment of heavy metals in surface water of the Yangtze River Basin. Sci. Total Environ. 2024, 926, 171923. [Google Scholar] [CrossRef] [PubMed]
  2. Sakan, S.; Devic, G.; Relic, D.; Andelkovic, I.; Sakan, N.; Dordevic, D. Risk assessment of trace element contamination in river sediments in Serbia using pollution indices and statistical methods: A pilot study. Environ. Earth Sci. 2015, 73, 6625–6638. [Google Scholar] [CrossRef]
  3. Qu, S.Y.; Wu, W.H.; Nel, W.; Ji, J.F. The behavior of metals/metalloids during natural weathering: A systematic study of the mono-lithological watersheds in the upper Pearl River Basin, China. Sci. Total Environ. 2020, 708, 134572. [Google Scholar] [CrossRef]
  4. Loska, K.; Wiechuła, D. Application of principal component analysis for the estimation of source of heavy metal contamination in surface sediments from the Rybnik Reservoir. Chemosphere 2003, 51, 723–733. [Google Scholar] [CrossRef] [PubMed]
  5. Gao, X.; Chen, C.T.A. Heavy metal pollution status in surface sediments of the coastal Bohai Bay. Water Res. 2012, 46, 1901–1911. [Google Scholar] [CrossRef]
  6. Xiao, H.; Shahab, A.; Li, J.Y.; Xi, B.D.; Sun, X.J.; He, H.J.; Yu, G. Distribution, ecological risk assessment and source identification of heavy metals in surface sediments of Huixian karstwetland, China. Ecotox. Environ. Safe 2019, 185, 109700. [Google Scholar] [CrossRef]
  7. Liu, Q.Q.; Wang, F.F.; Meng, F.P.; Jiang, L.; Li, G.J.; Zhou, R.G. Assessment of metal contamination in estuarine surface sediments from Dongying City, China: Use of a modified ecological risk index. Mar. Pollut. Bull. 2018, 126, 293–303. [Google Scholar] [CrossRef]
  8. Gaur, V.K.; Gupta, S.K.; Pandey, S.D.; Gopal, K.; Misra, V. Distribution of heavy metals in sediment and water of river Gomti. Environ. Monit. Assess. 2005, 102, 419–433. [Google Scholar] [CrossRef]
  9. Deng, M.H.; Yang, X.E.; Dai, X.; Zhang, Q.; Malik, A.; Sadeghpour, A. Heavy metal pollution risk assessments and their transportation in sediment and overlay water for the typical Chinese reservoirs. Ecol. Indic. 2020, 112, 106166. [Google Scholar] [CrossRef]
  10. Gayathri, S.; Krishnan, K.A.; Krishnakumar, A.; Maya, T.V.; Dev, V.V.; Antony, S.; Arun, V. Monitoring of heavy metal contamination in Netravati river basin: Overview of pollution indices and risk assessment. Sustain. Wat. Resour. Manag. 2021, 7, 20. [Google Scholar] [CrossRef]
  11. Chen, Y.Y.; Liu, M.; Zhang, X.L.; Bu, X.J.; Chen, J.B.; Wu, X. Metals in Yellow River estuary sediments during the 2018 water-sediment regulation scheme period. Mar. Pollut. Bull. 2021, 166, 112177. [Google Scholar] [CrossRef] [PubMed]
  12. Li, W.Q.; Qian, H.; Xu, P.P.; Zhang, Q.Y.; Chen, J.; Hou, K.; Ren, W.H.; Qu, W.G.; Chen, Y. Distribution characteristics, source identification and risk assessment of heavy metals in surface sediments of the Yellow River, China. Catena 2022, 216, 106376. [Google Scholar] [CrossRef]
  13. Xiao, R.; Guo, D.; Ali, A.; Mi, S.S.; Liu, T.; Ren, C.Y.; Li, R.H.; Zhang, Z.Q. Accumulation, ecological-health risks assessment, and source apportionment of heavy metals in paddy soils: A case study in Hanzhong, Shaanxi, China. Environ. Pollut. 2019, 248, 349–357. [Google Scholar] [CrossRef] [PubMed]
  14. Wang, Z.; Luo, P.P.; Zha, X.B.; Xu, C.Y.; Kang, S.X.; Zhou, M.M.; Nover, D.; Wang, Y.H. Overview assessment of risk evaluation and treatment technologies for heavy metal pollution of water and soil. J. Clean Prod. 2022, 379, 134043. [Google Scholar] [CrossRef]
  15. Chen, H.Y.; Teng, Y.G.; Lu, S.J.; Wang, Y.Y.; Wang, J.S. Contamination features and health risk of soil heavy metals in China. Sci. Total Environ. 2015, 512–513, 143–153. [Google Scholar] [CrossRef]
  16. Islam, M.S.; Ahmed, M.K.; Raknuzzaman, M.; Habibullah-Al-Mamun, M.; Islam, M.K. Heavy metal pollution in surface water and sediment: A preliminary assessment of an urban river in a developing country. Ecol. Indic. 2015, 48, 282–291. [Google Scholar] [CrossRef]
  17. Cai, L.M.; Wang, Q.S.; Wen, H.H.; Luo, J.; Wang, S. Heavy metals in agricultural soils from a typical township in Guangdong Province, China: Occurrences and spatial distribution. Ecotoxicol. Environ. Saf. 2019, 168, 184–191. [Google Scholar] [CrossRef]
  18. Liu, H.W.; Shao, J.J.; Yu, B.; Liang, Y.; Duo, B.; Fu, J.J.; Yang, R.Q.; Shi, J.B.; Jiang, G.B. Mercury isotopic compositions of mosses, conifer needles, and surface soils: Implications for mercury distribution and sources in Shergyla Mountain, Tibetan Plateau. Ecotoxicol. Environ. Saf. 2019, 172, 225–231. [Google Scholar] [CrossRef]
  19. Tan, J.H.; Duan, J.C.; Ma, Y.L.; He, K.B.; Cheng, Y.; Deng, S.X.; Huang, Y.L.; Si-Tu, S.P. Long-term trends of chemical characteristics and sources of fine particle in Foshan City, Pearl River Delta: 2008–2014. Sci. Total Environ. 2016, 565, 519–528. [Google Scholar] [CrossRef]
  20. Guan, Q.Y.; Wang, F.F.; Xu, C.Q.; Pan, N.H.; Lin, J.K.; Zhao, R.; Yang, Y.Y.; Luo, H.P. Source apportionment of heavy metals in agricultural soil based on PMF: A case study in Hexi Corridor, Northwest China. Chemosphere 2018, 193, 189–197. [Google Scholar] [CrossRef]
  21. Yang, Q.C.; Zhang, L.M.; Wang, H.L.; Martín, J.D. Bioavailability and health risk of toxic heavy metals (As, Hg, Pb and Cd) in urban soils: A Monte Carlo simulation approach. Environ. Res. 2022, 214, 113772. [Google Scholar] [CrossRef] [PubMed]
  22. Bergbusch, N.T.; Saunders, M.D.; Leonard, K.; St-Hilaire, A.; Gibson, R.B.; Jardine, T.D.; Courtenay, S.C. A systematic scoping review of the collaborative governance of environmental and cultural flows. Environ. Rev. 2025, 33, 1–28. [Google Scholar] [CrossRef]
  23. ICPR. Sediment Management in the Rhine Basin: 2020 Program Evaluation Report; International Commission for the Protection of the Rhine: Koblenz, Germany, 2023. [Google Scholar]
  24. EPA-823-R-24-005; Mercury Reduction Plan for the Mississippi River Basin. USEPA: Washington, DC, USA, 2024.
  25. NMCG. Heavy Metal Control in Ganga River: Annual Technical Report 2022-23; National Mission for Clean Ganga: New Delhi, India, 2023.
  26. Miao, C.; Ni, J.; Borthwick, A.G.L. Recent changes of water discharge and sediment load in the Yellow River basin, China. Prog. Phys. Geogr. 2010, 34, 541–561. [Google Scholar] [CrossRef]
  27. Chen, Y.P.; Fu, B.J.; Zhao, Y.; Wang, K.B.; Zhao, M.M.; Ma, J.F.; Wu, J.H.; Xu, C.; Liu, W.G.; Wang, H. Sustainable development in the Yellow River Basin: Issues and strategies. J. Clean. Prod. 2020, 263, 121223. [Google Scholar] [CrossRef]
  28. Zhang, M.; Wang, X.P.; Liu, C.; Lu, J.Y.; Qin, Y.H.; Mo, Y.K.; Xiao, P.J.; Liu, Y. Identification of the heavy metal pollution sources in the rhizosphere soil of farmland irrigated by the Yellow River using PMF analysis combined with multiple analysis methods-using Zhongwei city, Ningxia, as an example. Environ. Sci. Pollut. Res. 2020, 27, 16203–16214. [Google Scholar] [CrossRef]
  29. Zhang, Y.; Zhang, X.; Bi, Z.L.; Yu, Y.; Shi, P.; Ren, L.J.; Shan, Z.X. The impact of land use changes and erosion process on heavy metal distribution in the hilly area of the Loess Plateau, China. Sci. Total Environ. 2020, 718, 137305. [Google Scholar] [CrossRef]
  30. Xie, F.Y.; Yu, M.C.; Yuan, Q.K.; Meng, Y.; Qie, Y.K.; Shang, Z.M.; Luan, F.B.; Zhang, D.L. Spatial distribution, pollution assessment, and source identification of heavy metals in the Yellow River. J. Hazard. Mater. 2022, 436, 129309. [Google Scholar] [CrossRef] [PubMed]
  31. Xie, M.Y.; Ren, Z.P.; Li, Z.B.; Zhang, X.M.; Ma, X.N.; Li, P.; Shen, Z.Z. Evolution of the precipitation–stream runoff relationship in different precipitation scenarios in the Yellow River Basin. Urban CLim. 2023, 51, 101609. [Google Scholar] [CrossRef]
  32. Liu, F.T.; Wang, X.Q.; Dai, S.; Zhou, J.; Liu, D.S.; Hu, Q.H.; Wang, W.; Xie, M.J.; Lu, Y.X.; Tian, M.; et al. Spatial variations, health risk assessment, and source apportionment of soil heavy metals in the middle Yellow River Basin of northern China. J. Geochem. Explor. 2023, 252, 107275. [Google Scholar] [CrossRef]
  33. Wang, Y.H.; Zhang, J.; Yan, Q.X.; Guo, J.Q.; Liu, G.N.; Hu, H.; Zhao, Y.Y. Spatial distribution, sediment–water partitioning, risk assessment and source apportionment of heavy metals in the Golmud River-Dabson Salt Lake ecosystem. Environ. Res. 2025, 268, 120792. [Google Scholar] [CrossRef]
  34. Wu, H.H.; Zhi, Y.; Xiao, Q.C.; Yu, F.; Cao, G.Z.; Xu, X.E.; Zhang, Y.S. Source-oriented health risk of heavy metals in sediments: A case study of an industrial city in China. Ecotox. Environ. Safe. 2025, 292, 117929. [Google Scholar] [CrossRef] [PubMed]
  35. Shi, C.Y.; Liang, M.; Feng, B. Average Background Values of 39 Chemical Elements in Stream Sediments of China. Earth Sci. 2016, 41, 234–251. (In Chinese) [Google Scholar]
  36. USEPA. Risk Assessment Guidance for Superfund Volume I: Human Health Evaluation Manual (Part A); U.S. Environment Protection Agency: Washington, DC, USA, 1989.
  37. USEPA. Risk Assessment Guidance for Superfund (RAGS); U.S. Environment Protection Agency: Washington, DC, USA, 2009.
  38. Yang, S.Y.; Liu, X.M.; Xu, J.M. New Perspectives about Health Risk Assessment of Soil Heavy Metal Polltion-Origin and Prospects of Probabilistic Risk Analysis. Acta. Pedologica Sinica. 2022, 59, 28–37. (In Chinese) [Google Scholar]
  39. Huang, J.L.; Wu, Y.Y.; Sun, J.X.; Li, X.; Geng, X.L.; Zhao, M.L.; Sun, T.; Fan, Z.Q. Health risk assessment of heavy metal(loid)s in park soils of the largest megacity in China byusing Monte Carlo simulation coupled with Positive matrix factorization model. J. Hazard. Mater. 2021, 415, 125629. [Google Scholar] [CrossRef]
  40. Xiong, H.B.; Chen, S.J. Reducing uncertainty in ecological risk assessment for heavy metal contamination based on Monte Carlo-Hakanson model. J. Agro-Environ. Sci. 2020, 39, 1706–1712. (In Chinese) [Google Scholar]
  41. Li, Y.Z.; Chen, H.Y.; Teng, Y.G. Source apportionment and source-oriented risk assessment of heavy metals in the sediments of anurban river-lake system. Sci. Total Environ. 2020, 737, 140310. [Google Scholar] [CrossRef] [PubMed]
  42. Zhu, C.B.; Hu, J.; Long, Y.C.; Zhou, S.Q. Spatial distribution fractionation and human health risk assessment of heavy metals in surfacesediments from Caohai Lake, Guizhou. Acta Sci. Circums. 2021, 41, 2212–2221. (In Chinese) [Google Scholar]
  43. Li, J.; Li, X.; Li, K.M.; Jiao, L.; Tai, X.S.; Zang, F.; Cao, S.Z. Characteristics and Identification Priority Source of Heavy Metals Pollution in Farmland Soils in the Yellow River Basin. Environ. Sci. 2024, 45, 1724–1738. [Google Scholar]
  44. Paatero, P.; Tapper, U. Positive matrix factorization: A non-negative factor model with optimal utilization of error estimates of data values. Environmetrics 1994, 5, 111–126. [Google Scholar] [CrossRef]
  45. Zhang, M.M.; He, P.; Qiao, G.; Huang, J.T.; Yuan, X.T.; Li, Q. Heavy metal contamination assessment of surface sediments of the Subei Shoal, China: Spatial distribution, source apportionment and ecological risk. Chemosphere 2019, 223, 211–222. [Google Scholar] [CrossRef]
  46. Lv, J.S.; Liu, Y.; Zhang, Z.L.; Dai, J.R. Factorial kriging and stepwise regression approach to identify environmental factors influencing spatial multi-scale variability of heavy metals in soils. J. Hazard Mater. 2013, 261, 387–397. [Google Scholar] [CrossRef] [PubMed]
  47. Bilal, I.; Abdugheni, A.; Shi, Q.D.; Liu, S.H.; Nijat, K.; Li, H. Pollution and source identification of heavy metals in surrounding soils of eastern Junggar coalfield based on PMF model. Trans. Chin. Soc. Agric. Eng. 2019, 35, 185–192. [Google Scholar]
  48. Zhang, F.G.; Peng, M.; Wang, H.Y. Ecological risk assessment of heavy metals at township scale in the high background of heavy metals, southwestern, China. Environ. Sci. 2020, 41, 4197–4209. [Google Scholar]
  49. Chen, X.D.; Lu, X.W.; Yang, G. Sources identification of heavy metals in urban topsoil from inside the Xi’an Second Ringroad, NW China using multivariate statistical methods. Catena 2012, 98, 73–78. [Google Scholar] [CrossRef]
  50. Wang, Y.Z.; Duan, X.J.; Wang, L. Spatial distribution and source analysis of heavy metals in soils influenced by industrial enterprise distribution: Case study in Jiangsu Province. Sci. Total Environ. 2020, 710, 134953. [Google Scholar] [CrossRef]
  51. Ismail, U.M.; Vohra, M.S.; Onaizi, S.A. Adsorptive removal of heavy metals from aqueous solutions: Progress of adsorbents development and their effectiveness. Environ. Res. 2024, 251, 118562. [Google Scholar] [CrossRef]
  52. Kumar, V.; Parihar, R.D.; Sharma, A.; Bakshi, P.; Singh Sidhu, G.P.; Bali, A.S.; Karaouzas, I.; Bhardwaj, R.; Thukral, A.K.; Gyasi-Agyei, Y.; et al. Global evaluation of heavy metal content in surface water bodies: A metaanalysis using heavy metal pollution indices and multivariate statistical analyses. Chemosphere 2019, 236, 124364. [Google Scholar] [CrossRef]
  53. Duan, X.C.; Yu, H.H.; Ye, T.R.; Huang, Y.; Li, J.; Yuan, G.L.; Albanese, S. Geostatistical mapping and quantitative source apportionment of potentially toxic elements in top- and sub-soils: A case of suburban area in Beijing, China. Ecol. Indic. 2020, 112, 106085. [Google Scholar] [CrossRef]
  54. Zhao, H.D.; Lan, X.P.; Yu, F.X.; Li, Z.; Yang, J.Y.; Du, L.Y. Comprehensive assessment of heavy metals in soil-crop system based on PMF and evolutionary game theory. Sci. Total Environ. 2022, 849, 157549. [Google Scholar] [CrossRef]
  55. Fan, P.; Lu, X.W.; Yu, B.; Fan, X.Y.; Wang, L.Q.; Lei, K.; Yang, Y.F.; Zuo, L.; Rinklebe, J. Spatial distribution, risk estimation and source apportionment of potentially toxic metal(loid)s in resuspended megacity street dust. Ecol. Indic. 2022, 160, 107073. [Google Scholar] [CrossRef]
  56. Zhang, Y.Q.; Wu, D.; Wang, C.X.; Fu, X.; Wu, G. Impact of coal power generation on the characteristics and risk of heavy metal pollution in nearby soil. Ecosyst. Health Sustain. 2020, 6, 1787092. [Google Scholar] [CrossRef]
  57. Yang, H.J.; Bong, K.M.; Kang, T.W.; Hwang, S.H.; Na, E.H. Assessing heavy metals in surface sediments of the Seomjin River Basin, South Korea, by statistical and geochemical analysis. Chemosphere 2021, 284, 131400. [Google Scholar] [CrossRef] [PubMed]
  58. Zhang, C.; Shan, B.Q.; Zhao, Y.; Song, Z.X.; Tang, W.Z. Spatial distribution, fractionation, toxicity and risk assessment of surface sediments from the Baiyangdian Lake in northern China. Ecol. Indic. 2018, 90, 633–642. [Google Scholar] [CrossRef]
  59. Zhang, Y.; Xu, S.R.; Lu, S.Y. Pollution characteristics and assessment of heavy metals in the surface sediment of xinfengjiang reservoir. Environ. Eng. 2018, 36, 134–141. [Google Scholar]
  60. Zeng, F.M. Assessment of Heavy Metal Pollution in Xining Section of the Huangshui River. J. Salt Lake Res. 2017, 25, 8–12. [Google Scholar]
  61. Chen, B.; Fan, D.J.; Li, W.R.; Wang, L.; Zhang, X.L.; Liu, M.; Guo, Z.G. Enrichment of heavy metals in the inner shelf mud of the East China Sea and its indication to human activity. Cont. Shelf Res. 2014, 90, 163–169. [Google Scholar] [CrossRef]
  62. Zuo, H.; Ma, X.L.; Yang, K.; Chen, Y.Z.; Chen, J.H.; Guo, Y.; Zhao, J.Y.; Wang, R.M.; Fang, F.; Liu, Y. Distribution and Risk Assessment of Metals in Surface Water and Sediment in the Upper Reaches of the Yellow River, China. Soil. Sediment. Contam. 2016, 25, 917–940. [Google Scholar] [CrossRef]
  63. Cheng, Q.L.; Wang, R.L.; Huang, W.H.; Wang, W.L.; Li, X.D. Assessment of heavy metal contamination in the sediments from the Yellow River Wetland National Nature Reserve (the Sanmenxia section), China. Environ. Sci. Pollut. Res. Int. 2015, 22, 8586–8593. [Google Scholar] [CrossRef]
  64. Belcik, M.; Grzegorzek, M.; Canales, F.A.; Struk-Sokolowska, J.; Kaz, B. Examination of interactions between heavy metals and benzotriazoles in rainwater runoff and snowmelt in an urban catchment in Poland. Water Resour. Ind. 2024, 31, 100236. [Google Scholar] [CrossRef]
  65. Yuan, D.H.; Liu, Y.Q.; Guo, X.J.; Liu, J.Y. Characteristic contaminants in snowpack and snowmelt surface runoff from different functional areas in Beijing, China. Environ. Sci. Pollut. Res. 2018, 25, 36256–36266. [Google Scholar] [CrossRef]
  66. Alam, M.; Khan, A.; Zaman, R.; Khan, S.; Khan, M.A.; Ahmad, I.; Jalal, A.; Kim, K.I. Vermi- remediation impacts on growth and metals bioaccumulation in tomato irrigated with wastewater. Chemosphere 2024, 362, 142848. [Google Scholar] [CrossRef]
  67. Uwizeyimana, H.; Wang, M.I.; Chen, W.P.; Khan, K. The eco-toxic effects of pesticide and heavy metal mixtures towards earthworms in soil. Environ. Toxicol. Pharmacol. 2017, 55, 20–29. [Google Scholar] [CrossRef] [PubMed]
  68. Wang, S.; Cai, L.M.; Wen, H.H.; Luo, J.; Wang, Q.S.; Liu, X. Spatial distribution and source apportionment of heavy metals in soil from a typical county-level city of Guangdong Province, China. Sci. Total Environ. 2019, 655, 92–101. [Google Scholar] [CrossRef]
  69. Li, J.; Wang, W.T.; Li, X.L.; Liu, S.; Xu, X.M.; Yinglan, A.; Ren, S.L. Heavy metals in the continuous river−estuary−sea system of the Yellow River Delta, China: Spatial patterns, potential sources, and influencing factors. Mar. Pollut. Bull. 2024, 209, 117247. [Google Scholar] [CrossRef] [PubMed]
  70. Li, R.; Tang, X.Q.; Guo, W.J.; Lin, L.; Zhao, L.Y.; Hu, Y.; Liu, M. Spatiotemporal distribution dynamics of heavy metals in water, sediment, and zoobenthos in mainstream sections of the middle and lower Changjiang River. Sci. Total Environ. 2020, 714, 136779. [Google Scholar] [CrossRef] [PubMed]
  71. Xu, G.C.; Zhi, Z.X.; Li, Z.B.; Zhuang, J.; Guo, M.J.; Fang, K.; Yi, J.; Ren, Z.P.; Gao, H.D.; Jia, L. Attribution of sediment changes and inffuencing factors of microbial communities in sediment in the Wuding River basin of the Yellow River. Catena 2025, 249, 108626. [Google Scholar] [CrossRef]
  72. Liu, M.; Fan, D.J.; Bi, N.S.; Sun, X.S.; Tian, Y. Impact of water-sediment regulation on the concentration and transport of dissolved heavy metals in the middle and lower reaches of the Yellow River. Sci. Total Environ. 2019, 658, 268–279. [Google Scholar] [CrossRef]
  73. Li, Z.; Li, X.Z.; Wang, S.H.; Che, F.F.; Zhang, Y.; Yang, P.J.; Zhang, J.B.; Liu, Y.X.; Guo, H.C.; Fu, Z.H. Adsorption and desorption of heavy metals at water sediment interface based on bayesian model. J. Environ. Manag. 2023, 329, 117035. [Google Scholar] [CrossRef]
  74. Tang, W.Z.; Sun, L.; Zhu, Y.F.; Ng, J.C.; Huang, J.Y.; Xu, Z.B.; Zhang, H. Difference analysis of organic matter-mediated heavy metal pollution in the sediments of urban water bodies. Sci. Total Environ. 2025, 968, 178747. [Google Scholar] [CrossRef]
  75. Miranda, L.S.; Ayoko, G.A.; Egodawatta, P.; Goonetilleke, A. Adsorption-desorption behavior of heavy metals in aquatic environments: Influence of sediment, water and metal ionic properties. J. Hazard. Mater. 2022, 421, 126743. [Google Scholar] [CrossRef]
  76. Emami, H.; Memarzadeh, M.; Asl, F.N. Carcinogenic and non-carcinogenic health risks of heavy metals in windborne sediments from a residential area (Case study: Tabas, Iran). Aeolian Res. 2024, 70–71, 100938. [Google Scholar] [CrossRef]
  77. Al-osman, M.; Yang, F.; Massey, I.Y. Exposure routes and health effects of heavy metals on children. Biometals 2019, 32, 563–573. [Google Scholar] [CrossRef]
  78. Özkoç, H.B.; Ariman, S. Contamination and risk assessment of heavy metals in coastal sediments from the Mid-Black Sea, Turkey. Stoch. Environ. Res. Risk Assess. 2023, 37, 375–394. [Google Scholar] [CrossRef]
  79. Tsou, M.C.; Özkaynak, H.; Beamer, P.; Dang, W.; Hsi, H.C.; Jiang, C.B.; Chien, L.C. Mouthing activity data for children age 3 to <6 years old and fraction of hand area mouthed for children age < 6 years old in Taiwan. J. Expo. Sci. Environ. Epidemiol. 2018, 28, 182–192. [Google Scholar] [PubMed]
  80. Filipsson, M.; Lindström, M.; Peltola, P.; Öberg, T. Exposure to contaminated sediments during recreational activities at a public bathing place. J. Hazard. Mater. 2009, 171, 200–207. [Google Scholar] [CrossRef]
  81. Shetty, B.R.; Pai, B.J.; Salmataj, S.A.; Naik, N. Assessment of Carcinogenic and non-carcinogenic risk indices of heavy metal exposure in different age groups using Monte Carlo Simulation Approach. Sci. Rep. 2024, 14, 30319. [Google Scholar] [CrossRef]
  82. Li, Z.Y.; Ma, Z.W.; Van-der-Kuijp, T.J.; Yuan, Z.W.; Huang, L. A review of soil heavy metal pollution from mines in China: Pollution and health risk assessment. Sci. Total Environ. 2014, 468, 843–853. [Google Scholar] [CrossRef]
  83. Ren, X.C.; Wang, S.; Wang, K.H. The industrial technological spillover effect and differentiation characteristics of industrial chains in the ecological efficiency of the yellow river basin. J. Clean Prod. 2024, 477, 143856. [Google Scholar] [CrossRef]
  84. Yan, X.H.; Chin, L.; Samad, A.R.A.; Senan, M.K.A.M.; Ding, Y.M. Environmental quality, residents’ health, and economic growth in the Yellow River Basin. Environ. Dev. Sustain. 2025, 27, 4445–4468. [Google Scholar] [CrossRef]
  85. Li, B.F.; Feng, Q.; Wang, X.; Li, Z.J.; Wang, F.; Zhao, C.G.; Yu, T.F.; Chen, W.Y. Formation of the upper reaches of the Yellow River: Provenance evidence from the strata of the Yellow River sedimentary basin. Glob. Planet. Chang. 2023, 229, 104224. [Google Scholar] [CrossRef]
  86. Guo, Z.Z.; Zhang, Y.; Li, W.H.; Hong, J.P. Concentration, Sources and Ecological Risk of Nutrients and Heavy Metals in Surface Sediments from Fenhe River. J. Soil Water Conserv. 2013, 27, 95–99. (In Chinese) [Google Scholar]
Figure 1. Location of the study area and distribution of sampling sites.
Applsci 15 05188 g001
Figure 2. Characteristics of HM concentrations in YRB sediments. (a) Cr. (b) Ni. (c) Cu. (d) Zn. (e) As. (f) Cd. (g) Pb.
Applsci 15 05188 g002
Figure 3. Spatial characteristics of the contamination factor. (a) Cr. (b) Ni. (c) Cu. (d) Zn. (e) As. (f) Cd. (g) Pb.
Applsci 15 05188 g003
Figure 4. Statistical results of single-factor evaluation of HMs in sediments.
Applsci 15 05188 g004
Figure 5. Distribution characteristics of the PLI.
Applsci 15 05188 g005
Figure 6. Source apportionment of HMs using the PMF model. (a) PMF Source apportionment model. (b) Contribution rates of various HMs. (c) Contribution rates of various factors.
Applsci 15 05188 g006
Figure 7. Assessment of non-carcinogenic and carcinogenic risks posed by HMs in sediments. (a) Non-carcinogenic Risk in Adult Males. (b) Non-carcinogenic Risk in Adult Females. (c) Non-carcinogenic Risk in Children. (d) Carcinogenic Risk in Adult Males. (e) Carcinogenic Risk in Adult Females. (f) Carcinogenic Risk in Children.
Applsci 15 05188 g007
Disclaimer/Publisher’s Note: The statements, opinions and data contained in all publications are solely those of the individual author(s) and contributor(s) and not of MDPI and/or the editor(s). MDPI and/or the editor(s) disclaim responsibility for any injury to people or property resulting from any ideas, methods, instructions or products referred to in the content.

