Article

Updating and 24 H Testing of State Key Laboratory of Clean Energy Utilization’s Thermochemical Iodine–Sulfur Cycle Water-Splitting Hydrogen Production System

1
State Key Laboratory of Clean Energy Utilization, Zhejiang University, Hangzhou 310027, China
2
Qingshanhu Energy Research Center, Zhejiang University, Hangzhou 311300, China
*
Author to whom correspondence should be addressed.
Appl. Sci. 2025, 15(9), 5183; https://doi.org/10.3390/app15095183
Submission received: 15 April 2025 / Revised: 30 April 2025 / Accepted: 1 May 2025 / Published: 7 May 2025
(This article belongs to the Special Issue Advancements and Innovations in Hydrogen Energy)

Abstract

:
This paper reports the latest update to and a 24 h continuous operation test of the CEU’s thermochemical iodine–sulfur cycle water-splitting system with a maximum H2 hydrogen production capacity of 1500 L/h. To address challenges such as high energy consumption and severe corrosion in traditional processes, the system was updated and optimized by introducing a small-cycle design, simulated using Aspen Plus software, achieving a thermal efficiency of 53%. Specifically, the key equipment improvements included a three-stage H2SO4 decomposition reactor and an HI decomposition reactor with heat recovery, resolving issues of severe corrosion when H2SO4 boils and reducing heat loss. During 24 h continuous operation in January 2025, the system achieved a peak hydrogen production rate of 1536 L/h and a long-term stable rate of approximately 300 L/h, with hydrogen purity reaching up to 98.75%. This study validates the potential for the scaling up of iodine–sulfur cycle hydrogen production technology, providing engineering insights for efficient and clean hydrogen energy production.

1. Introduction

As the global economy and society continue to develop, energy consumption is steadily increasing. The Energy Institute (EI), in its Statistical Review of World Energy [1], reported that 2023 was marked by global energy shortages, with primary energy consumption rising by 2% compared to 2022. Renewable energy accounted for over 18% of total consumption, while the share of fossil fuels declined by 0.4%. Although the global energy transition remains gradual, different regions are adopting diverse approaches to energy transformation.
Hydrogen, recognized as a clean and efficient energy carrier, has garnered significant attention worldwide. In October 2024, the International Energy Agency (IEA) released the 2024 Global Hydrogen Review [2], which indicated that global hydrogen demand reached 97 million tons in 2023, reflecting a 2.5% year-on-year increase. Despite planned projects aiming to produce up to 49 million tons of green hydrogen annually by 2030, supply is projected to fall short of demand. Consequently, the development of efficient, clean, and scaled-up hydrogen production technologies has become a research priority.
Among various hydrogen production methods, the thermochemical iodine–sulfur (I-S) cycle, initially proposed by General Atomics (GA) [3,4,5], is regarded as one of the most promising technologies due to its industrial scalability and compatibility with diverse energy sources such as solar, nuclear, and industrial waste heat [6,7]. The I-S cycle comprises three key reactions:
The   Bunsen   reaction : 2 H 2 O + I 2 + SO 2 290 390   K H 2 SO 4 + 2 HI
The   HI   decomposition   reaction :   2 HI 570 770   K H 2 + I 2
The   H 2 SO 4   decomposition   reaction :   H 2 SO 4 970 1270   K H 2 O + SO 2 + 1 / 2 O 2
In recent years, significant progress has been made in fundamental research on the three aforementioned reactions. However, challenges remain, including severe corrosion conditions, the high temperature required for sulfuric acid decomposition, and the continuous transport and circulation of gases and liquids. While researchers from various countries have made efforts to improve system construction and continuous operation, they continue to encounter difficulties in the practical application of the technology.
As the originator of the iodine–sulfur cycle process, General Atomics (GA) designed and built the world’s first thermochemical iodine–sulfur cycle hydrogen production system. The theoretical hydrogen production rate of the system was 4 L/min, with a thermal efficiency of 47% [8]. However, due to various issues, the actual hydrogen production rate during intermittent operation was only 20 mL/min. Subsequently, with support from the U.S. Department of Energy’s Nuclear Energy Office and in collaboration with Sandia National Laboratories (SNL) and the French Commissariat à l’Énergie Atomique (CEA), GA undertook an International Nuclear Energy Research Initiative (INERI) [
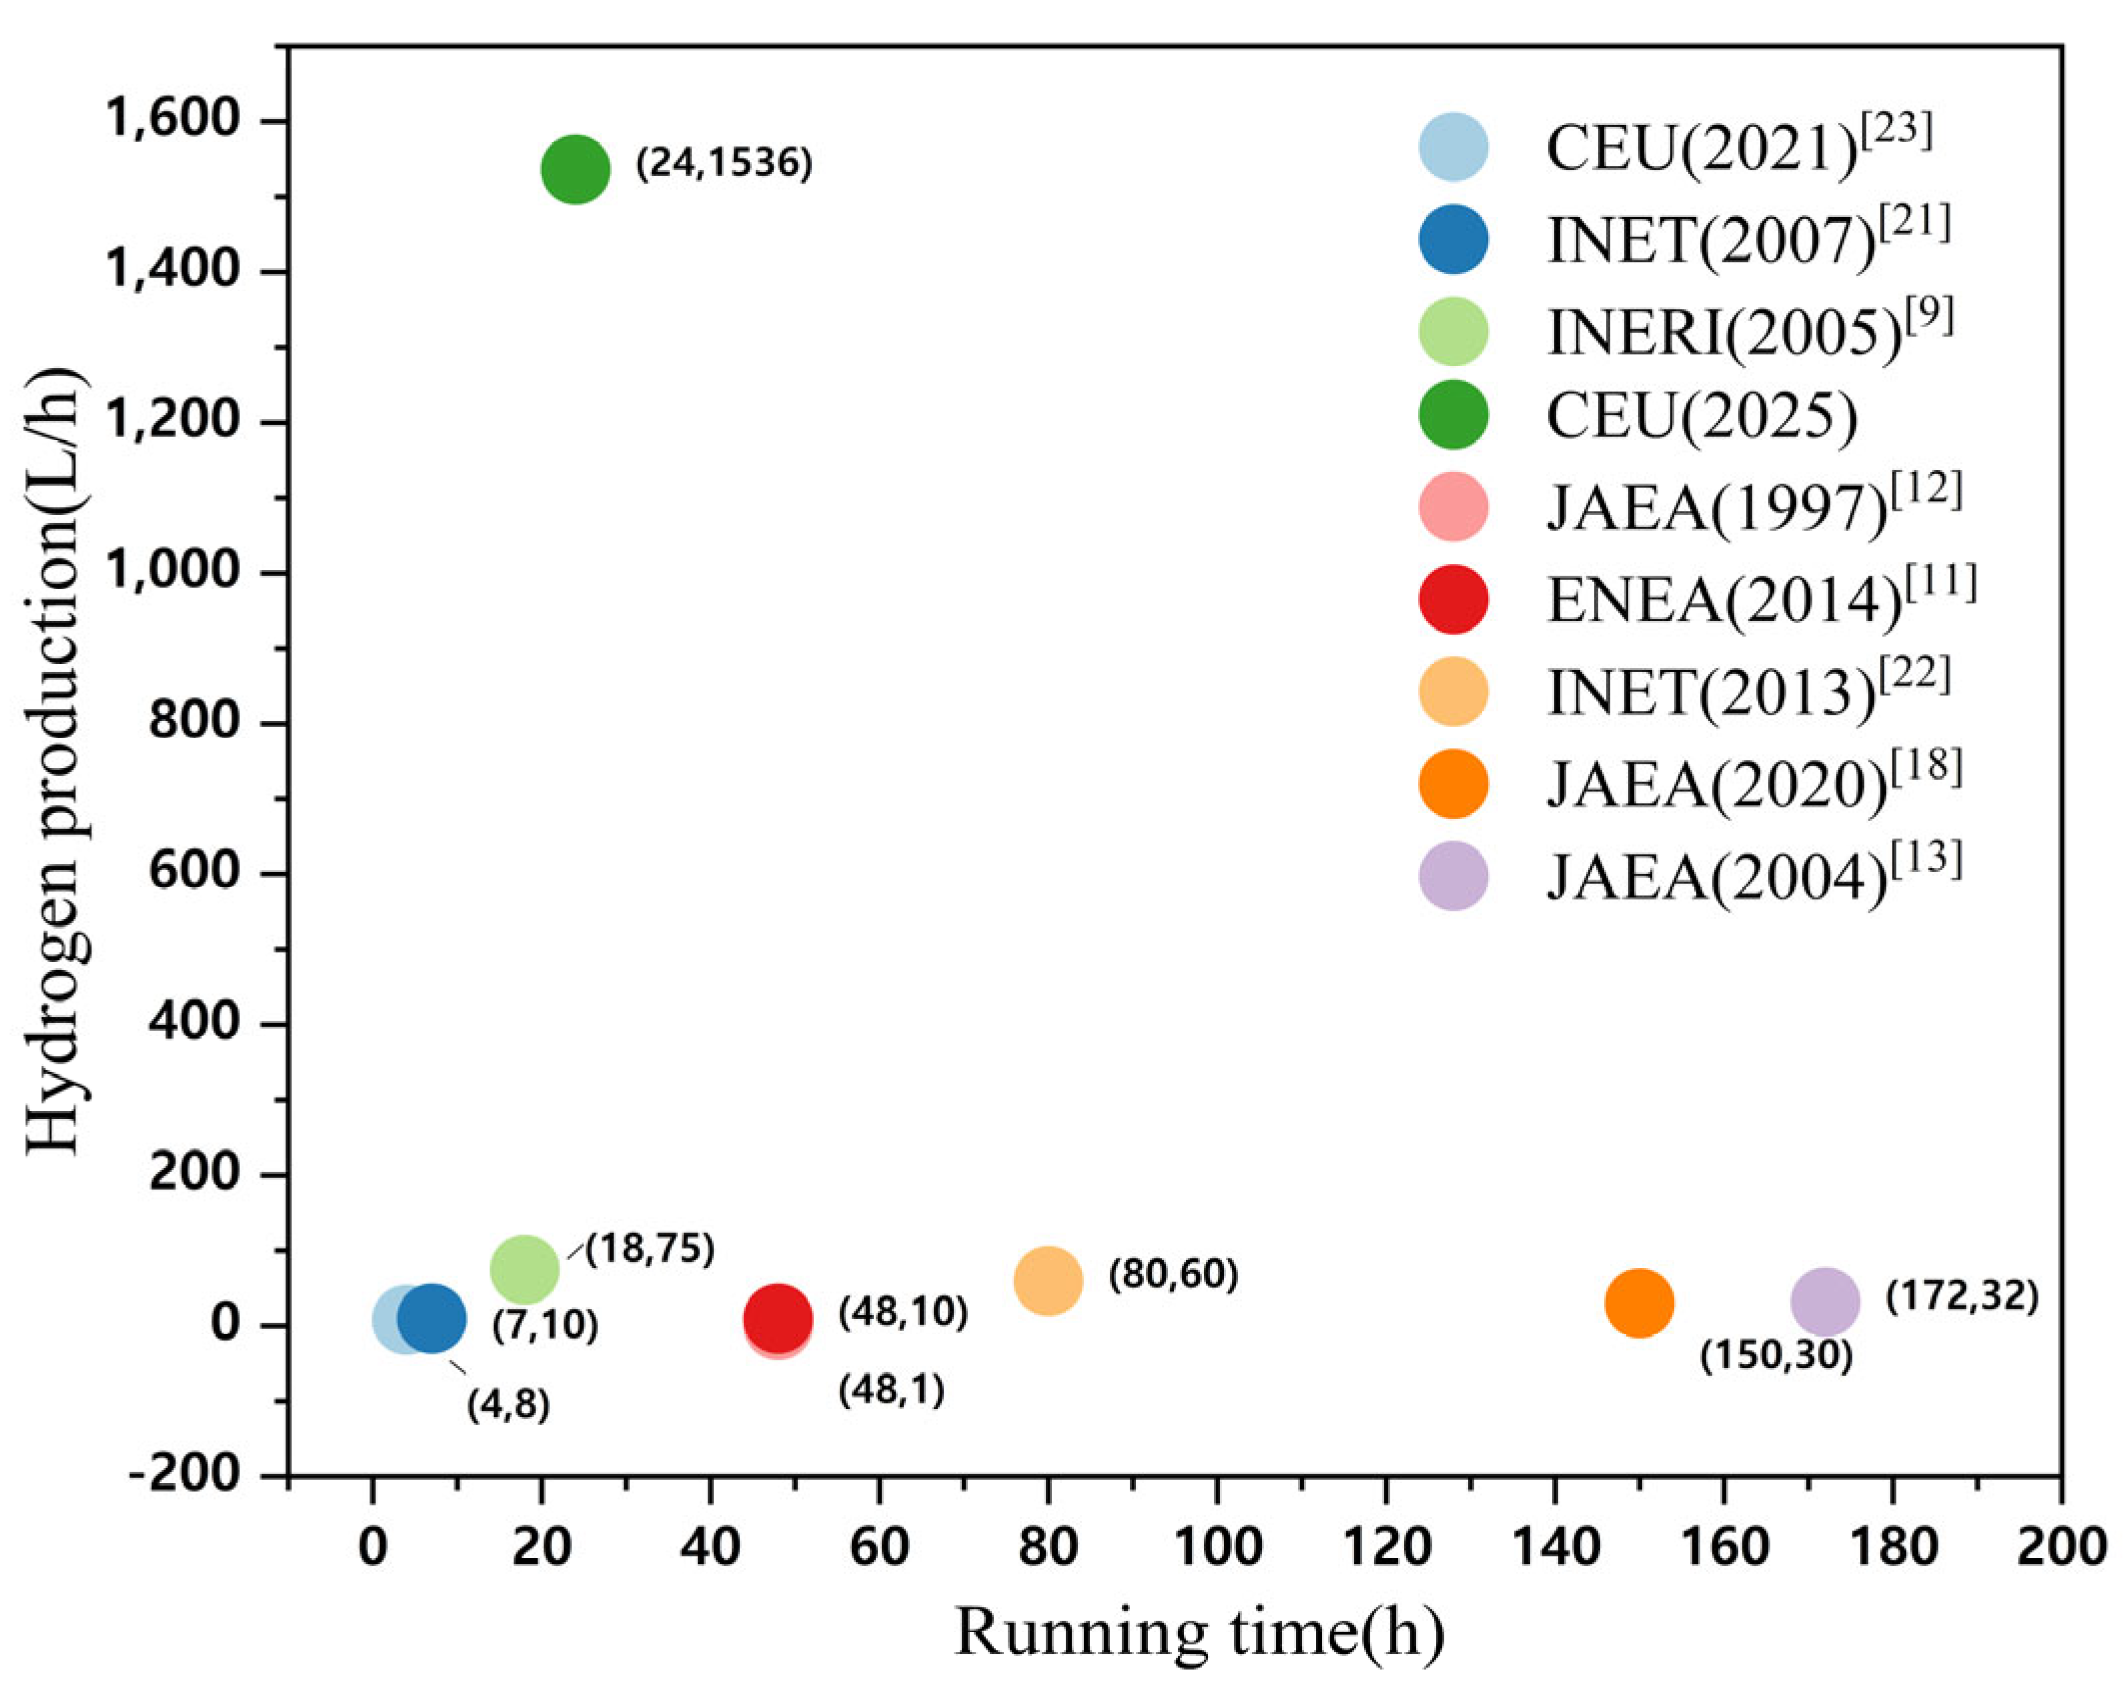
9] to explore the feasibility of using the iodine–sulfur cycle for hydrogen production with nuclear energy. The system, constructed from glass-lined steel and tantalum–tungsten alloy, ultimately achieved continuous operation for 18 h, with hydrogen production rates ranging from 10 to 75 L/h.
The Italian National Agency for New Technologies, Energy, and Sustainable Economic Development (ENEA) designed and successfully operated a 10 L/h iodine–sulfur hydrogen production system constructed from glass and polytetrafluoroethylene (PTFE), achieving 48 h of operation [10,11].
The Japan Atomic Energy Agency (JAEA) successfully operated a 1 L/h hydrogen production system made of glass for 48 h in 1997, confirming the feasibility of the iodine–sulfur hydrogen production method [12]. In 2004, JAEA implemented new measurement techniques and operational control technologies to develop and operate a 30 L/h laboratory-scale system [13]. By 2014, JAEA had constructed a pilot-scale platform using industrial materials, achieving a hydrogen production rate of 100 L/h with continuous operation for 8 h [14]. Later, JAEA addressed pump failure issues by developing an axial seal technology, which extended the pilot system’s operation time to 31 h and increased the hydrogen production rate to 20 L/h [15]. Additionally, the agency introduced an improved glass-lined protective casing [16] and proposed a method for estimating the construction strength of large-scale silicon carbide (SiC) based on effective volume theory [17]. These enhancements, along with other improvements, enabled the pilot platform to achieve 150 h of continuous operation, with a hydrogen production rate ranging from 10 to 30 L/h [18].
In 2009, the Institute of Nuclear Energy Technology (INET) at Tsinghua University constructed a glass-based hydrogen production system with a hydrogen production rate of 10 L/h [19,20]. This system was the first to employ electrodialysis (EED) technology, achieving continuous hydrogen production at 10 L/h for 7 h. Subsequently, through system optimization, the laboratory-scale system was scaled up, ultimately achieving continuous hydrogen production at 60 L/h for 60 h [21,22].
In 2015, the State Key Laboratory of Clean Energy Utilization (CEU) of Zhejiang University constructed a laboratory-scale hydrogen production system with a hydrogen production rate of 50 L/h. The system was validated through trial runs to ensure the normal operation of each module. In 2019, CEU developed a pilot-scale system capable of producing maximum hydrogen at 5 m3/h using industrial materials. After a segmented operation to verify the normal functionality of each module, the system achieved continuous operation for 4 h in 2021, with a hydrogen production rate of 80 L/h [23].
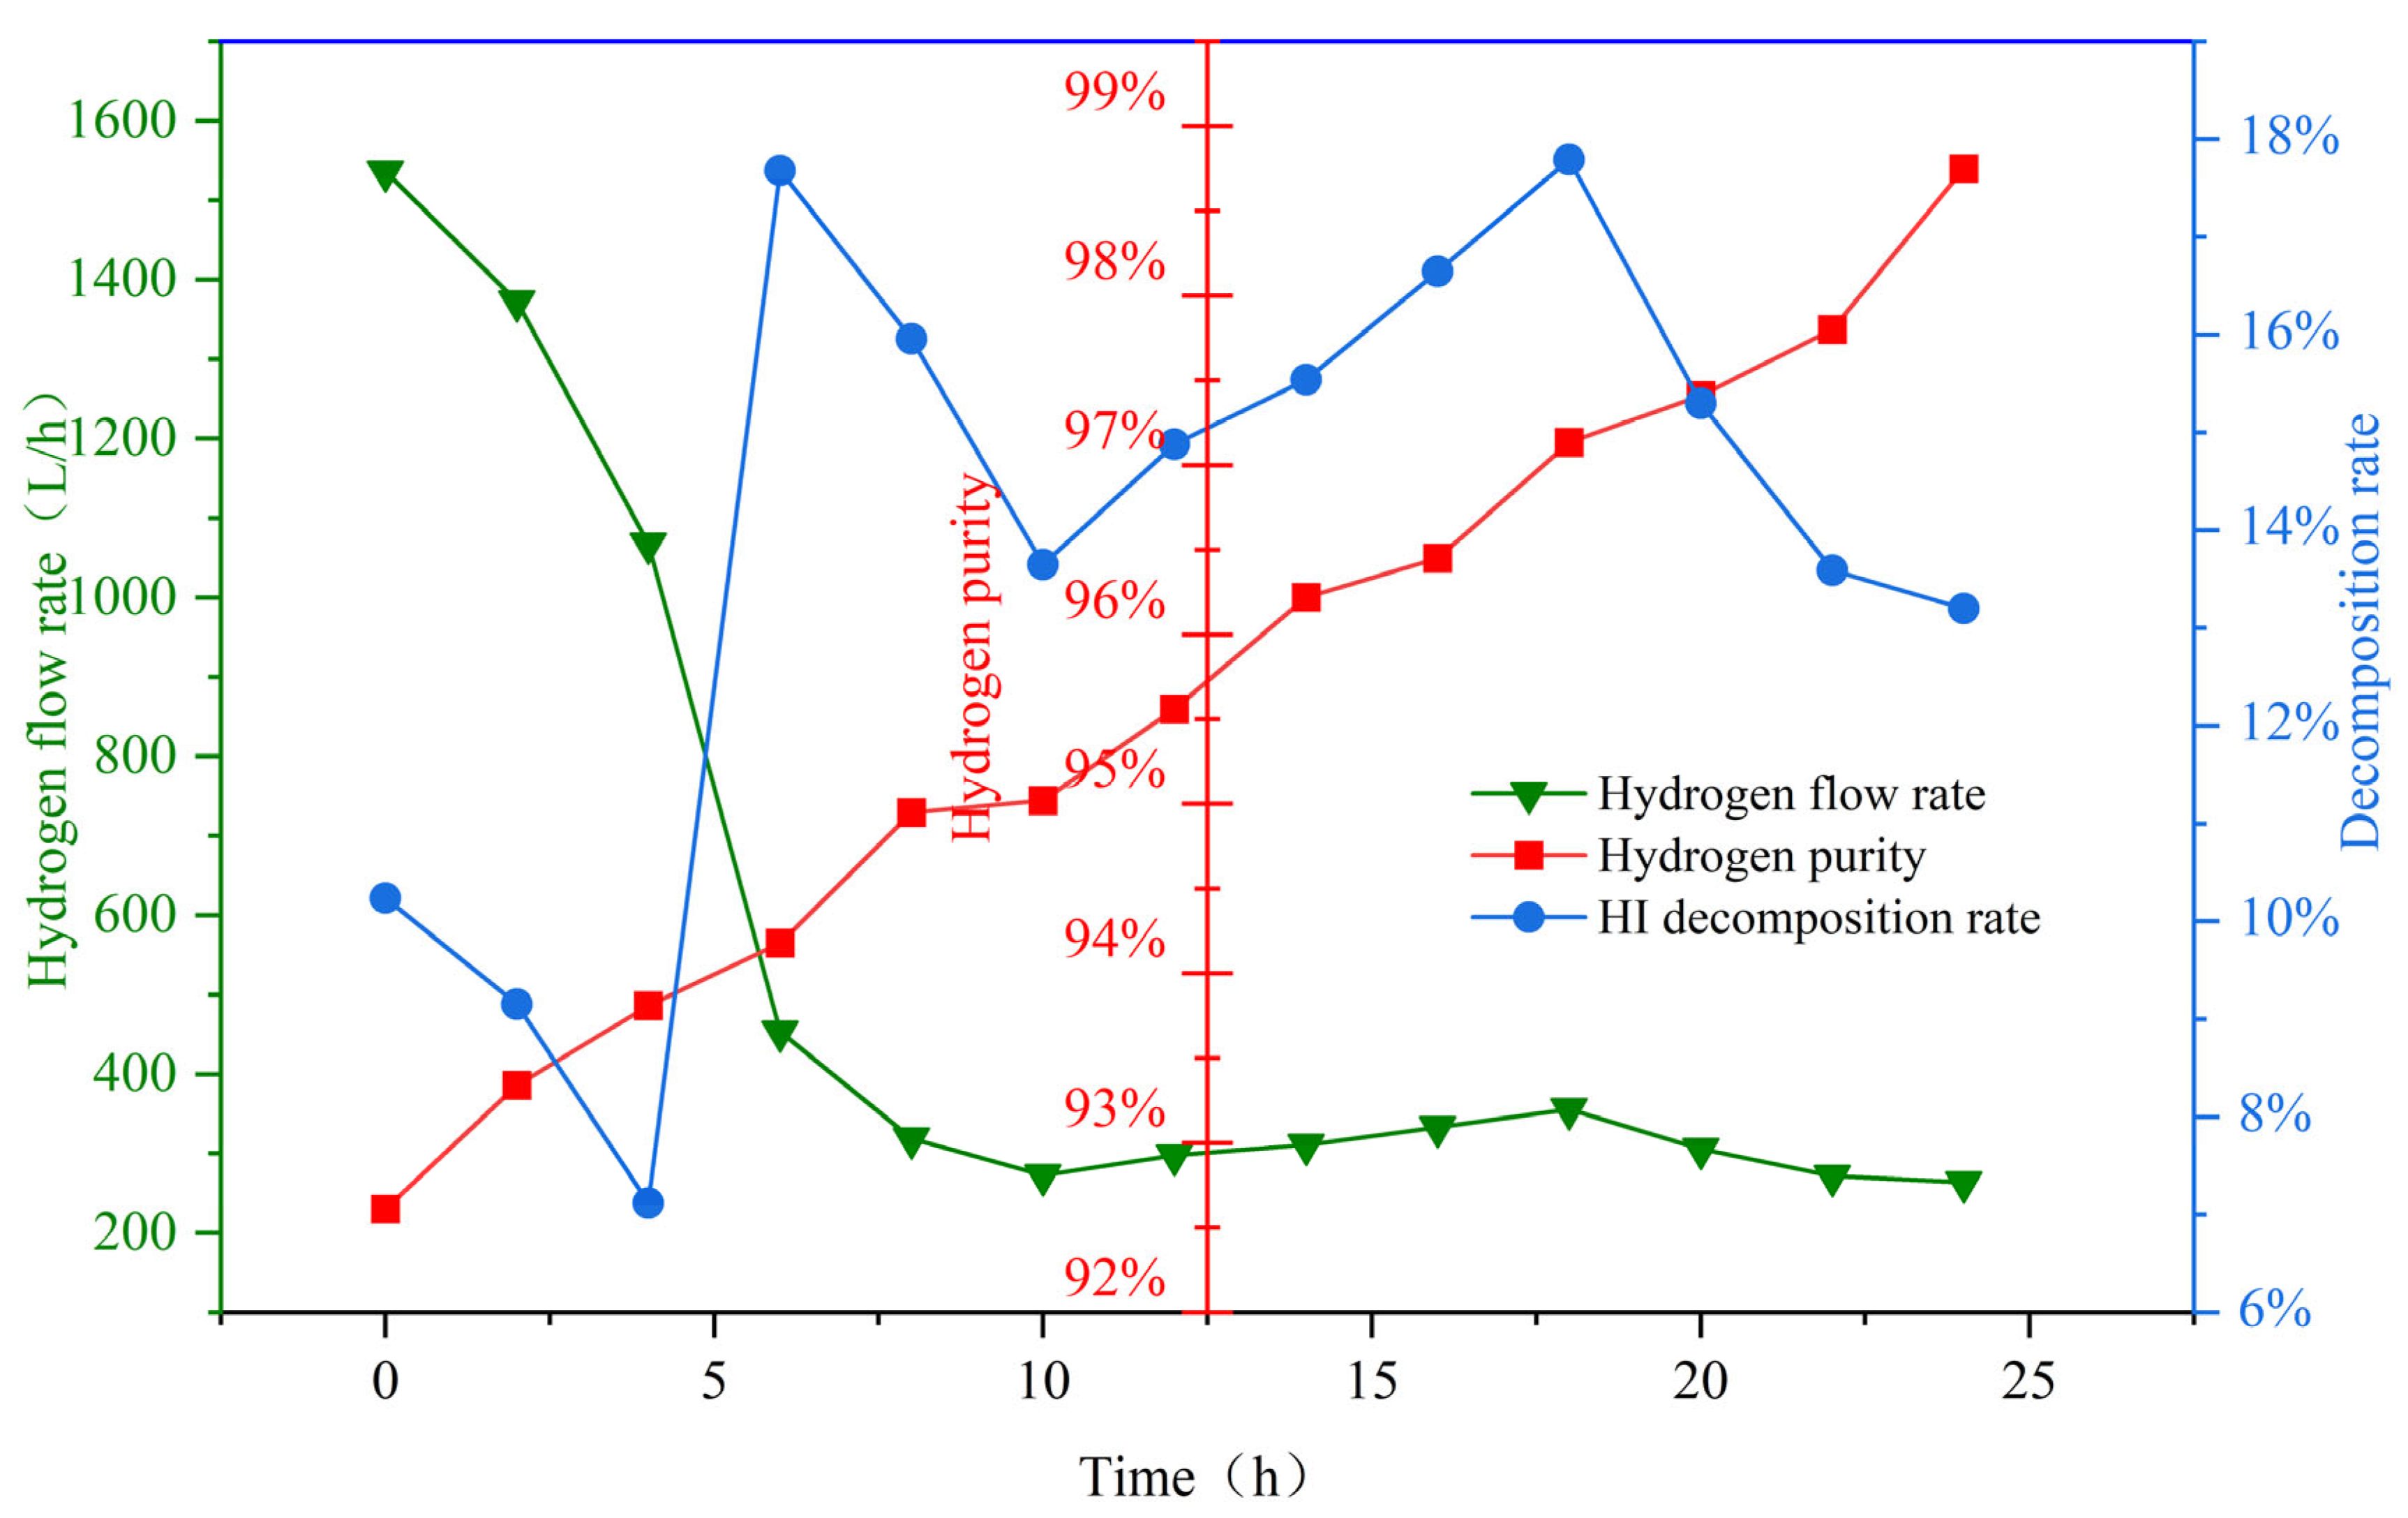
This article primarily focuses on the updating and optimization of the CEU’s system and reports the latest 24 h testing results. The redesign and manufacturing of several key reactors and components, as well as continuous operational performance, will be reported here. Compared to previous studies, this paper designs a three-stage sulfuric acid decomposition reaction module to address corrosion issues in high-temperature sulfuric acid decomposition, and develops a heat-recovery HI decomposition module to reduce system energy consumption, ultimately achieving 24 h continuous high-yield system operation. This demonstration trial achieves a 13% increase in thermal efficiency, extends hydrogen production stability from 4 h to 24 h, and improves hydrogen purity from 92% to 98%. It effectively resolves the corrosion issues and waste heat utilization problems existing in the prior system.

2. System Update and Optimization

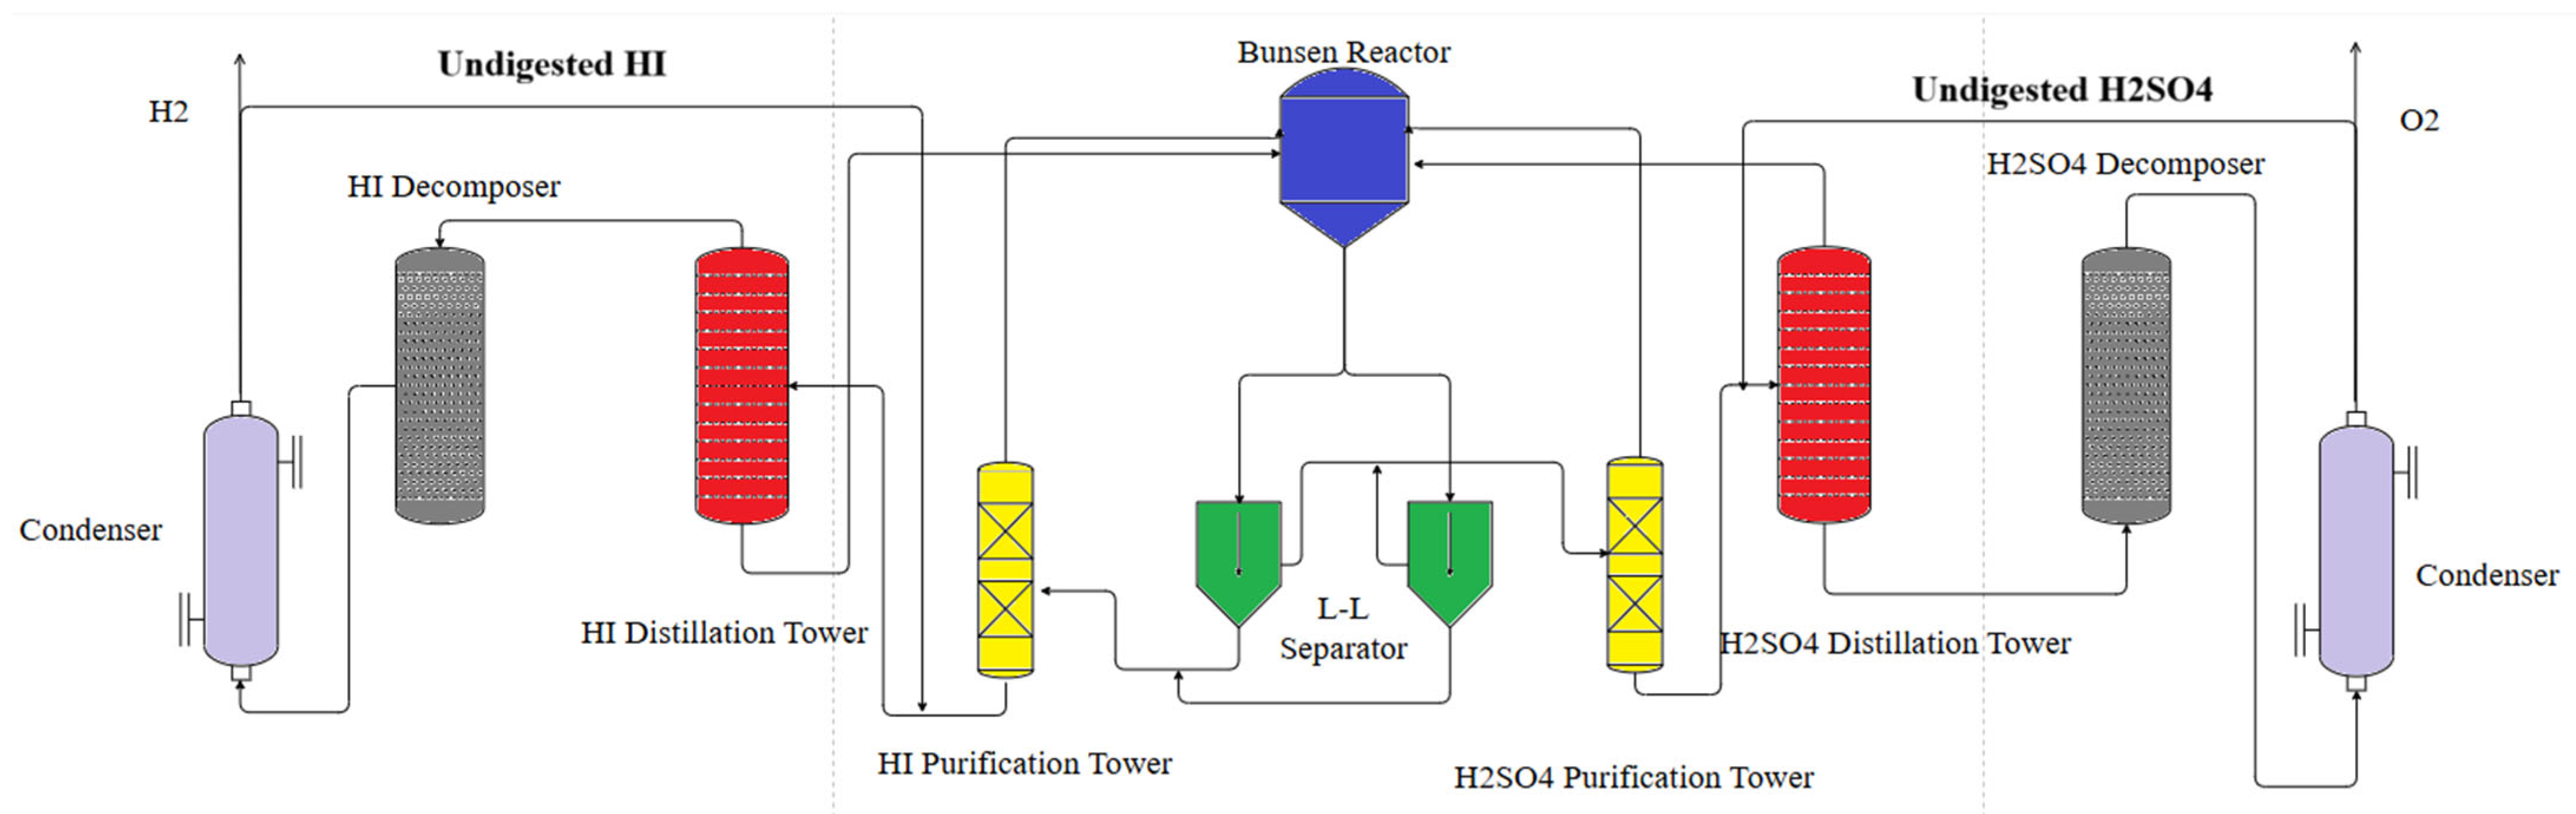
In the previous system process, the undecomposed HI solution and H2SO4 solution from the decomposer outlet were recycled to the Bunsen tank to participate in the Bunsen reaction again. This significantly increased the system’s energy consumption and hindered the Bunsen reaction. Therefore, in the optimized system, the undecomposed HI and H2SO4 solutions are redirected to the purification tower, where they are mixed and purified with freshly separated liquid–liquid phases. As a result, a small cycle within the entire system was established to reduce the overall energy consumption. The undigested sulfuric acid and iodate solutions no longer return to the Bunsen reaction to participate in the overall system circulation, but undergo small cycles in the distillation and decomposition module circulation. Aspen Plus V12 software was utilized to design and optimize the process. For the thermochemical sulfur–iodine cycle, a typical polar non-ideal system, this study adopts a differentiated-property method selection strategy based on the material characteristics and processing conditions of different process modules. The research findings from [24] demonstrate that the ELECNRTL electrolyte model exhibits significant advantages in simulating such systems. This model boasts broad applicability, as it can handle electrolyte solutions across various concentrations and is equally suitable for mixed-solution systems. Its theoretical foundation rests on two core assumptions: First, mutual repulsion exists between ions of the same charge, with ions of opposite charge distributed around any central ion. Second, local electroneutrality is maintained, meaning the total charge of surrounding ions balances that of the central ion within its immediate vicinity. In terms of specific model construction, long-range ion interactions are characterized using a modified Pitzer–Debye–Hückel asymmetric model combined with the Born correction equation [25], while short-range molecular interactions are described by the Non-Random Two-Liquid (NRTL) model. This multi-scale modeling approach effectively integrates the influence mechanisms of long-range electrostatic interactions and short-range intermolecular forces. Consequently, the expression for calculating the excess Gibbs energy is formulated as follows:
G m * E R T = G m * E , P D H R T + G m * E , B o r n R T + G R T * E , N R T L R T
The relationship between the corresponding activity coefficients can be obtained from this:
l n γ * = l n γ i * P D H + l n γ i * B o r n + l n γ i * N R T L
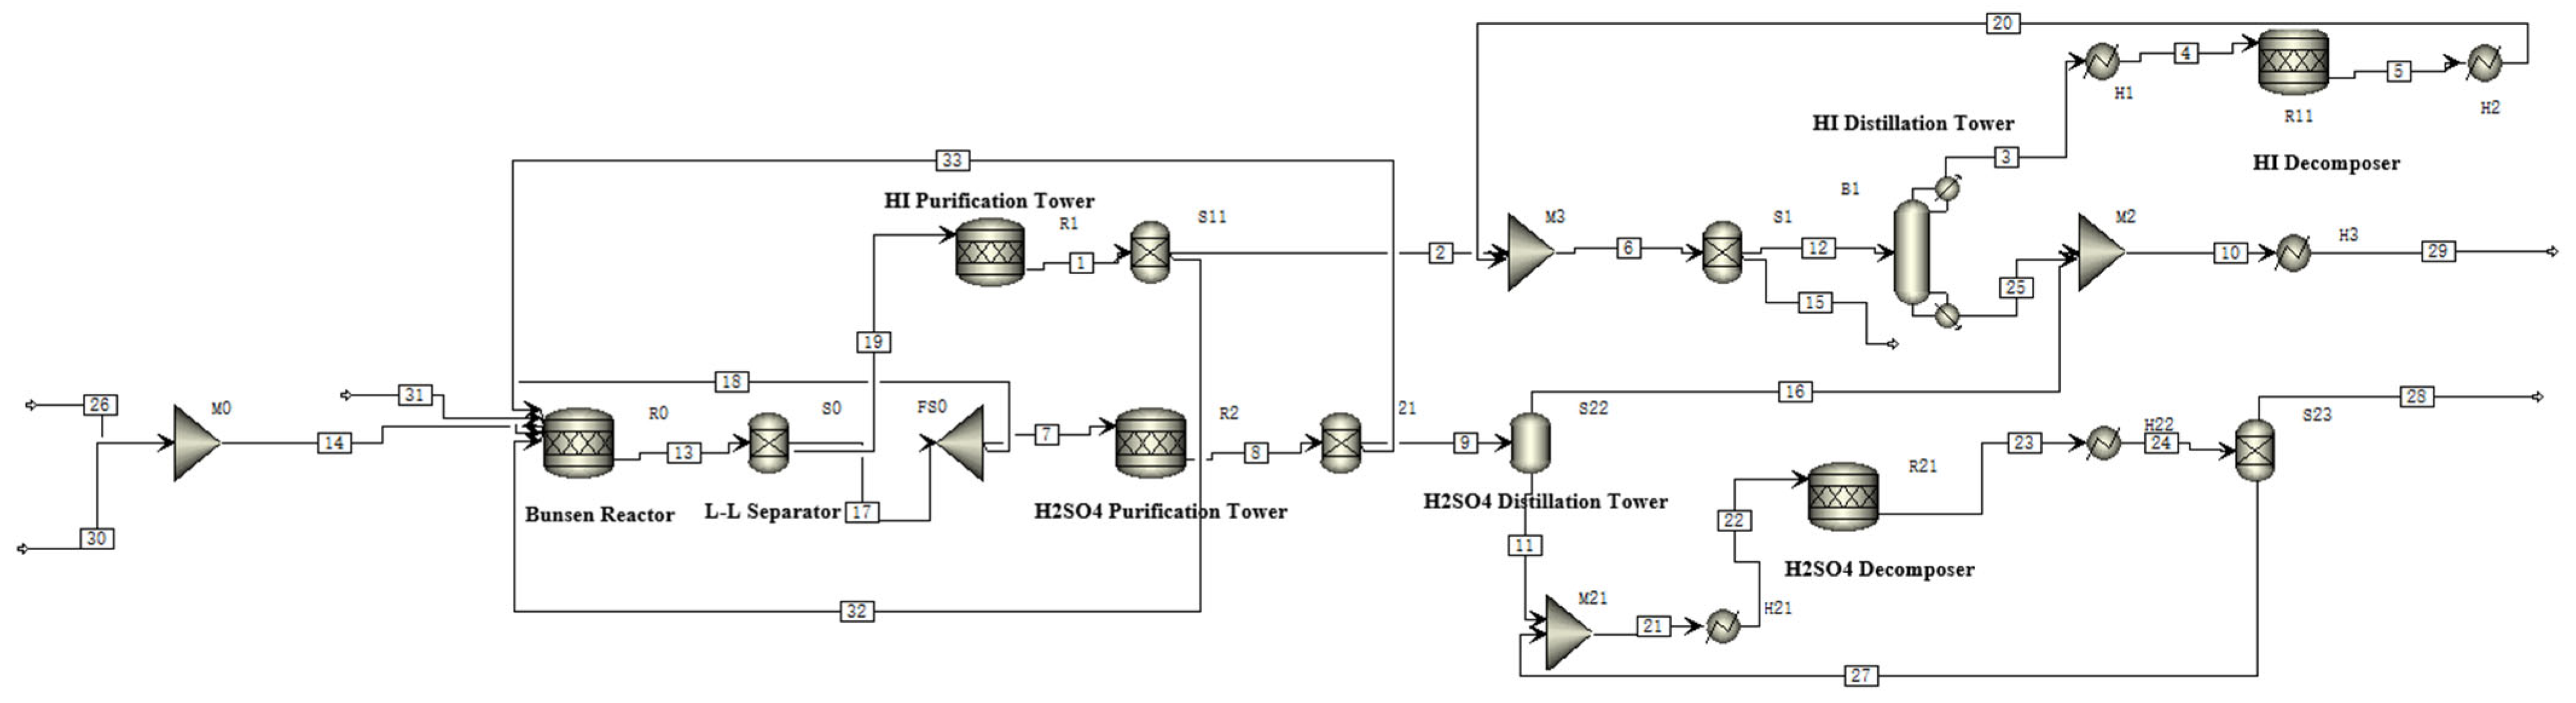
The system flow is illustrated in Figure 1, while the corresponding stream components, temperature, and pressure are detailed in Table 1.
For the entire system, a fully closed-loop operation is employed, requiring only 44.65 mol of water and an external energy input to produce 44.642 mol of hydrogen and 22.321 mol of oxygen. In the Bunsen reaction module, the reverse reaction products (streams 32 and 33) from the HI and H2SO4 purification towers, along with the circulating streams (28 and 29) from the H2SO4 and HI decomposition modules, are directed back to the Bunsen reaction. In the H2SO4 module, to match the hydrogen production target, a portion of H2SO4 stream 18 is recycled to the Bunsen reaction, while the remaining stream 7 is purified in the R2 purification tower at 418.15 K to remove HI and I2. The product is transferred to flash distillation tower S22 to obtain 87.75% H2SO4. It is then mixed with the remaining H2SO4 stream 27 and heated to 1123.15 K in H21. Subsequently, it enters reactor R21 for decomposition into SO2, O2, and H2O, achieving a conversion rate of 70%. The liquid-phase stream 27 is mixed in M21 with the H2SO4 from the flash distillation, while the gas-phase stream 28 is recycled to the Bunsen reaction. In the HI module, stream 19 is purified in R1 at 390.15 K to remove H2SO4. Afterward, the purified flow is transferred to B1 for distillation. At the top of the tower, HI vapor with a concentration of 91.44% is obtained. Stream 25 from the reboiler is condensed in condenser H3 before being transferred to the Bunsen reaction module. Stream 3 is heated to 773.15 K in H1 and undergoes decomposition in reactor R11, achieving a 15% conversion rate to produce H2 and I2. After condensing to 393.15 K in H2, it is mixed with stream 2 and transferred to S1 for gas–liquid separation. Liquid-phase stream 12 enters the distillation column for the small cycle, while gas-phase stream 15 is collected as the final product.
Table 2 shows the external thermal and electrical energy demands before and after the system optimization. In the absence of heat recovery utilization, the thermal efficiency is defined as
η = Δ H H 2 ,   H H V × q H h e a t + G e l e c / η e × 100 %
where Δ H H 2 , H H V denotes the higher heating value of hydrogen, which is 286 kJ/mol-H2; q represents the hydrogen production rate; H h e a t is the total external heat required; G e l e c is the electrical energy needed for the system; and η e is the conversion efficiency of electrical energy, which is 40% here. The calculated thermal efficiency is 53%, representing a 12% increase compared to the efficiency before the update [23].
Based on the Aspen simulation results, the hydrogen production pilot platform was updated. The system utilizes industrial materials such as HC276, TC4, carbon steel lined with enamel, and SiC. All the thermal energy for the system is provided by electric heating. Figure 2 is a schematic diagram of the modified hydrogen production pilot platform.

3. Key Component Update

3.1. Selection of Corrosion-Resistant Materials

The issue of material corrosion is particularly critical due to the involvement of media such as H2SO4 and HI. Earlier studies investigated the corrosion resistance of metallic materials, but these were limited to conventional single-metal materials, which exhibited severe corrosion in practical applications. In this study, we selected nine alloy materials (HC276, HC2000, HB-3, TA2, TC4, Monel400, Inconel617, Inconel601, Inconel690) from those that are commonly used and perform well on the market as research subjects for corrosion resistance testing. During previous pilot-scale tests, we observed significant metal corrosion during the phase transition of H2SO4. Therefore, in addition to traditional gaseous HI and H2SO4 corrosion tests, we specifically examined H2SO4 corrosion during phase transition. Furthermore, three ceramic materials (SiC, Al2O3, WC) were included in the corrosion experiments to provide guidance for subsequent reactor development.
In the corrosion testing, the samples were placed in quartz tubes and heated in a tubular furnace to specified temperatures: 500 °C for gaseous HI corrosion, 850 °C for gaseous H2SO4 corrosion, and 400 °C for H2SO4 phase transition corrosion. Upon reaching the target temperature, the corrosive solution was injected into the evaporator via a peristaltic pump at a constant rate (1 mL/min). The gasified materials were then tested under a stable nitrogen carrier gas flow of 200 mL/min.
The corrosion rates of different materials are shown in Table 3. HC276, TC4, and TA2 exhibited negative corrosion rates under gaseous HI decomposition conditions, attributed to the formation of dense oxide protective films on their surfaces, which effectively resisted acidic gas corrosion. HC2000 and HB-3 demonstrated excellent corrosion resistance, with corrosion rates of 0.0171 mm/a and 0.0053 mm/a, respectively. Monel and Inconel alloys showed poor corrosion resistance in gaseous HI environments, leading to the selection of the TC4 alloy for the HI decomposer design.
In gaseous H2SO4 decomposition conditions, TA2 and Monel400 displayed negative corrosion rates. However, post-experiment analysis revealed spalling of brittle surface layers on TC4, TA2, and Monel400, with TC4 showing the most severe detachment. This indicates that although passivation films formed on these metals, the films were unstable and prone to mechanical failure. Hastelloy and Inconel alloys exhibited superior corrosion resistance in gaseous sulfuric acid, particularly Inconel690 with a corrosion rate of only 0.076 mm/a, demonstrating high stability. Considering material processability and cost, HC276 was selected for sulfuric acid module reactor development.
Hastelloy, titanium alloys, and Inconel alloys showed unsatisfactory corrosion resistance during H2SO4 phase transition, with titanium alloys being the most severely affected. In contrast, ceramic materials maintained excellent stability during sulfuric acid boiling and phase transition. SiC and WC performed exceptionally well, with WC exhibiting a corrosion rate of 0.0239 mm/a, making it suitable for long-term use in phase transition environments. However, Al2O3, being an amphoteric oxide, reacts with strong acids and bases, resulting in instability in industrial applications. Although WC is an ideal benchmark material, its scarcity, high cost, and processing challenges limit its current adoption. Therefore, SiC or ceramic-lined carbon steel heat exchange tubes were temporarily chosen as materials for sulfuric acid phase transition processes.

3.2. Three-Stage H2SO4 Decomposition Reactor

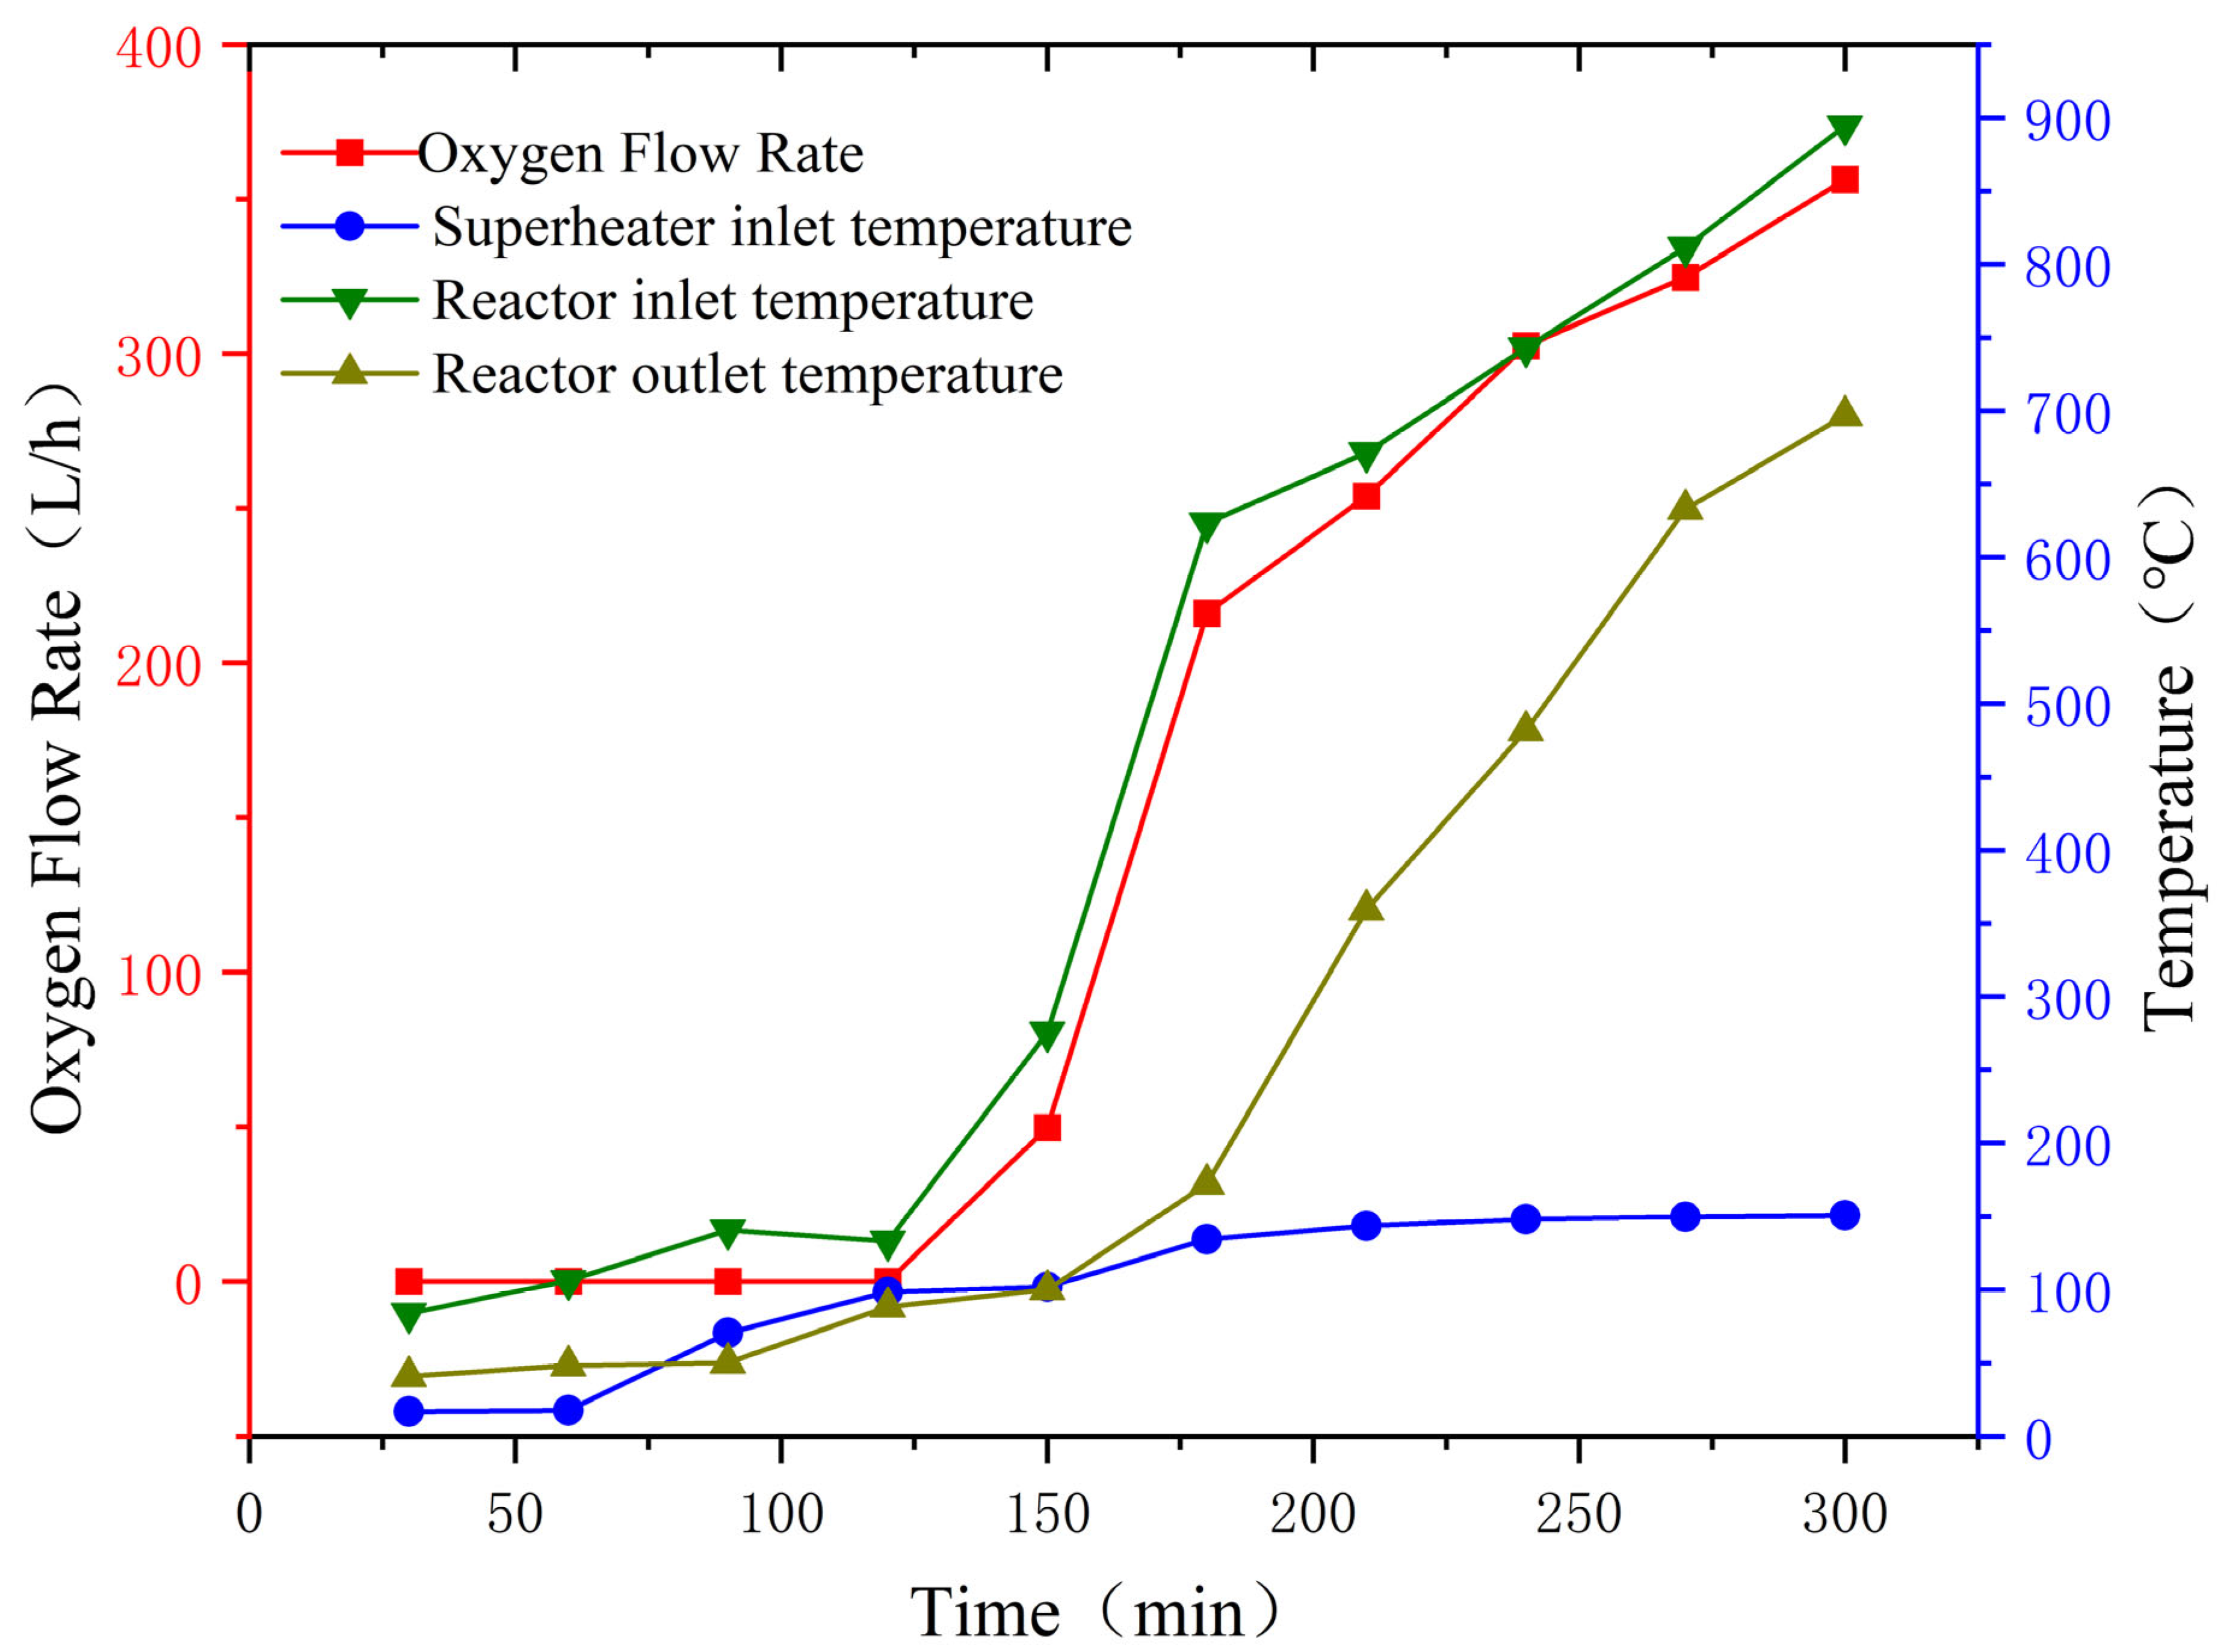
To ensure sufficient heat exchange, the H2SO4 catalytic decomposer is designed with dimensions of Φ108 × 1500 mm. Prior to using the H2SO4 decomposer, an HC276 alloy superheater is used as a preheating device to ensure that the preheating section outlet temperature reaches 850 °C, enabling efficient H2SO4 decomposition. The superheater dimensions are Φ98 × 1600 mm.
Previous experiments revealed severe corrosion in the HC276 alloy during phase changing of the H2SO4 stream. To address this problem, a two-step strategy was utilized here. Firstly, an enamel-lined air heat exchanger was used to evaporate liquid-phase H2SO
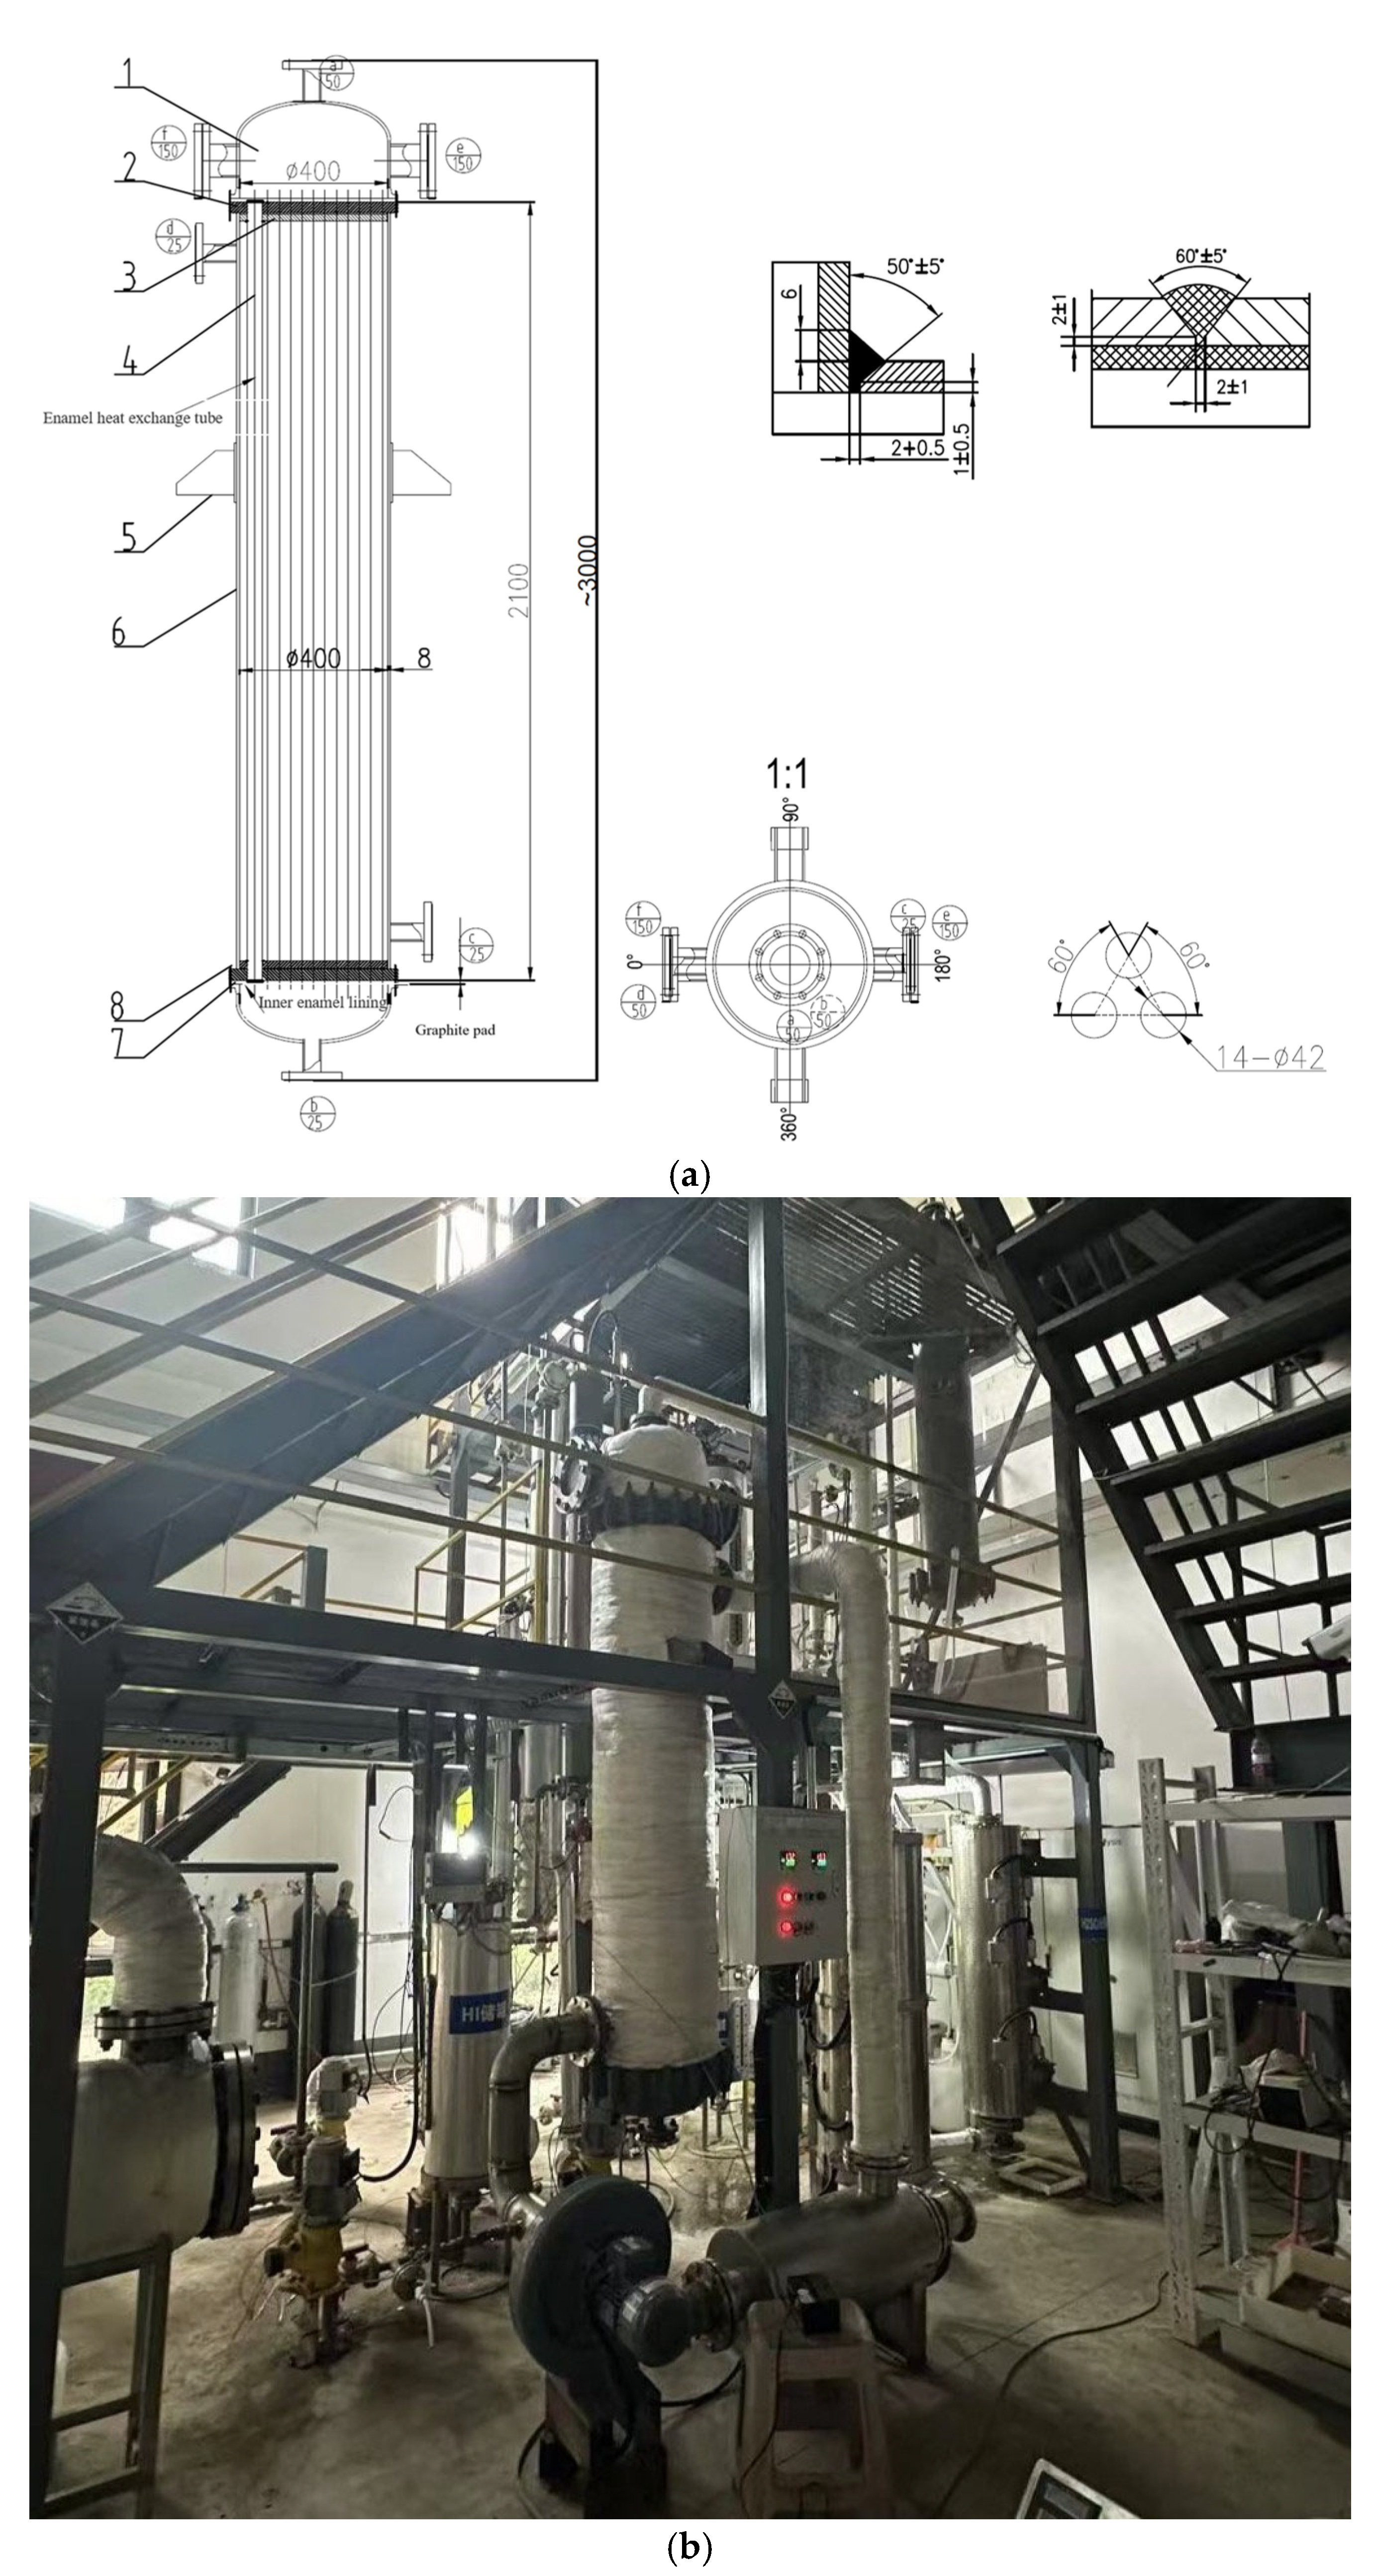
4 into a gas phase, followed by HC276 superheating. The enamel-lined air heat exchanger is shown in Figure 3. The evaporator has a shell-and-tube heat exchanger structure with dimensions of Φ400 × 2100 mm and a heat exchange tube diameter of 42 mm. Electrically heated air was used as a heat source for evaporation.
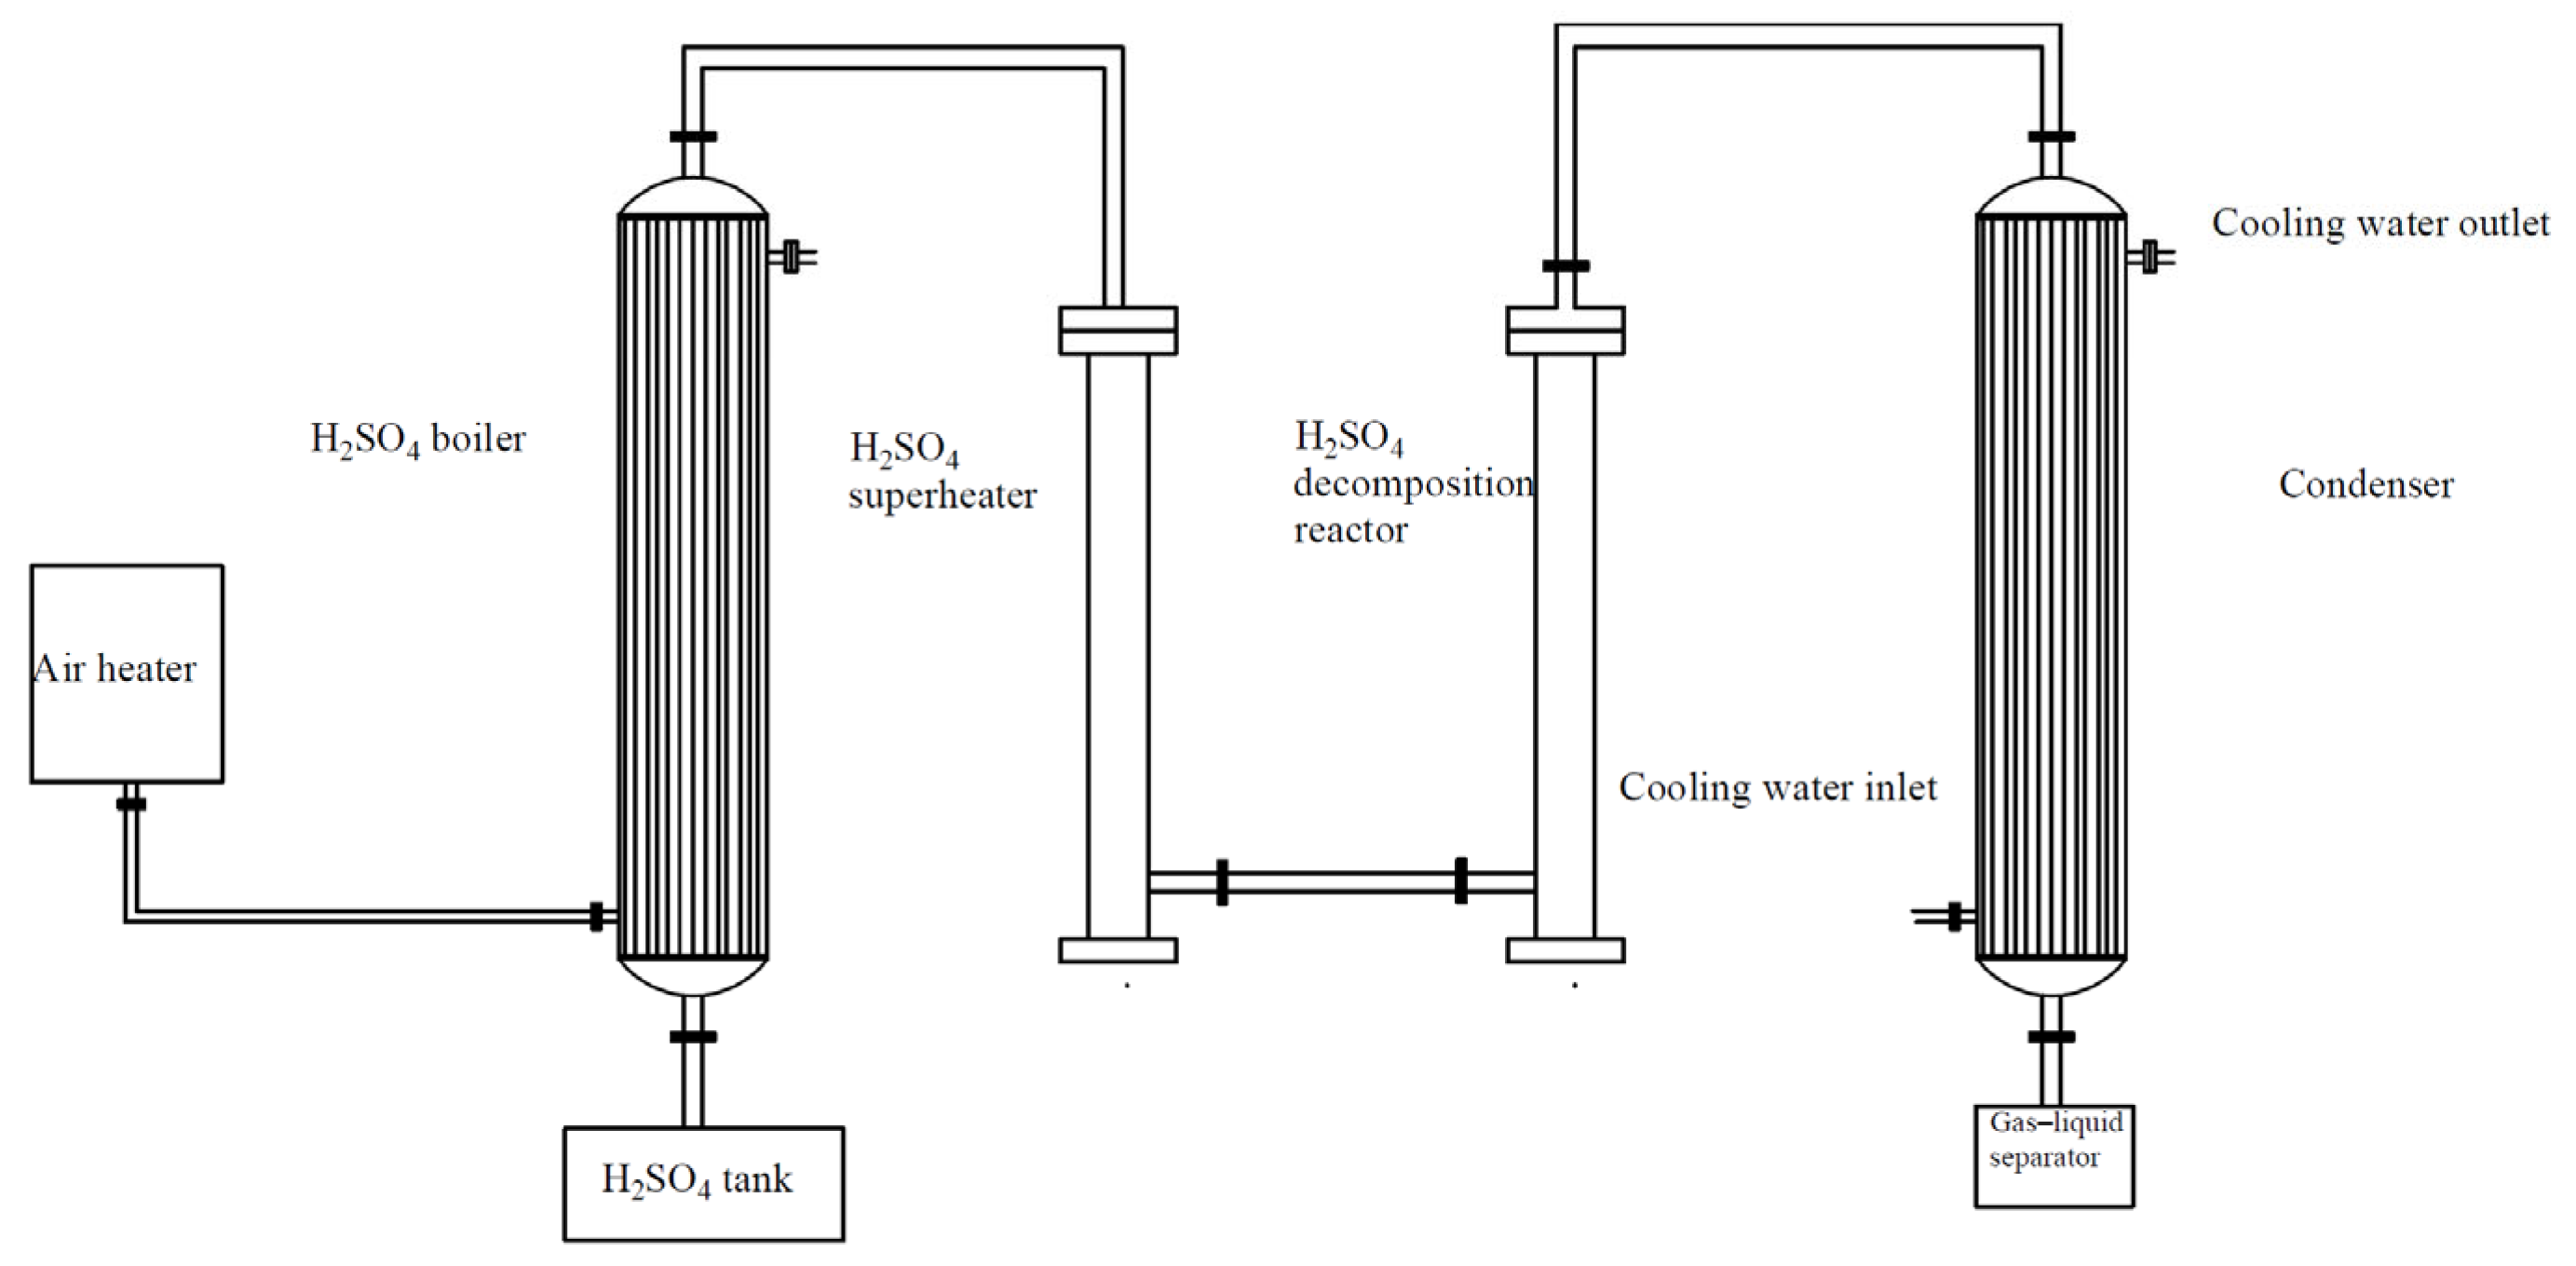
As shown in Figure 4, H2SO4 is pumped from the bottom of the air heat exchanger into the H2SO4 evaporator for evaporation. The gaseous H2SO4 then enters the top inlet of the H2SO4 superheater from the top. Heat exchange is enhanced using small silicon carbide balls in a cylindrical reactor chamber, where the first step of decomposition occurs, decomposing H2SO4 into SO₃ and H2O, with heat supplied by external electric heating.
Finally, gaseous SO₃ enters the H2SO4 catalytic decomposition reactor from the superheater’s base. The reactor cavity is filled with iron oxide-based catalysts, where catalytic decomposition occurs, producing SO2 and O2.
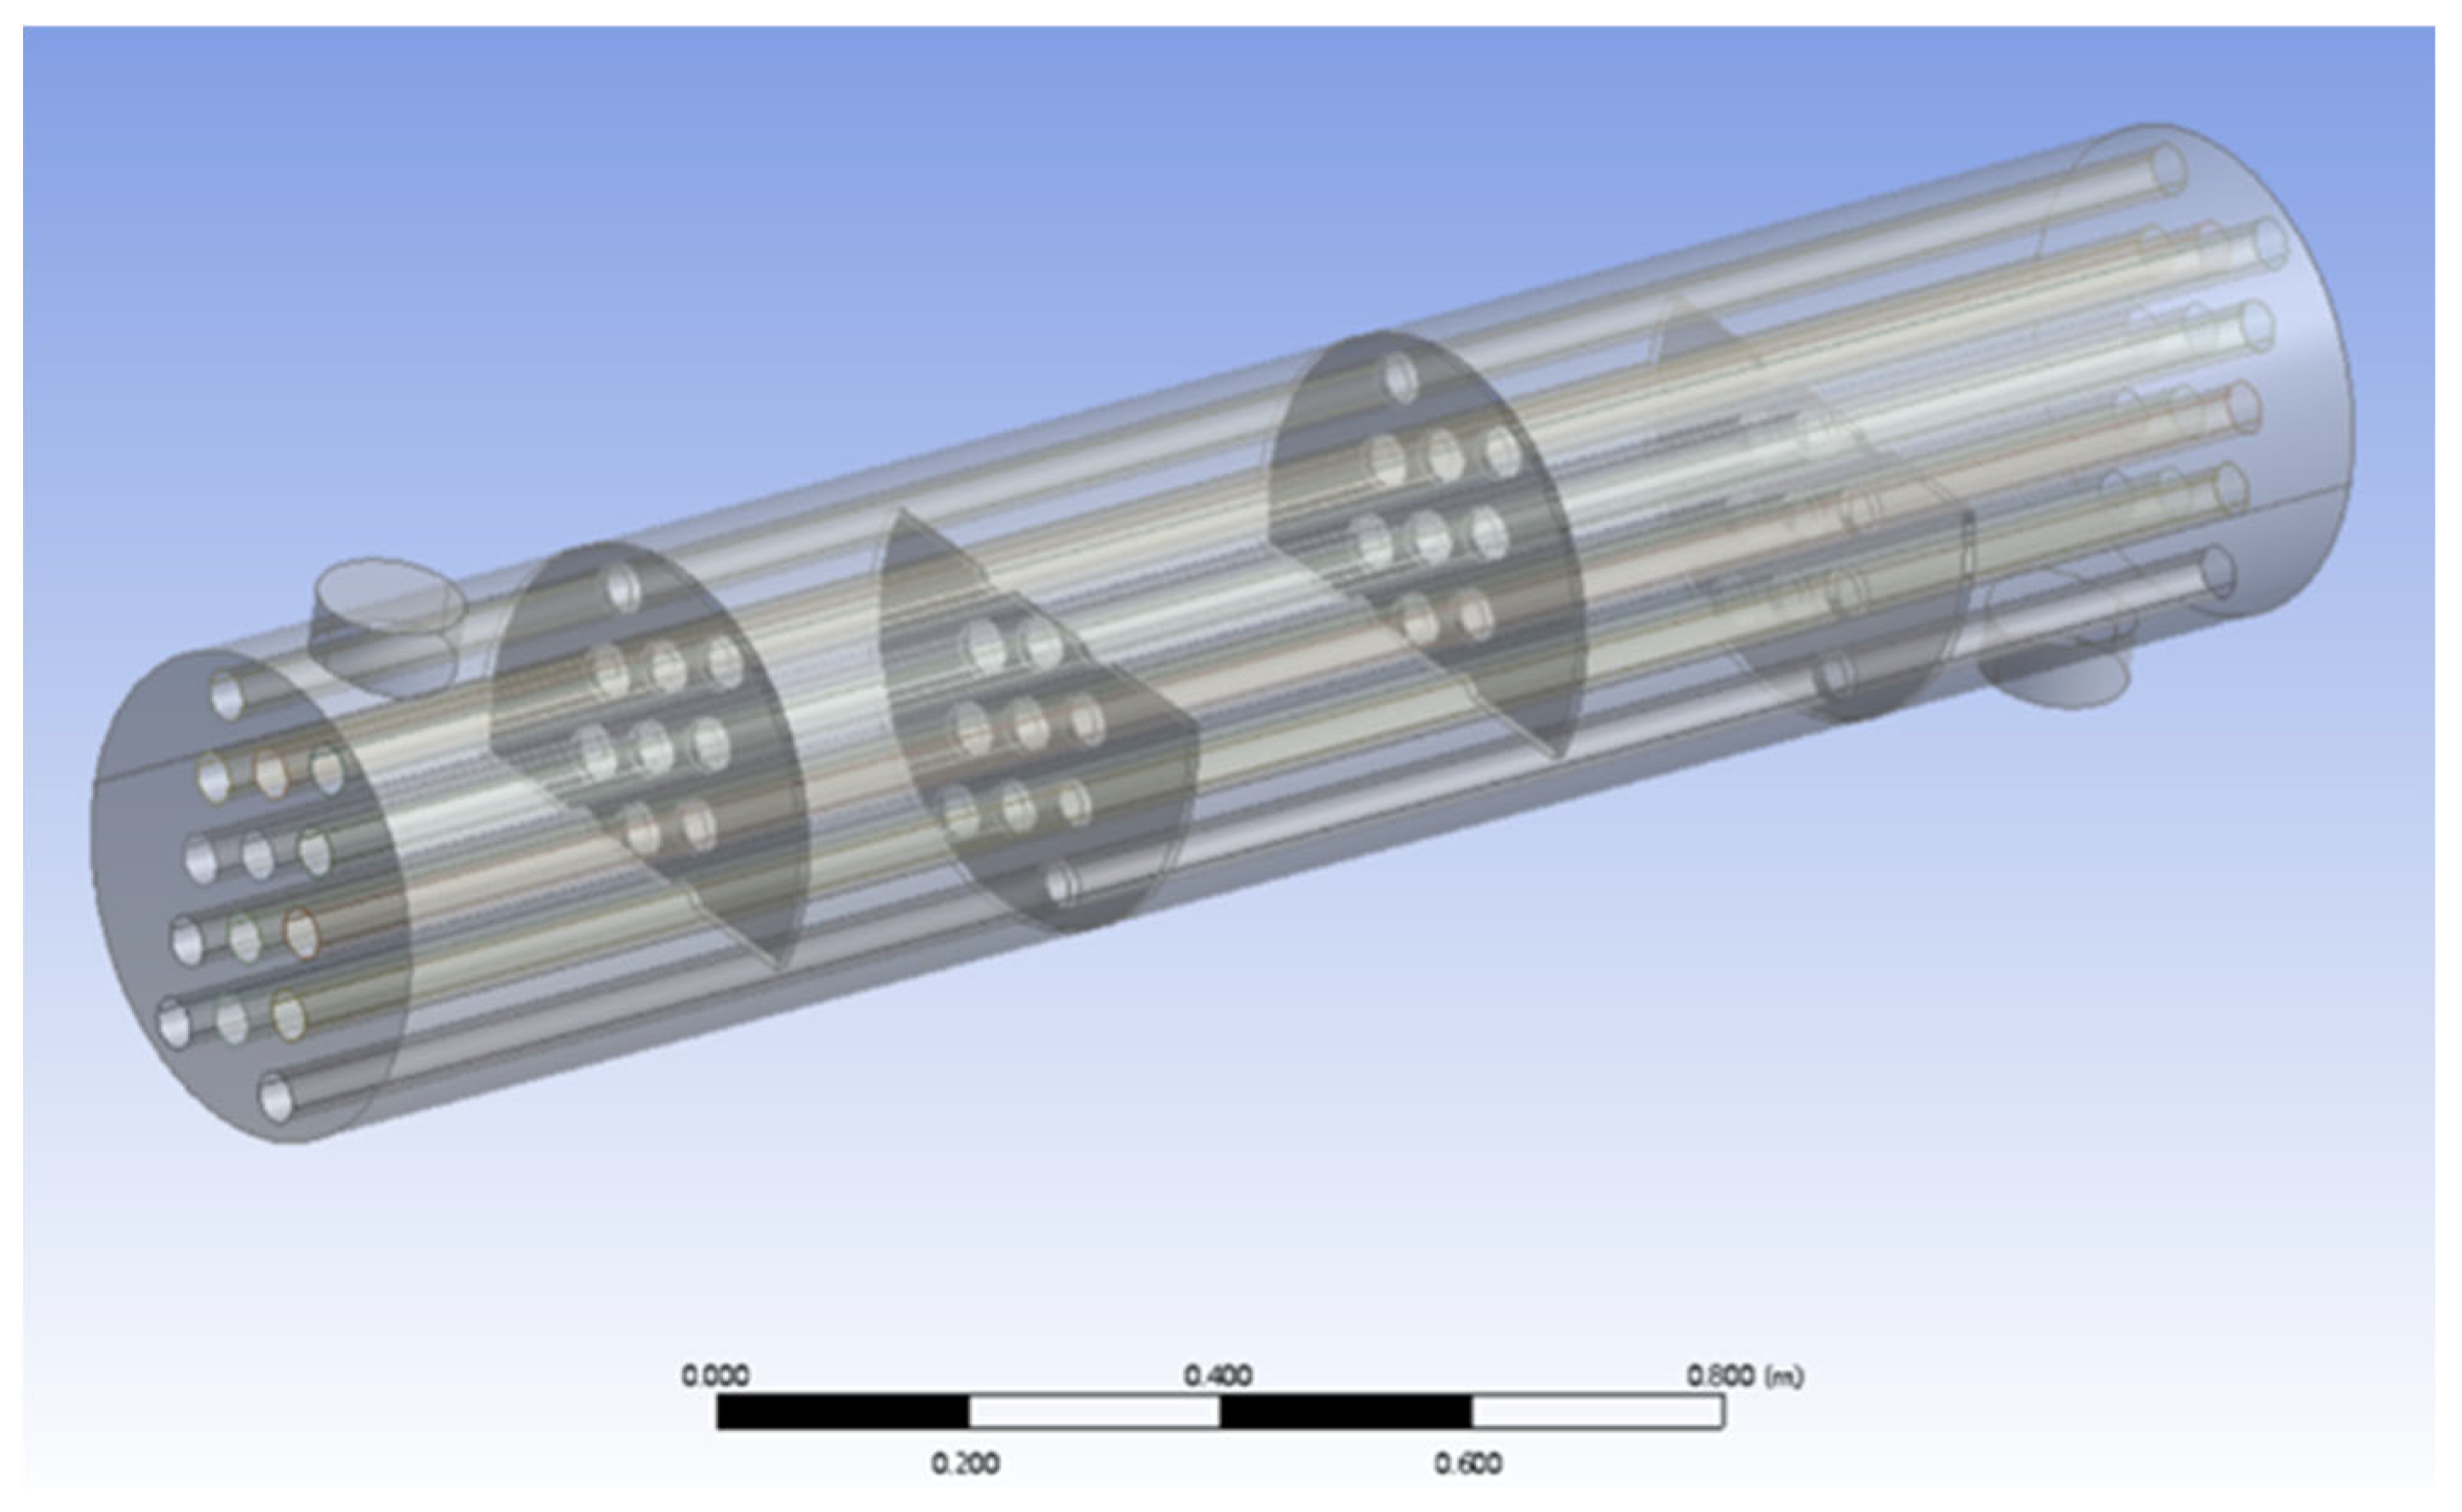
Before conducting the experiments, a Computational Fluid Dynamics (CFD) simulation was performed for the H2SO4 evaporator to ensure that H2SO4 would be evaporated properly and prevent corrosion in the subsequent HC276 reactor. Due to the complexity of the H2SO4 evaporator structure, this simulation mainly focused on the primary heat exchange region, ignoring the upper and lower heads of the evaporator. It was assumed that the mass flow rate of H2SO4 was uniform across all 14 heat exchange tubes, the external surface of the evaporator had good insulation with no heat loss, and the heat transfer through the baffles and shell was neglected. A geometric model of the H2SO4 evaporator is shown in Figure 5.
The heat exchange tubes of the H2SO4 evaporator are made of enamel-lined carbon steel. Using parameters from the network database, the thermal resistance of the heat exchange tube walls was calculated. The specific parameter settings are shown in Table 4.
Due to the complexity of simulating H2SO4 boiling and the primary goal of evaluating heat exchanger performance, an equivalent heat capacity method was employed. The latent heat of H2SO4 vaporization was converted into the heat capacity of sulfuric acid. This simplification avoids the complex calculations of the boiling process. Additionally, since the heat transfer coefficient during boiling is much higher than that of normal convective heat conduction, using the equivalent heat capacity method to calculate the heat exchange power will yield better results in practice than using the calculated values. The relevant boundary conditions are shown in Table 5.
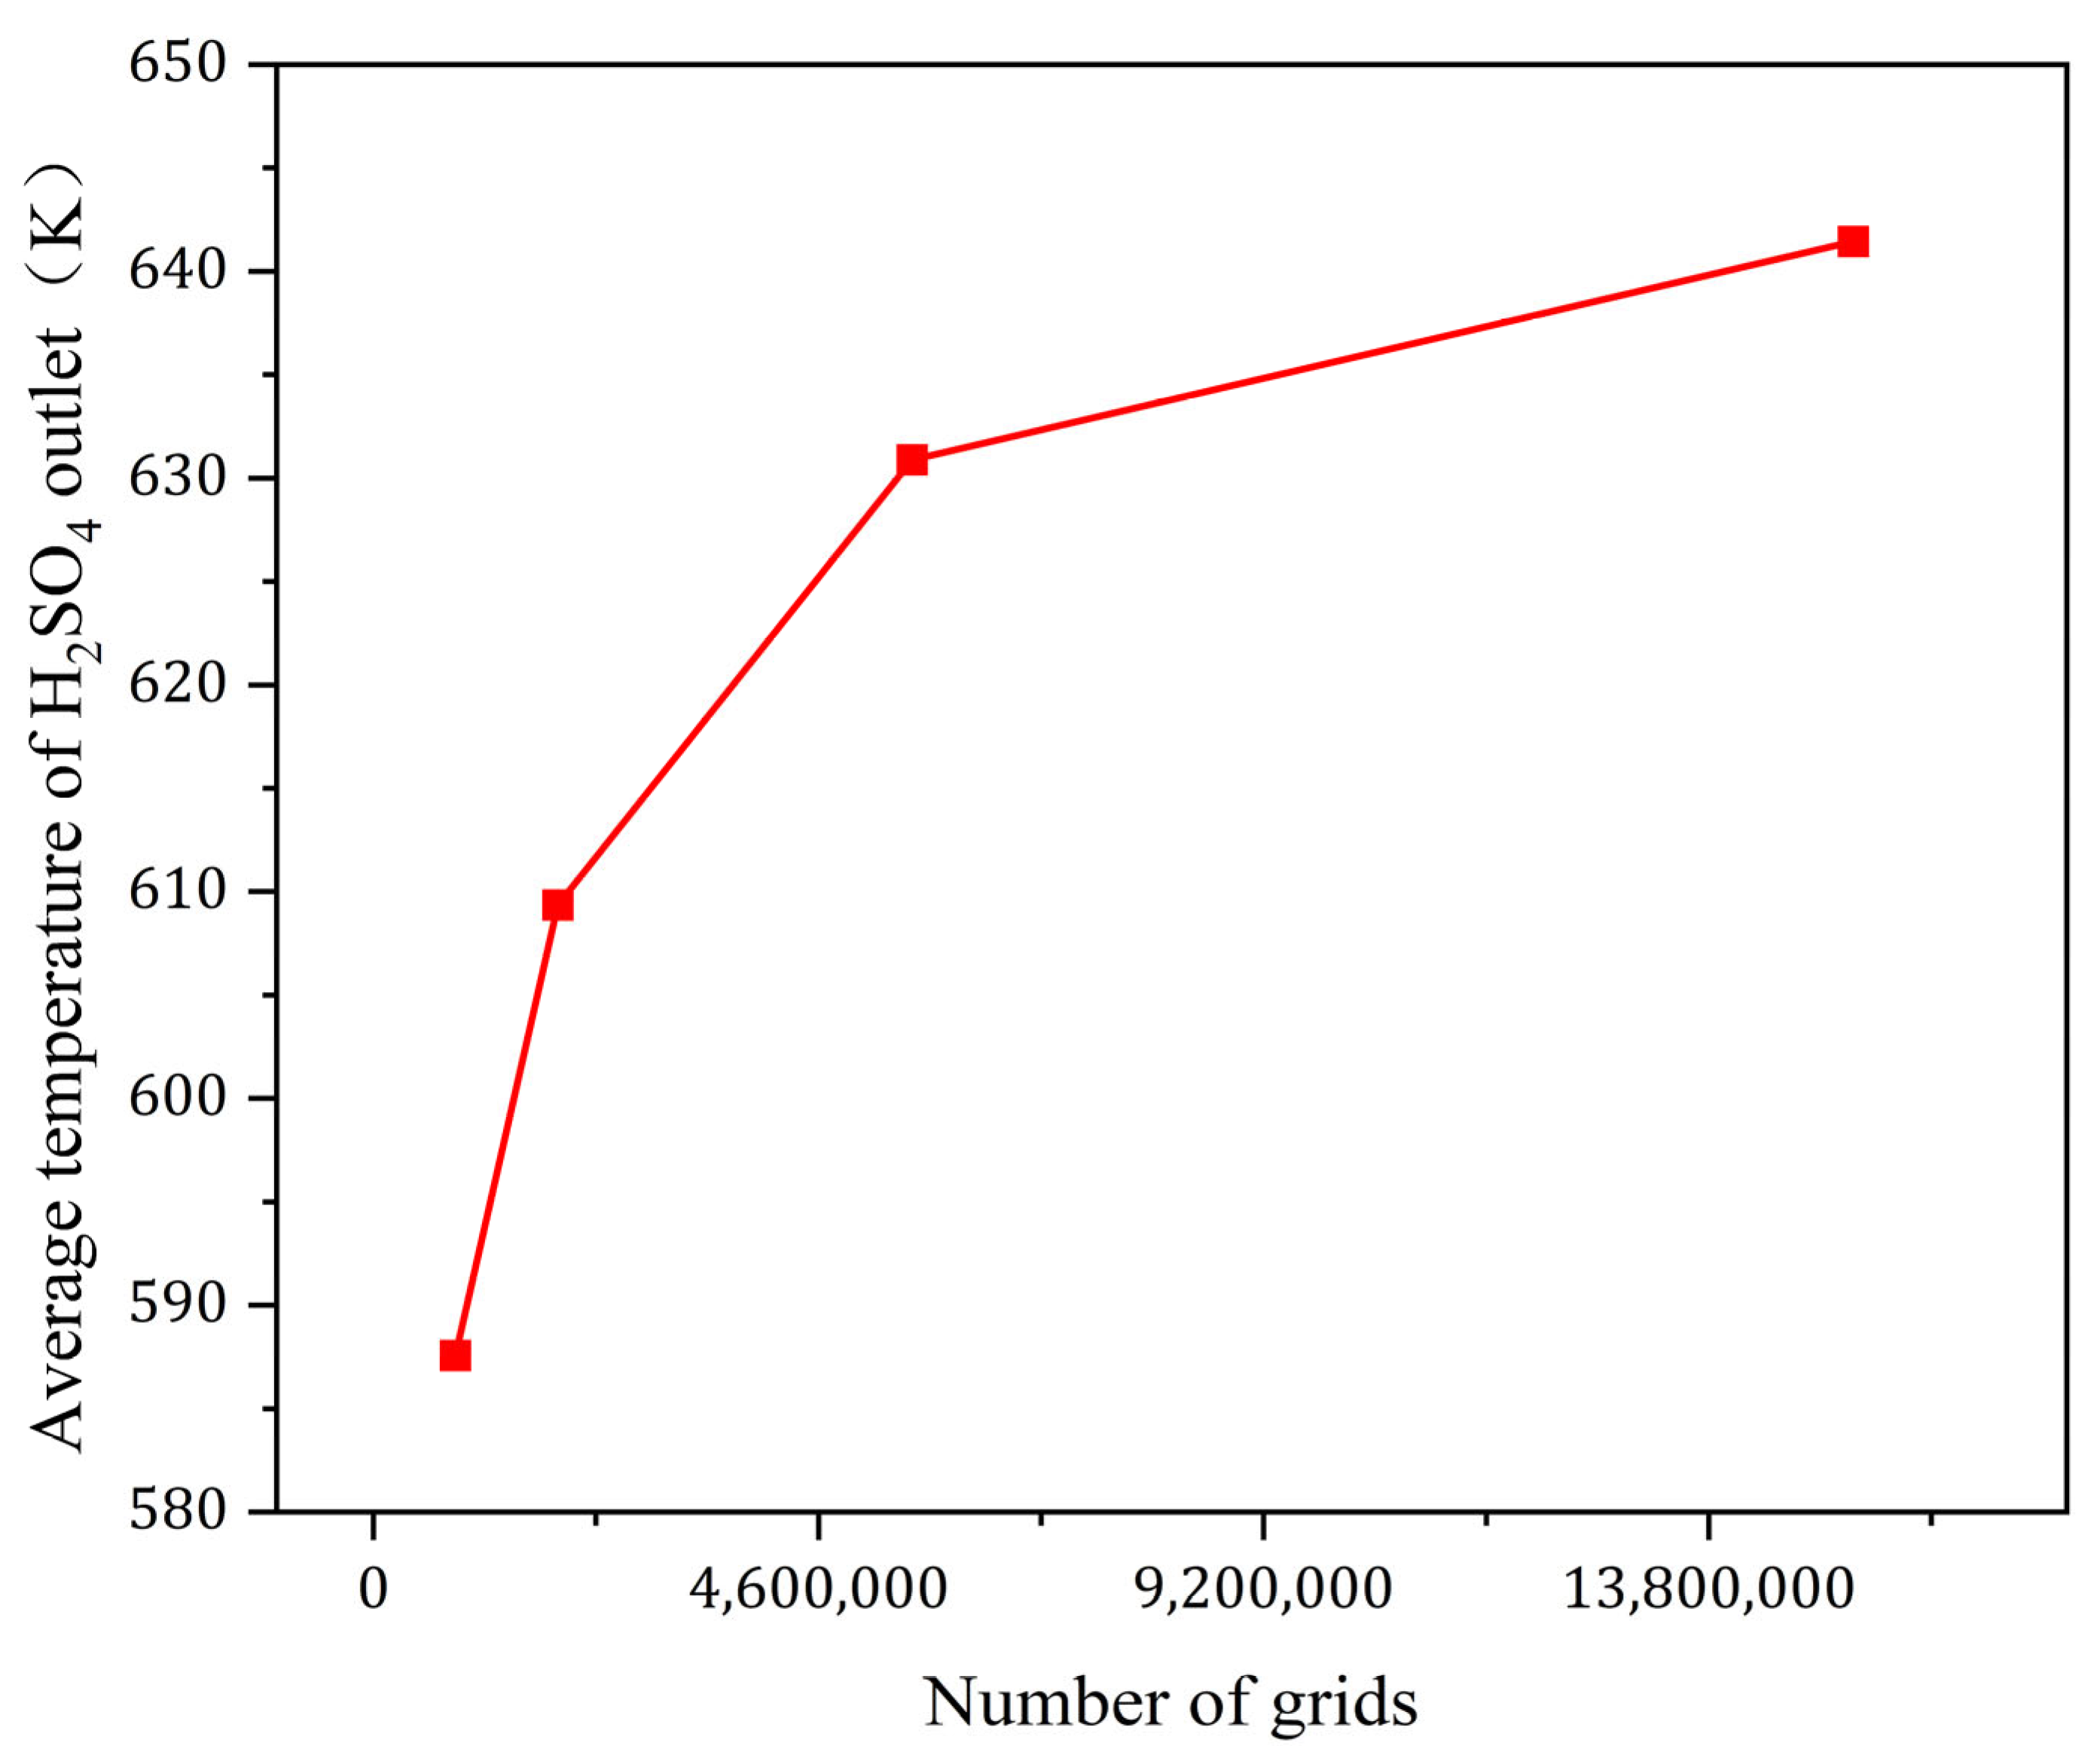
This model primarily uses quadrilateral meshing for grid division. To validate this approach, four mesh densities were selected: fine (15,294,678 cells), normal (5,565,668 cells), medium (1,906,694 cells), and coarse (846,135 cells). The verification was conducted by comparing the average H2SO4 outlet temperature, which is a critical parameter for the final results. As shown in Figure 6, which illustrates the mesh independence verification, the fine mesh model was ultimately chosen for the calculations.
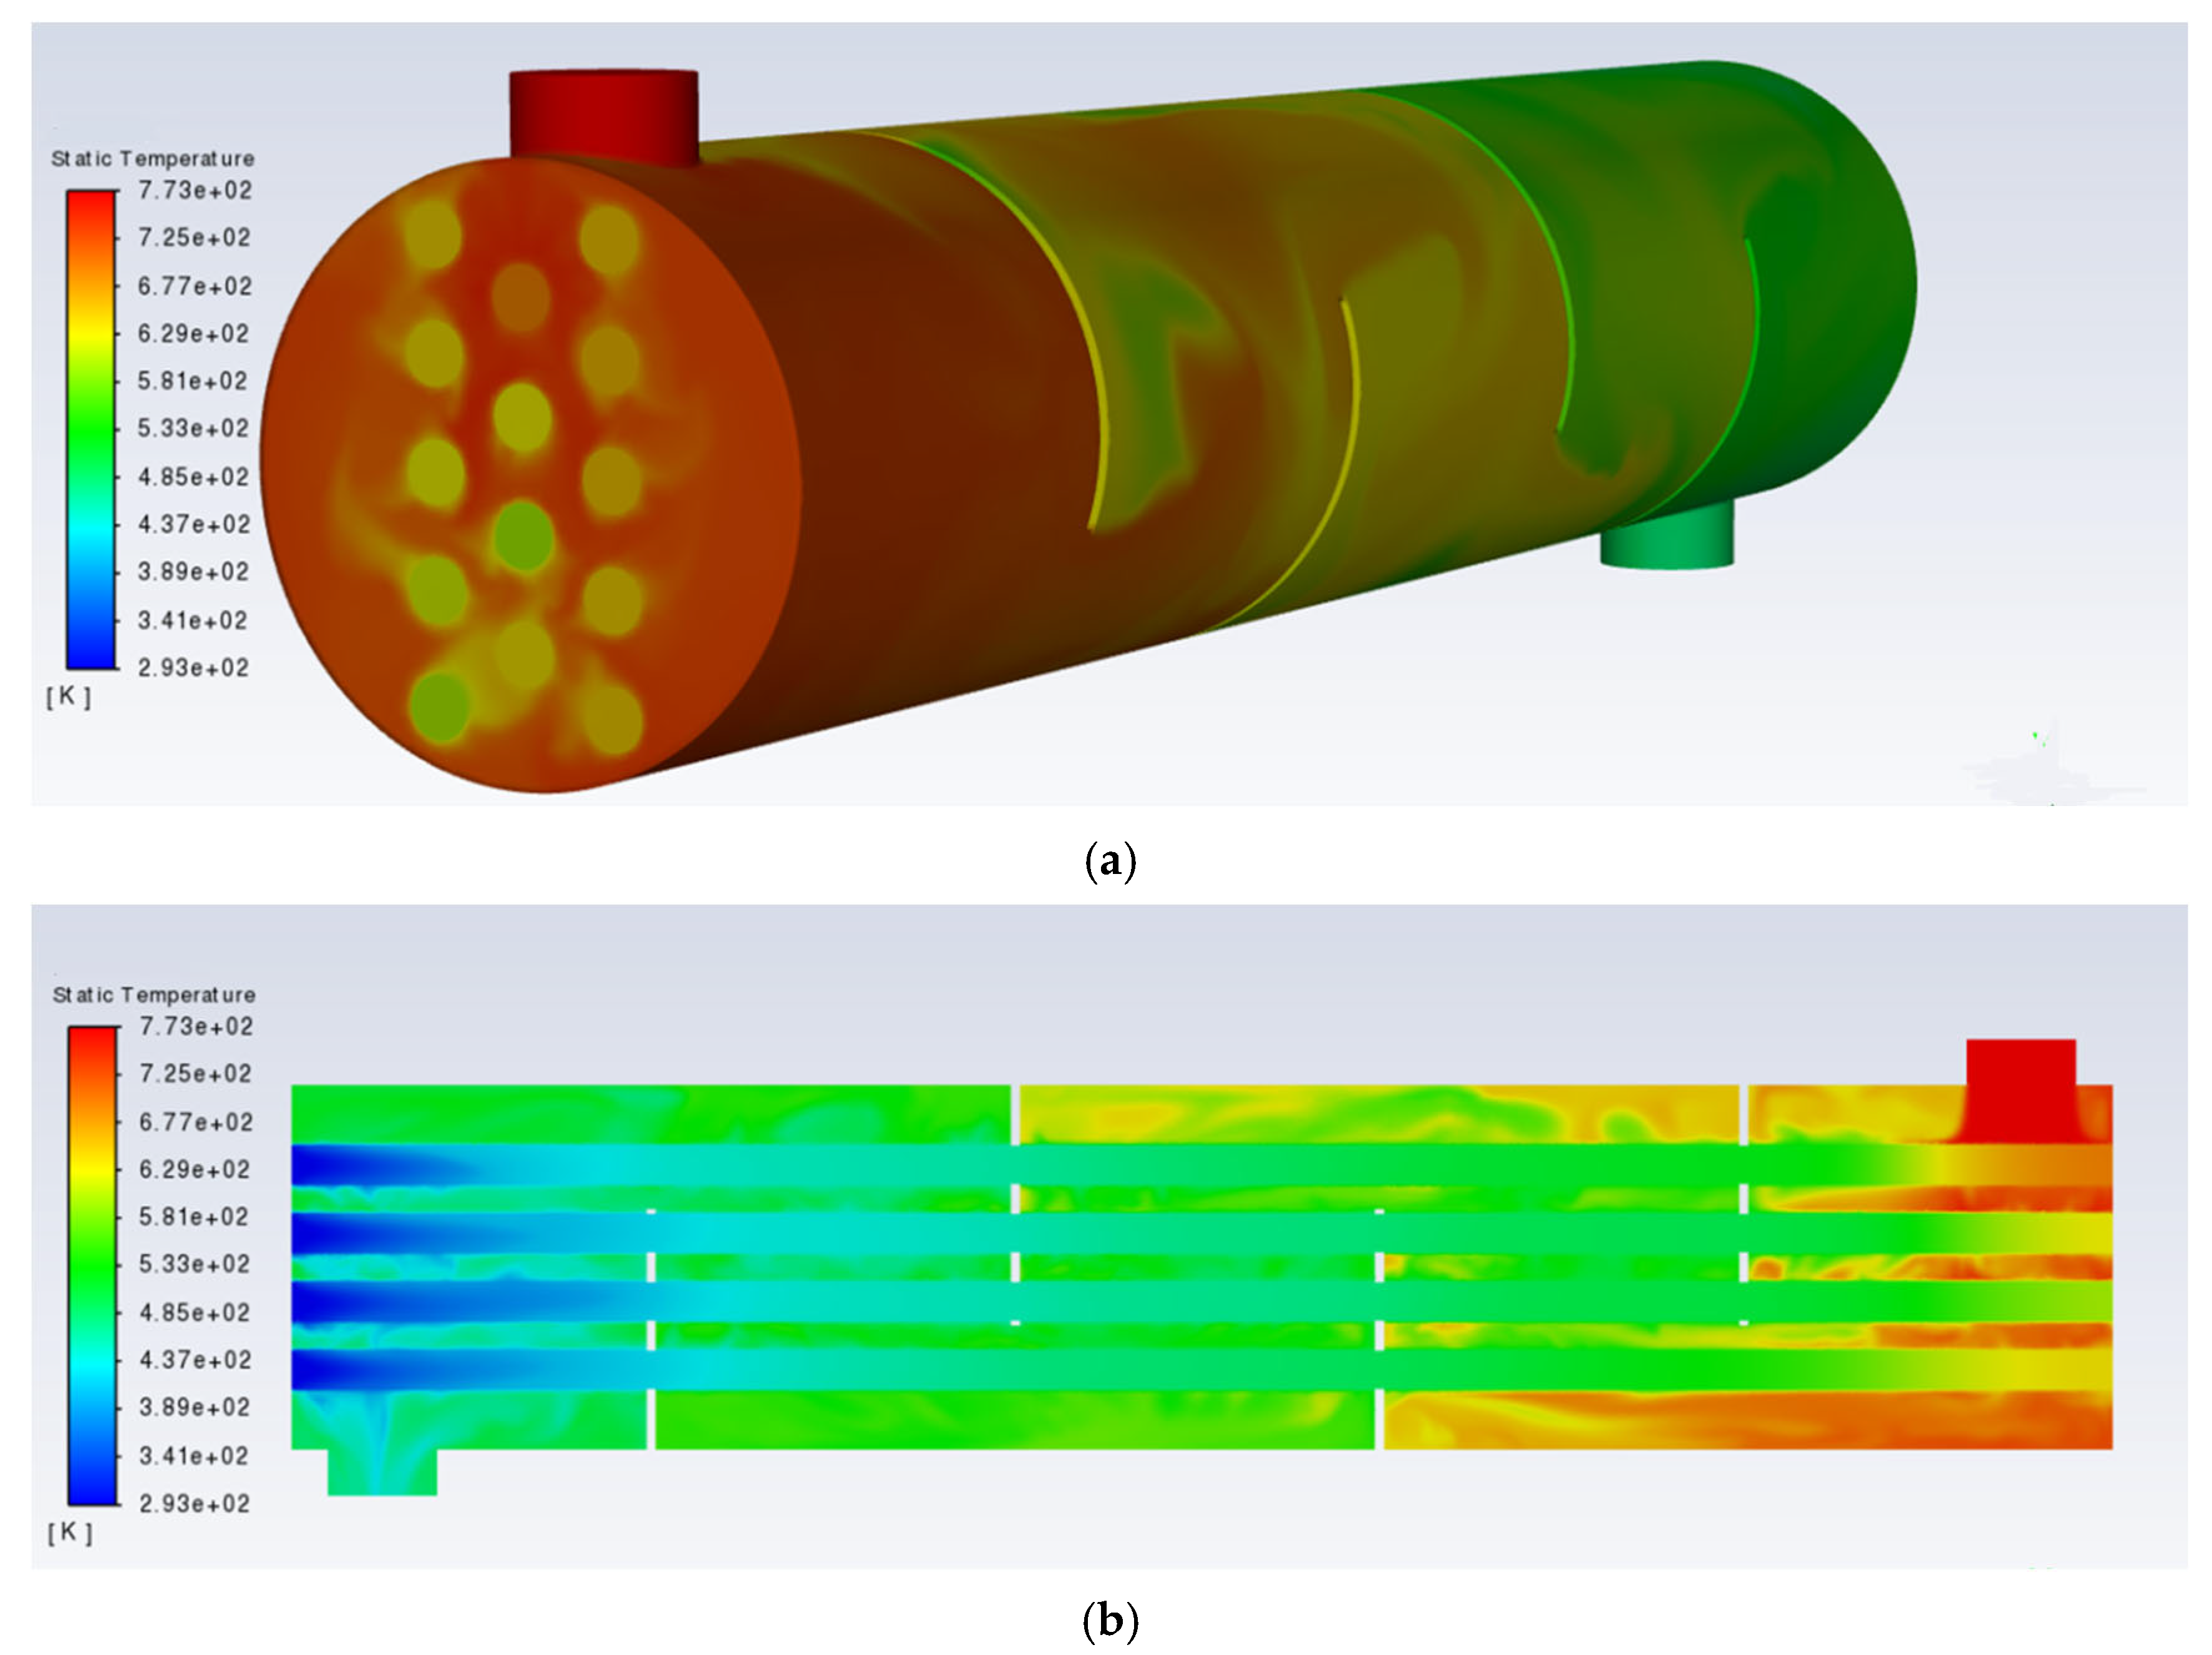
The overall temperature distribution of the evaporator after calculation is shown in Figure 7a. To more clearly present the overall temperature distribution inside the evaporator, the central plane of the evaporator was selected, and its temperature distribution is shown in Figure 7b. It can be seen that the H2SO4 evaporator performs well in heat exchange, with the temperature of the hot air dropping from 773.15 K to 461.59 K, and the temperature of the H2SO4 rising from 293.15 K to an average of 641.44 K. The boiling point of sulfuric acid is a maximum of 603.15 K, so it can be concluded that the sulfuric acid in the evaporator fully boiled under the designed operating conditions. Using Fluent’s built-in surface integration function, the heat exchange power of the 14 heat exchange tubes was calculated, with a total heat exchange power of 5041.01 W.
The simulation’s accuracy was validated through energy conservation analysis, comparing heat released by cooling hot air, heat absorbed by H2SO4 during heating/vaporization, and the heat exchange tubes’ power. Using Aspen Plus, the thermophysical properties of hot air and H2SO4 from the parameter library were used for energy conservation calculations. The calculation results are shown in Table 6. It can be seen that the error calculated using the energy conservation method is within a reasonable range, indicating that the calculation results are reliable and the designed evaporator meets the sulfuric acid gasification requirements.

3.3. HI Decomposer with Heat Recovery Utilization

During early experiments, it was found that activated carbon had poor thermal conductivity, making it difficult for a large flow of HI to achieve both superheating and decomposition within the reactor. Therefore, an evaporator was added before the HI catalytic decomposer to gasify HI, and a superheater was installed to heat HI to the reaction temperature (773.15 K). In previous experiments, the decomposed HI was directly cooled by a cooler, resulting in significant heat loss. In this modification, to verify the feasibility of internal heat recovery, the high-temperature gas from decomposition is used to preheat the HI vapor before entering the superheater. This optimization aims for a hydrogen production rate of 1000 L/h, based on relevant data obtained from prior experiments. The relevant parameters for the HI decomposer are shown in Table 7.
Through thermodynamic calculations, the heat absorption and release for heating the distilled HI solution to 773.15 K and cooling the high-temperature gas from decomposition to 473.15 K were determined, as shown in Table 8.
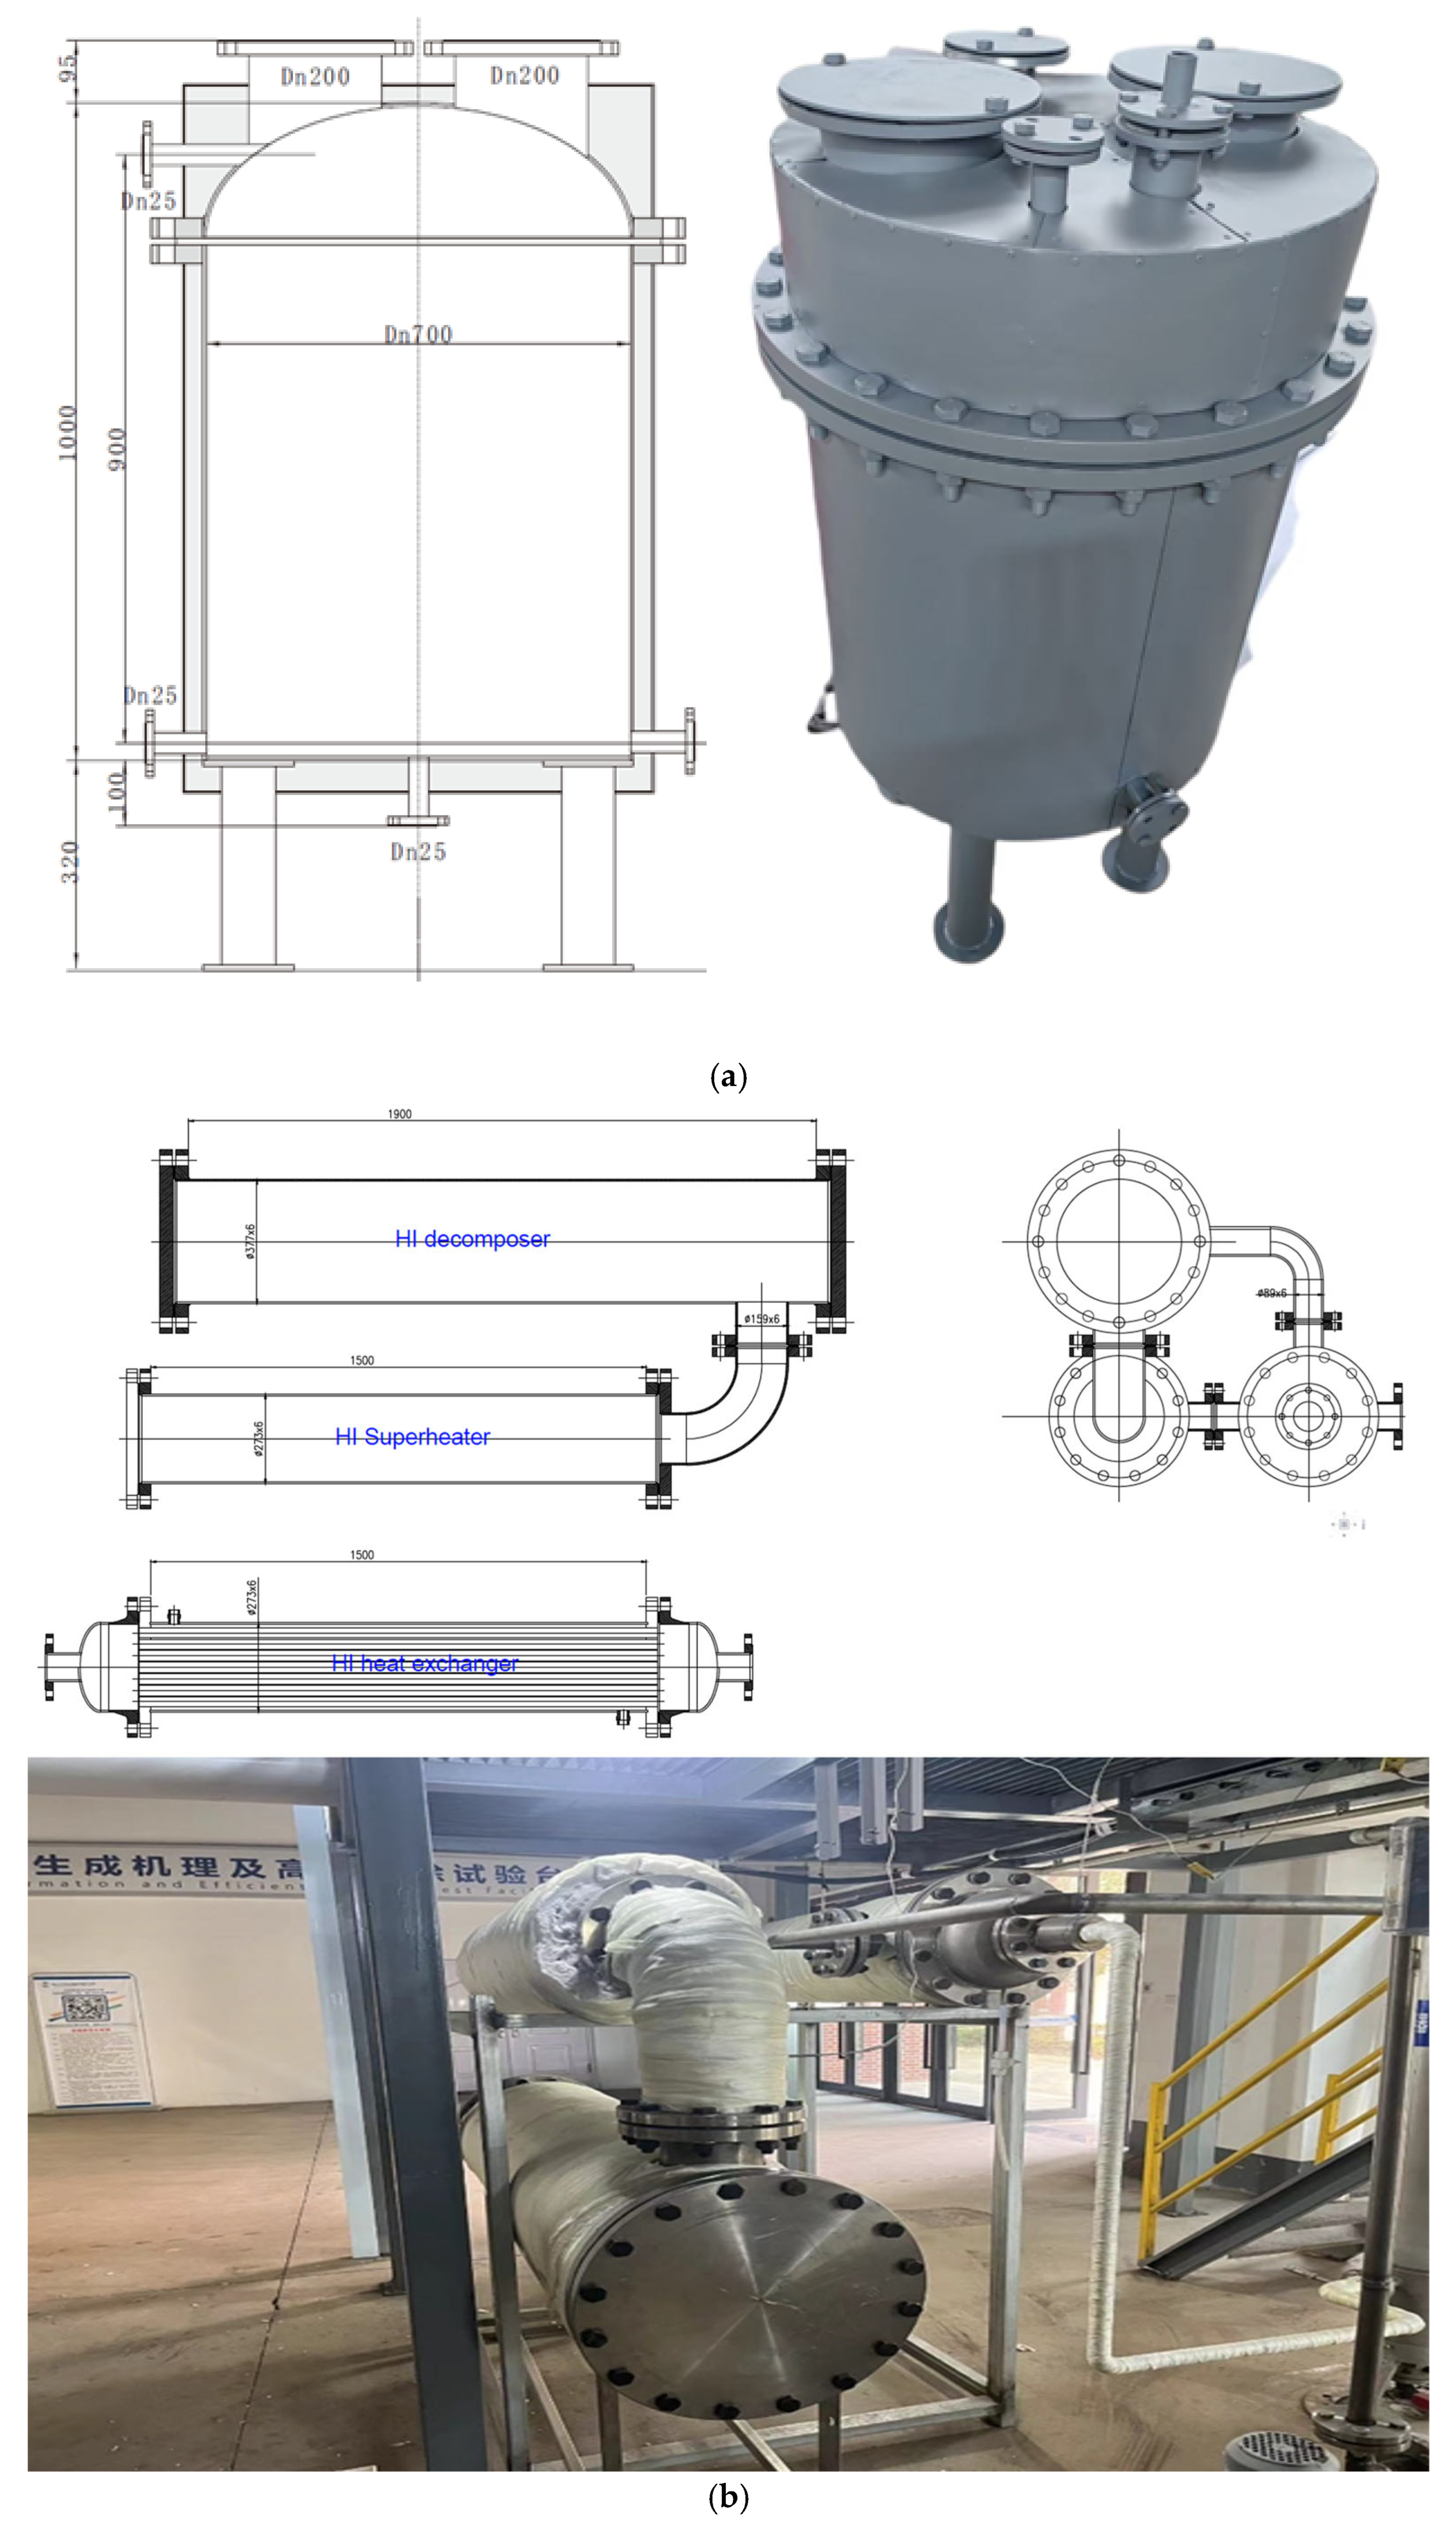
Based on the thermodynamic calculation results, the HI decomposition reaction module was redesigned and manufactured as shown in Figure 8. All equipment is made of TC4 alloy. The distilled HI solution first enters the evaporator from the top. The evaporator has dimensions of Φ700 × 900 mm and is equipped with 54 kW adjustable-power titanium heating rods (108 kW at full load). In the evaporator, the H2 solution undergoes heating and vaporization. The resulting gas then enters the HI shell-and-tube heat exchanger (Φ273 × 1500 mm), where it exchanges heat with the high-temperature gas flow from decomposition, heating the HI to about 653.15 K. The fluid then enters a Φ273 × 1500 mm superheater to heat to the required decomposition temperature of 773.15 K before entering the catalytic decomposition reactor filled with an activated carbon-based catalyst, where it decomposes to produce H2 and I2. The dimensions of the catalytic decomposer are Φ377 × 1900 mm. The generated products and undecomposed HI solution enter the heat exchanger tube side, exchanging heat with the gaseous HI solution in the shell side, cooling to about 473.15 K, and then entering the condenser and gas–liquid separator to produce hydrogen as the product.

4. Experimental Procedure and Results

4.1. Partial Experimental Results and Discussion

After the completion of the Bunsen reaction, a settling process is required to ensure complete phase separation. This settling time is particularly important for the iodine–sulfur hydrogen production system, as it is closely related to the stable operation of the system and hydrogen production rate. First, the molar ratio of the materials (H2SO4:HI:I2:H2O = 1:2:2:12) is fixed, followed by precise metering and transfer to the reaction vessel. The external circulation pump is then activated. When the four-component mixed solution reaches 85 °C, the circulation pump is turned off, and the valve at the bottom of the Bunsen reaction tank is opened to release it into the liquid–liquid separation tank for gravity-driven separation. Samples were collected every 10 min over a 30 min period and analyzed via potentiometric titration. Figure 9 shows the trend of the H2SO4 phase component concentrations in the liquid–liquid separation tank over time. After 25 min of settling, the component concentrations stabilize and remain almost constant. At this point, the upper-phase ratio is H2SO4:HI:I2:H2O = 4.29:0.37:0.098:28.145, and the concentration of H2SO4 is approximately 42 wt%. This phenomenon indicates that, under optimal molar ratios, the mixed solution can quickly achieve phase stratification, and as time progresses, the component concentrations stabilize. Therefore, the settling time for phase separation in the subsequent full-process pilot will be set to 25 min.
During the experiment, the concept of purification efficiency was introduced to assess the purification effect. For the purification of the HIx phase, the purification rate of the HIx phase was obtained by measuring the concentration of sulfuric acid before and after purification. The calculation formula is as follows:
δ = C 0 C f C 0 × 100 %
where C 0 represents the initial concentration of impurities before purification, and C f represents the concentration of remaining impurities after purification.
Due to the low sulfuric acid content and high iodine and water content in the HIx phase, a slight reverse reaction occurs at 97 °C, while a side reaction involving the formation of sulfur occurs after 107 °C [26]. Based on these findings, during the operation of the HIx phase purification tower, the reaction temperature was set to 97 °C. Under these conditions, a four-component mixed solution with a total material molar ratio of H2SO4:HI:I2:H2O = 1:2:2:12 was selected as the research object. After phase separation, the lower-phase HIx phase material had a molar ratio of H2SO4:HI:I2:H2O = 0.13:1.56:2.62:6.81. The trend of the HIx phase purification rate in the experiment over time is shown in Figure 10. The purification efficiency of HI increased with time, reaching 88% after a residence time of 120 min, which essentially meets the requirements.
During the HI distillation operation, the purified HIx phase mixture, as described above, was used as the research object. After purification, the molar ratio of H2SO4:HI:I2:H2O in the HIx phase material was 0.025:0.61:2.2:6.1. A feeding flow rate of 1 L/min was used, and by properly controlling the reboiler discharge flow, reflux ratio, tower temperature, and other factors, a continuous and stable HI output was eventually achieved. Given that HI is the key product required for distillation, the separation capacity of the top and reboiler of the column was characterized using two parameters: the molar ratio of I2 to HI and the molar ratio of H2O to HI [27]. The trend of the molar ratio of each component at the distillation column top and the HI mass fraction over time are shown in Figure 11. Initially, the HI mass fraction in the distillate at the top of the column was low, as the initial HI solution was dilute, and water, the lighter component, evaporated first. As the concentration of HI in the reboiler gradually increased, the amount of HI distilled out also increased, and the separation efficiency of the top and reboiler approached stability, with the I2/HI ratio around 0.139 and the H2O/HI ratio around 9.54. Additionally, as time progressed, the distillation time became longer, and the concentration of HI in the distillate increased, eventually stabilizing at 38.1%.
After adding an enamel-lined H2SO4 evaporator and an HC276 alloy H2SO4 superheater with 70 wt% H2SO4 for the experiment, the H2SO4 solution entered the evaporator at a flow rate of 3.41 L/h, where it was heated and boiled. The gaseous H2SO4 was then further heated in a superheater containing silicon carbide balls to 850 °C, where it decomposed into SO3 and H2O. Subsequently, the gaseous SO3 and H2O entered the decomposer, which contained an iron oxide-based catalyst, and decomposed into SO2 and O2. After the reaction, all gases entered the condenser for cooling. The cooled exhaust gas was absorbed by a two-stage NaOH scrubber, and the remaining O2 was measured with a gas flow meter. The oxygen production rate and temperatures of each part are shown in Figure 12. During the experiment, as the process continued, the temperatures of the key components gradually increased, and the oxygen production rate also increased. At 300 min, the inlet temperature of the superheater was 150.8 °C, the reactor inlet temperature was 894.3 °C, the reactor outlet temperature was 696.7 °C, and the oxygen production rate was about 356.4 L/h, which corresponded to a sulfuric acid decomposition rate of about 81.5%.

4.2. Continuous Hydrogen Production Testing

After the individual module tests mentioned above, a 24 h continuous closed-loop iodine–sulfur cycle hydrogen production experiment was conducted in January 2025. The integrated test bench was equipped with a spray cleaning system and a smoke alarm system to address acid corrosion risks and gas leakage hazards, respectively. This setup ensures safe operation by neutralizing residual corrosive substances and providing early warnings for potential gas-related emergencies. Following the experimental conditions used in 2021, the molar ratio of H2SO4:HI:I2:H2O was set to 1:2:2:12. Two identical batches of materials were prepared containing 10.765 kg of H2SO4 (98 wt%), 50 kg of HI (57 wt%), 54.5 kg of I2, and 0.5 kg of H2O. These batches were added to the Bunsen reactor. While the first batch underwent static separation in the liquid–liquid separation tank, the second batch was introduced into the Bunsen reactor for the reaction, thereby ensuring continuous operation. After phase separation, the upper sulfuric acid phase and lower iodic acid phase solutions were first sent to the purification tower and then to the distillation column to obtain high-concentration H2SO4 and HI solutions.
The temperatures of various components in the HI decomposition module during the entire pilot test are shown in Figure 13, where T1 represents the evaporator outlet temperature, T2 represents the heat exchanger outlet temperature, T3 represents the superheater outlet temperature, and T4 represents the reactor outlet temperature. The hydrogen production rate, purity, and HI decomposition rate are shown in Figure 14. In this pilot test, the HI solution first entered the evaporator at a rate of 200 L/h. The HI vapor was then superheated and decomposed in the catalytic decomposition reactor, ultimately reaching a peak hydrogen production rate of approximately 1536 L/h. To match the hydrogen production rate, the H2SO4 solution was fed at a rate of 6.68 L/h and subsequently decomposed in the catalytic decomposition reactor. Later, due to the relatively low power of the HI condenser and superheater, the inlet temperature of the catalytic decomposition reactor gradually decreased. Consequently, the HI solution feed rate was reduced to 27 L/h to the evaporator. The system ran continuously for 24 h, with a stable hydrogen production rate of approximately 300 L/h.
Following a reduction in feed rate, a significant increase in the superheater outlet temperature was observed. At the same time, the HI decomposition rate increased due to the higher inlet temperature. Initially, because the system had not yet stabilized, the HI that had previously remained in the reactor continued to decompose. This led to an initially high decomposition rate, which then gradually decreased to a stable value.
As shown in Figure 14, after 18 h of continuous operation, as the concentration of HI solution entering the evaporator decreased, the water content increased. When the water content and I2 content in the solution increase, according to the Le Chatelier principle, it will hinder the forward progress of the reaction, resulting in a decrease in decomposition rate. However, throughout the operation, the hydrogen purity gradually increased and eventually reached 98.75%. Subsequently, a gas analyzer was used to analyze the gas composition, revealing small amounts of CO and CH4. This was due to the external wall heating method used in the reactor, which caused localized high temperatures near the wall, leading to a certain degree of water–gas shift reaction inside the reactor. Subsequent steps could involve employing pressure swing adsorption (PSA) to remove impurities from hydrogen. Alternatively, in future industrial applications, adopting a shell-and-tube heat exchanger reactor design, where high-temperature heat sources serve as the heat transfer medium, may prevent localized overheating and mitigate the water–gas reaction.
The comparison between the research results of this article and those of previous studies is shown in Table 9 and Figure 15. From the chart in Figure 15, it can be seen that the hydrogen production rate obtained in this study is the highest globally, which has important guiding significance for the industrial application of thermochemical iodine–sulfur cycle water-splitting hydrogen production technology. In contrast to mainstream electrolytic water-splitting hydrogen production technologies, which suffer from high electrical energy consumption and low overall thermo-electric–hydrogen conversion efficiency (~30%), the I-S thermochemical hydrogen production technology enables direct heat-to-hydrogen conversion. This study achieved an overall thermal efficiency of 53%. Furthermore, the technology is compatible with nuclear energy, solar energy, and industrial waste heat, making it suitable for large-scale industrial green hydrogen production. However, challenges such as low HI decomposition rates and the selection of high-temperature corrosion-resistant materials currently limit its readiness for industrial adoption, keeping the technology in the pre-industrial stage.

5. Conclusions and Outlook

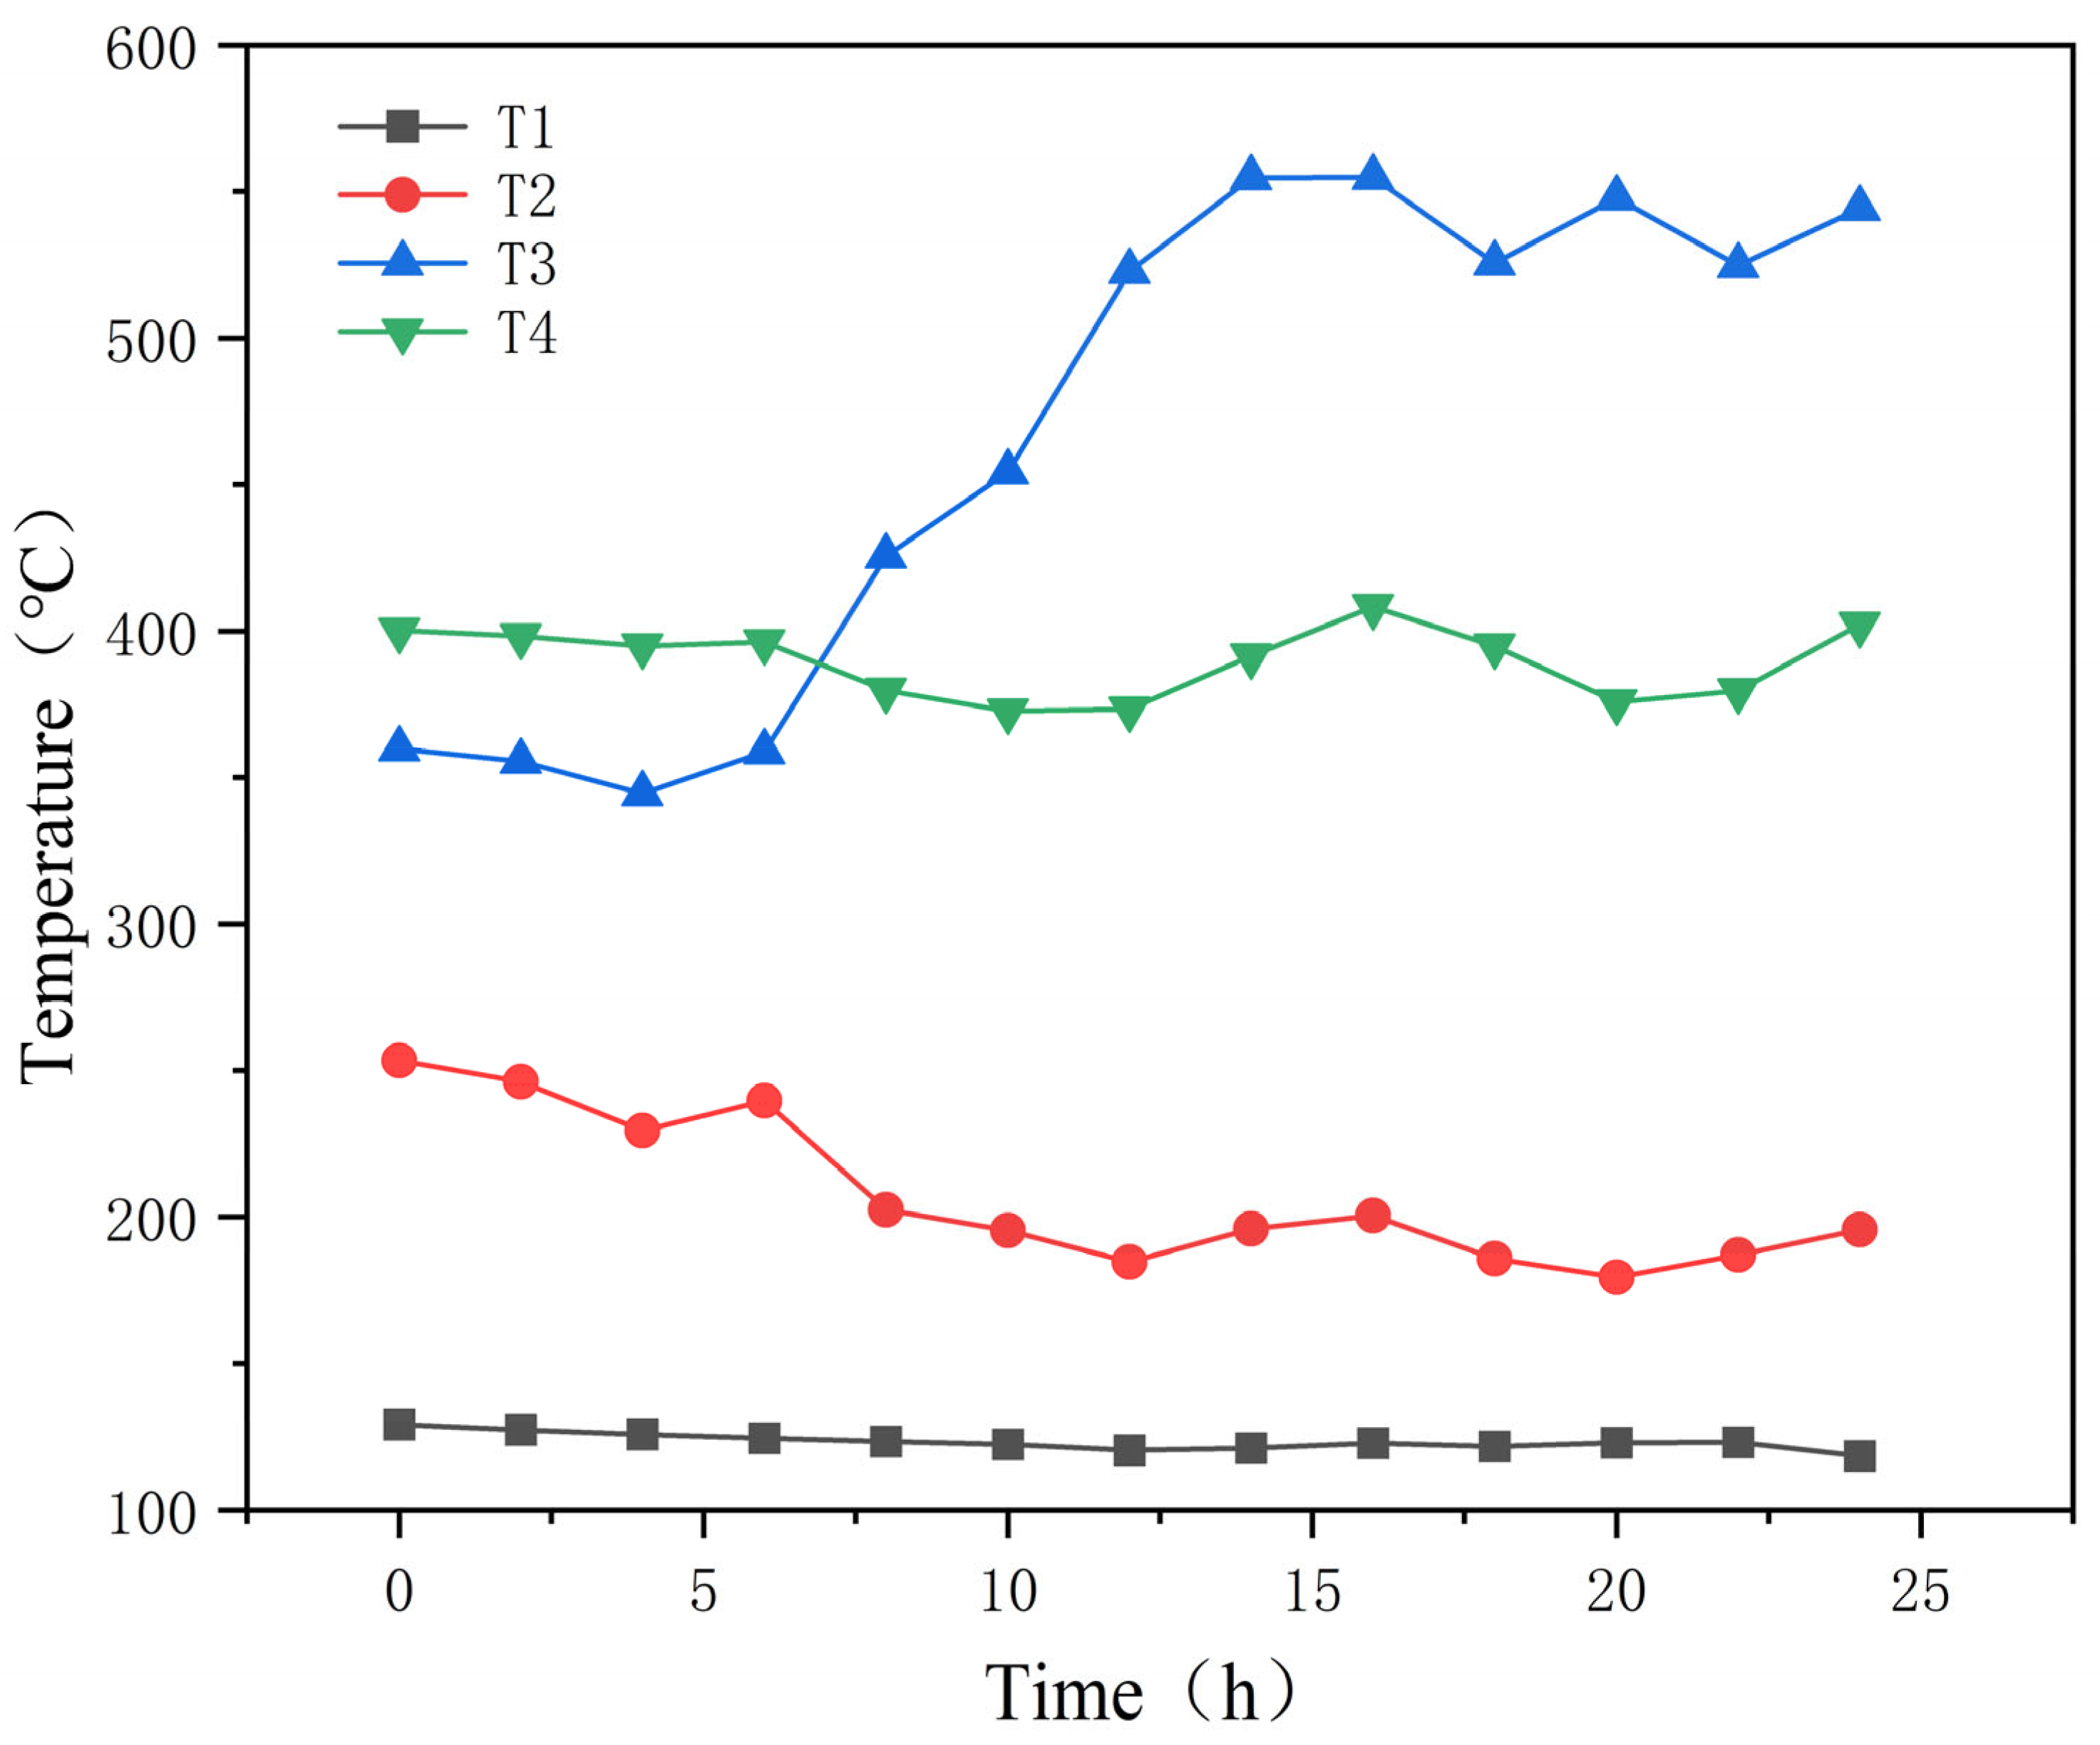
This paper details the optimization of traditional thermochemical iodine–sulfur cycle water-splitting hydrogen production technology. It introduces the concept of a small cycle, which enhances the thermal efficiency of hydrogen production to 53% under conditions where the electrical energy conversion efficiency is 40%. Based on this optimization, the hydrogen production pilot platform at Qingshan Lake Energy Research Base of Zhejiang university was modified. To address the corrosion problem during sulfuric acid evaporation, an innovative three-stage H2SO4 reactor was developed and validated through CFD simulations, preventing the corrosive issues that occur during high-temperature H2SO4 decomposition. A heat recovery-utilizing HI decomposition reactor was adopted to improve heat recovery efficiency and increase hydrogen production efficiency. Subsequently, in January 2025, a successful 24 h thermochemical iodine–sulfur cycle hydrogen production test was conducted, with a peak hydrogen production rate of 1536 L/h, stabilizing at approximately 300 L/h in the long term.
In future industrialization processes, the use of electric heating elements in small-scale and pilot tests is not advisable. The standard for industrialization is to use actual high-temperature heat sources for heat exchange. Therefore, the development of reactors for high-temperature actual heat source heat exchange and the design of fully industrial automation control are future research directions.

Author Contributions

Conceptualization, Z.W. and Y.H.; methodology, W.S. and W.W.; software, W.S.; validation, W.W.; formal analysis, J.Z. (Jinxu Zhang) and J.Z. (Junjie Zeng); investigation, J.Z. (Jinxu Zhang), J.Z. (Junjie Zeng) and W.S.; resources, W.W.; data curation, J.Z. (Jinxu Zhang) and J.Z. (Junjie Zeng); writing—original draft preparation, J.Z. (Jinxu Zhang); writing—review and editing, Z.W.; visualization, Z.W.; supervision, Y.H. and Z.W.; project administration, Y.H. and Z.W.; funding acquisition, Y.H. All authors have read and agreed to the published version of the manuscript.

Funding

This work was supported by the National Natural Science Foundation of China (52125605) and the Fundamental Research Funds for the Central Universities (2022ZFJH04).

Institutional Review Board Statement

Not applicable.

Informed Consent Statement

Not applicable.

Data Availability Statement

The original contributions presented in this study are included in the article. Further inquiries can be directed to the corresponding author.

Acknowledgments

Thank you to Mingyang Li and Xiaoding Wang from Dongfang Electric Co., Ltd., for their support of this project work.

Conflicts of Interest

The authors declare no conflicts of interest.

References

  1. BP. Statistical Review of World Energy: London. 2024. Available online: https://www.energyinst.org/statistical-review (accessed on 6 February 2025).
  2. Global Hydrogen Review. 2024. Available online: https://www.iea.org/reports/global-hydrogen-review-2024 (accessed on 6 February 2025).
  3. Nikolaidis, P.; Poullikkas, A. A comparative overview of hydrogen production processes. Renew. Sustain. Energy Rev. 2017, 67, 597–611. [Google Scholar]
  4. Acar, C.; Dincer, I. Comparative assessment of hydrogen production methods from renewable and non-renewable sources. Int. J. Hydrogen Energy 2014, 39, 1–12. [Google Scholar] [CrossRef]
  5. Acar, C.; Dincer, I. Review and evaluation of hydrogen production options for better environment. J. Clean. Prod. 2019, 218, 835–849. [Google Scholar] [CrossRef]
  6. Giaconia, A.; Lanchi, M.; Tarquini, P.; Liberatore, R.; Grena, R. Hydrogen Production by Means of S-I Thermochemical Cycle Powered by Combined Solar-fossil Energy. In Proceedings of the Spring National Meeting, Atlanta, GA, USA, 10–14 April 2005. [Google Scholar]
  7. Liberatore, R.; Caputo, G.; Favuzza, P.; Felici, C.; Tarquini, P. Hydrogen Production by Sulphur Iodine Cycle Fed by Solar Energy: Realization of a Laboratory Plant and Possible Spin-off On the Industrial Field. In Proceedings of the 2009 AIChE Annual Meeting, Nashville, TN, USA, 8–13 November 2009. [Google Scholar]
  8. Norman, J.H.; Besenbruch, G.E.; Brown, L.C.; OKeefe, D.R.; Allen, C.L. Thermochemical Water-Splitting Cycle, Bench-Scale Investigations, and Process Engineering. Final Report, February 1977–December 31, 1981; General Atomics: San Diego, CA, USA, 1982. [Google Scholar]
  9. Russ, B.; Buckingham, R.; Brown, L.; Moore, R.; Helie, M.; Carle, P.; Pons, N.; Ode, D.; Duhamet, J.; Leybros, J. Summary of the sulfur-iodine process integrated laboratory-scale experiment. Nucl. Technol. 2012, 178, 94–110. [Google Scholar] [CrossRef]
  10. Liberatore, R.; Caputo, G.; Felici, C.; Spadona, A. Demonstration of Hydrogen Production by the Sulphur-Iodine Cycle: Realization of a 10 NL/h Plant. In Proceedings of the WHEC, Essen, Germany, 16–21 May 2010. [Google Scholar]
  11. Felici, C.; Caputo, G.; Liberatore, R.; Favuzza, P.; Tarquini, P. Completion and Operation of the thermo-chemical water splitting sulfur iodine process in a lab scale plant for a continuous hydrogen production. Clean Technol. 2014. Available online: https://briefs.techconnect.org/wp-content/volumes/Cleantech2010/pdf/250.pdf (accessed on 6 February 2025).
  12. Nakajima, H.; Ikenoya, K.; Onuki, K.; Shimizu, S. Closed-cycle continuous hydrogen production test by thermochemical IS process. Kagaku Kogaku Ronbunshu 1998, 24, 352–355. [Google Scholar] [CrossRef]
  13. Kubo, S.; Nakajima, H.; Kasahara, S.; Higashi, S.; Masaki, T.; Abe, H.; Onuki, K. A demonstration study on a closed-cycle hydrogen production by the thermochemical water-splitting iodine-sulfur process. Nucl. Eng. Des. 2004, 233, 347–354. [Google Scholar] [CrossRef]
  14. Kasahara, S.; Iwatsuki, J.; Takegami, H.; Tanaka, N.; Noguchi, H.; Kamiji, Y.; Onuki, K.; Kubo, S. Current R&D status of thermochemical water splitting iodine-sulfur process in Japan Atomic Energy Agency. Int. J. Hydrogen Energy 2017, 42, 13477–13485. [Google Scholar]
  15. Noguchi, H.; Takegami, H.; Kamiji, Y.; Tanaka, N.; Iwatsuki, J.; Kasahara, S.; Kubo, S. R&D status of hydrogen production test using IS process test facility made of industrial structural material in JAEA. Int. J. Hydrogen Energy 2019, 44, 12583–12592. [Google Scholar]
  16. Kamiji, Y.; Noguchi, H.; Takegami, H.; Tanaka, N.; Iwatsuki, J.; Kasahara, S.; Kubo, S. Reliability improvements of corrosion-resistant equipment for thermochemical water splitting hydrogen production iodine-sulfur process. Nucl. Eng. Des. 2020, 361. [Google Scholar] [CrossRef]
  17. Takegami, H.; Noguchi, H.; Tanaka, N.; Iwatsuki, J.; Kamiji, Y.; Kasahara, S.; Imai, Y.; Terada, A.; Kubo, S. Development of strength evaluation method of ceramic reactor for iodine-sulfur process and hydrogen production test in Japan Atomic Energy Agency. Nucl. Eng. Des. 2020, 360, 110498. [Google Scholar] [CrossRef]
  18. Hiroki, N.; Yu, K.; Nobuyuki, T.; Hiroaki, T.; Jin, I.W.; Seiji, K.; Myagmarjav, O.; Yoshiyuki, I.; Shinji, K. Hydrogen production using thermochemical water-splitting Iodine-Sulfur process test facility made of industrial structural materials: Engineering solutions to prevent iodine precipitation. Int. J. Hydrogen Energy 2021, 46, 22328–22343. [Google Scholar] [CrossRef]
  19. Zhang, P.; Chen, S.Z.; Wang, L.J.; Xu, J.M. Overview of nuclear hydrogen production research through iodine sulfur process at INET. Int. J. Hydrogen Energy 2010, 35, 2883–2887. [Google Scholar] [CrossRef]
  20. Zhang, P.; Chen, S.Z.; Wang, L.J.; Yao, T.Y.; Xu, J.M. Study on a lab-scale hydrogen production by closed cycle thermo-chemical iodine-sulfur process. Int. J. Hydrogen Energy 2010, 35, 10166–10172. [Google Scholar] [CrossRef]
  21. Zhang, P.; Zhou, C.L.; Guo, H.F.; Chen, S.Z.; Wang, L.J.; Xu, J.M. Design of integrated laboratory-scale iodine sulfur hydrogen production cycle at INET. Int. J. Energy Res. 2016, 40, 1509–1517. [Google Scholar] [CrossRef]
  22. Zhang, P.; Wang, L.J.; Chen, S.Z.; Xu, J.M. Progress of nuclear hydrogen production through the iodine-sulfur process in China. Renew. Sustain. Energy Rev. 2018, 81, 1802–1812. [Google Scholar]
  23. Ling, B.; He, Y.; Wang, L.J.; Zhu, Y.Q.; Zhang, Y.W.; Wang, Z.H. Introduction and preliminary testing of a 5 m3/h hydrogen production facility by Iodine-Sulfur thermochemical process. Int. J. Hydrogen Energy 2022, 47, 25117–25129. [Google Scholar] [CrossRef]
  24. Murphy, J.E.; OConnell, J.P. A properties model of the HI-I2-H2O-H2 system in the sulfur-iodine cycle for hydrogen manufacture. Fluid Phase Equilibria 2010, 288, 99–110. [Google Scholar] [CrossRef]
  25. Brown, L.C.; Lentsch, R.D.; Besenbruch, G.E.; Schultz, K.R.; Funk, J.E. Alternative Flowsheets for the Sulfur-Iodine Thermochemical Hydrogen Cycle; General Atomics: San Diego, CA, USA, 2003. [Google Scholar]
  26. Zhu, Q.; Zhang, Y.; Ying, Z.; Zhou, J.; Wang, Z.; Cen, K. Occurrence of the Bunsen side reaction in the sulfur-iodine thermochemical cycle for hydrogen production. J. Zhejiang Univ. Sci. A 2013, 14, 300–306. [Google Scholar] [CrossRef]
  27. Zhang, J.; Ling, B.; He, Y.; Zhu, Y.; Wang, Z. Experimental Study of the Characteristics of HI Distillation in the Thermochemical Iodine–Sulfur Cycle for Hydrogen Production. Processes 2024, 12, 1768. [Google Scholar] [CrossRef]
Figure 1. Process flow diagram of the thermochemical iodine–sulfur cycle water splitting hydrogen production system.
Applsci 15 05183 g001
Figure 2. A schematic diagram of the pilot test platform after renovation.
Applsci 15 05183 g002
Figure 3. H2SO4 evaporator: (a) conceptual images; (b) physical images.
Applsci 15 05183 g003
Figure 4. Three-stage H2SO4 decomposition reactor.
Applsci 15 05183 g004
Figure 5. Calculation model of H2SO4 evaporator.
Applsci 15 05183 g005
Figure 6. Grid independence verification.
Applsci 15 05183 g006
Figure 7. Temperature cloud map distribution: (a) Overall distribution; (b) Central section distribution.
Applsci 15 05183 g007
Figure 8. HI decomposition reaction module: (a) evaporator; (b) catalytic decomposition reactor with heat recovery.
Applsci 15 05183 g008
Figure 9. The trend of changes in the concentration of each component in the upper H2SO4 phase over time.
Applsci 15 05183 g009
Figure 10. Performance results of HI purification tower.
Applsci 15 05183 g010
Figure 11. Trends in the concentrations of various components and HI mass fractions at the top of the distillation tower.
Applsci 15 05183 g011
Figure 12. Key component temperature and O2 production rate of three-stage H2SO4 decomposition reactor.
Applsci 15 05183 g012
Figure 13. The temperatures of various components in the HI decomposition module during continuous operation of the system.
Applsci 15 05183 g013
Figure 14. The hydrogen production, purity, and decomposition rates during continuous operation of the system.
Applsci 15 05183 g014
Figure 15. Comparison of I-S hydrogen production in various research institutions (hydrogen production volume, running time).
Applsci 15 05183 g015
Table 1. The stream parameters of the system.
StreamTemperature (K)Pressure (atm)Composition Mole Flow (mol/h)
HII2H2OSO2SO2H2O2
1390.151222.7113290.6944716.498031.5968300
2390.151222.7113290.6944716.4980000
3384.0831446.478218.16078325.52610000
4773.151446.478218.16078325.52610000
5773.151357.182562.80853325.52610044.642860
6389.7021579.9008353.5021042.0110044.642860
7353.1512.76960.478317114.060546.07308000
8418.15101.863118116.8344.688491.38480200
9418.15101.863118116.8344.68849000
10405.841133.4239335.9061820.15870.046538000
11423101.29584713.1541744.64187000
12389.7021579.9008353.5021042.0110000
15389.70210000044.642860
16423100.567272103.67590.046538000
17353.1519.8914351.70828407.3578164.547000
18353.1517.1218251.22996293.2986118.4739000
19353.151285.9051259.0979653.306931.59683000
20393.151357.189262.80622325.50990044.642860
21398.263101.29584737.9252663.77546000
221123.15101.29584737.9252663.77546000
231123.15101.29584782.5681219.1326144.64286022.32143
24353.15101.29584782.5681219.1326144.64286022.32143
25405.3521133.4239335.3406716.48480000
26303.1510044.648810000
27353.1510024.7710619.13356000
28353.15101.29584757.79762044.64286022.32143
29353.151133.4239335.9061820.15870.046538000
30353.151133.4312337.1991823.40610.058287000
31313.151000044.6428600
32390.151000031.5968300
33418.15100001.38480200
Table 2. Heat and electric energy demands of the system.
ItemHeat—Original (kJ) [23] Heat—Update (kJ)Electric—Original (kJ) [23]Electric—Update (kJ)
HI distillation37,78041,775.35
HI decomposition31752797.8
H2SO4 distillation21,81013,374
H2SO4 decomposition74,61044,226.7
Pump 66956695
Table 3. Corrosion resistance of materials.
SampleCorrosion Rate (Gaseous HI)
/mm/a
Corrosion Rate (Gaseous H2SO4)
/mm/a
Corrosion Rate (Phase Transition H2SO4)/mm/a
HC276−0.01670.14495.6627
HC20000.01710.15955.8633
HB-30.00530.23115.4791
TC4−0.03225.724011.5554
TA2−0.0107−0.741011.0722
Monel4000.2727−2.27565.0259
Inconel6010.05970.15536.5753
Inconel6900.92760.07606.0625
Inconel6170.39980.12178.1631
SiC//0.0287
Al2O3//0.1349
WC//0.0239
Table 4. Heat exchange tube parameters.
ParameterUnitValue
Thermal conductivity of enamelW/(m·K)0.6
Enamel thicknessmm1
Thermal conductivity of carbon steelW/(m·K)40
Carbon steel thicknessmm4
Table 5. Boundary conditions.
Inlet Quality Flow Rate (kg/s)Temperature (K)
Hot air inlet0.01521773.15
H2SO4 inlet (one heat exchange tube)0.000181293.15
Table 6. Results of energy conservation calculation.
Power (kW)Deviation from Heat Exchange Tube Power
Heat released by hot air4.991.46%
Heat absorbed by boiling H2SO44.775.92%
Table 7. Relevant parameters of HI decomposer.
ItemUnitValue
HI decomposer reaction temperatureK773.15
HI decomposition conversion rate%20
Mass fraction of HI solution at outlet of distillation tower%38
Density of HI solution at outlet of distillation towerg/cm31.35
Flow rate of decomposition machine HImol/h446.43
Steam flow rate into decomposermol/h5643.74
Decomposer HI flow ratemol/h401.78
H2 flow rate of decomposermol/h44.64
Flow rate of decomposer I2mol/h44.64
H2O flow rate of decomposermol/h5643.74
Table 8. Heat values of absorption and release in each step of HI decomposition process.
ItemValue (kJ/h)Notes
Heat HI distillation solution from 298.15 K to 393.15 K275,189Provided by evaporator
Heat HI-H2O steam from 393.15 K to 653.15 K55,751.3Provided by high-temperature gas after decomposition
HI-H2O steam superheated to 773.15 K27,211.2Provided by superheater
After decomposition, high-temperature gas is cooled to 473.15 K56,682Heat HI-H2O steam at 393.15 K to 653.15 K
Table 9. Comparison of I-S hydrogen production in various research institutions.
InstitutionsYearRunning Time (h)Hydrogen Production Volume (L/h)
GA [8]1981/1.2
JAEA [12]1997481
JAEA [13]200417232
INERI [9]20051810~75
INET [21]2007710
INET [22]20138060
ENEA [11]20144810
JAEA [18]202015030
CEU [23]2021480
CEU (this study)202524300–1536
Disclaimer/Publisher’s Note: The statements, opinions and data contained in all publications are solely those of the individual author(s) and contributor(s) and not of MDPI and/or the editor(s). MDPI and/or the editor(s) disclaim responsibility for any injury to people or property resulting from any ideas, methods, instructions or products referred to in the content.

