Article

Structural Pattern Analysis in Patella vulgata Shells Using Raman Imaging

by
María Gabriela Fernández-Manteca
1,2,
Borja García García
1,2,
Celia Gómez-Galdós
1,2,
Jesús Mirapeix
1,3,
Rosa Arniz-Mateos
4,5,
Asier García-Escárzaga
6,
Igor Gutiérrez-Zugasti
5,
José Francisco Algorri
1,2,3,
José Miguel López-Higuera
1,2,3,
Alain A. Ocampo-Sosa
2,7,8,
Luis Rodríguez-Cobo
1,2,3,*,† and
Adolfo Cobo
1,2,3,†
1
Photonics Engineering Group, Universidad de Cantabria, 39005 Santander, Spain
2
Instituto de Investigación Sanitaria Valdecilla (IDIVAL), 39011 Santander, Spain
3
CIBER de Bioingeniería, Biomateriales y Nanomedicina (CIBER-BBN), Instituto de Salud Carlos III, 28029 Madrid, Spain
4
Leibniz Zentrum für Archäologie (LEIZA), 55116 Mainz, Rhineland-Palatinate, Germany
5
Instituto Internacional de Investigaciones Prehistóricas de Cantabria (IIIPC), Universidad de Cantabria, Gobierno de Cantabria, Grupo Santander, 39005 Santander, Spain
6
Department of Prehistory and Institute of Environmental Science and Technology (ICTA), Universitat Autònoma de Barcelona, 08194 Cerdanyola del Vallès, Spain
7
Servicio de Microbiología, Hospital Universitario Marqués de Valdecilla, 39008 Santander, Spain
8
CIBER de Enfermedades Infecciosas (CIBERINFEC), Instituto de Salud Carlos III, 28029 Madrid, Spain
*
Author to whom correspondence should be addressed.
These authors contributed equally to this work and share senior authorship.
Appl. Sci. 2025, 15(9), 5180; https://doi.org/10.3390/app15095180
Submission received: 24 March 2025 / Revised: 26 April 2025 / Accepted: 2 May 2025 / Published: 7 May 2025
(This article belongs to the Special Issue Novel Laser-Based Spectroscopic Techniques and Applications)

Abstract

:
Patella vulgata shells preserve geochemical and structural variations that can provide insights into past environmental conditions. Their composition, primarily calcium carbonate with organic residues from the biomineralization process, is influenced by external factors, such as sea surface temperature. Raman spectroscopy has emerged as a rapid, non-destructive tool for studying biogenic carbonates, enabling the identification of crystalline phases, organic components, and ion distribution. In this study, Raman imaging was applied to six shell sections of P. vulgata live-collected from Langre Beach in Cantabria, Spain. Spectral data were acquired using a Raman probe with a 532 nm excitation laser, providing high-resolution mapping of structural and compositional features. The analysis revealed spatial variations in mineralogy, organic matrix distribution, and ion incorporation in the calcium carbonate lattice, suggesting patterns originating during shell formation. Notably, the results suggest a consistent relationship between the organic and mineral components of the shells, with carotenoid distribution and carbonate ion substitution in the calcium carbonate lattice following similar growth patterns. These findings highlight the potential of Raman spectroscopy for studying biomineralization processes and the environmental records preserved in marine mollusk shells.

1. Introduction

Mollusk shells are complex biomineralized structures composed primarily of calcium carbonate (CaCO3) and a minor organic matrix of proteins and polysaccharides [1,2]. The organic matrix plays a critical role in regulating crystal nucleation and growth by interacting with dissolved ions, thereby directing the formation of specific mineral phases [3]. In addition to their structural and protective functions, mollusk shells serve as valuable environmental archives, as their mineralogical composition is influenced by genetic and environmental factors, including seawater temperature and ion availability [4]. Because shell deposition is controlled by both biological and environmental processes, these structures preserve essential information about the conditions at the time of their formation, making them indispensable proxies in fields, such as paleoceanography and archaeology [5,6].
Among marine mollusks, Patella vulgata (common limpet) has received particular attention due to its widespread distribution in intertidal zones and frequent occurrence in archaeological sites [7]. The growth of P. vulgata shells is influenced by seasonal variations in environmental conditions, rendering them useful indicators for reconstructing past climates [8,9]. Moreover, the distribution of mineral phases and trace elements within these shells provides insight into both their biomineralization processes and the external conditions during their formation [10,11].
Biogenic calcium carbonate occurs in several polymorphs, with aragonite and calcite being most common in molluscan shells. These minerals exhibit distinct physical and crystallographic properties, which include variations in density, solubility, and mechanical strength [12,13]. Both polymorphs coexist within a single shell, organized in layers or microstructural units (e.g., nacreous or prismatic layers) [12]. The formation pathways leading to aragonite versus calcite depend on biological regulation within the mantle, environmental conditions such as temperature and carbonate ion concentration, and the presence of trace elements that can stabilize one form over the other [14].
In addition to calcium carbonate, mollusk shells contain organic pigments, such as carotenoids, which contribute to their distinctive colors and patterns [15]. The nature and distribution of these pigments can vary within or between species, influenced by both genetic factors and local habitat conditions [16]. These colored macromolecules frequently reside in the organic matrix layers, highlighting the complex interplay between organic and inorganic components during shell formation [17]. In archaeological contexts, shell coloration can degrade over time, but remnants of pigments or their degradation products sometimes persist [18]. Studies on shell pigments have identified variations in spectral signatures linked to different pigment types, allowing the differentiation of species and insights into shell formation processes [17,19,20].
Magnesium (Mg) is a common trace element found in marine carbonates and can significantly affect shell formation. The substitution of Mg2+ for Ca2+ in calcite modifies the crystal lattice and can favor one calcium carbonate polymorph over another [21]. Environmental factors, such as water temperature, salinity, and Mg/Ca ratios in the local habitat, influence how much Mg is incorporated into the developing shell [21,22,23,24]. Experiments and analyses of synthetic carbonates indicate that Mg incorporation alters calcite growth dynamics [25]. Consequently, mapping the distribution of Mg in mollusk shells can reveal subtle patterns in seasonal growth or environmental change, while also helping to interpret shell-based proxies [22].
Traditional analytical techniques have contributed significantly to the study of shell composition but also present certain limitations. X-ray diffraction (XRD) and scanning electron microscopy (SEM) are complementary techniques for material characterization. XRD provides the highly accurate and reliable identification of calcium carbonate polymorphs but is time-consuming and requires extensive sample preparation [26,27]. SEM offers high-resolution imaging and detailed surface characterization; however, it does not directly determine material composition and operates under vacuum conditions [14,28]. Elemental analysis techniques, mainly based on inductively coupled plasma mass spectrometry (ICP-MS), are inherently destructive, as they require the extraction of material along the shell growth axis. Laser-induced breakdown spectroscopy (LIBS), on the other hand, greatly simplifies sample preparation, but it is still quasi-destructive [29,30,31]. Stable isotope analysis offers valuable environmental and biomineralization insights, but it is time-consuming and has less spatial resolution [6,32]. In archaeological research, where sample preservation is crucial, analytical techniques must balance resolution, efficiency, and non-destructive analysis. However, these methods often involve trade-offs between precision, resolution, and preservation, with the challenge of obtaining detailed compositional information while maintaining sample integrity.
Raman spectroscopy is a non-destructive technique that allows for the characterization of both mineralogical and organic components in mollusk shells [20,33,34]. It is based on the inelastic scattering of monochromatic light, where molecular vibrations produce characteristic shifts in the scattered photons, enabling the precise identification of calcium carbonate polymorphs, trace elements, and organic compounds within the shell matrix [35]. Beyond single-point measurements, Raman spectroscopy enables the construction of high-resolution spectral maps, allowing the spatial characterization of compositional variations across different regions of the sample [36]. These maps can be applied to the study of biomineralization processes and the reconstruction of environmental conditions during shell formation [37]. Additionally, it requires minimal preparation, making it suitable for fragile or valuable specimens, particularly in paleontological and archaeological research. Raman spectroscopy is also compatible with portable devices, offering a versatile tool for in situ analysis, which is particularly valuable in field studies [38].
Recent studies have demonstrated the power of Raman imaging in biomineral research. DeCarlo et al. used Raman spectroscopy to investigate marine biocalcification mechanisms in corals, providing insights into the role of amorphous calcium carbonate (ACC) precursors in skeletal growth [37]. Nehrke et al. applied Raman mapping to the Antarctic clam Laternula elliptica, revealing the coexistence of three calcium carbonate polymorphs (aragonite, calcite, and vaterite) within its shell [39]. Badou et al. examined calcite–aragonite interfaces in Haliotis tuberculata using Raman and FTIR imaging, demonstrating the complexity of shell mineralization patterns and highlighting variations in mineral phase distribution between wild and farmed abalones [40]. Similarly, Langer et al. employed Raman spectroscopy to analyze the shell composition of the limpet Patella caerulea, showing that individuals exposed to low-pH environments increase aragonite deposition to counteract dissolution [41]. Stemmer et al. used Raman spectroscopy to map the spatial distribution of carotenoid pigments in the shell of Arctica islandica, revealing their presence not only on the surface but also within the growth layers, indicating a potential involvement in the biomineralization process [36]. These studies underscore the utility of Raman imaging for investigating shell biomineralization and environmental influences.
This study applies Raman imaging to P. vulgata shells to investigate spatial variations in mineralogy, organic matrix distribution, and Mg incorporation. By acquiring high-resolution Raman spectral maps, we aim to characterize the structural and compositional heterogeneity of these shells, providing insights into their formation processes and environmental significance. Understanding the spatial organization of mineral phases and trace elements in P. vulgata shells will contribute to improved interpretations of biomineralization mechanisms and enhance their application as paleoenvironmental proxies.

2. Materials and Methods

This section introduces the growth dynamics and internal structural organization of P. vulgata shells. It also describes the sample preparation, Raman spectroscopy setup, and data processing procedure used to extract structural patterns.

2.1. Growth Variability and Environmental Influence on P. vulgata Shells

P. vulgata is a common intertidal gastropod distributed along the northeast Atlantic, from Norway to the Iberian Peninsula, including parts of the Mediterranean [42]. It can tolerate salinities between 20 and 35 psu and withstand air temperature extremes ranging from −8.7 °C to 42.8 °C, though shell formation primarily occurs under the more stable conditions present when submerged [8]. It is characterized by a consistent return to a fixed resting position (or home scar), promoting localized shell modifications that serve as an archive of the surrounding environmental conditions [43].
Growth rates in P. vulgata vary considerably, driven by seasonal fluctuations, habitat conditions, and hydrodynamic forces. Northern populations typically experience peak growth during early summer, while Mediterranean populations show reduced growth during the warmest months [8]. Reported growth rates range from as little as 0.005 mm to as much as 2.6 mm per month, with notable deceleration during winter and under extreme temperature stress [9,44]. Additionally, shell morphology is strongly influenced by the local environment. Limpets in high-energy zones develop thicker, flatter shells to resist wave forces; whereas, those in calmer habitats produce taller, more streamlined shells [43].
Beyond large-scale environmental factors, microhabitat selection and interspecific competition also influence the distribution and morphology of P. vulgata. Local substrate characteristics, such as surface roughness and thermal properties, influence attachment stability and exposure to environmental stress. For example, limpets often settle on barnacle-encrusted surfaces, which can provide some protection against thermal stress and desiccation [45]. Additionally, competitive interactions with congeners, such as Patella depressa, can affect spatial distribution and reproductive success, particularly in areas where both species coexist [46]. These factors contribute to shell growth in different intertidal environments.

2.2. Shell Structure of P. vulgata

The shell of P. vulgata is composed of distinct layers arranged relative to the myostracum (m), the muscle attachment site within the shell structure. Following the nomenclature established by MacClintock (1967), these layers are classified as m + 1, m + 2, m + 3, etc., extending outward from the myostracum, and m − 1, m − 2, m − 3, etc., positioned inward toward the shell’s interior [47]. The outermost layers, m + 3 and m + 2, primarily consist of calcite, while m + 1, m, and m − 1 are composed of aragonite [8,48]. At the very surface, the shell is covered by the periostracum, a thin protein layer that contains the pigments responsible for external shell coloration [17]. Additionally, it has been observed that the thickness of these layers decreases toward the apex of the shell, except for the innermost layer, which reaches its maximum thickness in this region [48]. The growth lines visible on the shell surface indicate the progressive deposition of new material, reflecting the incremental shell accretion. Cross-sectional analysis along the direction of maximum growth predominantly reveals the m + 2 layer, which is structurally and mineralogically significant in this species [8,49,50], and its isotopic and elemental composition has been successfully correlated with paleoclimatic variables [44,51]. Figure 1 shows the organization of the structural layers in a cross-sectional view of a P. vulgata shell.

2.3. Sample Preparation

Six P. vulgata shells of similar size and preservation were collected from Langre Beach (Cantabria, northern Spain) between November 2011 and August 2012. All selected shells measured 31 ± 3 mm along the cross-section axis. Although individual biological differences can contribute to variability, this sample size was quite suitable to identify representative structural and compositional patterns using Raman imaging in P. vulgata shells. Figure 2a shows the geographical location of Langre Beach and the specific collection site. Immediately after collection, the soft tissues were removed, and the shells were cleaned by immersion in deionized water for 48 h. They were then air-dried at ambient temperature, cleaned in an ultrasonic bath for 5 min, and air-dried again to remove any remaining organic residues. To ensure precise sectioning, each shell was partially coated with metal epoxy resin along the axis of maximum growth (from the anterior to the posterior margin) to prevent breakage. The shells were cut in half along the direction of maximum growth using a IsoMet low-speed saw (Buehler, Lake Bluff, IL, USA) with a diamond wheel, producing clean, thick cross-sections. After sectioning, the metal epoxy resin was removed. Figure 2b depicts a schematic representation of the sectioning process along the growth direction to avoid growth interruptions.
Measurements were taken at the lower part of the cross sections, mainly on the m + 2 and m + 1 layers, according to Figure 1. Figure 2c shows the brightfield images of the analyzed shell areas along with their corresponding sample codes: LAN109, LAN112, LAN183, LAN229, LAN255, and LAN258.

2.4. Raman Spectroscopy Measurements

Raman intensity images can be used for providing a detailed view of the mineralogical composition of cross-sectioned shells, for example highlighting the distribution of aragonite and calcite. In this study, the analysis was focused on the same region of the transverse section in all shells, specifically in the more recent part, without reaching the apex. This region was selected, because the m + 2 layer is expected to be the longest and offers higher temporal resolution, making it particularly relevant for analyzing structural or compositional variations over the limpet’s lifetime, as well as transitions with adjacent layers.
Raman spectra were acquired using a custom setup consisting of a QEPRO spectrometer (Ocean Optics, Orlando, FL, USA), an optical probe (Inphotonics, Norwood, MA, USA), and a 532 nm laser (RGB Laser Systems, Germany). The system was integrated into an in-house automation platform, incorporating a CCD camera equipped with a 10× objective lens (0.26 NA, M Plan Apo NIR, Mitutoyo, Kawasaki, Japan) for precise targeting. This setup provided a spatial resolution of 80 µm. Daily calibration was performed using a silicon wafer.
Data acquisition and processing were managed using custom software developed in MATLAB (licensed version R2023a). The spectrometer, used in combination with a 532 nm excitation laser, covers a Raman shift range of –30 to 2900 cm1. The spectral resolution of the system is 11 cm1. Brightfield images were obtained by stitching multiple fields of view to cover the measurement area. Automated Raman mapping was conducted with a step size of 50 μm between measurements. Each Raman spectrum was acquired as a single 1 s measurement at a laser power of 50 mW. Figure 3 provides a schematic overview of the experimental setup described in this subsection.

2.5. Data Analysis

Data processing and analysis were managed through in-house software developed in MATLAB (licensed version R2023a). First, it is essential to ensure precise estimation of the Raman bands’ height, central wavelength, and spectral width for accurate spectral characterization. To this end, a non-linear least-square fitting algorithm to a Gaussian function was initially implemented. However, due to the iterative and nonlinear nature of the fitting method, occasional artifacts were observed in the processed spectra. Additionally, the computational cost of this approach was high, requiring several hours of processing time per sample on a standard PC. To address these limitations, two fast, non-iterative algorithms were explored, the centroid detection algorithm (CDA) and the linear phase operator (LPO). CDA calculates the center of mass of the Raman peak, providing a computationally efficient means of determining peak positions with high accuracy [52]. LPO, on the other hand, is a high-pass spectral filtering technique combined with linear interpolation to estimate the central wavelength [52]. Both methods were employed to improve peak detection, while significantly reducing processing time.
With the optical setup, the laser line at 532 nm is highly attenuated but still visible in the captured Raman spectrum. This allows for the real-time monitoring of potential laser instability during measurements, with subpixel resolution. Tracking the laser emission wavelength ensures consistency in spectral calibration, minimizing errors due to instrumental fluctuations. LPO and CDA were applied in each measurement to verify laser stability.
The following preprocessing steps were applied to Raman spectra. First, spectra were cropped to the range of 180 to 2800 cm1. Next, electronic noise was subtracted to minimize background interference. Spectra were then examined for saturation levels, and those reaching the detector’s threshold of 65,000 counts were discarded. To correct systematic instrumental variations, normalization was performed using a reference spectrum from a white light source. Baseline correction was then applied using Eilers asymmetric least squares (ALS), with a smoothness parameter of 50 and an asymmetry parameter of 10⁴. Finally, spectra that did not display the characteristic peak at 1085 cm1, which corresponds to the strongest Raman signal of carbonate and should always be present, were removed. This ensured that only valid spectra were retained for further analysis.
Raman maps were generated from preprocessed Raman spectra to analyze the spatial distribution of aragonite, calcite, carotenoids, and carbonate ion substitution in the CaCO3 lattice. Specifically, the presence of aragonite and calcite was determined based on the intensity of characteristic peaks; the 208 cm1 peak served as an indicator of aragonite, while the 280 cm1 peak identified calcite. The sum of the 1130 cm1 and 1521 cm1 bands was used to represent total carotenoid content. This combination provides a more robust signal under variable conditions, maintains a linear relationship with concentration [53], and improves the signal-to-noise ratio compared to using either band individually. Intensity values were expressed in arbitrary units (a.u.), corresponding to the number of detected events (counts) after preprocessing. Variations in carotenoids were further examined by analyzing the shift of the 1521 cm1 band. Finally, carbonate ion substitution in the CaCO3 lattice was estimated by tracking the shift in the central wavenumber of the ν1 band at 1085 cm1. LPO and CDA were also applied during this analysis to ensure the precise determination of peak shifts. All values shown in the maps represent absolute peak positions. Figure 4 provides a schematic overview of the data preprocessing and analysis workflow applied in this study.

3. Results and Discussion

3.1. Laser Wavelength Stability

The stability of the Laser emission wavelength is critical for accurate spectral calibration and reliable Raman mapping over extended measurement periods. Any variation in the laser wavelength can cause spectral shifts that may affect the accuracy of the data collected. To evaluate long-term stability, the central laser wavelength was continuously monitored over a 25 h measurement. This allowed for the continuous monitoring and maintenance of the equipment’s stability throughout the experiment. Figure 5 illustrates the evolution of the laser wavelength using the following two different estimation methods: CDA (Figure 5a) and LPO (Figure 5b).
Both methods indicate a gradual wavelength drift of approximately 0.05 nm, confirming the high stability of the laser source. Despite minor variations, the laser wavelength remains within a narrow spectral range, minimizing systematic errors in spectral calibration and ensuring the reproducibility of Raman measurements.
A systematic offset of approximately 0.2 nm is observed between the two estimation methods, likely due to differences in their mathematical frameworks. Additionally, the LPO method exhibits minor high-frequency fluctuations, which could be attributed to its filtering and interpolation process. However, these discrepancies remain within an acceptable range and do not significantly impact the reliability of the estimations.
Given the consistency in wavelength stability provided by both CDA and LPO, either method can be confidently used for estimating the central wavelength in Raman spectroscopy. The small differences between them will not impact the subsequent analyses, so their selection does not require further consideration.

3.2. Raman Band Assignment in P. vulgata Shell

Figure 6 shows the averaged Raman spectrum from a cross-section map of P. vulgata shell.
According to Edwards et al., the strongest peaks that clearly differentiate aragonite from calcite are at 208 cm1, exclusive to aragonite, and 283 cm1, characteristic of calcite, with only a minor contribution from aragonite [13]. The region around 700 cm1 can also be used for differentiation, as aragonite exhibits a doublet at 700–704 cm1, while calcite presents a single peak at 711–712 cm1. However, distinguishing these peaks is often challenging due to resolution limitations. Furthermore, in the Raman spectra of CaCO3, the most intense and narrow band corresponds to the symmetric stretching vibration (ν1) of the carbonate group, occurring at 1085 cm1 for aragonite and 1086 cm1 for calcite [40].
Besides carbonate-related peaks, several bands originate from carotenoids. These pigments exhibit the following four major vibrational modes: ν1 (1450–1680 cm1), ν2 (1070–1210 cm1), ν3 (1285–1315 cm1), and ν4 (1000–1015 cm1) [34]. In particular, strong carotenoid peaks appear at 1130 cm1 and 1521 cm1, corresponding to the vibrational modes of conjugated C–C single bonds and C=C double bonds, respectively [15,36]. The intensities of these bands are enhanced due to resonant coupling with the laser source, allowing their detection even at low concentrations [54].
The shift of key calcite Raman bands can be influenced by various chemical species incorporated into the crystal lattice, including substituted ions (Mn2+, Fe3+, Pb2+, Ce3+, etc.), complex ions, organic molecules, and free radicals [55]. Among these, partial magnesium substitution is particularly relevant, as it has been demonstrated to affect bands such as the symmetric stretching mode ν1 (1085 cm1), which can undergo slight shifts, depending on the nature of the substitution [13,54]. Several studies have reported a linear correlation between these shifts and the amount of Mg incorporated into the calcite lattice [33,56].
In addition to the shifts observed in carbonate Raman bands, variations in the spectral position of carotenoid-related bands have also been reported [15,20,34,35]. These shifts depend on the number of conjugated carbon atoms in the polyene chain. Longer chains reduce the energy gap, leading to a shift toward lower frequencies; whereas, shorter chains result in higher vibrational frequencies due to increased force constants [34].

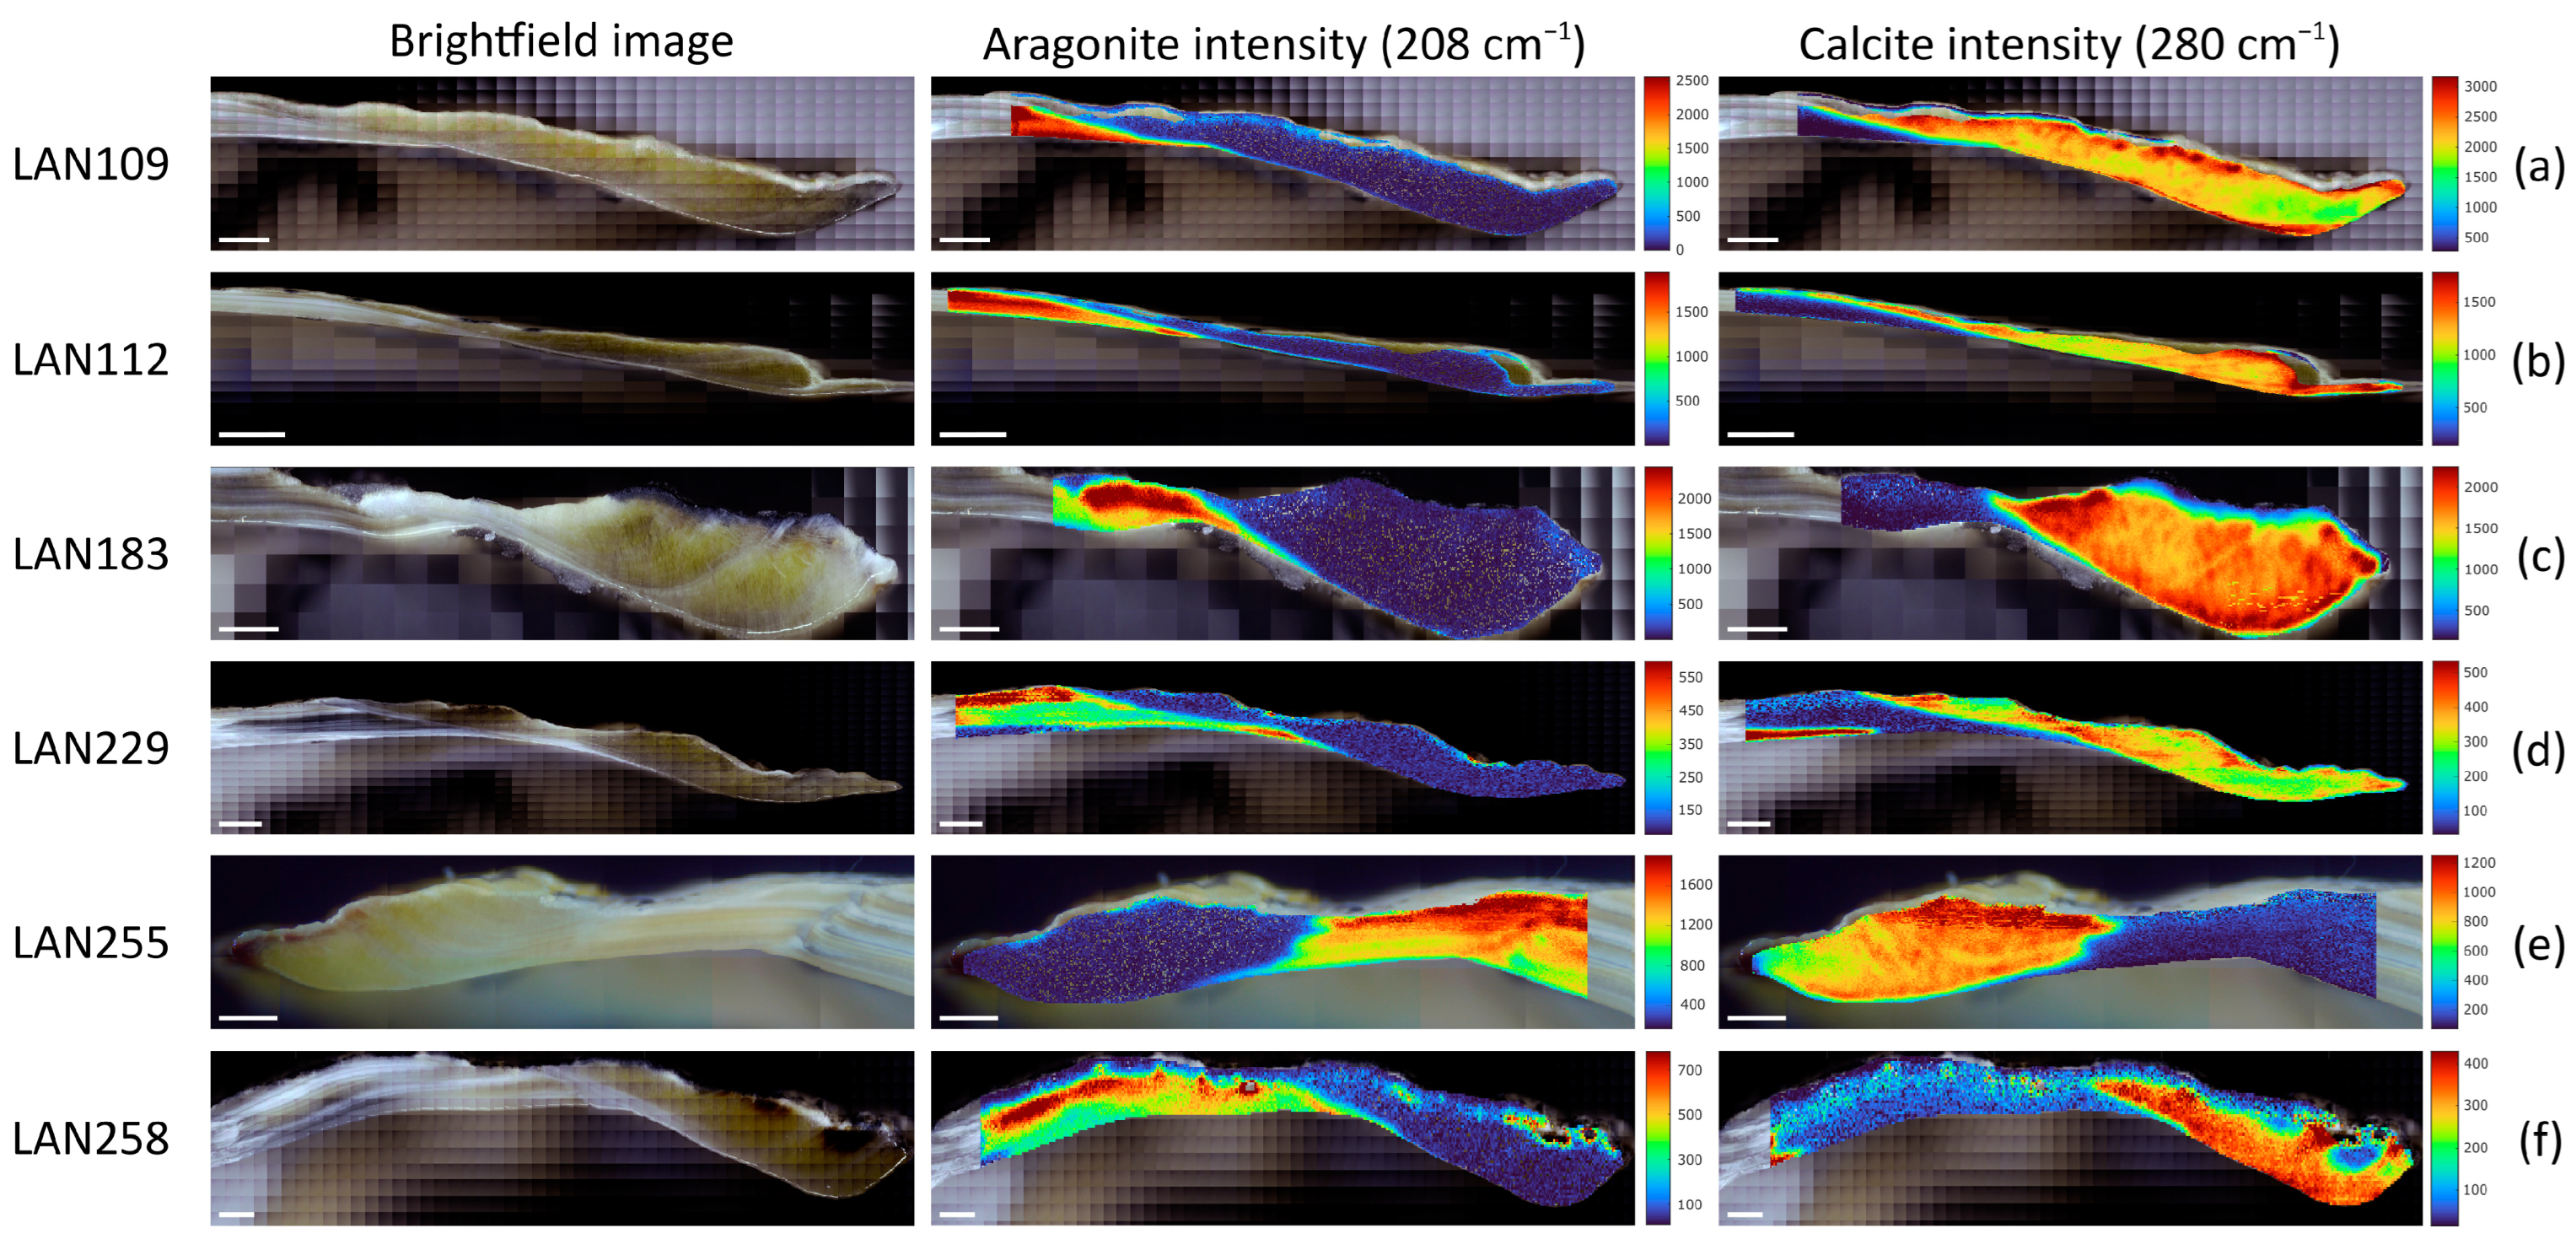
3.3. Spatial Distribution of Aragonite and Calcite

Figure 7 presents the brightfield images of the six P. vulgata shells alongside their corresponding Raman intensity maps, showing the spatial distribution of the calcium carbonate polymorphs. The aragonite distribution is based on the intensity of the Raman band centered at 208 cm1, while the calcite distribution is determined by the intensity of the Raman band centered at 280 cm1.
As shown in Figure 7, both calcite and aragonite are present in the measured regions, with varying proportions across shells. The distribution of these polymorphs differs among sections, with some areas displaying a more balanced presence of both minerals; whereas, others are predominantly calcitic.
According to Section 2.2, the outermost layers, m + 3 and m + 2, primarily consist of calcite, while m + 1, m, and m − 1 are composed of aragonite. The most noticeable variation among the shells is the length of the m + 2 layer. In LAN183, LAN255, and LAN258, this layer is shorter and does not extend as far along the shell. In contrast, LAN109, LAN112, and LAN229 exhibit a narrower transversal section, where the calcite layer extends further toward the upper part of the shell. These differences reflect natural morphological variations among individuals, while preserving the distribution of calcium carbonate polymorphs.
Environmental factors play a key role in these variations. Factors such as microhabitat exposure, wave action, and predation pressure influence the mineralization process and the relative extent of calcite and aragonite layers. A study on P. caerulea investigated the impact of environmental pH on shell mineralogy, showing that individuals exposed to lower pH conditions developed a higher proportion of aragonite at the expense of calcite [41]. These findings suggest that limpets can modulate their shell production in response to external stressors. In addition, the observed variability among P. vulgata shells may reflect a combination of environmental influences as well as time-dependent processes, like shell erosion or surface abrasion.
Despite these differences, the spatial distribution of calcium carbonate polymorphs observed in the analyzed region of P. vulgata coincides with the patterns described for P. caerulea [41], reinforcing a shared biomineralization strategy within limpet species.

3.4. Pigment Distribution and Variations

The presence of pigments within the shell matrix provides insights into biomineralization dynamics and potential environmental influences on shell formation. To examine their spatial organization, Raman intensity maps were generated by analyzing the two predominant bands associated with carotenoids, 1130 cm1 and 1521 cm1.
Figure 8 shows the spatial distribution of carotenoids in P. vulgata shells. These maps were obtained by summing the Raman intensities of the 1130 cm1 and 1521 cm1 bands to show their distribution across the shell layers.
The Raman intensity maps in Figure 8 reveal a heterogeneous distribution of carotenoids within the shells. Blue-colored regions, indicating lower intensities at the 1130 cm1 and 1521 cm1 bands, corresponding to areas with reduced carotenoid content. These regions allow the differentiation of growth lines, suggesting that carotenoid incorporation varies during shell formation. This relationship between carotenoid presence and growth lines may be influenced by changes in the organic matrix, metabolic processes, or seasonal factors.
Furthermore, carotenoids are most concentrated in the outermost shell layers, particularly near the periostracum, while their presence is noticeably reduced in the inner boundary regions. This pattern is consistent with other mollusks, where pigments are primarily restricted to external layers [36]. However, distribution varies among shells; LAN109 (Figure 8a), LAN112 (Figure 8b), LAN229 (Figure 8d), and LAN258 (Figure 8f) show strong carotenoid signals in the outer shell, while LAN183 (Figure 8c) and LAN255 (Figure 8e) exhibit a more diffuse presence. These differences may reflect individual biological or ecological factors influencing pigment deposition.
In most of the shells analyzed, high carotenoid concentrations led to spectral saturation, requiring the filtering and exclusion of affected measurements. This effect is caused by the strong resonance Raman response of carotenoid vibrational modes combined with increased fluorescence, which exceeds the detector’s range and results in information loss due to saturation. This issue is particularly evident in LAN112 (Figure 8b), where missing spectral points correspond to the outermost shell margin, a region known to exhibit strong vibrational signals associated with shell coloration [17].
The comparison between Figure 7 and Figure 8 suggests that carotenoid incorporation is not influenced by aragonite or calcite layers, indicating that their distribution occurs independently of mineralogical phases. However, our analysis primarily detects carotenoids rather than the full organic composition of the shell, as most organic molecules in the shell matrix do not exhibit a resonance Raman signal. This limitation makes it uncertain how other organic components are distributed within the shell.
Figure 9 shows the spectral shifts of the 1521 cm−1 Raman band to explore possible variations in the chemical structure of carotenoids within the shell matrix.
The spectral shifts observed in Figure 9 align with the alternation of aragonite and calcite layers identified in Figure 7, suggesting that the mineral phase influences the structural properties of carotenoids. In contrast, Figure 8 showed that carotenoid intensity does not follow this pattern, indicating that, while the amount of carotenoid present is independent of mineral composition, its molecular structure is affected by the mineralization process. The shifts in the 1521 cm1 band are attributed to differences in polyene chain length, functional groups, or cis-/trans-conformations, as reported in other studies using Raman spectroscopy on molluscan shells [15,34,36].
Notably, the shift patterns in Figure 9 also reveal the same growth lines observed in Figure 8, particularly in LAN255. These lines are more distinguishable in the calcite layers (regions with higher shifts, shown in red), making the growth patterns more visible. In contrast, in the aragonite layers (lower shift regions, shown in blue), these shifts are less pronounced and do not provide enough differences to clearly distinguish the growth lines.
Therefore, carotenoids are not only located on the outer shell surface but are also distributed throughout the shell, forming patterns aligned with growth bands, a finding consistent with previous studies on molluscan shell pigmentation [36,55]. This distribution suggests a regulated incorporation process during biomineralization, where carotenoids are secreted alongside the organic matrix and gradually incorporated into the shell. Once embedded within the calcareous skeleton, they become part of the organic matrix, influencing the organization of shell layers [55]. Thus, beyond providing coloration in the outermost layer, this distribution pattern highlights their potential role in shell structural organization, which is influenced by growth dynamics and environmental conditions.

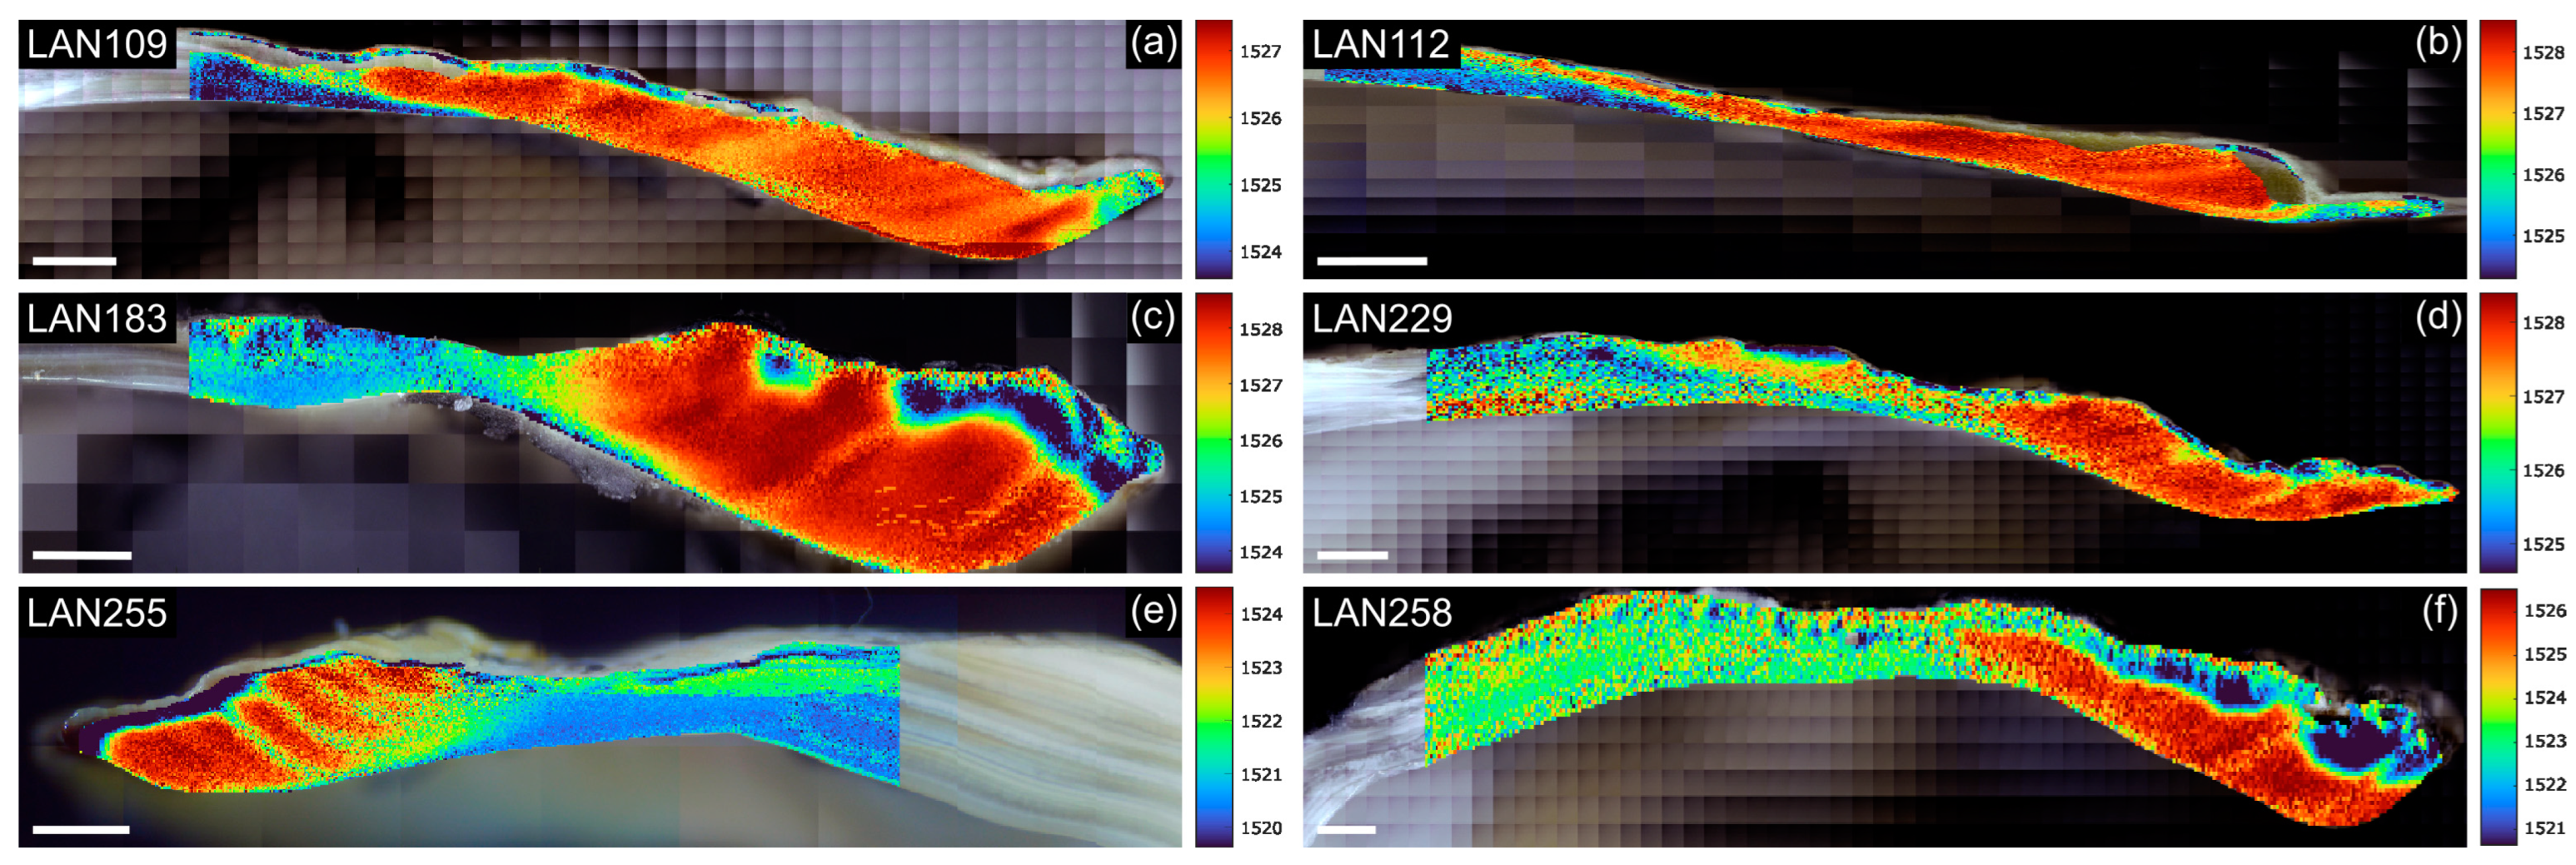
3.5. Carbonate Ion Substitution in the CaCO3 Lattice

The position of the symmetric carbonate stretching mode (ν1), located around 1085 cm1, is known to shift as a result of the substitution of additional cations, such as Mg2+, Mn2+, and Fe2+ [13,40]. These displacements are bidirectional, with wavenumber shifts toward higher or lower values depending on the ionic radius and charge of the substituting cation [57]. These wavenumber variations reflect differences in carbonate structure, suggesting possible chemical heterogeneity within the shell and potential modifications in the carbonate lattice. In P. vulgata, magnesium is the major contributor [58]. Figure 10 presents spatial maps of the 1085 cm1 Raman band shift in the same P. vulgata shells analyzed in the previous subsections.
Figure 10 shows that, for well-defined, isolated Raman bands, such as the 1085 cm1 band, peak positions can be tracked with a precision of about ±0.1 cm1 using subpixel peak position algorithms described in Section 2.5.
The 1085 cm1 Raman band is a characteristic feature of both mineral phases, and the patterns observed in Figure 10 are consistent with the structural descriptions provided in Section 3.3. Specifically, regions with lower Raman shift values correspond to aragonite (blue zones), while areas with higher shift values are associated with calcite (red zones).
Additionally, these shifts subtly reveal structures that follow the same growth lines observed in Figure 8 and Figure 9. This spatial pattern aligns with carotenoid distributions, suggesting a relationship between the organic and mineral phases during shell formation. This supports a temporally and spatially coordinated deposition of organic and mineral components, consistent with a coupled biomineralization mechanism. Comparable patterns have been reported in other mollusk species, such as Arctica islandica and L. elliptica, where carotenoids appear integrated with carbonate domains and aligned with shell growth structures [35,36]. However, it is important to note that the position of this band alone cannot be used to determine the type of substituting cation, as its frequency depends solely on the motion of the oxygen atoms [40].
A comparison between a Mg/Ca analysis performed using LIBS on P. vulgata shells [24], and the patterns of growth lines observed in Figure 10 reveals notable similarities. In particular, LAN183 (Figure 10c) exhibits a clear alignment with these variations. This suggests that their formation is largely influenced by magnesium composition within the shell and follows a structured distribution; although, a direct link cannot be definitively established. Although some shift maps occasionally exhibit artifacts, as seen in LAN255 (Figure 10e), that are unrelated to the shell’s growth structure, the growth lines remain discernible in most specimens.
Interestingly, the same growth lines observed in Section 3.4—Pigment distribution and variations (Figure 8 and Figure 9) also appear in the carbonate ion substitution patterns; although, in some shells, they are barely distinguishable, particularly in LAN112 (Figure 10b) and LAN129 (Figure 10d). In the growth lines region, carotenoid distribution (Figure 8) shows lower concentrations, while the corresponding shifts (Figure 9) exhibit higher values. Similarly, the shift of the carbonate Raman band at 1085 cm1 shown in Figure 10 follows the same pattern, with high shift values. This suggests a consistent relationship between the organic and mineral components of the shells.
The spatial correlation between carbonate–ion substitution patterns and growth lines suggests that mineralization in P. vulgata shells is tightly regulated by biological processes. Matrix proteins and polysaccharides secreted by the mantle likely mediate the selective nucleation of aragonite or calcite, stabilizing specific crystal faces and influencing ion incorporation into the growing lattice [1,3]. Magnesium substitution into the calcite lattice, detected through Raman shifts, introduces lattice strain due to ionic–radius mismatch, subtly modifying the crystal structure [13,32]. Additionally, carotenoids embedded within the organic matrix may indirectly influence local crystallization dynamics and, consequently, shell-layer organization [15,36].

4. Conclusions

In this work, Raman imaging was applied to analyze the structural and compositional heterogeneity in six P. vulgata shells collected from northern Spain. The results demonstrate that Raman spectroscopy is a powerful, non-destructive, and highly precise tool for characterizing the spatial distribution of calcium carbonate polymorphs, organic pigments, and carbonate ion substitutions in the CaCO3 lattice within P. vulgata shells.
The analysis revealed clear spatial variations in mineralogical composition, with distinct layers of aragonite and calcite that align with the shell’s structural organization. These findings reinforce the consistency of biomineralization strategies among limpets and underline the shell’s potential as an environmental archive.
Carotenoids, responsible for shell pigmentation, exhibited heterogeneous intensity patterns across the shell, which were independent of the underlying mineralogical composition but closely aligned with growth dynamics. Furthermore, spectral shifts in the carotenoid Raman band at 1521 cm1, corresponding to the vibrational mode of conjugated C=C bonds, suggest structural modifications likely associated with changes in the surrounding mineral phase during shell formation.
In parallel, shifts observed in the symmetric stretching mode ν1 of the carbonate group (1085 cm1) suggest substitution processes within the carbonate lattice, most likely dominated by magnesium incorporation. The spatial correlation between these shifts and carotenoid distribution points to a coordinated interplay between mineral chemistry and organic compound deposition during biomineralization.
Although this study examined a limited number of samples, it allowed the identification of repetitive and consistent internal structural and compositional patterns using Raman imaging. Nevertheless, individual differences were also observed, reflecting the biological differences inherent to living organisms. These differences, however, did not obscure the main spatial patterns. Inter-individual variability in physiological status and genetic background may influence shell geochemistry. Metabolic responses to stress [59] and genetic variability in biomineralization-related gene expression [60] have been reported to modulate elemental incorporation during shell formation. Although not explicitly addressed in the present study, these sources of intra-specimen variability are relevant and will be considered in future research.
In addition to individual variability, environmental differences across geographic regions—such as variations in temperature, salinity, or pH—can also affect shell structure and composition. Future research could explore P. vulgata shells from diverse environmental settings to better understand how external factors influence biomineralization patterns. Other studies have investigated the relationship between shell geochemistry and environmental variables, providing useful references for future approaches [61,62,63]. Comparative studies across species, locations, and environmental conditions, as well as analyses at different growth stages, will provide a broader framework for interpreting structural and compositional trends. In this context, Raman imaging could be complemented with techniques such as scanning transmission electron microscopy (STEM) and atom probe tomography (APT) to correlate internal shell structure with elemental distribution. Likewise, analyzing shells at different growth stages could offer insights into the temporal evolution of mineral composition. Finally, the use of portable Raman systems in the field could enable non-invasive, real-time analyses directly on archaeological or ecological samples, expanding the practical applications of this technique.

Author Contributions

Conceptualization, M.G.F.-M., B.G.G., C.G.-G., J.M., J.F.A., L.R.-C. and A.C.; methodology, M.G.F.-M., B.G.G., C.G.-G., L.R.-C. and A.C.; software, M.G.F.-M., J.M. and A.C.; validation, M.G.F.-M., B.G.G., C.G.-G. and A.C.; formal analysis, M.G.F.-M., J.M., J.F.A. and A.C.; investigation, M.G.F.-M., B.G.G., A.G.-E., R.A.-M., J.F.A. and A.C.; resources, A.G.-E., R.A.-M., I.G.-Z. and J.M.L.-H.; data curation, M.G.F.-M., B.G.G., C.G.-G. and A.C.; writing—original draft preparation, M.G.F.-M., B.G.G., C.G.-G., J.F.A. and A.C.; writing—review and editing, J.M., A.G.-E., R.A.-M., A.A.O.-S., J.M.L.-H. and L.R.-C.; visualization, M.G.F.-M., B.G.G., C.G.-G. and L.R.-C.; supervision, A.G.-E., R.A.-M., I.G.-Z., J.M., A.A.O.-S., L.R.-C. and A.C.; project administration, I.G.-Z., A.A.O.-S., J.M.L.-H. and A.C.; funding acquisition, I.G.-Z., A.A.O.-S., J.M.L.-H., L.R.-C. and A.C. All authors have read and agreed to the published version of the manuscript.

Funding

This work was supported by the R+D projects PREVAL23/05, INNVAL23/10, and INNVAL24/28, funded by Instituto de Investigación Marqués de Valdecilla (IDIVAL); TED2021-130378B-C21, funded by MCIN/AEI/10.13039/501100011033 and European Union NextGenerationEU/PRTR; PID2022-137269OB-C22, funded by MCIN/AEI/10.13039/501100011033 and EU; PID2021-124059NB-I00, funded by MICIU/AEI/10.13039/501100011033 and ERDF/EU; PID2022-138350OA-I00, funded by MICIU/AEI/10.13039/501100011033 and by ERDF/EU; Plan Nacional de I+D+i and Instituto de Salud Carlos III (ISCIII), Subdirección General de Redes y Centros de Investigación Cooperativa, Ministerio de Ciencia, Innovación y Universidades, through CIBER-BBN (CB16/01/00430) and CIBERINFEC (CB21/13/00068), co-financed by the European Regional Development Fund “A way to achieve Europe”. J.F.A. acknowledges RYC2022-035279-I, funded by MCIN/AEI/10.13039/501100011033 and FSE+. This investigation was also supported by the Alexander von Humboldt Foundation though a Humboldt Research Fellowship (no code available). During the development of this research AGE was funded by the European Commission through a Marie Skłodowska Curie Action—Postdoctoral Fellowship (101064225-NEARCOAST).

Institutional Review Board Statement

Not applicable.

Informed Consent Statement

Not applicable.

Data Availability Statement

Data will be made available on request.

Conflicts of Interest

The authors declare no conflicts of interest.

Abbreviations

The following abbreviations are used in this manuscript:
ACCAmorphous Calcium Carbonate
ALSAsymmetric Least Squares
CCDCharge-Coupled Device
CDACentroid Detection Algorithm
FTIRFourier Transform Infrared Spectroscopy
ICP-MSInductively Coupled Plasma Mass Spectrometry
LIBSLaser-Induced Breakdown Spectroscopy
LPOLinear Phase Operator
RGBRed–Green–Blue
SEMScanning Electron Microscopy
XRDX-Ray Diffraction
STEMScanning Transmission Electron Microscopy
APTAtom Probe Tomography

References

  1. Endo, K.; Kogure, T.; Nagasawa, H. Biomineralization: From Molecular and Nano-Structural Analyses to Environmental Science; Springer: Singapore, 2018; ISBN 978-981-13-1001-0. [Google Scholar]
  2. Marin, F.; Luquet, G. Molluscan Shell Proteins. Comptes Rendus Palevol 2004, 3, 469–492. [Google Scholar] [CrossRef]
  3. Song, X.; Liu, Z.; Wang, L.; Song, L. Recent Advances of Shell Matrix Proteins and Cellular Orchestration in Marine Molluscan Shell Biomineralization. Front. Mar. Sci. 2019, 6, 41. [Google Scholar] [CrossRef]
  4. Milano, S.; Schöne, B.R.; Witbaard, R. Changes of Shell Microstructural Characteristics of Cerastoderma Edule (Bivalvia)—A Novel Proxy for Water Temperature. Palaeogeogr. Palaeoclimatol. Palaeoecol. 2017, 465, 395–406. [Google Scholar] [CrossRef]
  5. Thomas, K.D. Molluscs Emergent, Part I: Themes and Trends in the Scientific Investigation of Mollusc Shells as Resources for Archaeological Research. J. Archaeol. Sci. 2015, 56, 133–140. [Google Scholar] [CrossRef]
  6. Paleček, D.; Milano, S.; Gutiérrez-Zugasti, I.; Talamo, S. Stable Isotopes in the Shell Organic Matrix for (Paleo)Environmental Reconstructions. Commun. Chem. 2024, 7, 16. [Google Scholar] [CrossRef] [PubMed]
  7. Arniz-Mateos, R.; García-Escárzaga, A.; Fernandes, R.; González-Morales, M.R.; Gutiérrez-Zugasti, I. Living in the Shore: Changes in Coastal Resource Intensification during the Mesolithic in Northern Iberia. Archaeol. Anthropol. Sci. 2024, 16, 79. [Google Scholar] [CrossRef]
  8. Fenger, T.; Surge, D.; Schöne, B.; Milner, N. Sclerochronology and Geochemical Variation in Limpet Shells (Patella vulgata): A New Archive to Reconstruct Coastal Sea Surface Temperature. Geochem. Geophys. Geosyst. 2007, 8, 2006GC001488. [Google Scholar] [CrossRef]
  9. Gutiérrez-Zugasti, I.; Suárez-Revilla, R.; Clarke, L.J.; Schöne, B.R.; Bailey, G.N.; González-Morales, M.R. Shell Oxygen Isotope Values and Sclerochronology of the Limpet Patella vulgata Linnaeus 1758 from Northern Iberia: Implications for the Reconstruction of Past Seawater Temperatures. Palaeogeogr. Palaeoclimatol. Palaeoecol. 2017, 475, 162–175. [Google Scholar] [CrossRef]
  10. Orton, J.H. Observations on Patella uulgata. Part III. Habitat and Habits. J. Mar. Biol. Assoc. U. K. 1929, 16, 277–288. [Google Scholar] [CrossRef]
  11. García-Escárzaga, A.; Clarke, L.J.; Gutiérrez-Zugasti, I.; González-Morales, M.R.; Martinez, M.; López-Higuera, J.-M.; Cobo, A. Mg/Ca Profiles within Archaeological Mollusc (Patella vulgata) Shells: Laser-Induced Breakdown Spectroscopy Compared to Inductively Coupled Plasma-Optical Emission Spectrometry. Spectrochim. Acta Part B At. Spectrosc. 2018, 148, 8–15. [Google Scholar] [CrossRef]
  12. Chateigner, D.; Hedegaard, C.; Wenk, H.-R. Mollusc Shell Microstructures and Crystallographic Textures. J. Struct. Geol. 2000, 22, 1723–1735. [Google Scholar] [CrossRef]
  13. Edwards, H.G.M.; Villar, S.E.J.; Jehlicka, J.; Munshi, T. FT–Raman Spectroscopic Study of Calcium-Rich and Magnesium-Rich Carbonate Minerals. Spectrochim. Acta A Mol. Biomol. Spectrosc. 2005, 61, 2273–2280. [Google Scholar] [CrossRef] [PubMed]
  14. Peter, N.J.; Griesshaber, E.; Reisecker, C.; Hild, S.; Oliveira, M.V.G.; Schmahl, W.W.; Schneider, A.S. Biocrystal Assembly Patterns, Biopolymer Distribution and Material Property Relationships in Mytilus Galloprovincialis, Bivalvia, and Haliotis Glabra, Gastropoda, Shells. Materialia 2023, 28, 101749. [Google Scholar] [CrossRef]
  15. Bergamonti, L.; Bersani, D.; Mantovan, S.; Lottici, P.P. Micro-Raman Investigation of Pigments and Carbonate Phases in Corals and Molluscan Shells. Eur. J. Mineral. 2014, 25, 845–853. [Google Scholar] [CrossRef]
  16. Williams, S.T. Molluscan Shell Colour. Biol. Rev. 2017, 92, 1039–1058. [Google Scholar] [CrossRef]
  17. Williams, S.T.; Ito, S.; Wakamatsu, K.; Goral, T.; Edwards, N.P.; Wogelius, R.A.; Henkel, T.; De Oliveira, L.F.C.; Maia, L.F.; Strekopytov, S.; et al. Identification of Shell Colour Pigments in Marine Snails Clanculus Pharaonius and C. Margaritarius (Trochoidea; Gastropoda). PLoS ONE 2016, 11, e0156664. [Google Scholar] [CrossRef]
  18. Nance, J.R.; Armstrong, J.T.; Cody, G.D.; Fogel, M.L.; Hazen, R.M. Preserved Macroscopic Polymeric Sheets of Shell-Binding Protein in the Middle Miocene (8 to 18 Ma) Gastropod Ecphora. Geochem. Perspect. Lett. 2015, 1, 1–9. [Google Scholar] [CrossRef]
  19. Verdes, A.; Cho, W.; Hossain, M.; Brennan, P.L.R.; Hanley, D.; Grim, T.; Hauber, M.E.; Holford, M. Nature’s Palette: Characterization of Shared Pigments in Colorful Avian and Mollusk Shells. PLoS ONE 2015, 10, e0143545. [Google Scholar] [CrossRef]
  20. Hedegaard, C.; Bardeau, J.-F.; Chateigner, D. Molluscan shell pigments: An in situ resonance raman study. J. Molluscan Stud. 2006, 72, 157–162. [Google Scholar] [CrossRef]
  21. Segev, E.; Erez, J. Effect of Mg/Ca Ratio in Seawater on Shell Composition in Shallow Benthic Foraminifera. Geochem. Geophys. Geosyst. 2006, 7, 2005GC000969. [Google Scholar] [CrossRef]
  22. Tanaka, K.; Okaniwa, N.; Miyaji, T.; Murakami-Sugihara, N.; Zhao, L.; Tanabe, K.; Schöne, B.R.; Shirai, K. Microscale Magnesium Distribution in Shell of the Mediterranean Mussel Mytilus Galloprovincialis: An Example of Multiple Factors Controlling Mg/Ca in Biogenic Calcite. Chem. Geol. 2019, 511, 521–532. [Google Scholar] [CrossRef]
  23. Mouchi, V.; De Rafélis, M.; Lartaud, F.; Fialin, M.; Verrecchia, E. Chemical Labelling of Oyster Shells Used for Time-Calibrated High-Resolution Mg/Ca Ratios: A Tool for Estimation of Past Seasonal Temperature Variations. Palaeogeogr. Palaeoclimatol. Palaeoecol. 2013, 373, 66–74. [Google Scholar] [CrossRef]
  24. Mirapeix, J.; Arniz-Mateos, R.; García-Escárzaga, A.; Gutierrez-Zugasti, I.; López-Higuera, J.M.; Cobo, A. Virtual Sampling: Archaeological Implications of a New Technique for Elemental Mapping of Mg/Ca Ratios in Marine Mollusc Shells. J. Archaeol. Sci. 2025, 173, 106123. [Google Scholar] [CrossRef]
  25. Mills, J.V.; Barnhart, H.A.; DePaolo, D.J.; Lammers, L.N. New Insights into Mn2+ and Mg2+ Inhibition of Calcite Growth. Geochim. Cosmochim. Acta 2022, 334, 338–367. [Google Scholar] [CrossRef]
  26. Zhou, G.-T.; Yao, Q.-Z.; Ni, J.; Jin, G. Formation of Aragonite Mesocrystals and Implication for Biomineralization. Am. Mineral. 2009, 94, 293–302. [Google Scholar] [CrossRef]
  27. Seesanong, S.; Boonchom, B.; Chaiseeda, K.; Boonmee, W.; Laohavisuti, N. Conversion of Bivalve Shells to Monocalcium and Tricalcium Phosphates: An Approach to Recycle Seafood Wastes. Materials 2021, 14, 4395. [Google Scholar] [CrossRef]
  28. Zlotnikov, I.; Schoeppler, V. Thermodynamic Aspects of Molluscan Shell Ultrastructural Morphogenesis. Adv. Funct. Mater. 2017, 27, 1700506. [Google Scholar] [CrossRef]
  29. Durham, S.R.; Gillikin, D.P.; Goodwin, D.H.; Dietl, G.P. Rapid Determination of Oyster Lifespans and Growth Rates Using LA-ICP-MS Line Scans of Shell Mg/Ca Ratios. Palaeogeogr. Palaeoclimatol. Palaeoecol. 2017, 485, 201–209. [Google Scholar] [CrossRef]
  30. McMillan, N.J.; Harmon, R.S.; De Lucia, F.C.; Miziolek, A.M. Laser-Induced Breakdown Spectroscopy Analysis of Minerals: Carbonates and Silicates. Spectrochim. Acta Part B At. Spectrosc. 2007, 62, 1528–1536. [Google Scholar] [CrossRef]
  31. Ren, L.; Li, S.; Ye, W.; Lv, Q.; Sun, Y.; Zhou, X.; Lian, S.; Lv, J.; Wang, S.; Guo, J.; et al. Tracking Organic Matrix in the Seashell by Elemental Mapping under Laser-Induced Breakdown Spectroscopy. Talanta 2024, 271, 125658. [Google Scholar] [CrossRef]
  32. Peharda, M.; Schöne, B.R.; Markulin, K.; Uvanović, H.; Tanaka, K.; Shirai, K.; Goodwin, D.; Mihanović, H. Mytilus Galloprovincialis Shell Growth—Insights from Shell Geochemistry. Palaeogeogr. Palaeoclimatol. Palaeoecol. 2024, 650, 112367. [Google Scholar] [CrossRef]
  33. Borromeo, L.; Zimmermann, U.; Andò, S.; Coletti, G.; Bersani, D.; Basso, D.; Gentile, P.; Schulz, B.; Garzanti, E. Raman Spectroscopy as a Tool for Magnesium Estimation in Mg-calcite. J. Raman Spectrosc. 2017, 48, 983–992. [Google Scholar] [CrossRef]
  34. Barnard, W.; De Waal, D. Raman Investigation of Pigmentary Molecules in the Molluscan Biogenic Matrix. J. Raman Spectrosc. 2006, 37, 342–352. [Google Scholar] [CrossRef]
  35. Nehrke, G.; Nouet, J. Confocal Raman Microscope Mapping as a Tool to Describe Different Mineral and Organic Phases at High Spatial Resolution Within Marine Biogenic Carbonates: Case Study on Nerita undata (Gastropoda, Neritopsina). Biogeosciences 2011, 8, 3761–3769. [Google Scholar] [CrossRef]
  36. Stemmer, K.; Nehrke, G. The Distribution of Polyenes in the Shell of Arctica Islandica from North Atlantic Localities: A Confocal Raman Microscopy Study. J. Molluscan Stud. 2014, 80, 365–370. [Google Scholar] [CrossRef]
  37. DeCarlo, T.M.; Comeau, S.; Cornwall, C.E.; Gajdzik, L.; Guagliardo, P.; Sadekov, A.; Thillainath, E.C.; Trotter, J.; McCulloch, M.T. Investigating Marine Bio-calcification Mechanisms in a Changing Ocean with in Vivo and High-resolution Ex Vivo Raman Spectroscopy. Glob. Change Biol. 2019, 25, 1877–1888. [Google Scholar] [CrossRef]
  38. Jehlička, J.; Culka, A. Critical Evaluation of Portable Raman Spectrometers: From Rock Outcrops and Planetary Analogs to Cultural Heritage—A Review. Anal. Chim. Acta 2022, 1209, 339027. [Google Scholar] [CrossRef]
  39. Nehrke, G.; Poigner, H.; Wilhelms-Dick, D.; Brey, T.; Abele, D. Coexistence of Three Calcium Carbonate Polymorphs in the Shell of the Antarctic Clam Laternula elliptica. Geochem. Geophys. Geosyst. 2012, 13. [Google Scholar] [CrossRef]
  40. Badou, A.; Pont, S.; Auzoux-Bordenave, S.; Lebreton, M.; Bardeau, J.-F. New Insight on Spatial Localization and Microstructures of Calcite-Aragonite Interfaces in Adult Shell of Haliotis Tuberculata: Investigations of Wild and Farmed Abalones by FTIR and Raman Mapping. J. Struct. Biol. 2022, 214, 107854. [Google Scholar] [CrossRef]
  41. Langer, G.; Nehrke, G.; Baggini, C.; Rodolfo-Metalpa, R.; Hall-Spencer, J.M.; Bijma, J. Limpets Counteract Ocean Acidification Induced Shell Corrosion by Thickening of Aragonitic Shell Layers. Biogeosciences 2014, 11, 7363–7368. [Google Scholar] [CrossRef]
  42. Ambrose, W.G.; Locke, V.W.L.; Bigelow, G.F.; Renaud, P.E. Deposition of Annual Growth Lines in the Apex of the Common Limpet (Patella vulgata) from Shetland Islands, UK and Norway: Evidence from Field Marking and Shell Mineral Content of Annual Line Deposition. Environ. Archaeol. 2016, 21, 79–87. [Google Scholar] [CrossRef]
  43. Lewis, J.R.; Bowman, R.S. Local Habitat-Induced Variations in the Population Dynamics of Patella vulgata L. J. Exp. Mar. Biol. Ecol. 1975, 17, 165–203. [Google Scholar] [CrossRef]
  44. Surge, D.; Wang, T.; Gutierrez-Zugasti, I.; Kelley, P.H. Isotope Sclerochronolog and Season of Annual Growth Line Formation in Limpet Shells (Patella vulgata) from Warm- and Cold-Temperature Zones in the Easten North Atlantic. Palaios 2013, 28, 386–393. [Google Scholar] [CrossRef]
  45. Moisez, E.; Spilmont, N.; Seuront, L. Microhabitats Choice in Intertidal Gastropods Is Species-, Temperature- and Habitat-Specific. J. Therm. Biol. 2020, 94, 102785. [Google Scholar] [CrossRef] [PubMed]
  46. Boaventura, D.; Cancela Da Fonseca, L.; Hawkins, S.J. Analysis of Competitive Interactions between the Limpets Patella Depressa Pennant and Patella vulgata L. on the Northern Coast of Portugal. J. Exp. Mar. Biol. Ecol. 2002, 271, 171–188. [Google Scholar] [CrossRef]
  47. MacClintock, C. Shell Structure of Patelloid and Bellerophontoid Gastropods (Mollusca). Peabody Mus. Nat. Hist. Yale Univ. Bull. 1967, 22, 1–140. [Google Scholar]
  48. Demarchi, B.; Rogers, K.; Fa, D.A.; Finlayson, C.J.; Milner, N.; Penkman, K.E.H. Intra-Crystalline Protein Diagenesis (IcPD) in Patella vulgata. Part I: Isolation and Testing of the Closed System. Quat. Geochronol. 2013, 16, 144–157. [Google Scholar] [CrossRef] [PubMed]
  49. Cohen, A.L.; Branch, G.M. Environmentally Controlled Variation in the Structure and Mineralogy of Patella Granularis Shells from the Coast of Southern Africa: Implications for Palaeotemperature Assessments. Palaeogeogr. Palaeoclimatol. Palaeoecol. 1992, 91, 49–57. [Google Scholar] [CrossRef]
  50. Best, R.J.; Stier, D.; Kuhrts, L.; Zlotnikov, I. Classical View on Nonclassical Crystal Growth in a Biological Setting. J. Am. Chem. Soc. 2025, 147, 1–9. [Google Scholar] [CrossRef]
  51. Hausmann, N.; Surge, D.; Briz I Godino, I. Confirmation of Mg/Ca Ratios as Palaeothermometers in Atlantic Limpet Shells. Palaeogeogr. Palaeoclimatol. Palaeoecol. 2024, 655, 112538. [Google Scholar] [CrossRef]
  52. Mirapeix, J.; Cobo, A.; Jaúregui, C.; López-Higuera, J.M. Fast Algorithm for Spectral Processing with Application to On-Line Welding Quality Assurance. Meas. Sci. Technol. 2006, 17, 2623–2629. [Google Scholar] [CrossRef]
  53. Long, D.A. The Raman Effect: A Unified Treatment of the Theory of Raman Scattering by Molecules; Wiley: Chichester, UK; New York, NY, USA, 2002; ISBN 978-0-471-49028-9. [Google Scholar]
  54. Urmos, J.; Snnnrvr, S.K.; Mackenzie, F.T. Characterization of Some Biogenic Carbonates with Raman Spectroscopy. Am. Mineral. 1991, 76, 641–646. [Google Scholar]
  55. Nouet, J.; Chevallard, C.; Farre, B.; Nehrke, G.; Campmas, E.; Stoetzel, E.; El Hajraoui, M.A.; Nespoulet, R. Limpet Shells from the Aterian Level 8 of El Harhoura 2 Cave (Témara, Morocco): Preservation State of Crossed-Foliated Layers. PLoS ONE 2015, 10, e0137162. [Google Scholar] [CrossRef] [PubMed]
  56. Urashima, S.; Nishioka, T.; Yui, H. Micro-Raman Spectroscopic Analysis on Natural Carbonates: Linear Relations Found via Biaxial Plotting of Peak Frequencies for Cation Substituted Species. Anal. Sci. 2022, 38, 921–929. [Google Scholar] [CrossRef]
  57. Alves, J.F.; Edwards, H.G.M.; Korsakov, A.; De Oliveira, L.F.C. Revisiting the Raman Spectra of Carbonate Minerals. Minerals 2023, 13, 1358. [Google Scholar] [CrossRef]
  58. Foster, P.; Chacko, J. Minor and Trace Elements in the Shell of Patella vulgata (L.). Mar. Environ. Res. 1995, 40, 55–76. [Google Scholar] [CrossRef]
  59. Schleinkofer, N.; Raddatz, J.; Evans, D.; Gerdes, A.; Flögel, S.; Voigt, S.; Büscher, J.V.; Wisshak, M. Compositional Variability of Mg/Ca, Sr/Ca, and Na/Ca in the Deep-Sea Bivalve Acesta Excavata (Fabricius, 1779). PLoS ONE 2021, 16, e0245605. [Google Scholar] [CrossRef]
  60. Yarra, T.; Ramesh, K.; Blaxter, M.; Hüning, A.; Melzner, F.; Clark, M.S. Transcriptomic Analysis of Shell Repair and Biomineralization in the Blue Mussel, Mytilus Edulis. BMC Genom. 2021, 22, 437. [Google Scholar] [CrossRef]
  61. Graniero, L.E.; Surge, D.; Gillikin, D.P.; Briz I Godino, I.; Álvarez, M. Assessing Elemental Ratios as a Paleotemperature Proxy in the Calcite Shells of Patelloid Limpets. Palaeogeogr. Palaeoclimatol. Palaeoecol. 2017, 465, 376–385. [Google Scholar] [CrossRef]
  62. Hausmann, N.; Prendergast, A.L.; Lemonis, A.; Zech, J.; Roberts, P.; Siozos, P.; Anglos, D. Extensive Elemental Mapping Unlocks Mg/Ca Ratios as Climate Proxy in Seasonal Records of Mediterranean Limpets. Sci. Rep. 2019, 9, 3698. [Google Scholar] [CrossRef]
  63. García-Escárzaga, A.; Martínez-Minchero, M.; Cobo, A.; Gutiérrez-Zugasti, I.; Arrizabalaga, A.; Roberts, P. Using Mg/Ca Ratios from the Limpet Patella Depressa Pennant, 1777 Measured by Laser-Induced Breakdown Spectroscopy (LIBS) to Reconstruct Paleoclimate. Appl. Sci. 2021, 11, 2959. [Google Scholar] [CrossRef]
Figure 1. Cross-sectional schematic representation of the shell structure of P. vulgata, showing the layered arrangement relative to the myostracum (m), with outward layers (m + 1, m + 2, m + 3) and inward layers (m − 1, m − 2).
Applsci 15 05180 g001
Figure 2. (a) Satellite image of the collection site at Langre Beach, Cantabria, Spain (image created using Google Maps, © Google 2025). (b) Schematic representation of the sectioning process along the axis of maximum growth. (c) Brightfield images of the measured areas in the six sectioned shells and their corresponding sample codes. Scale bars represent 1 mm.
Applsci 15 05180 g002
Figure 3. Schematic overview of the experimental setup used for Raman mapping. A 532 nm laser and a spectrometer are coupled to a Raman probe, while a 10× objective lens and a camera are used for precise sample positioning and focus control. The sample is mounted on a motorized XYZ stage, and the entire system is controlled via a custom PC interface developed in MATLAB (licensed version R2023a).
Applsci 15 05180 g003
Figure 4. Overview of the data preprocessing and analysis workflow used in this study.
Applsci 15 05180 g004
Figure 5. Evolution of the laser central wavelength during a 25 h Raman mapping of a P. vulgata shell using (a) CDA estimation and (b) LPO estimation.
Applsci 15 05180 g005
Figure 6. Averaged Raman spectrum from a cross-section map of P. vulgata shell. Characteristic peaks are marked in colors: aragonite (red), calcite (blue), shared by both (purple), and carotenoids (green).
Applsci 15 05180 g006
Figure 7. Brightfield images and Raman intensity maps of aragonite and calcite in transversal shell sections of P. vulgata. The aragonite and calcite maps are based on the Raman intensities at 208 cm1 and 280 cm1, respectively. The color scale represents intensity variations in arbitrary units (a.u.). These values correspond to detected signal counts after preprocessing, ranging from the lowest values in blue to the highest values in red. Subfigures are associated with the following shells: (a) LAN109, (b) LAN112, (c) LAN183, (d) LAN229, (e) LAN255, and (f) LAN258. Each subfigure includes a scale bar that represents 1 mm.
Applsci 15 05180 g007
Figure 8. Raman intensity maps of pigments in transversal shell sections of P. vulgata. Maps were obtained by summing the Raman intensities of the 1130 cm1 and 1521 cm1 bands, associated with carotenoid bonds. The color scale represents intensity variations in arbitrary units (a.u.). These values correspond to detected signal counts after preprocessing, ranging from the lowest values in blue to the highest values in red. Subfigures correspond to the following shells: (a) LAN109, (b) LAN112, (c) LAN183, (d) LAN229, (e) LAN255, and (f) LAN258. Each subfigure includes a scale bar that represents 1 mm.
Applsci 15 05180 g008
Figure 9. Carotenoid structural variability in P. vulgata shells based on spectral shifts of the 1521 cm1 Raman band. The color scale represents these shifts in cm−1, ranging from the lowest values in blue, intermediate values in green, to the highest values in red. Subfigures correspond to the following shells: (a) LAN109, (b) LAN112, (c) LAN183, (d) LAN229, (e) LAN255, and (f) LAN258. Each subfigure includes a scale bar that represents 1 mm.
Applsci 15 05180 g009
Figure 10. Carbonate structural variability in P. vulgata shells based on spectral shifts of the 1085 cm1 Raman band. The color scale represents the shift values in cm−1, ranging from the lowest values in blue, intermediate values in green, to the highest values in red. Subfigures correspond to the following shells: (a) LAN109, (b) LAN112, (c) LAN183, (d) LAN229, (e) LAN255, and (f) LAN258. Each subfigure includes a scale bar that represents 1 mm.
Applsci 15 05180 g010
Disclaimer/Publisher’s Note: The statements, opinions and data contained in all publications are solely those of the individual author(s) and contributor(s) and not of MDPI and/or the editor(s). MDPI and/or the editor(s) disclaim responsibility for any injury to people or property resulting from any ideas, methods, instructions or products referred to in the content.

