1. Introduction
Motor imagery (MI)-based brain–computer interface (BCI) technology is an advanced research field in neurocognition and clinical rehabilitation medicine [
1]. Its core goal is to decode motor imagery EEG signals (electroencephalogram, EEG) and directly translate the user’s intention into mechanical responses, providing assistive-control solutions for patients with motor dysfunction [
2]. The event-related desynchronization (ERD)/event-related synchronization (ERS) induced by motor imagery tasks in EEG are often considered as features for BCI systems to recognize users’ movement intentions [
3]. However, these features exhibit significant individual differences: their signal amplitude, frequency band range, and cortical spatial distribution characteristics are all influenced by the subject’s physiological state and experimental conditions [
4,
5].
The common spatial pattern (CSP) algorithm is widely used for EEG feature extraction [
6] and can effectively extract spatiotemporal features related to ERD/ERS. Its computational complexity is relatively low, making it especially suitable for online BCI systems. The filter bank common spatial pattern (FBCSP) algorithm extends CSP by adding frequency band division [
7], addressing the issue that CSP’s pre-filtering strategy may not adapt to the subject’s individualized frequency domain features, thereby improving feature robustness. The regularized common spatial pattern (RCSP) introduces a regularization term [
8] to address the problem of noise sensitivity in CSP, which can lead to model overfitting, thus enhancing performance on small sample datasets.
Although these methods are characterized by their suitability for binary classification tasks and high computational efficiency, they still suffer from insufficient generalization ability. In recent years, transfer-learning methods [
9], through cross-subject or cross-task knowledge transfer, have become an effective way to enhance model generalization, receiving widespread attention. For motor imagery EEG signal decoding, some representative transfer-learning strategies include (1) a feature domain adaptation strategy, which aligns the EEG feature distributions of different subjects or tasks to reduce domain differences [
10]; (2) model-based transfer-learning, which adapts to new subjects by fine-tuning pre-trained models or sharing model parameters [
11]; and (3) a data augmentation strategy, which improves model generalization by synthesizing or transforming data [
12].
Based on the FBCSP and RCSP methods, this study proposes a transfer strategy for cross-subject feature space alignment, named weighted filter bank and regularization common spatial pattern (WFBRCSP). WFBRCSP divides the EEG signals of the target subject and each source domain subject into sub-bands using a filter bank. It utilizes mutual information to quantify the similarity of EEG signal distributions within each frequency band between the target subject and the source domain subjects. Then, based on the total mutual information between the source domain subjects and the target subject across all frequency bands, it allocates weights to the sub-band EEG signals of each source domain subject. The weights are determined according to the proportion of their total mutual information. This approach achieves cross-subject feature space alignment. On this basis, the RCSP algorithm is used to extract spatiotemporal features from the weighted sub-bands for both the target subject and each source domain subject. Compared to traditional FBCSP and RCSP, WFBRCSP introduces a regularization term through the weighted filter bank and feature extraction process. This makes full use of the data from source domain subjects, which is similar to the target subject’s distribution. This approach addresses the issue of adapting to the individualized frequency domain features while being sensitive to noise, which could lead to model overfitting. It also overcomes the limitation of RCSP, which assigns equal weights to all source domain subject data, thereby weakening the discriminative power of suboptimal feature extraction. As a result, the target subject’s data is better aligned with a more stable and low-condition bias feature space. By jointly optimizing the spatial–frequency patterns in the frequency–domain and spatial–domain, this method further enhances the discriminability of the features and improves the model’s generalization ability across different subjects. Compared to existing transfer-learning strategies, the WFBRCSP method directly operates on the EEG signals and spatial filters, rather than on the extracted features. This allows the WFBRCSP to more directly capture the important information in the EEG signals, reducing information loss during the feature extraction process. It has a significant advantage in cross-subject feature space alignment, enabling better adaptation to the EEG signal distributions of different subjects. As a result, the model’s performance is significantly improved.
The structure of this paper is organized as follows.
Section 2 reviews related work, analyzes the current state and advancements of transfer-learning methods in EEG signal analysis, and highlights the existing limitations in current research.
Section 3 describes the framework and methodological principles of the weighted filter bank and regularized common spatial pattern (WFBRCSP) approach.
Section 4 presents experimental comparisons between the WFBRCSP and other methods, including classification accuracy, computational time, and model generalization ability.
Section 5 evaluates the WFBRCSP and the compared methods, discussing the results and their implications.
Section 6 summarizes the theoretical contributions and practical significance of the research findings.
2. Related Works
Due to the individual differences in EEG signals and the scarcity of data, the application of transfer-learning in EEG signal processing has gradually become an important research direction. Kueper N et al. [
13] proposed a transfer-learning-based method for motor intention recognition, targeting the challenge of limited data availability in exoskeleton-assisted rehabilitation training. The method involves recording EEG signals from healthy subjects performing bilateral synchronous movements under an exoskeleton mirror mode to train a classifier, which is then transferred to recognize unilateral limb motor intentions, thereby eliminating the need for additional calibration sessions during rehabilitation. To accommodate the small-sample condition, the authors employed a support vector machine (SVM) to classify extracted temporal features between movement-related potentials and resting states, enhancing the feasibility of the system under data-constrained environments.
Y. Zhang et al. [
14] proposed a transfer-learning domain adaptation algorithm based on an improved Kullback–Leibler divergence to address the issue of feature distribution drift caused by the non-stationarity of EEG signals in motor imagery BCI. In this method, KL divergence is employed as a metric to measure the similarity between the feature distributions of the training and testing datasets. Additionally, the classification probabilities output by an SVM are utilized to both weight the covariance matrices of the training samples and to identify and remove the samples with poor classification performance, thereby effectively enhancing the model’s classification accuracy on cross-session testing datasets.
Jing Jin et al. [
15] proposed a novel cross-dataset adaptive domain selection transfer-learning framework. Based on the maximum mean discrepancy criterion, source samples most similar to the target subject’s distribution were selected from a large-scale dataset comprising 109 subjects, after excluding BCI-illiterate individuals (subjects with classification accuracies below 70%). Subsequently, Euclidean alignment and a multi-combination common spatial pattern (MCCSP) method were employed for discriminative feature extraction, followed by classification using a linear kernel SVM. The experimental results demonstrated that the proposed method outperformed advanced approaches such as EA-CSP, FBCSP, and EA-IISCSP in cross-dataset motor imagery BCI tasks, with statistically significant improvements (
p < 0.05).
Chu C et al. [
16] addressed the challenges of inter-subject variability and calibration burden in motor imagery EEG-based BCIs by proposing a multi-source domain transfer-learning fusion framework. The framework aligns source domains using resting-state data, integrates feature extraction via CSP, and employs an improved EasyTL classifier with optimal transport and density peak selection strategies to enhance cross-subject classification performance. Considering the limitations of deep-learning methods in terms of data requirements, computational cost, and interpretability, the authors adopted a lightweight design that combines traditional machine learning with optimal transport, achieving a balance between classification performance, resource consumption, and system deployability.
A. Li et al. [
17] proposed a novel transfer-learning strategy named MDTL, which not only enables transfer from a single source domain to a target domain but also facilitates data transmission among multiple source domains, thereby enhancing data selectivity and mitigating noise effects. As a model-agnostic approach, MDTL can be rapidly integrated into existing deep-learning models without requiring modifications to the network architecture. The experimental results demonstrated that MDTL improved the average classification accuracy on two datasets and reduced the training time by 93.4%. However, despite the significant efficiency improvements, the MACs of MDTL-EEGNet still reach 354.6 T, while the MACs of MDTL-ShallowConvNet are as high as 1708.8 T, making deployment on portable motor imagery brain–computer interface devices still challenging.
K. Shyu et al. [
18] pointed out that real-time classification on resource-constrained portable devices requires classifiers with low computational overhead, minimal memory usage, and fast response times. To address the challenge posed by the high computational complexity of neural networks in motor imagery BCI, the authors proposed a real-time multi-class EEG classification method that combines CSP features with Riemannian manifold representations. By integrating CSP with Riemannian mapping, the method enhances feature discriminability, and it further incorporates a category-scoring mechanism based on SVM hyperplane distances to improve classification accuracy, thereby meeting the real-time performance and low-resource consumption requirements of portable BCI systems.
Although deep-learning-based methods have achieved remarkable progress in EEG decoding tasks in recent years, they typically rely on large-scale datasets, require substantial computational resources during training, and involve complex model structures with limited interpretability. Considering that motor imagery BCI applications are often characterized by small sample sizes, non-stationary signals, and resource-constrained deployment environments, this study adopts a lightweight WFBRCSP approach that integrates traditional machine learning with spatial feature extraction. The proposed method not only offers high computational efficiency and strong model interpretability but also meets the real-time requirements of portable BCI systems. Furthermore, WFBRCSP enhances the traditional CSP algorithm by integrating weighted filter banks and regularized common spatial patterns, introducing a mutual information-based weighting mechanism between the source and target domains to improve the generalization ability of the classification model while maintaining low computational overhead.
3. WFBRCSP Methods
3.1. Process
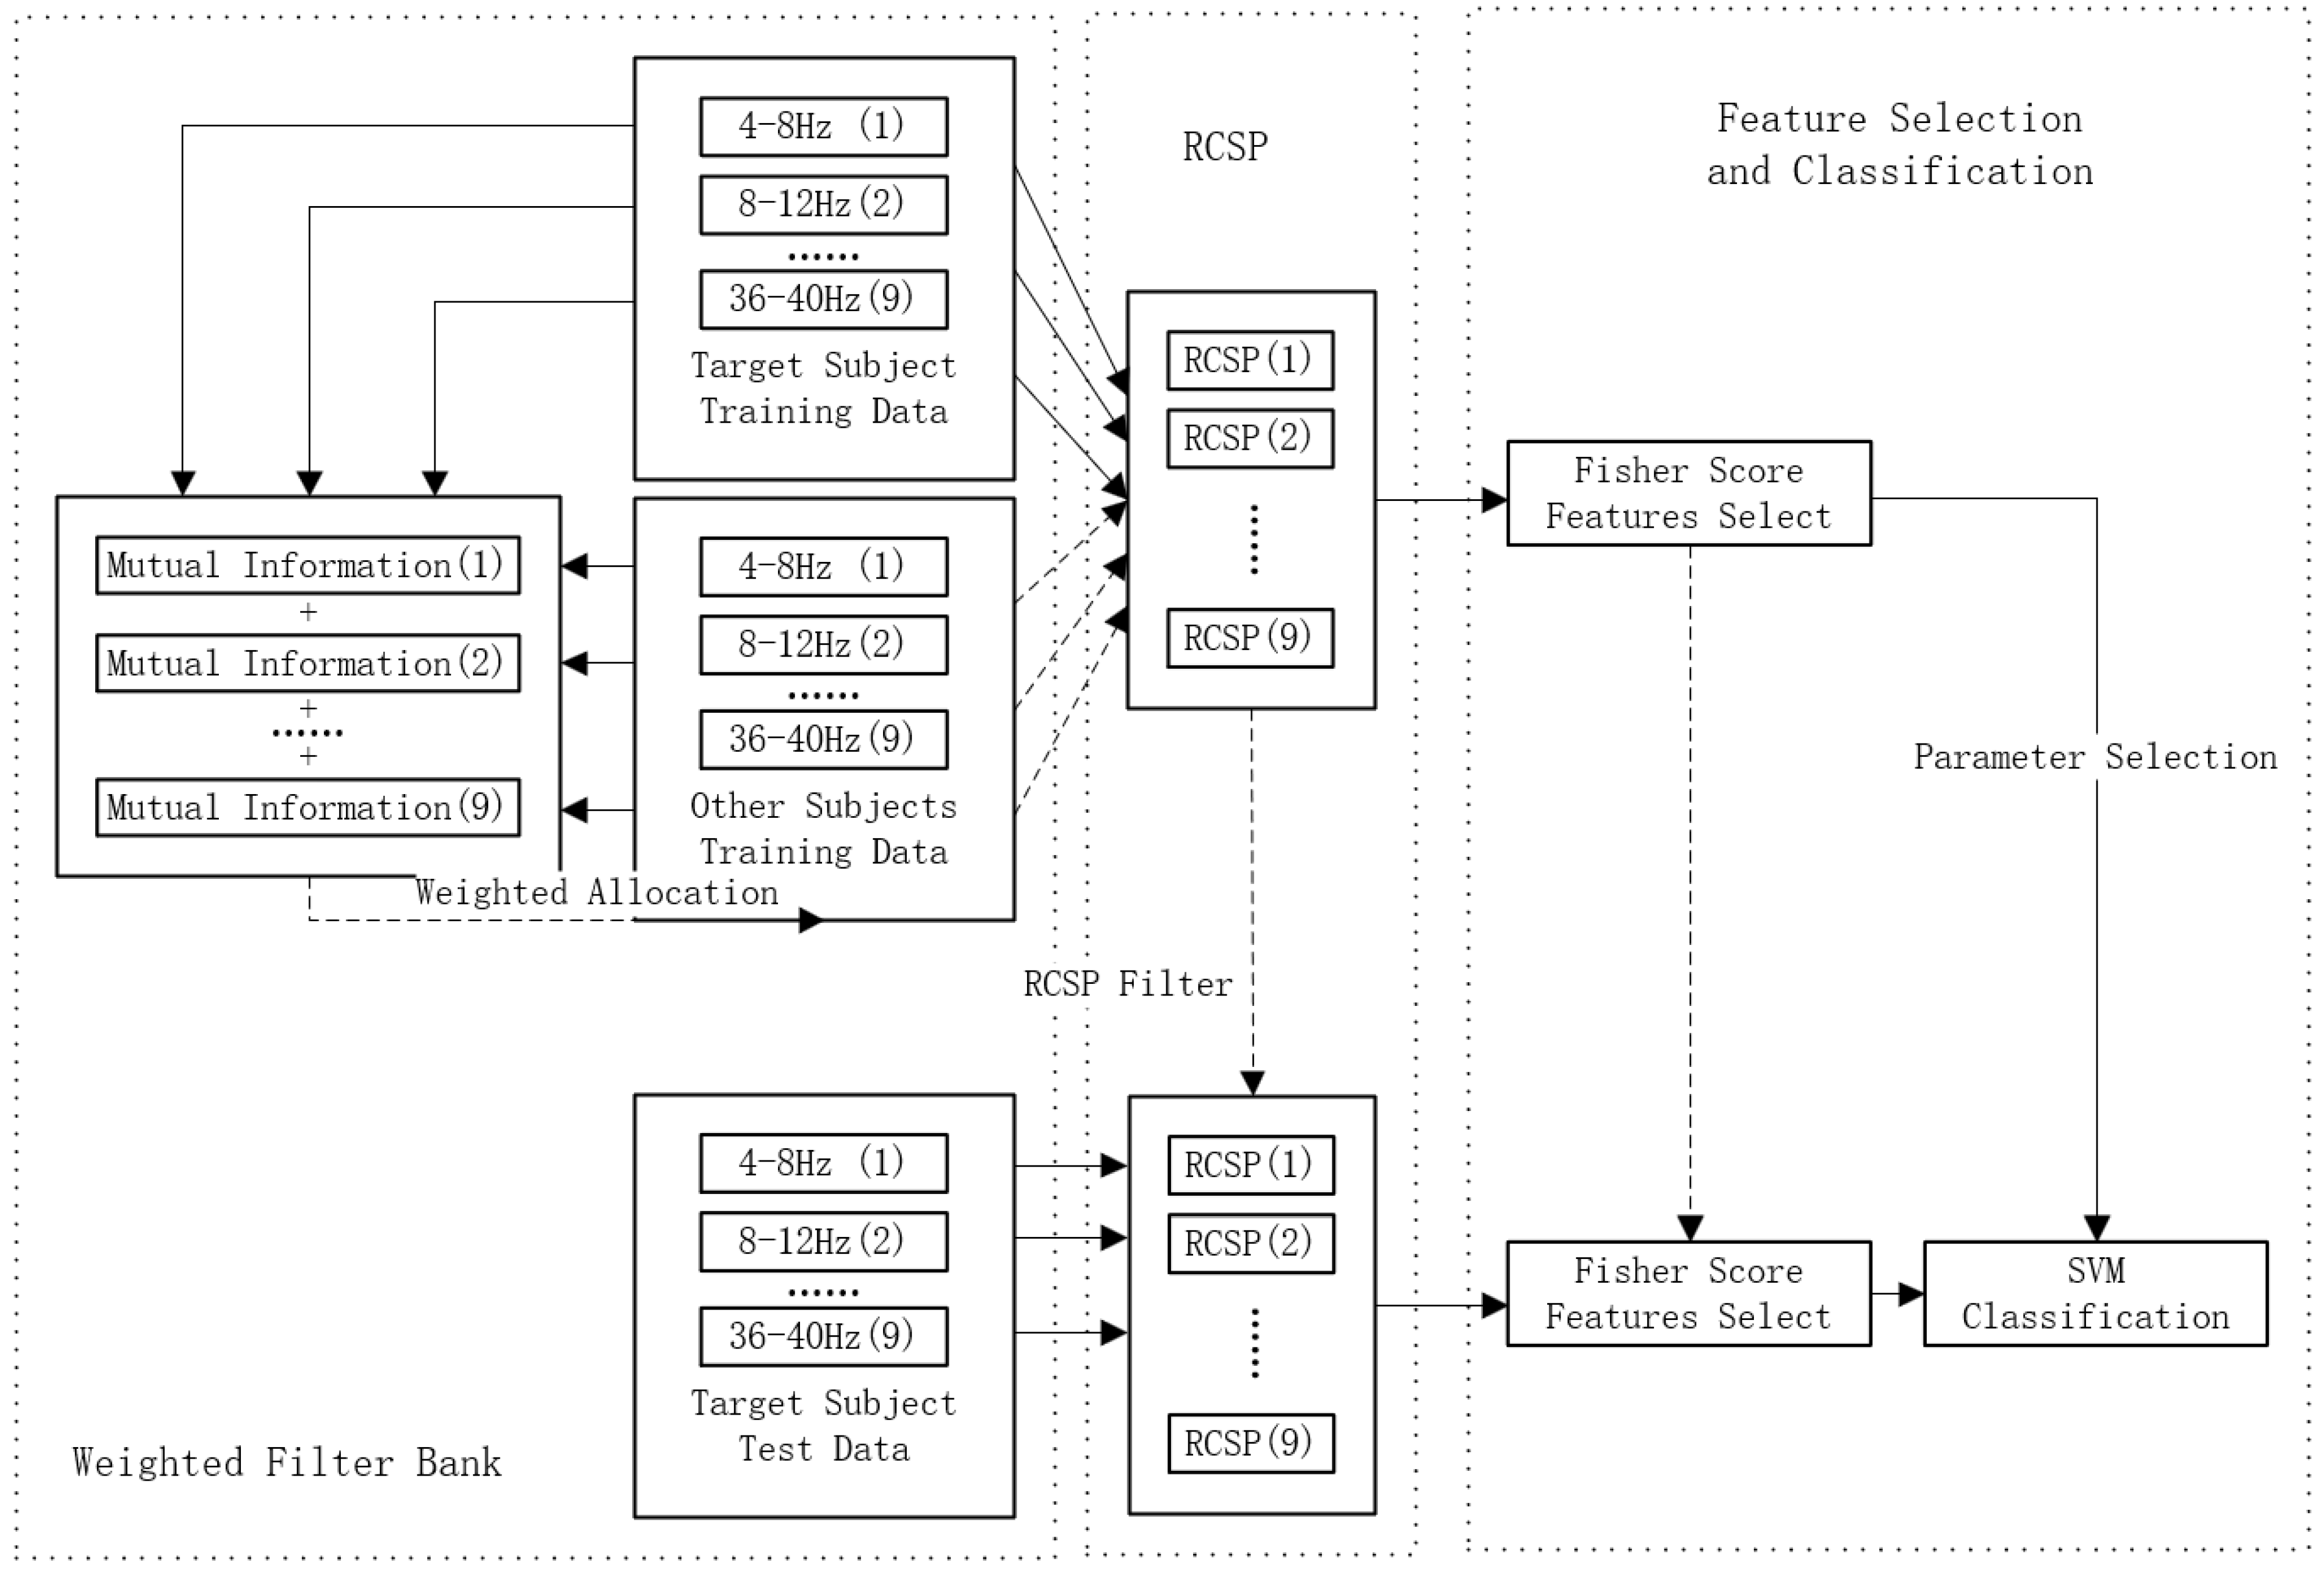
Based on the FBCSP framework, this study proposes an EEG-decoding method using a weighted filter bank regularized common spatial pattern (WFBRCSP) for feature extraction. The block diagram is exhibited in
Figure 1, and the specific process is as follows.
Considering the individual variability in the active frequency ranges during motor imagery tasks, where some subjects exhibit significant motor-related EEG activity outside the conventional α (8–12 Hz) and β (13–30 Hz) bands, this study constructs a filter bank by dividing the 4–40 Hz range into 4 Hz sub-bands [
19]. Sub-band decomposition is performed on the raw EEG signals of both the target subject and all of the source subjects. Subsequently, the mutual information between the target subject and each source subject is calculated within each sub-band, and the total mutual information across all sub-bands is aggregated. Based on the mutual information maximization criterion, adaptive weights are assigned to each source subject.
- 2.
RCSP Feature Extraction
On each weighted sub-band of the source domain subjects, the RCSP algorithm is applied to combine the covariance matrices of the EEG data from the target subject and each source domain subject to extract the spatiotemporal features of the target subject, and then all sub-band features are merged.
- 3.
Feature Selection and Classification
The Fisher score is used to evaluate the separability of the feature set, selecting a subset of features with high discriminability. Based on the CSP feature pairs, the corresponding features are selected from the feature subset, and finally, they are input into an SVM to complete the intention classification task.
3.2. Weight Assignment for Band-Specific Mutual Information
The weighted filter bank allows for selective processing of different frequency bands of the signal. By combining information from multiple frequency bands, it can improve the algorithm’s robustness to noise and artifacts. Although EEG signals exhibit subject-specific characteristics, there may still be some similarity in the EEG responses between different subjects during motor imagery tasks, especially in task-related brain regions and common signal patterns (e.g., α waves, β waves). In traditional RCSP methods, when adding the data from source domain subjects to the covariance matrix, the data from all source domain subjects are typically added with equal weights. Mutual information-based weight allocation, by weighting the data from certain subjects for regularization, can avoid the negative impact of data with a weak correlation to the target subject on the model, thereby enhancing classification performance.
Mutual information maximization (MIM) is an information-theoretic optimization criterion designed to measure the statistical dependence between two random variables. In this study, mutual information maximization is applied in the subject-weighting strategy, specifically manifested as:
For each frequency band, the mutual information between the target subject’s data and the source domain subject’s data is calculated to quantify their correlation in the time domain. The mutual information of each frequency band for a given source domain subject is then accumulated to obtain the total mutual information;
- 2.
Subject weight allocation:
Based on the mutual information maximization criterion, higher weights are assigned to source domain subjects with high correlation, while lower weights are given to source domain subjects with low correlation, thereby adaptively enhancing the contribution of more specific subjects.
First, the EEG signals of the target subject and all of the source domain subjects are divided into sub-bands using a 5th-order Butterworth filter with frequency bands of 4–8 Hz, 8–12 Hz, …, 36–40 Hz [
20].
Given the EEG signals
and
(
) of the target subject
the and source domain subjects
for a specific task
within a certain frequency band
, the mutual information is defined as:
where
is the joint probability distribution of the target subject
and source domain subject
for the class
task in frequency band
,
, and
are the marginal probability distributions of the target subject
and source domain subject
for class
task in frequency band
, respectively.
The total mutual information of the source domain subject is obtained by accumulating the mutual information between the source domain subject
and the target subject
across all classification tasks and all sub-bands:
The subject with the maximum mutual information is used as the reference. The total mutual information between all source domain subjects, and the target subject
is then normalized to ensure that the weight values of the source domain subjects lie within the range
. The weights for the EEG signals of all source domain subjects are assigned step by step as follows:
To compute the mutual information between the EEG signals and assess their dependencies, this study employs a histogram discretization method to estimate the joint probability distribution of continuous signals [
21]. First, the EEG signals are discretized, and the joint histogram is computed and normalized to obtain the joint probability distribution. Then, a similar approach is used to estimate the marginal probability distributions. Based on the normalized mutual information formula, the mutual information between the signals is calculated. This method avoids the high computational complexity associated with kernel density estimation and provides a more robust estimate, especially in cases of limited sample sizes.
3.3. Regularized Common Spatial Patterns
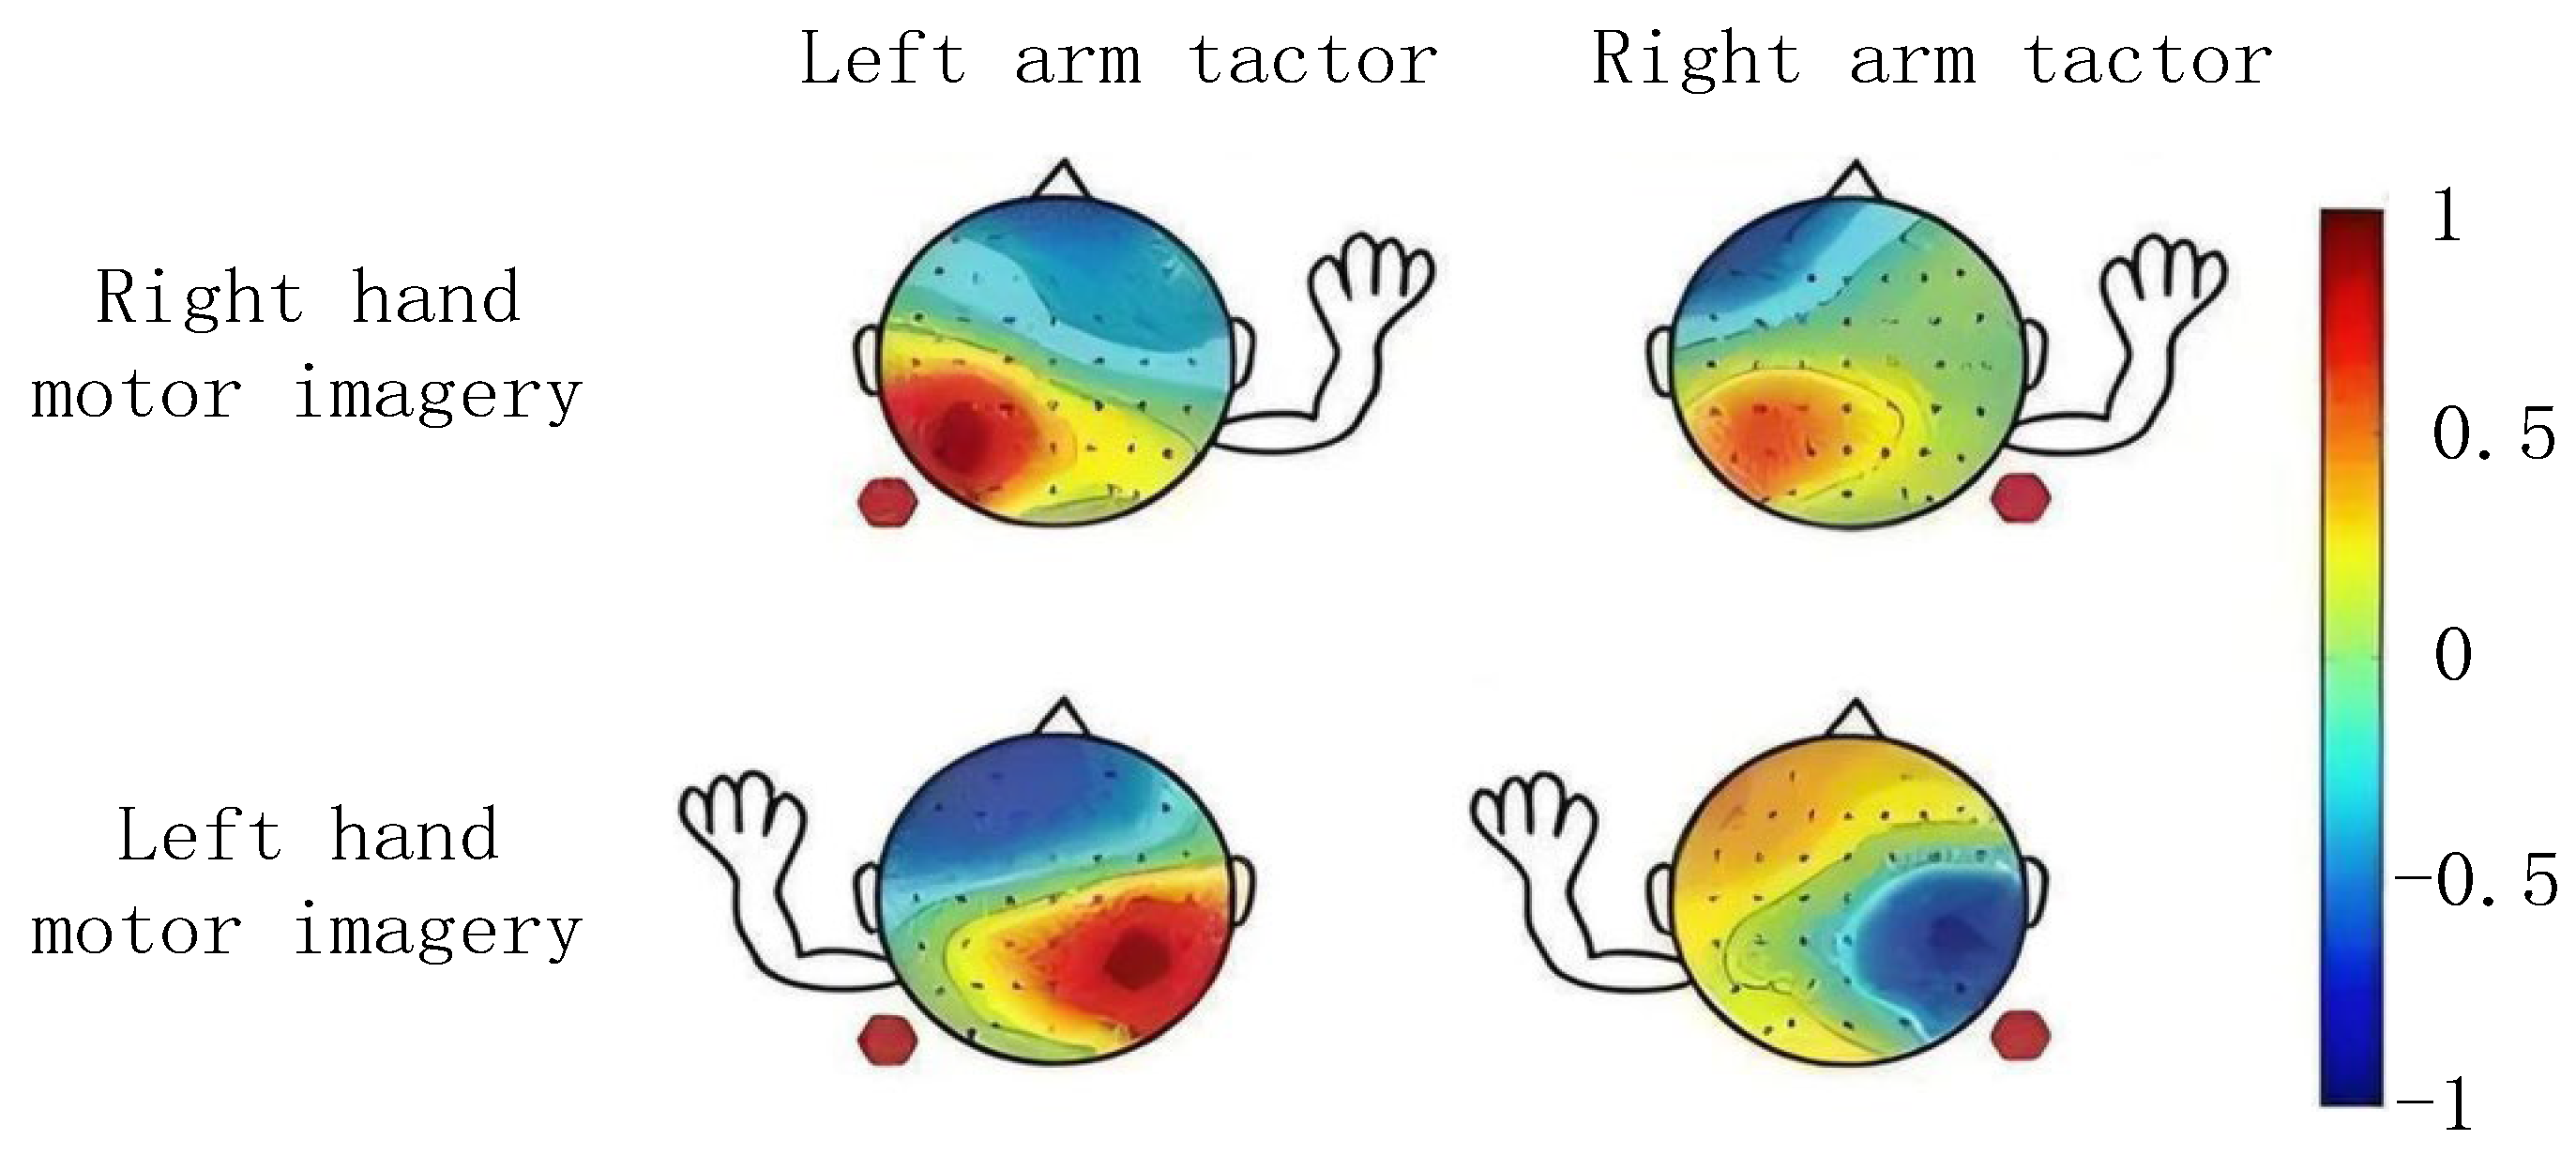
In EEG studies of motor imagery tasks, spatial analysis methods are helpful for identifying and localizing the activation patterns in specific regions of the cortical brain. Specifically, the spatial patterns of EEG signals typically reflect the differences in signal energy across different electrodes or channels, as exhibited in
Figure 2. Spatial filtering techniques, such as CSP, are widely used for spatial feature extraction. By optimizing the spatial filters, these techniques can effectively enhance the spatial feature differences of task-related signals, thereby improving the accuracy of motor imagery decoding.
The traditional CSP algorithm relies on the covariance matrix to extract features, but the covariance matrix is highly sensitive to noise and artifacts, especially in low signal-to-noise ratio conditions. The presence of noise may lead to inaccurate estimation of the covariance matrix, which in turn, affects the classification performance of the extracted features. In this study, a regularization term is introduced to address the issues of noise and overfitting.
Let
represent the number of channels in the experiment,
represent the number of sampling points for each channel, and the matrix
represent the EEG data collected during one experiment, filtered by the
filter and weighted for class
of a particular task. Due to the weighting applied to the subject’s EEG data, rank normalization is not performed on the sample covariance matrix here. The form of the sample covariance matrix is:
is the sum of the covariance matrices for all
trials of the target subject’s class
task in sub-band
, the covariance matrices of the target subject and source domain subjects are merged and regularized using a regularization parameter:
is the regularization parameter,
is the sum of the covariance matrices for
trials of all source domain subjects’ class
task in sub-band
. The parameter
shifts the initial covariance matrix estimate towards the general covariance, providing a more stable estimate; the parameter
shifts the initial covariance matrix estimate towards the identity matrix, compensating for possible condition bias under small sample conditions. When
, RCSP is equivalent to CSP [
22].
The total covariance matrix is obtained by summing the regularized covariance matrices of the two classes:
Perform a generalized eigenvalue decomposition on the total covariance matrix to solve for the eigenvalues
and eigenvectors
. The eigenvectors are then sorted in descending order based on the eigenvalues, resulting in the reordered eigenvector matrix
. Whitening processing is then applied to
.
Let
and solve for the eigenvalues
and eigenvectors
of
. Similarly, based on the eigenvalues, sort the corresponding eigenvectors in descending order to obtain the eigenvector matrix
. At this point, the spatial filter for sub-band
is:
Use the spatial filter
to extract the EEG signal features
and calculate the variance of each column of
. Then, normalize it to form the sub-band
feature vector
.
It is worth noting that, in binary classification, RCSP itself considers the differences between the two classes of signals by solving the generalized eigenvalue problem and optimizing the spatial filter to maximize the inter-class differences, without the need to individually calculate the spatial patterns for each class.
3.4. Fisher Score Feature Selection
Due to the frequency band division, the number of features will increase exponentially.
where
is the feature of the sub-band
. To reduce the feature dimension, a feature selection algorithm is used to perform dimensionality reduction on the extracted features. The goal of Fisher score feature selection is to select a set of features that can distinguish between different classes. To achieve this, the discriminability of each feature with respect to the target class is calculated by maximizing the ratio of inter-class variance to intra-class variance for feature selection.
Intra-class variance reflects the classification of samples within the same class. That is, the degree of dispersion between the sample points within each class.
where
is the feature of a sample in class 1 or class 2, and
and
are the means of the corresponding feature
in class 1 and class 2, respectively.
Inter-class variance reflects the difference in sample means between different classes. The larger the inter-class variance, the more distinct the difference between the two classes.
where
is the global mean of all samples.
The Fisher score is a measure of the ability of feature
to distinguish between two classes, defined as the ratio of inter-class variance to intra-class variance.
Features are sorted in descending order based on their Fisher scores. RCSP features exist in pairs, so when selecting features, the corresponding features should also be included, ensuring that the final selected features contain complete feature pairs.
3.5. Classification Methods
SVM is a powerful classification method based on statistical learning theory and has been widely applied in EEG signal processing due to its comprehensive advantages in handling limited sample sizes, high-dimensional feature spaces, nonlinear modeling, and computational efficiency [
23]. SVM achieves classification by maximizing the margin between classes and can effectively handle nonlinear data distributions through the use of various kernel functions, such as the Gaussian radial basis function (RBF) [
24]. In this study, SVM is used as the feature classifier, and ten-fold cross-validation is employed to optimize the regularization parameters
and the number of features
selected by Fisher score, with the aim of enhancing the classification performance. Considering the nonlinear nature of motor imagery EEG signals, the classifier utilizes an RBF kernel and sets the penalty parameter C to 1 to better fit the data distribution. Hyperparameter selection is performed using a combination of ten-fold cross-validation and grid search. Although grid search increases the computational cost, it allows for a comprehensive evaluation of different hyperparameter combinations and does not affect the assessment during the testing phase. To validate the stability of the model’s solution, the consistency of the same parameter set across different data folds was examined. By comparing the classification accuracy and AUC values across each fold, the stability of the selected hyperparameters across different folds was ensured.
4. Experimental Results
4.1. Data Description
This study evaluates the proposed method using two publicly available motor imagery EEG signal datasets. Dataset I is the BCICIII IVa dataset from the 2008 International BCI Competition [
25]; dataset II is the BCICIV IIb dataset from the 2005 International BCI Competition [
26].
The dataset contains EEG data from five healthy subjects, collected using 118 channels (10–20 system) with a sampling rate of 100 Hz. The data have been preprocessed with power line interference filtering and bandpass filtering (0.05–200 Hz). The subjects performed motor imagery tasks for the right hand and foot under no feedback conditions, with each task lasting 3.5 s, and a total of 280 trials were conducted. This study selects data from 0.5 s to 2.5 s after the start of the motor imagery task, using 18 channels (C1, C3, Cz, C2, C4, CFC3, CFC4, CFC5, CFC6, CCP3, CCP4, CCP5, CCP6, T7, T8, P3, Pz, and P4). The sample size for each subject is 18 × 200 [
20];
The dataset contains EEG data from nine healthy subjects, collected using three channels (C3, CZ, C4) and three electrooculogram (EOG) channels, with a sampling rate of 250 Hz. The data have been preprocessed with power line notch filtering and bandpass filtering (0.5–100 Hz). The subjects performed motor imagery tasks for the left and right hands. The first two days were no-feedback experiments (240 trials), and the last three days were feedback experiments (480 trials). The data from the first two days were used as the training set, and the data from the last three days were used as the test set. This study uses data from 4 s after the start of motor imagery, with a sample size of 3 × 1000 for each subject.
4.2. Parameter
BCICIII Iva: the number of CSP feature pairs is set to three, and the number of features selected is .
BCICIV IIb: the number of CSP feature pairs is set to one, and the number of features selected is .
Regularization parameter:
4.3. Performance Comparison of Other Method and WFBRCSP
The description of similar competing methods compared to the WFBRCSP method proposed in this study is as follows.
CSP: The most classic algorithm in the field of motor imagery EEG signal processing, which uses spatial filters to extract variance features and combines them with SVM for feature classification.
RCSP: An improved version of the CSP algorithm, which introduces a regularization term and performs a linear combination of the covariance matrices of the target subject and source domain subjects.
FBCSP: The EEG signal frequency band is divided into multiple sub-bands, and the CSP algorithm is used to extract features from these sub-bands, achieving first place on the BCICIV IIb dataset. This study uses the Fisher score for feature selection.
FBRCSP: Combining the ideas of sub-band division and regularized CSP, parameter optimization is performed using 10-fold cross-validation. In this study, Fisher score feature selection and mutual information maximization feature selection are used for comparison of the results.
OBRCSP: The transfer-learning-based optimized filter bank regularized common spatial pattern method [
12] uses a low Laplacian spatial filter to enhance local brain region activity and improve the signal-to-noise ratio. After extracting features using a seventh-order Butterworth filter bank and regularized CSP algorithm, the best features are selected using the minimum redundancy maximum relevance (mRmR) algorithm.
The classification accuracy of the WFBRCSP was compared with that of CSP, RCSP, FBCSP, FBRCSP-FSS, FBRCSP-MIFS, and OFBRCSP, as exhibited in
Table 1 and
Table 2. Bold values indicate the highest accuracy and mean kappa value for each subject across methods.
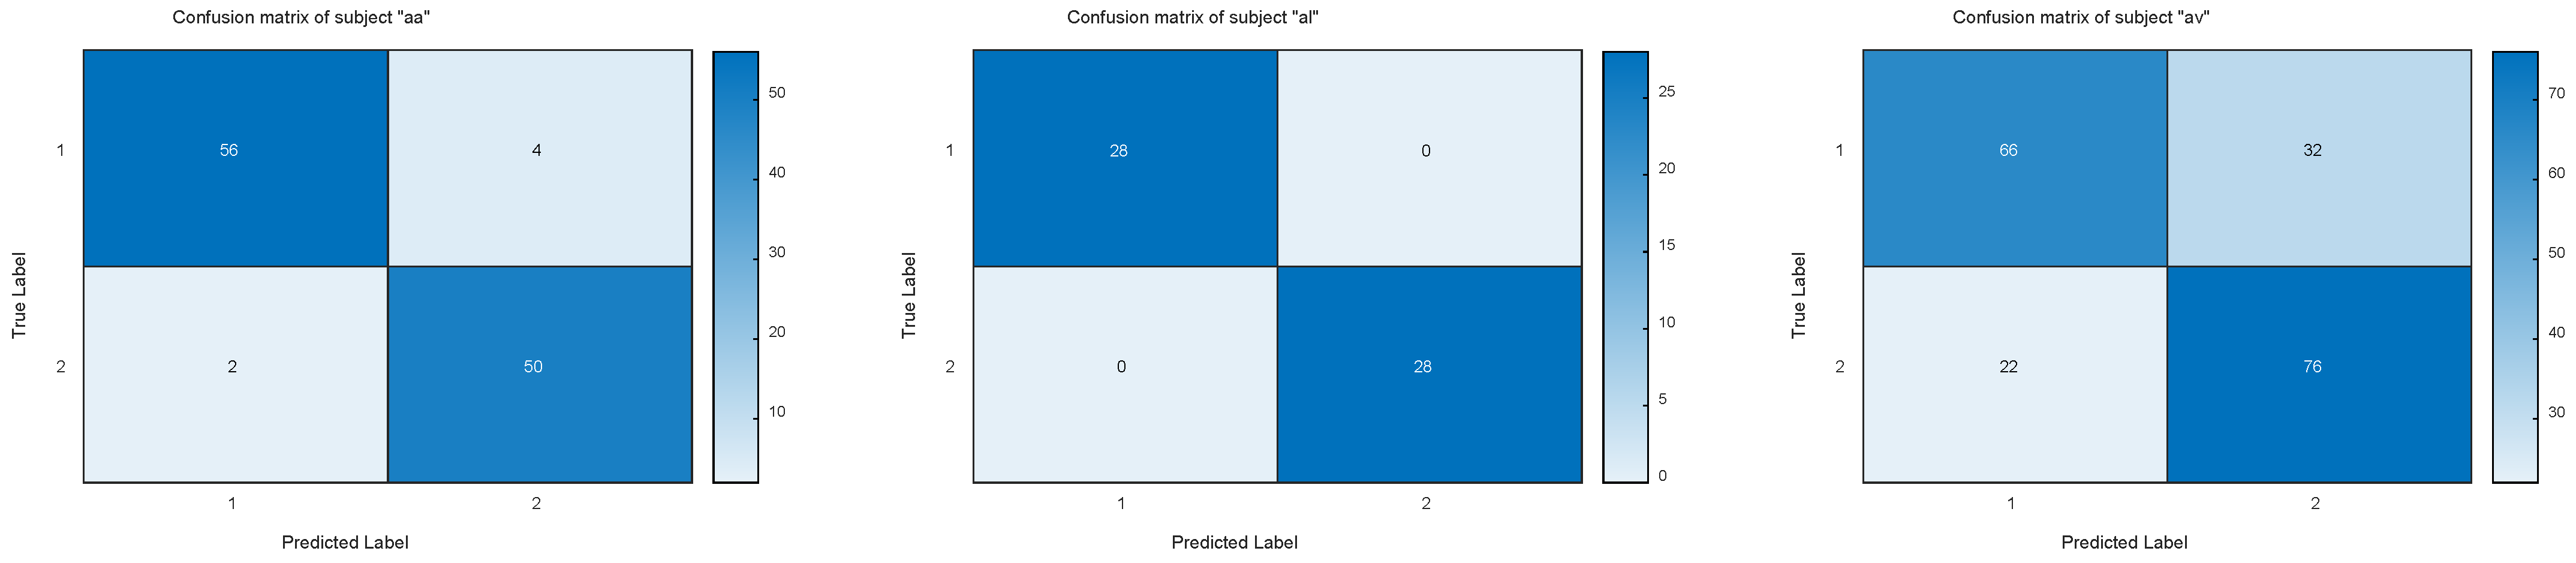
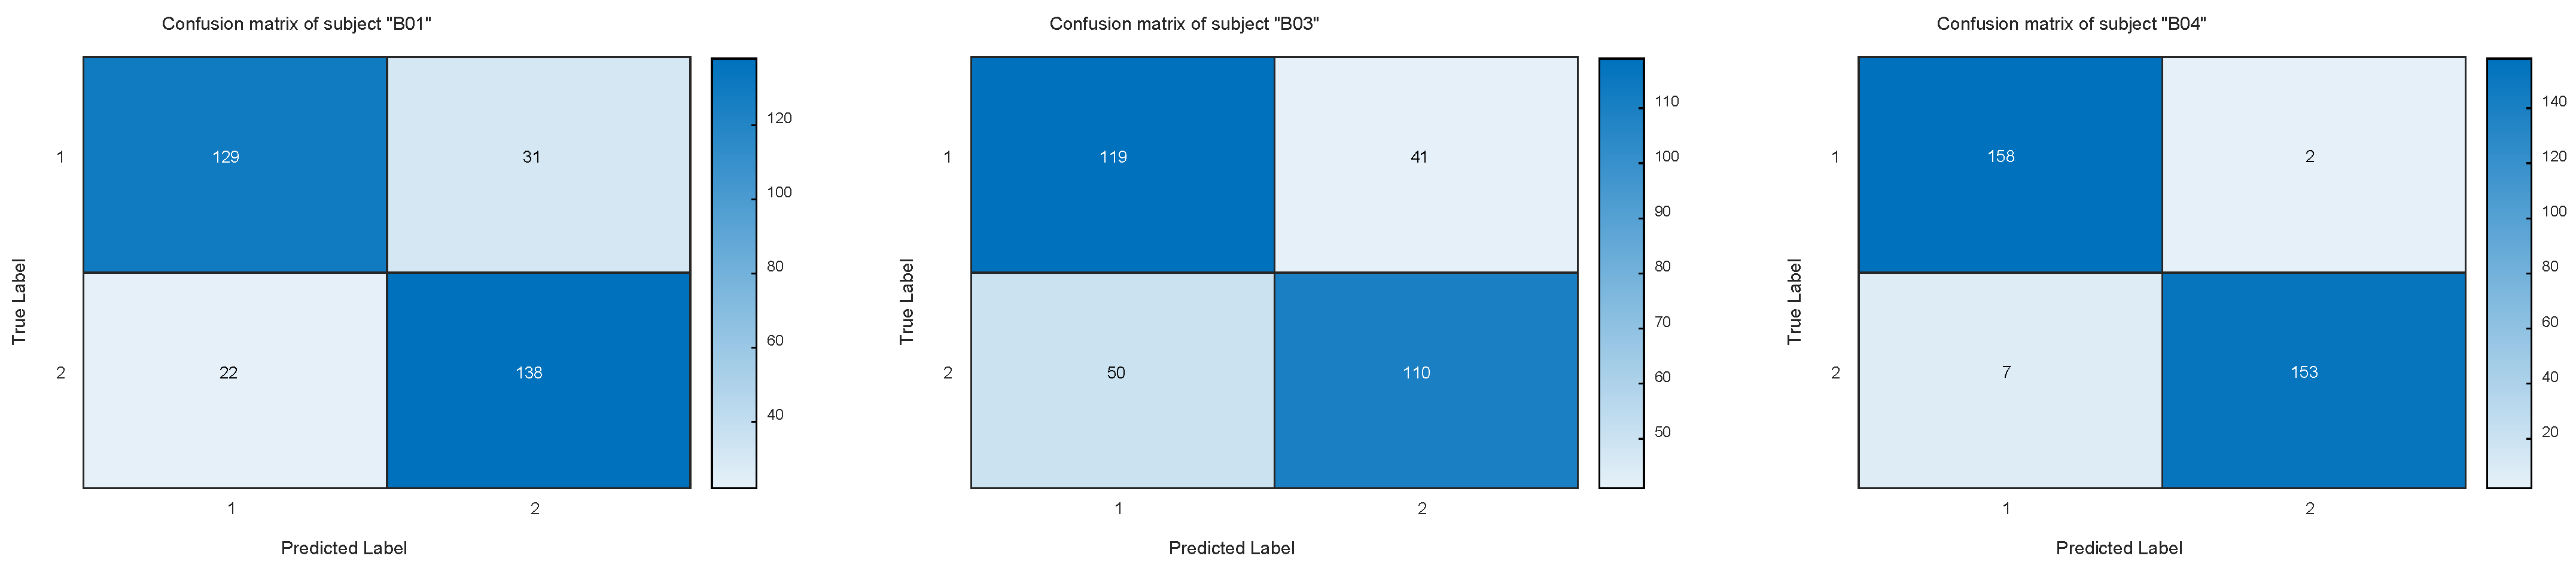
Figure 3 and
Figure 4 exhibit the confusion matrices for the two datasets on the test set. The experimental results demonstrate that the proposed WFBRCSP method achieved the highest average classification accuracy on both Dataset I and Dataset II, with accuracies of 87.87% and 85.92%, respectively. And WFBRCSP achieved the highest classification accuracy for each subject in Dataset II.
The average Kappa values for each subject across different methods are provided in
Table 1 and
Table 2. The Kappa value is used to measure the model’s performance in task classification [
27] and can effectively capture the performance differences of the model across subjects. Particularly in cross-subject tasks, where individual differences are significant, Kappa values provide a more accurate reflection of the model’s stability.
- 2.
Hyperparameter Settings
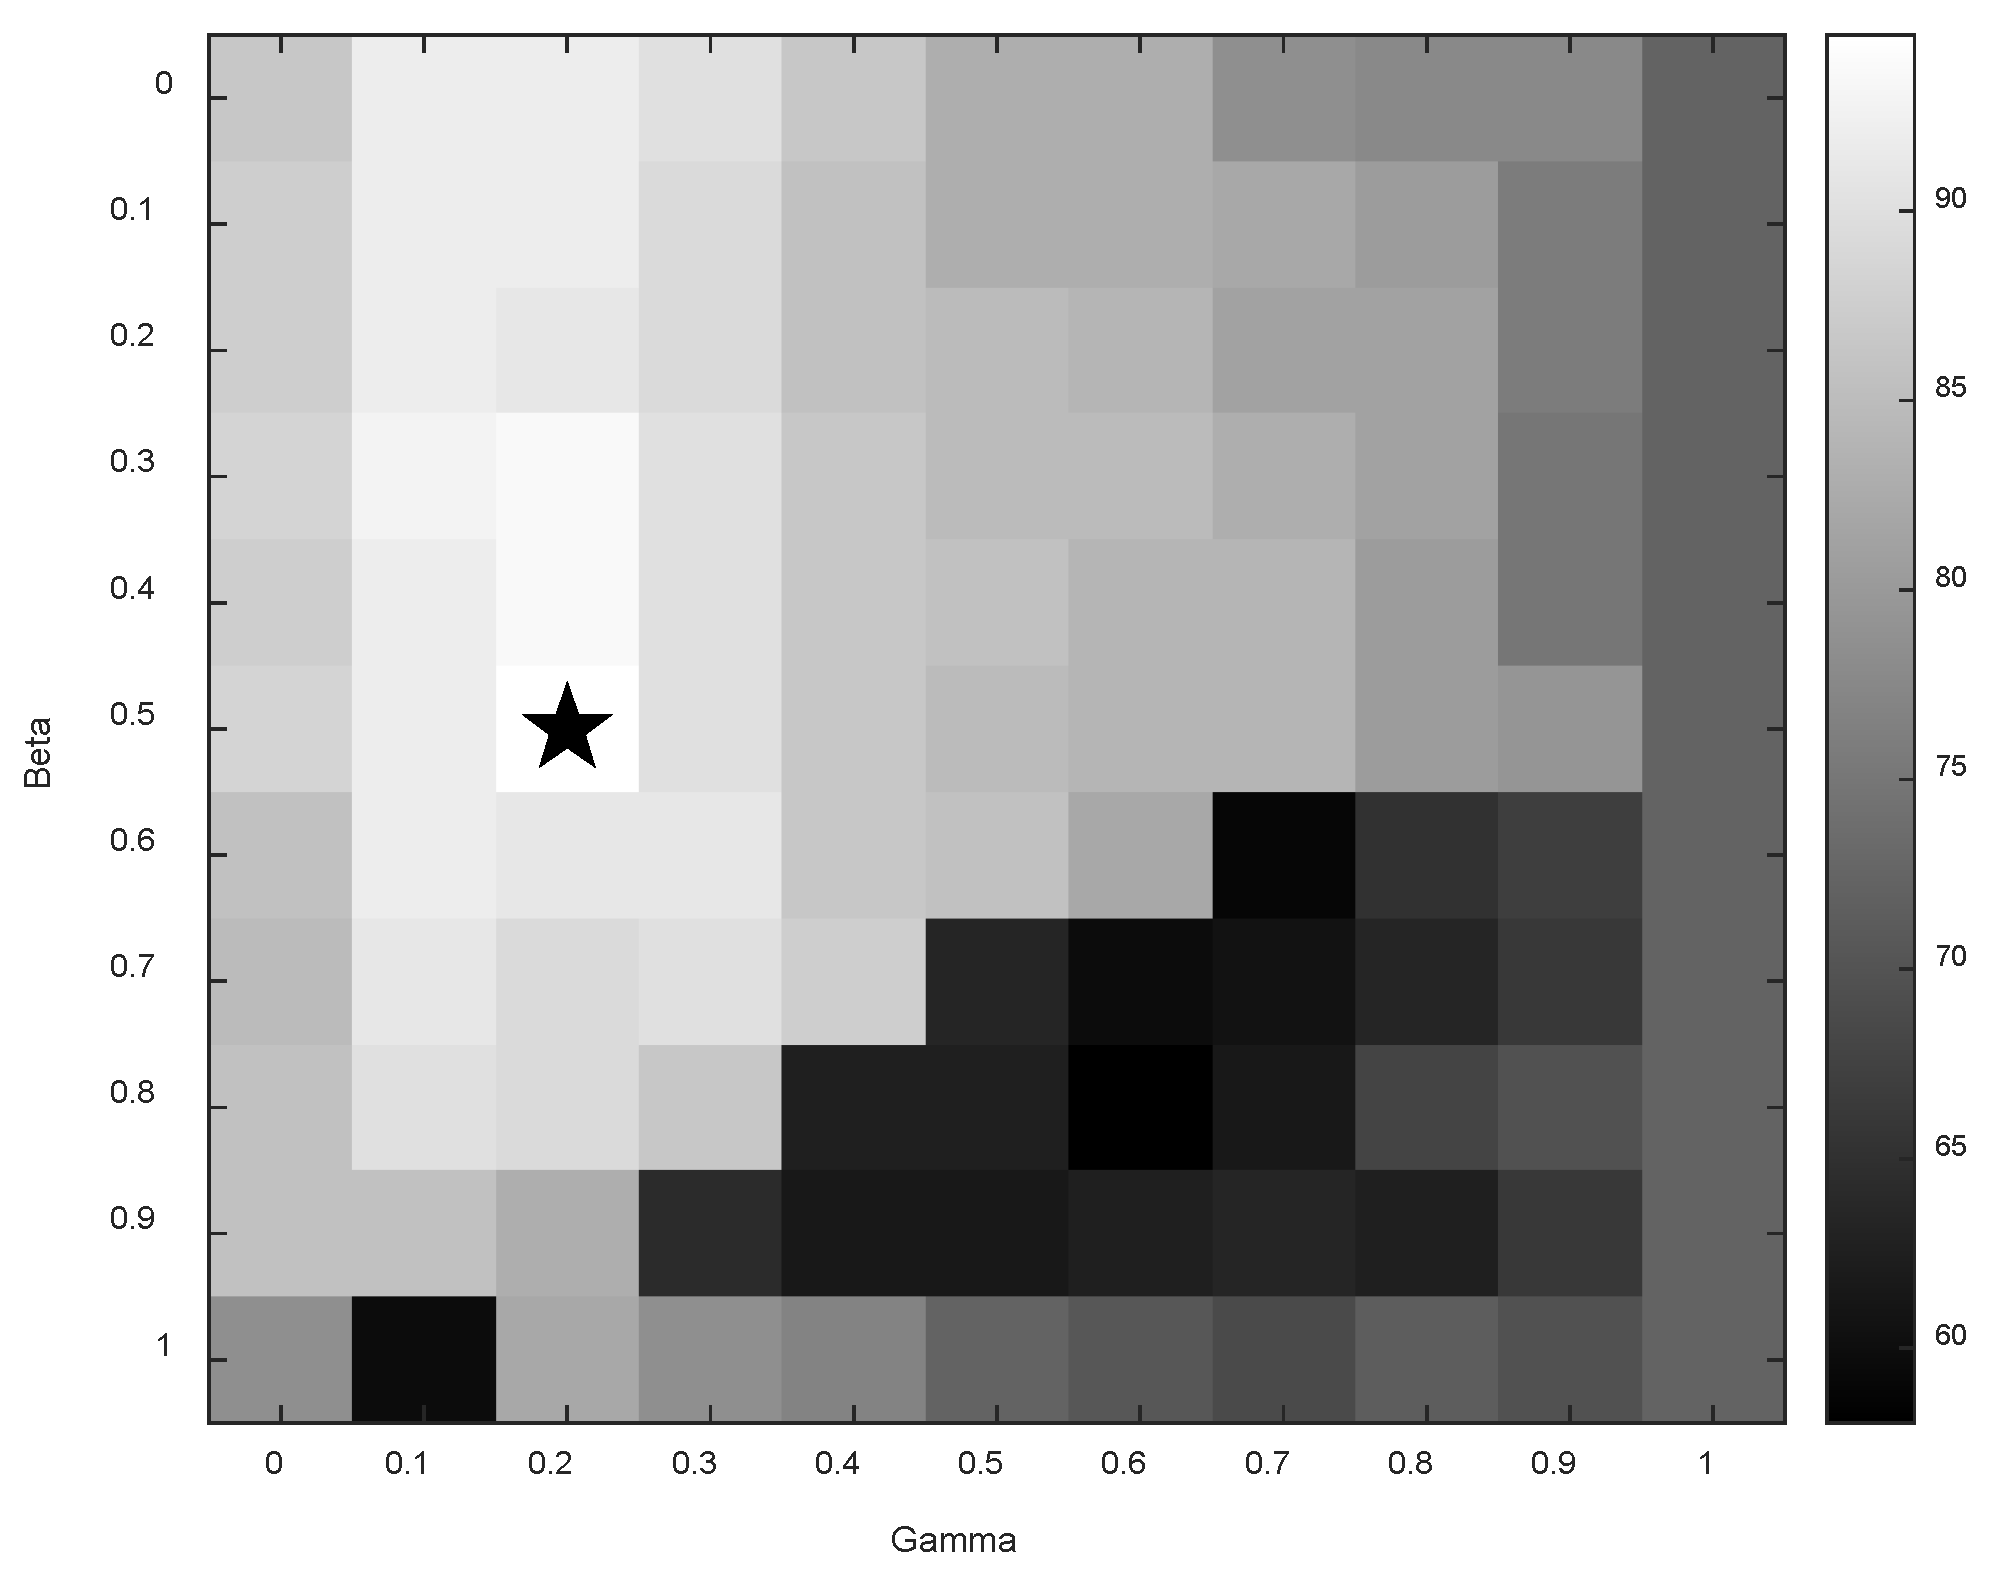
Figure 5 exhibits the classification accuracy of subject “aa” in Dataset I with a feature selection size of
= 2 under different parameter sets. In the figure, the X-axis represents the
value, and the Y-axis represents the
value. The brighter the color of the block, the higher the classification accuracy. The block marked with a star corresponds to the parameter set that yields the highest classification accuracy, with the regularization parameters
and
and the feature selection size
set to (0.5, 0.2, 2).
- 3.
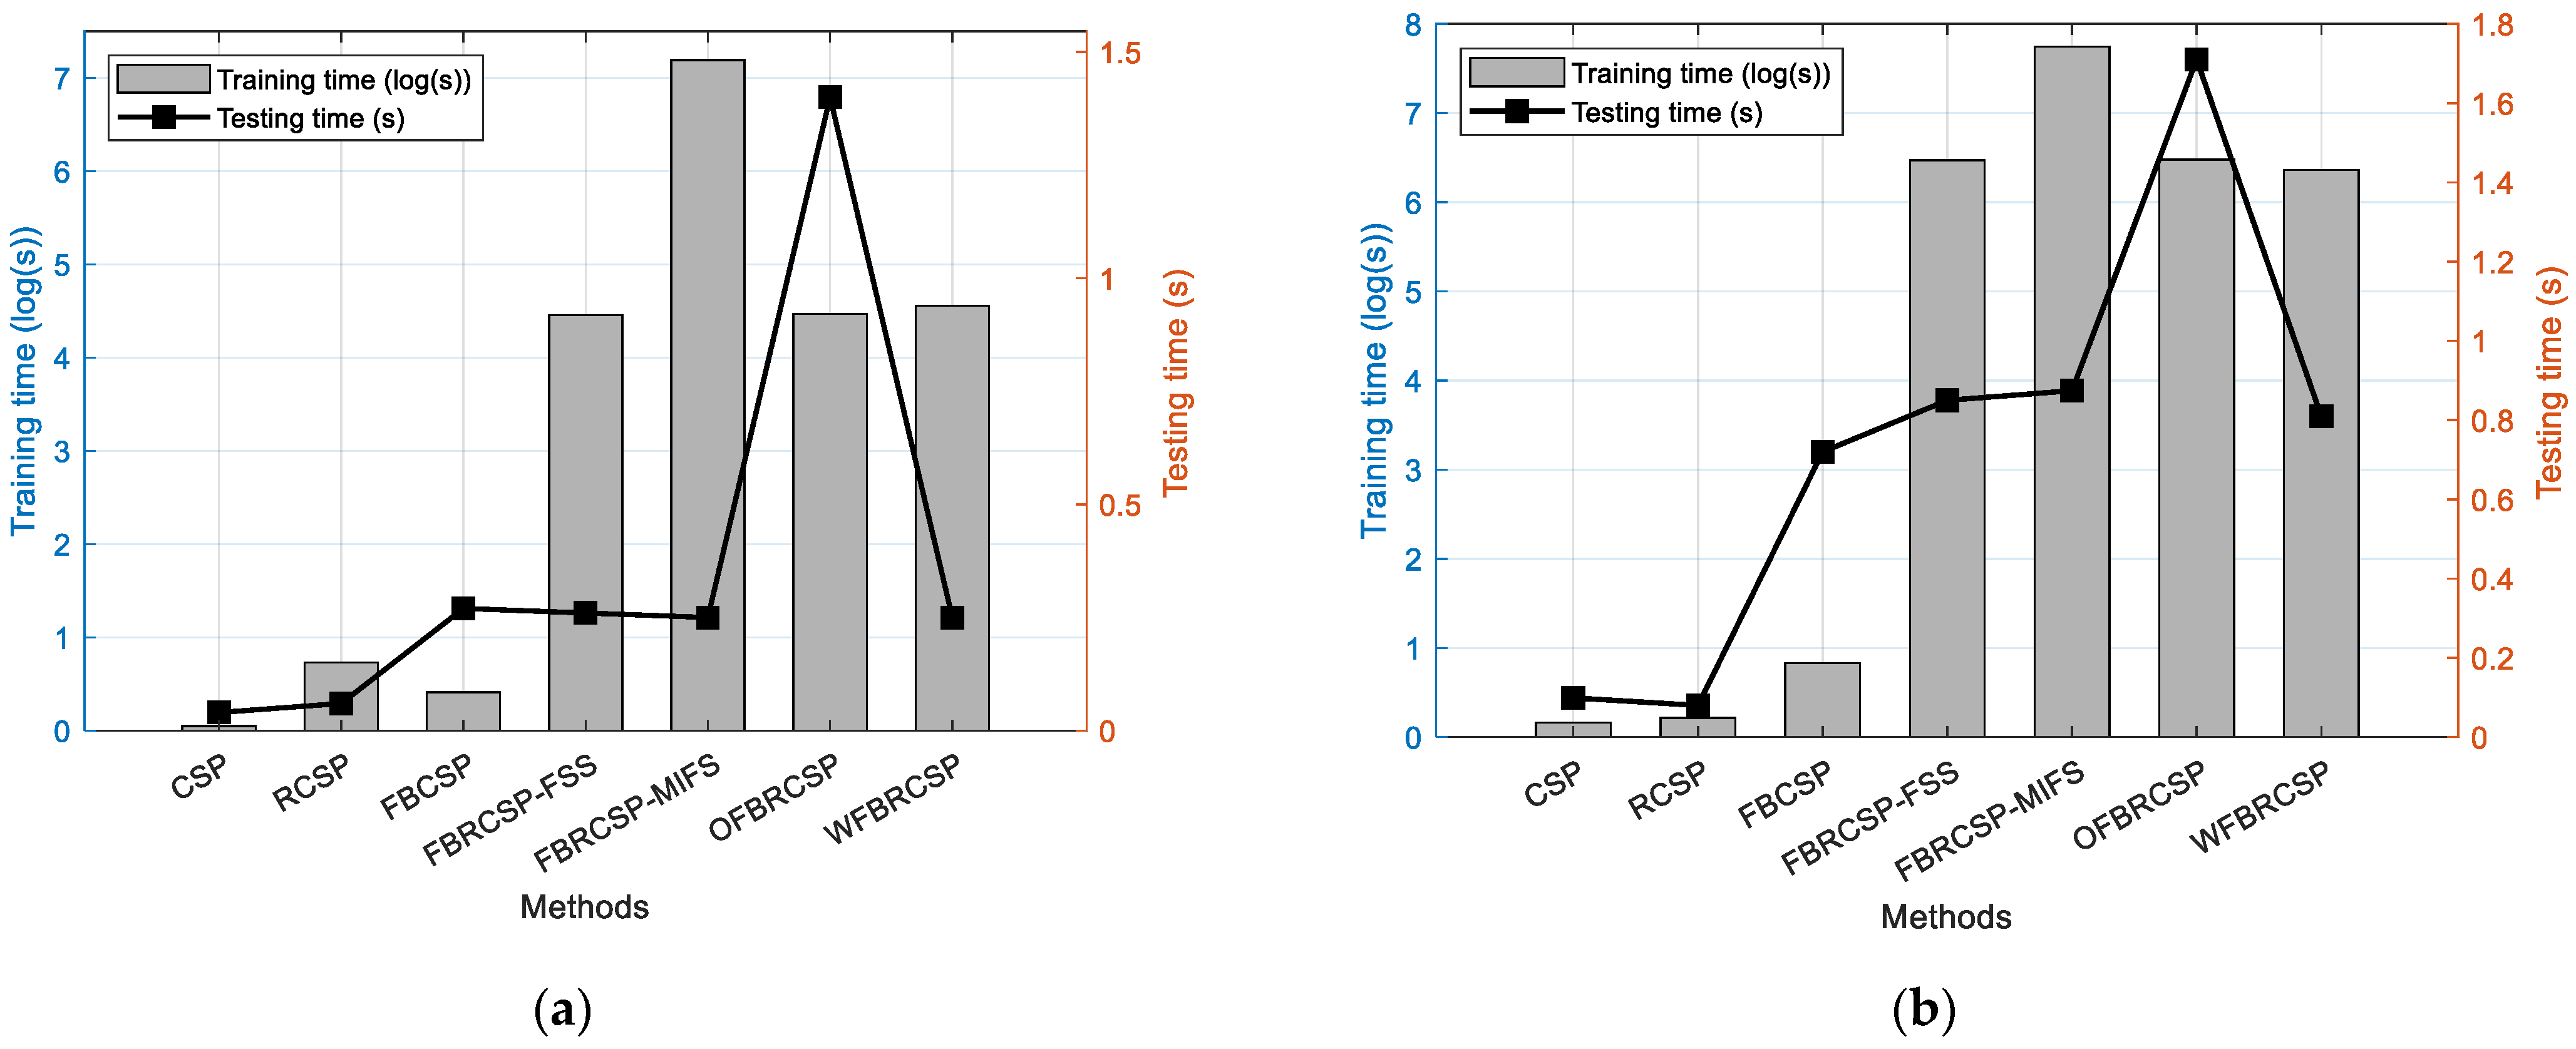
Comparison of Computational Time Between WFBRCSP and Various Methods
Figure 6 exhibits the total training time and total testing time for each method on the two datasets. The X-axis represents the methods, while the left Y-axis and right Y-axis represent the training time and testing time, respectively, both of which include the EEG data-preprocessing time.
- 4.
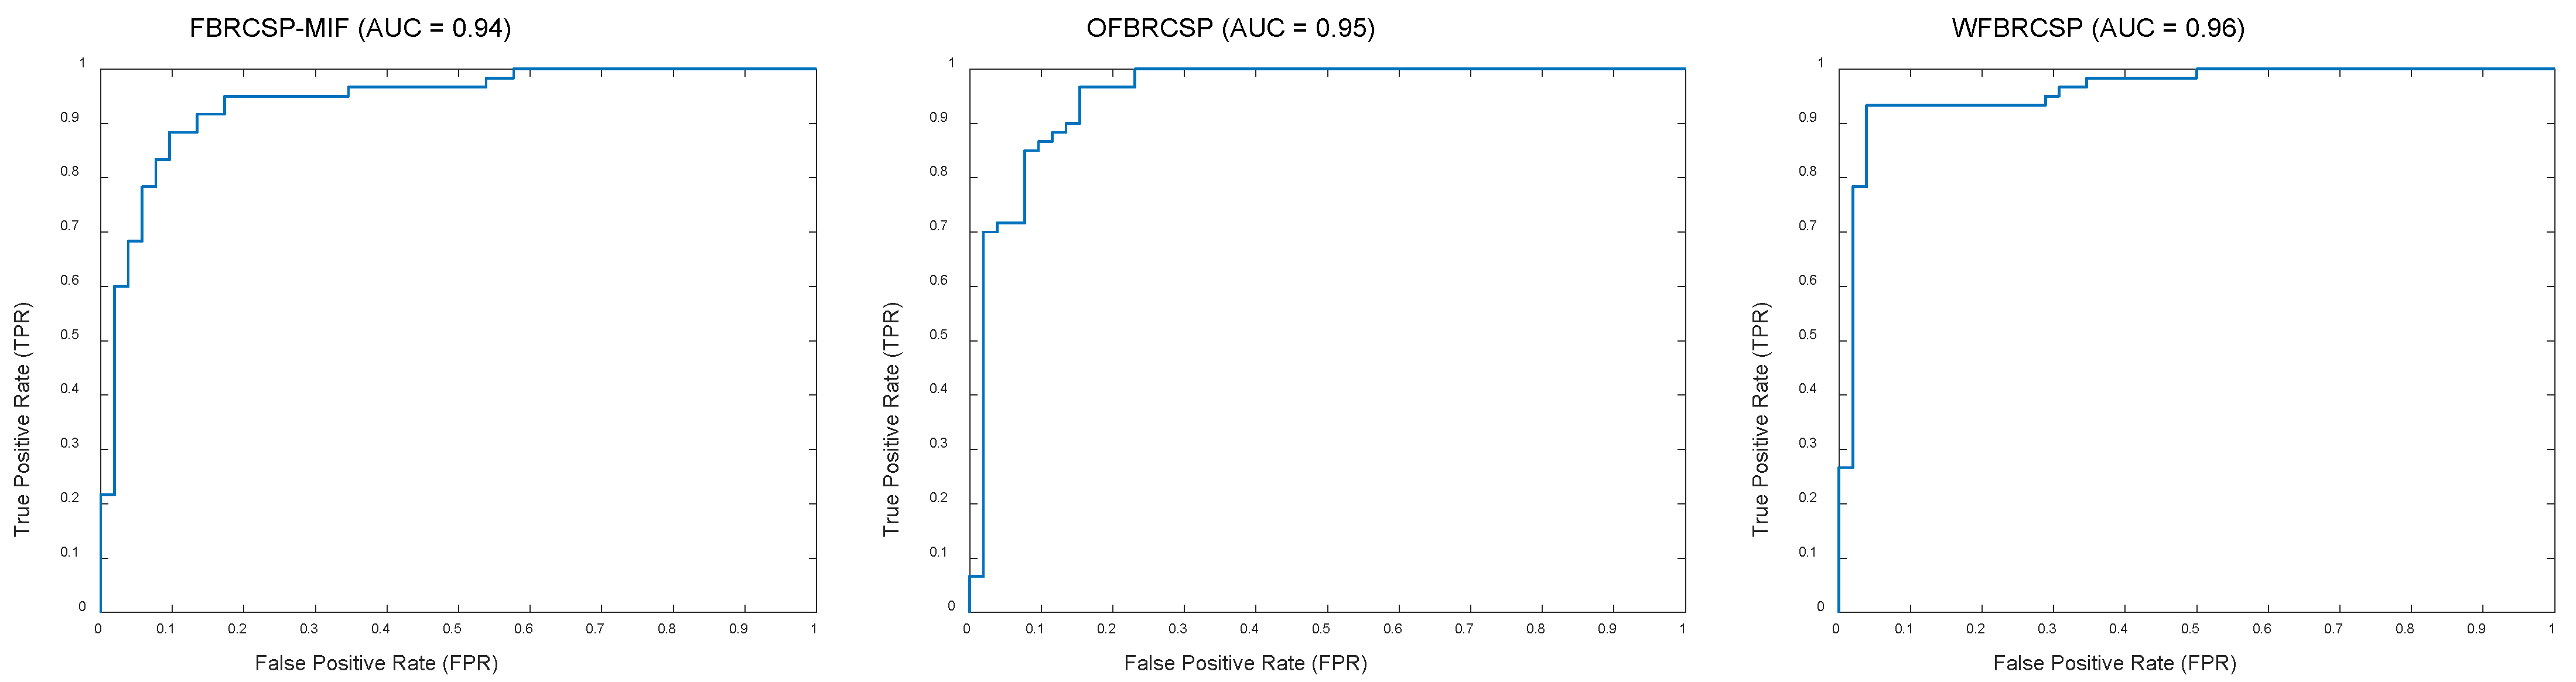
Comparison of ROC Curves and AUC Values Between WFBRCSP and Various Methods
Figure 7 exhibits the comparison of ROC curves and AUC values for various method models on subject “aa” in Data set I. The ROC curve is a widely used graphical representation to evaluate the performance of binary classification models. It exhibits the relationship between the true positive rate and the false positive rate, illustrating the model’s performance under different thresholds. The point in the top–left corner represents a high true positive rate and a low false positive rate. The steeper the curve, the better the model’s generalization ability. The AUC value represents the area under the ROC curve and is used to quantify the overall performance of the ROC curve. The larger the AUC value, the better the performance of the model.
5. Discussion
Based on the experimental results of the WFBRCSP, the following section will provide an in-depth discussion of these results.
As exhibited in
Table 1 and
Table 2, the CSP performed the worst in classification performance on both datasets, with average classification accuracies of 80.41% and 72.87%, respectively. The RCSP algorithm overcomes the limitations of the CSP algorithm in terms of overfitting, noise sensitivity, small sample sizes, and non-stationary data by introducing a regularization term, thus achieving better classification results than CSP. Due to the subject-specific nature of EEG signals, when using fixed frequency bands to filter EEG signals, the classification results of the CSP vary significantly between subjects. The FBCSP extracts CSP features from EEG signals across multiple sub-bands, addressing the dependency on frequency ranges, and therefore, its classification performance is superior to that of CSP. The FBRCSP algorithm demonstrates the advantages of the RCSP while also incorporating the benefits of FBCSP through the multi-filter bank structure, further improving its classification performance. The OFBRCSP uses a low Laplacian spatial filter, which calculates the weighted potential difference between the current electrode and neighboring electrodes to enhance local activity. It achieved a good average classification accuracy on BCICIII IVa, but performed poorly on BCICIV IIb, a dataset with fewer electrodes (C3, CZ, and C4). The effectiveness of the filter highly depends on the number and distribution of neighboring electrodes, and too few neighboring electrodes can lead to unbalanced weight distribution. As mentioned earlier, the subject-specific nature of EEG signals means that, in the RCSP algorithm, each source domain subject adjusts the covariance matrix with the same weight, without considering the correlation between subjects. The WFBRCSP introduces a regularization term based on subject data weights, using mutual information between subjects, to reconstruct the sample covariance matrix and adaptively balance the contribution of different subject data. This results in the highest average classification accuracies, with 87.87% and 85.92%, respectively. The average Kappa values of the WFBRCSP method for the two datasets are 0.76 and 0.72, respectively, the highest among all compared methods. This indicates that the proposed method excels in handling individual differences across subjects and ensuring stability in cross-subject tasks, further validating the effectiveness of WFBRCSP for motor imagery EEG signal decoding tasks.
Figure 5 provides an intuitive visual reference, illustrating the classification performance of subject “aa” under different regularization parameter settings. The experimental results show that subject “aa” is significantly influenced by parameter selection, with substantial variations in classification accuracy across different parameter configurations. When
= 0.2, subject “aa” achieved a relatively high classification accuracy. However, as the
increased to 0.3, the classification accuracy began to decline, indicating that subject “aa” performs better in suppressing variance than in suppressing bias. This further emphasizes the importance of parameter selection. In the WFBRCSP method, the use of SVM with ten-fold cross-validation provides a more reliable performance assessment. The parameter set selected by subject “aa” with a feature selection size
= 2 yielded the highest classification accuracy, further validating the effectiveness of the SVM for this task.
As exhibited in
Figure 6, although the CSP algorithm demonstrates limited classification performance, it maintains high computational efficiency, primarily dominated by the eigendecomposition of the covariance matrices
, with its space complexity determined by the storage requirements for covariance matrices [
28]. The RCSP algorithm preserves the core computational framework of the CSP while incorporating a covariance matrix regularization strategy. Although this introduces additional matrix summation operations
, the eigendecomposition remains the computational bottleneck, resulting in marginally increased training time while maintaining comparable testing time to the CSP.
The FBCSP algorithm employs a serial multi-sub-band processing mechanism, leading to computational complexity that scales linearly with the number of sub-bands , significantly increasing the computational burden. Building upon the FBCSP framework, the FBRCSP algorithm integrates regularization strategies. While maintaining the same order of computational complexity, it requires cross-validation to optimize multiple hyperparameters, consequently further extending the training duration.
Notably, the OFBRCSP algorithm incorporates Laplacian spatial filtering as a preprocessing step, introducing computational complexity closely related to channel neighborhoods , which results in the highest time consumption during the testing phase.
The proposed WFBRCSP algorithm innovatively introduces a mutual information weighting mechanism. While this increases the computational overhead for cross-subject correlation calculations during the training phase , its efficient testing phase performance makes it particularly suitable for real-time brain–computer interface applications, employing offline training and online testing paradigms. This design achieves an optimal balance between computational efficiency and classification performance, providing an effective solution for cross-subject motor imagery EEG decoding.
In this study, two feature selection methods, Fisher score and mutual information, are also compared within the FBRCSP method to evaluate their impact on the classification performance after feature extraction. The experimental results exhibit that, when using the Fisher score for feature selection, the classification accuracies reached 86.05% and 84.53%, slightly higher than the mutual information selection method, which achieved 86.03% and 84.1%. In addition, the average computation times for the Fisher score were 85.17 s and 645.26 s, much lower than the mutual information’s 1326.06 s and 2356.15 s. The calculation of the Fisher score only involves the computation of means and variances, making its computational complexity low and suitable for handling high-dimensional data. On the other hand, the mutual information method requires estimating the joint probability distribution, and especially for continuous data, discretization and kernel density estimation are needed. This results in higher computational complexity, leading to a significant increase in computation time. Therefore, although the improvement in classification accuracy is small, the computational efficiency advantage of the Fisher score makes it more effective in practical applications.
As exhibited in
Figure 7, compared to other methods, the WFBRCSP method has the highest AUC value of 0.96, with the steepest ROC curve that is closest to the top–left corner. The WFBRCSP model exhibits the highest true-positive rate and the lowest false-positive rate among the methods exhibited. The experimental results exhibit that adjusting subject weights based on inter-subject correlation when processing EEG signals across subjects helps to improve the model’s generalization ability.
As exhibited in
Table 3, the comparison of the main contributions of this paper with existing related work reveals key differences and innovations.
6. Conclusions
This study proposes an EEG decoding algorithm based on a weighted filter bank regularized common spatial pattern (WFBRCSP) to address the issues of individual differences in EEG signals and noise interference. The limitations of the traditional model are improved through the following methods:
The EEG signals are divided into nine sub-bands, and the correlation between the target subject and source domain subjects is calculated based on the mutual information maximization criterion. Adaptive weight allocation is performed to reduce the negative impact of low-correlation data;
- 2.
Regularized covariance matrix optimization:
A regularization parameter is introduced to merge the covariance matrices of the target subject and the source domain subjects, enhancing the feature stability under small sample sizes and non-stationary data;
- 3.
Efficient feature selection and classification:
The Fisher score is used to select highly discriminative features, and an SVM classifier is employed to achieve efficient decoding.
The experimental results exhibit that WFBRCSP achieves average classification accuracies of 87.87% and 85.92% on two public datasets (BCICIII IVa and BCICIV IIb), which is an improvement of approximately 7–13 percentage points compared to the traditional CSP. In addition, the WFBRCSP achieves an AUC value of 0.96 (for subject “aa”) in cross-subject scenarios, and the steeper ROC curve further validates its strong adaptability to individual differences. Although the training time of the WFBRCSP is relatively long, its testing time is short, making it suitable for real-time BCI systems with offline training and online testing.
This method has some areas for improvement. In the future, it can be extended to multi-class motor imagery tasks, such as hand, foot, and tongue movements, while maintaining high decoding performance. However, the computational complexity of multi-class tasks will increase, particularly in the design of spatial filters and classifiers. Specifically, spatial filters need to be computed for each task, and classifiers such as SVM will require more support vectors and training samples to accurately define decision boundaries, thereby increasing the computational cost of the model.
Future research could evaluate the performance of the WFBRCSP algorithm across a broader range of EEG tasks, assessing its adaptability to brain activity associated with different tasks, such as evoked potentials and cognitive tasks. By expanding the scope of evaluation, the potential for broader applications of the algorithm in the field of brain–computer interfaces (BCI) can be explored, thereby enhancing its practical applicability and robustness.
This study integrates transfer-learning with adaptive regularization strategies, providing a theoretical reference for the design of EEG-decoding algorithms and laying a technical foundation for their application in medical rehabilitation, neuroengineering, and other fields.


