Article

Influence of Agronomic Practices on the Antioxidant Activity of Three Mediterranean Officinal Wild Plants: Silybum marianum, Achillea millefolium, and Trifolium pratense

1
Department of Medicine and Surgery, University of Perugia, Piazza L. Severi 1, 06132 Perugia, Italy
2
Department of Civil and Environmental Engineering, University of Perugia, Borgo XX Giugno 74, 06121 Perugia, Italy
3
Department of Pharmaceutical Sciences, University of Perugia, Via del Giochetto, 06122 Perugia, Italy
*
Authors to whom correspondence should be addressed.
Appl. Sci. 2025, 15(9), 5153; https://doi.org/10.3390/app15095153
Submission received: 2 April 2025 / Revised: 2 May 2025 / Accepted: 5 May 2025 / Published: 6 May 2025
(This article belongs to the Section Chemical and Molecular Sciences)

Abstract

:
The aim of this study was to evaluate the influence of various agronomic factors on plant growth and the accumulation of secondary metabolites with antioxidant properties. The three Mediterranean Officinal Wild Plants selected for this investigation were Silybum marianum, Achillea millefolium, and Trifolium pratense whose extracts, enriched in phenolic compounds, are well documented for their potential therapeutic effects. Three agronomic factors were evaluated, each with two treatment options, resulting in eight experimental combinations: (1) inoculation with plant growth-promoting rhizobacteria (PGPR) versus control (no inoculation); (2) high versus low fertilization rates of K₂O and P₂O₅ to modulate nutrient availability; (3) water stress at 40% of field capacity compared to the control with full field capacity. Plant growth was monitored using the BBCH (Biologische Bundesanstalt, Bundessortenamt and CHemical industry) scale to delineate key phenological phases, with treatments applied until the flowering stage was reached. Only the leaves of the plants were collected, and hydroalcoholic extracts were prepared for the evaluation of total antioxidant capacity (TAC) using the FRAP, DPPH, and ABTS assays. These assays were selected due to their complementary insights into the chemical mechanisms underlying TAC, as well as their ability to assess the physicochemical characteristics of the phytochemical constituents.

1. Introduction

According to the World Health Organization (WHO), medicinal plants are defined as any plants containing substances in one or more of their organs that can be used for therapeutic purposes or serve as precursors in the synthesis of beneficial pharmaceutical compounds [1]. Plants biosynthesize a diverse range of secondary metabolites (in particular, phenolic species) that do not appear to be directly involved in primary metabolic processes [2]. Although these secondary metabolites are not essential for sustaining fundamental physiological functions, they provide significant benefits by promoting plant growth, aiding adaptation to changing environmental conditions, and protecting against environmental stressors and damage [3,4]. Several agronomic factors influence plant growth and the accumulation of secondary metabolites, which are critical for the antioxidant properties of herbal extracts due to their pharmaceutical and nutraceutical importance [5].
The literature suggests that fertilization, particularly with nitrogen, potassium, and phosphorus, plays a crucial role in influencing both crop yield and quality. For example, increasing soil potassium levels has been linked to a higher concentration of phenolic compounds, which contribute to the antioxidant activity of medicinal plants [6]. Similarly, manipulating nitrogen fertilization during plant growth significantly impacts phenolic compound production [7]. Some studies propose a “physiological trade-off” between plant growth and secondary metabolite synthesis, indicating that, phenolic concentrations tend to increase when nutrient availability is limited, particularly under lower nitrogen treatments [8,9].
Assessing the antioxidant capacity of plant extracts is key to understanding their health benefits [10,11,12]. Antioxidants act through various mechanisms, such as radical scavenging, metal ion chelation, and electron transfer. Since compounds may perform differently across assays due to varying conditions, using multiple assays offers a more thorough evaluation [10,11,12,13,14]. This approach also improves data reliability and strengthens conclusions about antioxidant health benefits.
Three common methods for measuring antioxidant capacity are the Ferric Reducing Antioxidant Power (FRAP), 2,2-diphenyl-1-picrylhydrazyl (DPPH), and 2,2′-azinobis (3-ethylbenzothiazoline-6-sulfonic acid) (ABTS) assays. Each assay has unique advantages and limitations, providing complementary insights into the antioxidant properties of plant extracts. Using multiple assays also enables cross-validation of results, reinforcing hypotheses about plant extracts’ efficacy and health benefits. Different compounds respond uniquely depending on their structural characteristics. For instance, FRAP favors phenolic compounds and metal chelators, while DPPH is more sensitive to electron-donating compounds like flavonoids and carotenoids. The ABTS assay accommodates a broader range of antioxidants, including phenolics, flavonoids, and vitamins.
In this manuscript, the phenological development of the three selected Mediterranean Officinal Wild Plants (MOWPs) Silybum marianum L. Gaertn (milk thistle), Achillea millefolium L. (yarrow), and Trifolium pratense L. (red clover) was observed and described in detail through photographs of various vegetative and reproductive key phenological stages, with focus on the plant portions growth of the leaves, stem, and flowers. The three selected MOWPs are recognized for their nutraceutical properties in the Mediterranean region. Notably, the phytocomplexes derived from these plants are rich in phenolic compounds, which are well documented for their potential therapeutic effects [15,16,17,18].
Silybum marianum is a spiny herbaceous species of the Asteraceae family. Under natural conditions, it typically remains in the vegetative stage during the first growing season following seed germination and is therefore commonly classified as a biennial plant [19]. It is considered a medicinal plant, cultivated for many important secondary metabolites expressing antioxidant activity, hepatoprotective effect, and antifibrotic properties [20,21].
Achillea millefolium is a perennial herbaceous plant belonging to the Asteraceae family. In traditional medicine, it is used as a tonic for blood circulation, antispasmodic, and hemostatic. The plant is rich in terpenic compounds such as cineole, pinene, and azulene, which enhance its phytochemical and pharmacological value [22].
Trifolium pretense belongs to the Fabaceae family and is a perennial herbaceous plant, although generally of limited longevity, typically no more than two years. It is mainly used as a forage plant, widespread throughout Europe, and known for its ability to fix atmospheric nitrogen in the soil. Recently, it has gained significant interest due to its richness in isoflavones [23].
The primary objective of this study was to evaluate the content of bioactive compounds in the selected MOWPs, as well as to assess the growth of the plants and the duration of their phenological stages. The effects of various combinations of agronomic factors on the presence of antioxidants were investigated through multiple assays conducted on different plant parts (leaves, stems, and flowers) of the cultivated species. This approach aimed to identify the most effective agronomic combinations for maximizing the yield of secondary metabolites.

2. Materials and Methods

2.1. Study Area

The experiment was carried at the Terminillo Apennine Center “Carlo Jucci” in the Province of Rieti, a University of Perugia agricultural experimental center in a controlled environment to avoid water inputs from rainfall but with temperatures identical to the outdoor environment. Rieti is situated at an altitude of about 405 m above sea level in central Italy’s Lazio region. It lies within the Rieti plain surrounded by mountains such as Mount Terminillo to the east. This geographical setting influences its climatic conditions by moderating temperature extremes compared to coastal areas. The climate of the study area is characterized by a “humid temperate climate” with a Köppen classification of Cfb, with cool winters and hot summers with significant precipitation throughout the year [24]. Overall, Rieti’s climate combines elements typical of both temperate inland regions and Mediterranean influences due to its location near mountainous terrain but still within a broader Mediterranean climatic zone. Temperature during the study period was evaluated by calculating 10-day mean temperature values and through the GDD amounts with a base temperature of 0 °C for analyzing the relationships of climatic effects on phenological stages for each species.

2.2. Experimental Design

Seed vernalization was initially performed by immersing the seeds in 20 mL of sterile distilled water, followed by a 48 h incubation period at 4 °C in the dark. Subsequently, the seeds were sown in multi-pots (40 pots, each with a 2.5 cm diameter) and maintained under controlled temperature conditions. Upon germination, the seedlings were transplanted into larger pots (20 cm × 20 cm × 15 cm) and placed outdoors under natural environmental conditions. The experimental design, a three-factorial pot experiment incorporating three binary factors, was conducted to examine the cultivation of selected species under varying environmental and agronomic conditions (Table 1). The study was performed under controlled conditions, utilizing eight distinct combinations of factors, resulting in eight possible cultivation protocols (23 combinations). Each factor was assigned a binary value, with (1) representing the maximum level and (0) representing the minimum level. Each treatment combination was replicated five times. The study evaluated the effects of drought stress by comparing full irrigation at field capacity (1) with irrigation at 40% relative soil moisture (0) representing no stress and severe stress conditions, respectively. Furthermore, the influence of inorganic fertilizers, specifically P2O5 and K2O, was assessed, with treatments applying either minimum or maximum quantities. In addition, the contribution of plant growth-promoting rhizobacteria (PGPR) is regarded as a key anti-stress factor, playing a crucial role in mitigating environmental stresses and enhancing plant resilience. The cultivation medium consisted of an organic substrate with a pH of 5.5 and nitrogen fertilization at 180 mg N/L. Each treatment combination was tested with five plant pot replications, each containing 0.78 dm3 of substrate.

Agronomical Factors

Drought stress was applied before and during early flowering stage. Soil moisture was measured every day by an electronic depth probe (Aicevoos Digital Soil Tester, Aicevoos, Wuhan, China). Samples treated with water stress were maintained for 5 weeks at 40% of relative soil moisture. For convenience, the relative soil moisture value was correlated with the field capacity through the method of pot weighing and measuring with the probe in the soil. Full soil water capacity was considered at around 70% moisture value.
A lower-nutrient soil was used for the experiment and leaves fertilization with phosphorus pentoxide (P2O5) and potassium oxide (K2O) was carried out three times, the first after 44 days after sowing, the second after 69 days, and the third after 78 days. To prepare the fertilizer solution, 2.5 g of product (bottos–Pregade 30–20) was weighed and diluted in 2 L of water, and this solution was distributed by a pressure sprayer onto the leaves of the plants grown in accordance with the protocol that included the presence of the fertilizer.
The plant growth-promoting rhizobacteria (PGPR) utilized in the experiment was a commercial product containing a mixture of endomycorrhizal bacteria and fungi, including Bacillus spp., Streptomyces spp., and Pseudomonas spp. (with a rhizosphere bacterial content of 1.6 × 10⁸ CFU/g), and Trichoderma spp. (with a mycorrhizal fungal content of 5 × 10⁵ CFU/g). The product was inoculated into the growing substrate at a rate of 10 g per 100 seedlings. The first application was made immediately after transplanting (30 days after sowing), and the second application was performed 20 days later.

2.3. Evaluation of Growth Trend Using BBCH Scales

In this manuscript, the phenological development of three selected MOWPs is described using the extended BBCH (Biologische Bundesantalt, Bundessortenamt, and Chemische Industrie) scale, with growth stages categorized using both the 2-digit BBCH coding systems [25]. Representative photographs of the key phenological stages are included to supplement the discussion. Observations were recorded weekly, indicatively at late morning mid-week, starting from sowing to full vegetative development for Silybum marianum and to the beginning of flowering for the other two species.

2.4. Plant Material

The plants of Silybum marianum, Achillea millefolium, and Trifolium pratense were collected in October and immediately oven-dried at 45 °C for 3 days to obtain dry matter. IKA® Tube Mill Control (IKA®-Werke GmbH & co. KG, Staufen, Germany) was used to pulverize the dried plants (20,000 rpm for 45 s).

Reagents Employed for the Appraisal of the Total Antioxidant Capacity (TAC) with the Three Spectrophotometric Assays

Methanol (MeOH), ethanol (EtOH), potassium persulfate (K2S2O8), 2,2′-Azino-bis-(3-ethylbenzothiazoline-6-sulphonate) diammonium salt (ABTS), 2,4,6-tris(2-pyridyl)-s-triazine (TPTZ), 6-hydroxy-2,5,7,8-tetramethyl-2-carboxylic acid (Trolox), 2,2-diphenyl-1-picrylhydrazyl (DPPH), ferric chloride (FeCl3), and sodium acetate (NaOAc) were purchased from Merck Life Science S.r.l. (Milan, Italy).

2.5. Extraction of the Phenols Containing Phytocomplex

The powdered plants (30 mg) were extracted using 4 mL of an EtOH/water (50/50, v/v) solution through sonicating for 30 min at room temperature (r. t.). The mixture was then centrifuged (5000 rpm for 20 min at 4 °C) and the supernatant was collected and stored at 4 °C until analyzed.

2.5.1. Evaluation of the TAC Using the FRAP Method

The FRAP assay was performed with slight modifications to the method described in [13,26,27,28]. For the preparation of the FRAP reagent, 2.5 mL of a 10 mM TPTZ solution in 40 mM aqueous HCl and 2.5 mL of a 20 mM FeCl3 aqueous solution were combined with 25 mL of 300 mM aqueous NaOAc (pH 3.6). The assay was conducted by mixing 100 μL of the ethanol/water extract, 100 μL of bi-distilled water, and 1.5 mL of the FRAP reagent. The solution was then incubated at room temperature in the dark for 4 min. Absorbance was measured at 570 nm. The total antioxidant capacity (TAC) values were determined using a calibration curve prepared with Trolox (as the standard), where the Trolox solutions were treated following the same procedure used for the samples (calibration curve range: 0.01–0.25 mg/mL; R2 = 0.996). For the measurements, 0.2 mL of the solutions were used. All experiments were performed in triplicate for each extract, and the results are expressed as mg of Trolox equivalents (TEs) per gram of dry extract.

2.5.2. Evaluation of the Radical Scavenging Capacity by the DPPH Method

The DPPH assay was performed with slight modifications to the method described in [13,26]. DPPH was dissolved in ethanol to obtain a solution with an absorbance of 0.65 (±0.02) at 517 nm, and the absorbance value was allowed to stabilize for 2 h. Subsequently, 50 µL of the ethanol/water extract was added to 2.95 mL of the stabilized DPPH solution, and the mixture was kept at room temperature in the dark for 30 min. Absorbance was measured at 517 nm. The radical scavenging capacity was determined from a calibration curve prepared using Trolox (as the surrogate standard) solutions, which were treated in the same manner as the studied samples (calibration curve range: 0.005–0.25 mg/mL; R2 = 0.993). For the measurements, 0.2 mL of the solutions were used. All experiments were performed in triplicate for each extract, and the results are expressed as mg of Trolox equivalents (TEs) per gram of dry extract.

2.5.3. Evaluation of the Radical Scavenging Capacity Using the ABTS Method

Two volumes of an aqueous ABTS•+ solution (0.36% w/v) were mixed with one volume of a 0.2% aqueous K2S2O8 solution. The flask was covered with aluminum foil and left overnight at room temperature in the dark. The resulting ABTS•+ solution was then diluted with ethanol until the absorbance reached 0.70 (±0.05) at 690 nm. To 0.06 mL of the ethanol/water extract, 4.0 mL of the ABTS•+/ethanol solution was added, and the mixture was allowed to stand in the dark for 6 min. Absorbance was measured at 690 nm. The radical scavenging capacity was determined from a calibration curve prepared with Trolox (used as the surrogate standard), with solutions treated in the same manner as the studied samples (calibration curve range: 0.01–0.75 mg/mL; R2 = 0.998). For the measurements, 0.2 mL of each solution was used. All experiments were performed in triplicate for each extract, and the results are expressed as mg of Trolox equivalents (TEs) per gram of dry extract.

2.6. Instrumentation

UV/Vis spectrophotometric assays were performed using a Sunrise™ Absorbance microplate reader (TECAN, Männedorf, Switzerland). All the spectrophotometric experiments were performed using disposable optical Corning® 96-well plates from Merck Life Science (Merck KGaA, Darmstadt, Germany) and a Sunrise microplate reader (Tecan Italia S.r.l., Milan, Italy).
Liquid chromatographic separation and mass spectrometric analysis were performed on a UHPLC-MS/MS system consisting of an Agilent 1290 Infinity II combined with the Agilent 6560 mass spectrometer (Agilent Technologies Inc., Santa Clara, CA, USA). The chromatographic separation was performed using a ZORBAX RRHD Eclipse Plus C18 column (50 mm × 2.1 mm, 1.8 µm, 95 Å, Agilent Technologies Inc.). UHPLC eluent A was water (LC-MS grade, LiChrosolv, Supelco, Merck KGaA, Darmstadt, Germany) with 0.1% (v/v) formic acid (LC-MS grade, LiChropur, Supelco, Merck KGaA, Darmstadt, Germany) while eluent B was acetonitrile (LC-MS grade, LiChrosolv, Supelco, Merck KGaA, Darmstadt, Germany). The optimized gradient program was the following: 0–3.5 min, 5% (v/v) B; 3.5–5 min, 5–25% (v/v) B; 5–9 min, 25–35% (v/v) B; 9–11.5 min, 35–97% (v/v) B; 11.5–12.5 min, 97% (v/v) B; 12.5–13 min, 97–5% (v/v) B; 13–17 min, 5% (v/v) B (column equilibration/conditioning). The column temperature was set at 25 °C and the flow rate at 0.3 mL/min. The injection volume was 5 µL. The UV–Vis chromatograms were recorded at 250, 280, 320, and 350 nm. For MS detection, the Dual AJS ESI source operated in positive ion mode. The gas temperature was set at 300 °C with a flow of 5 L min−1 while the sheath gas temperature was 350 °C with a flow of 11 L/min. The nebulizer pressure was set at 35 psi and the Capillary and Fragmentor voltages were 3500 V and 300 V, respectively. In the case of MS2 analysis, multiple experiments using the iterative algorithm of the instruments were carried out. The fragmentation patterns of the compounds were recorded at a fixed collision energy (20 eV) with an isolation width of 4 m/z. The Masshunter Workstation Data Acquisition 10.0 (Agilent Technologies Inc., Santa Clara, CA, USA) program was used for data acquisition while the Masshunter Qualitative Analysis 10.0 (Agilent Technologies Inc., Santa Clara, CA, USA) software was used for data processing.

2.7. Statistics

All the analyses were performed in triplicate, and the values were reported as the mean ± standard deviation (SD) of the three independent analyses. The Statistica 12.0 software (StatSoft GmbH, Hamburg, Germany) was used to perform the statistical analyses. The significant differences among the studied parameters were analyzed using a one-way ANOVA, followed by a post-hoc Tukey’s Honestly Significant Difference (HSD) test at a significance level of p ˂ 0.01. The correlation between the total polyphenol content, DPPH antioxidant capacity, and FRAP-reducing power was evaluated through a Pearson correlation test.

3. Results and Discussion

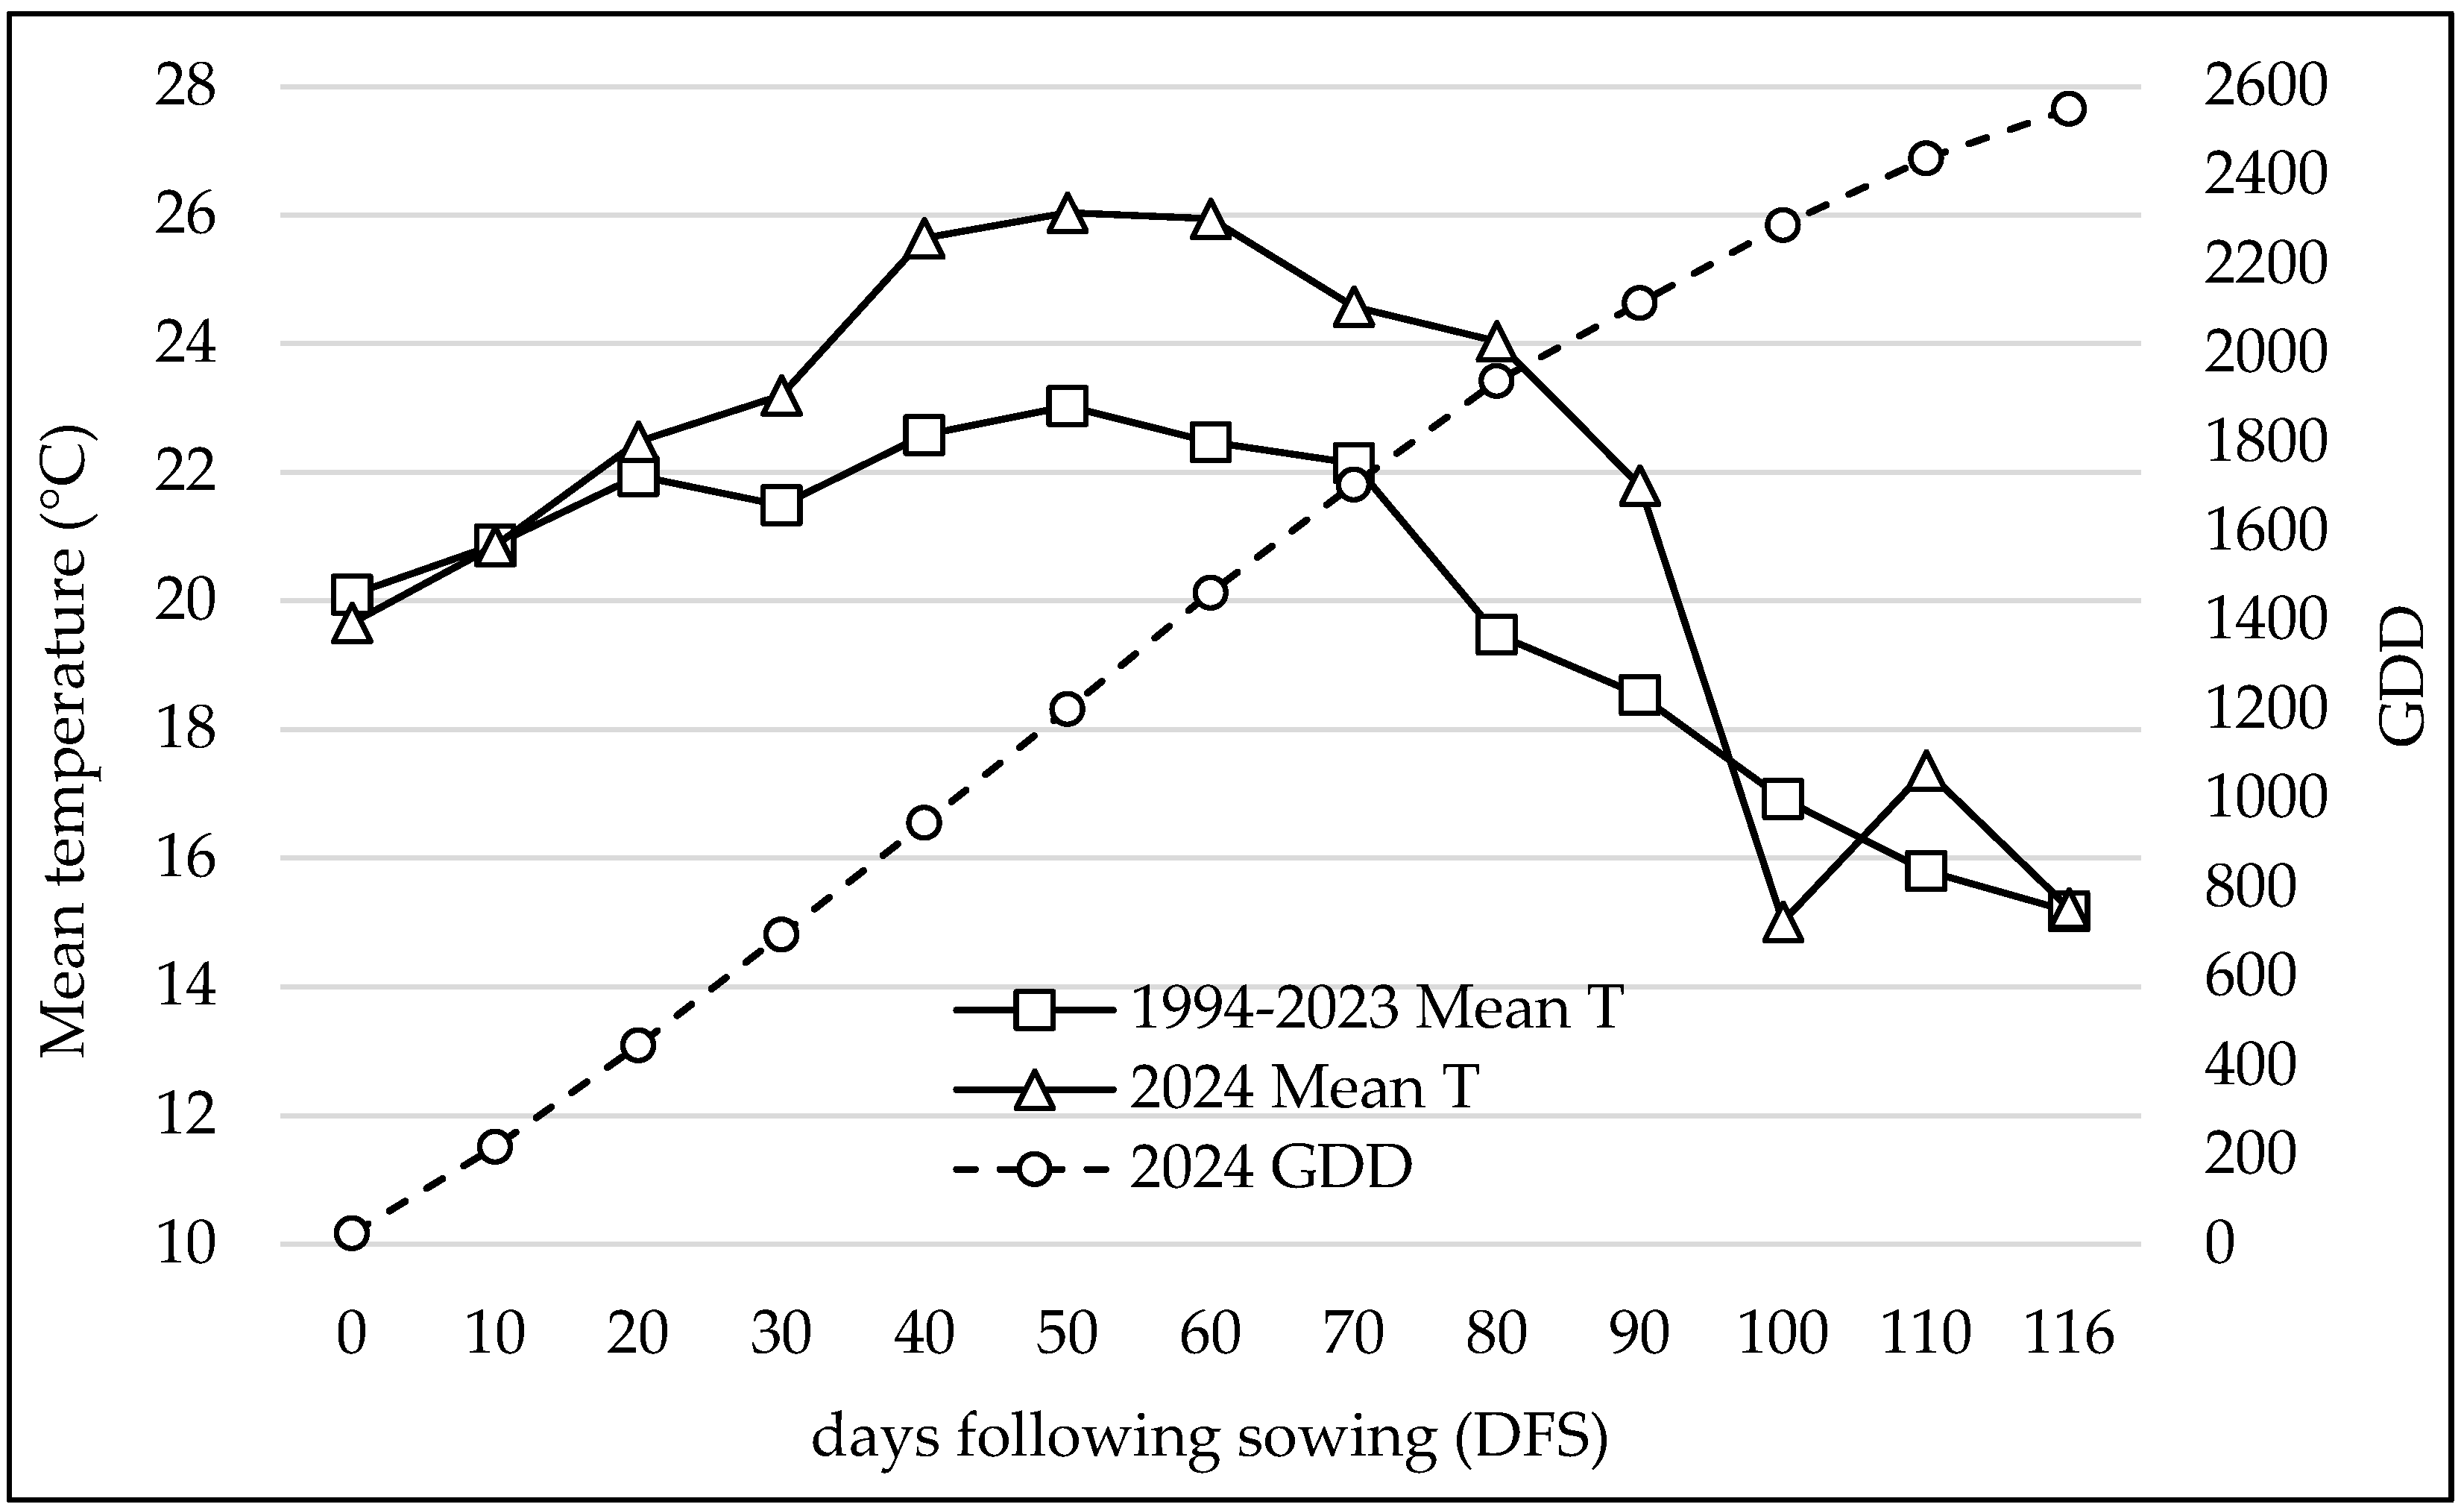
3.1. Study Area Climate Conditions

The 10-day mean temperature values calculated in 2024 evidenced higher values in comparison to those of the precedent 30-year period. In Figure 1, the mean temperature and the GDD from the sowing period to the harvest were shown, and high differences in 2024 were recorded above all during July and August when the mean temperature showed about 3 °C higher than the historical data. Moreover, in 2024, a rapid reduction of mean temperature was recorded at the beginning of September with a drop of about 7 °C in a few days, which consequently determined a lower GDD accumulation during the last phenological phase development.

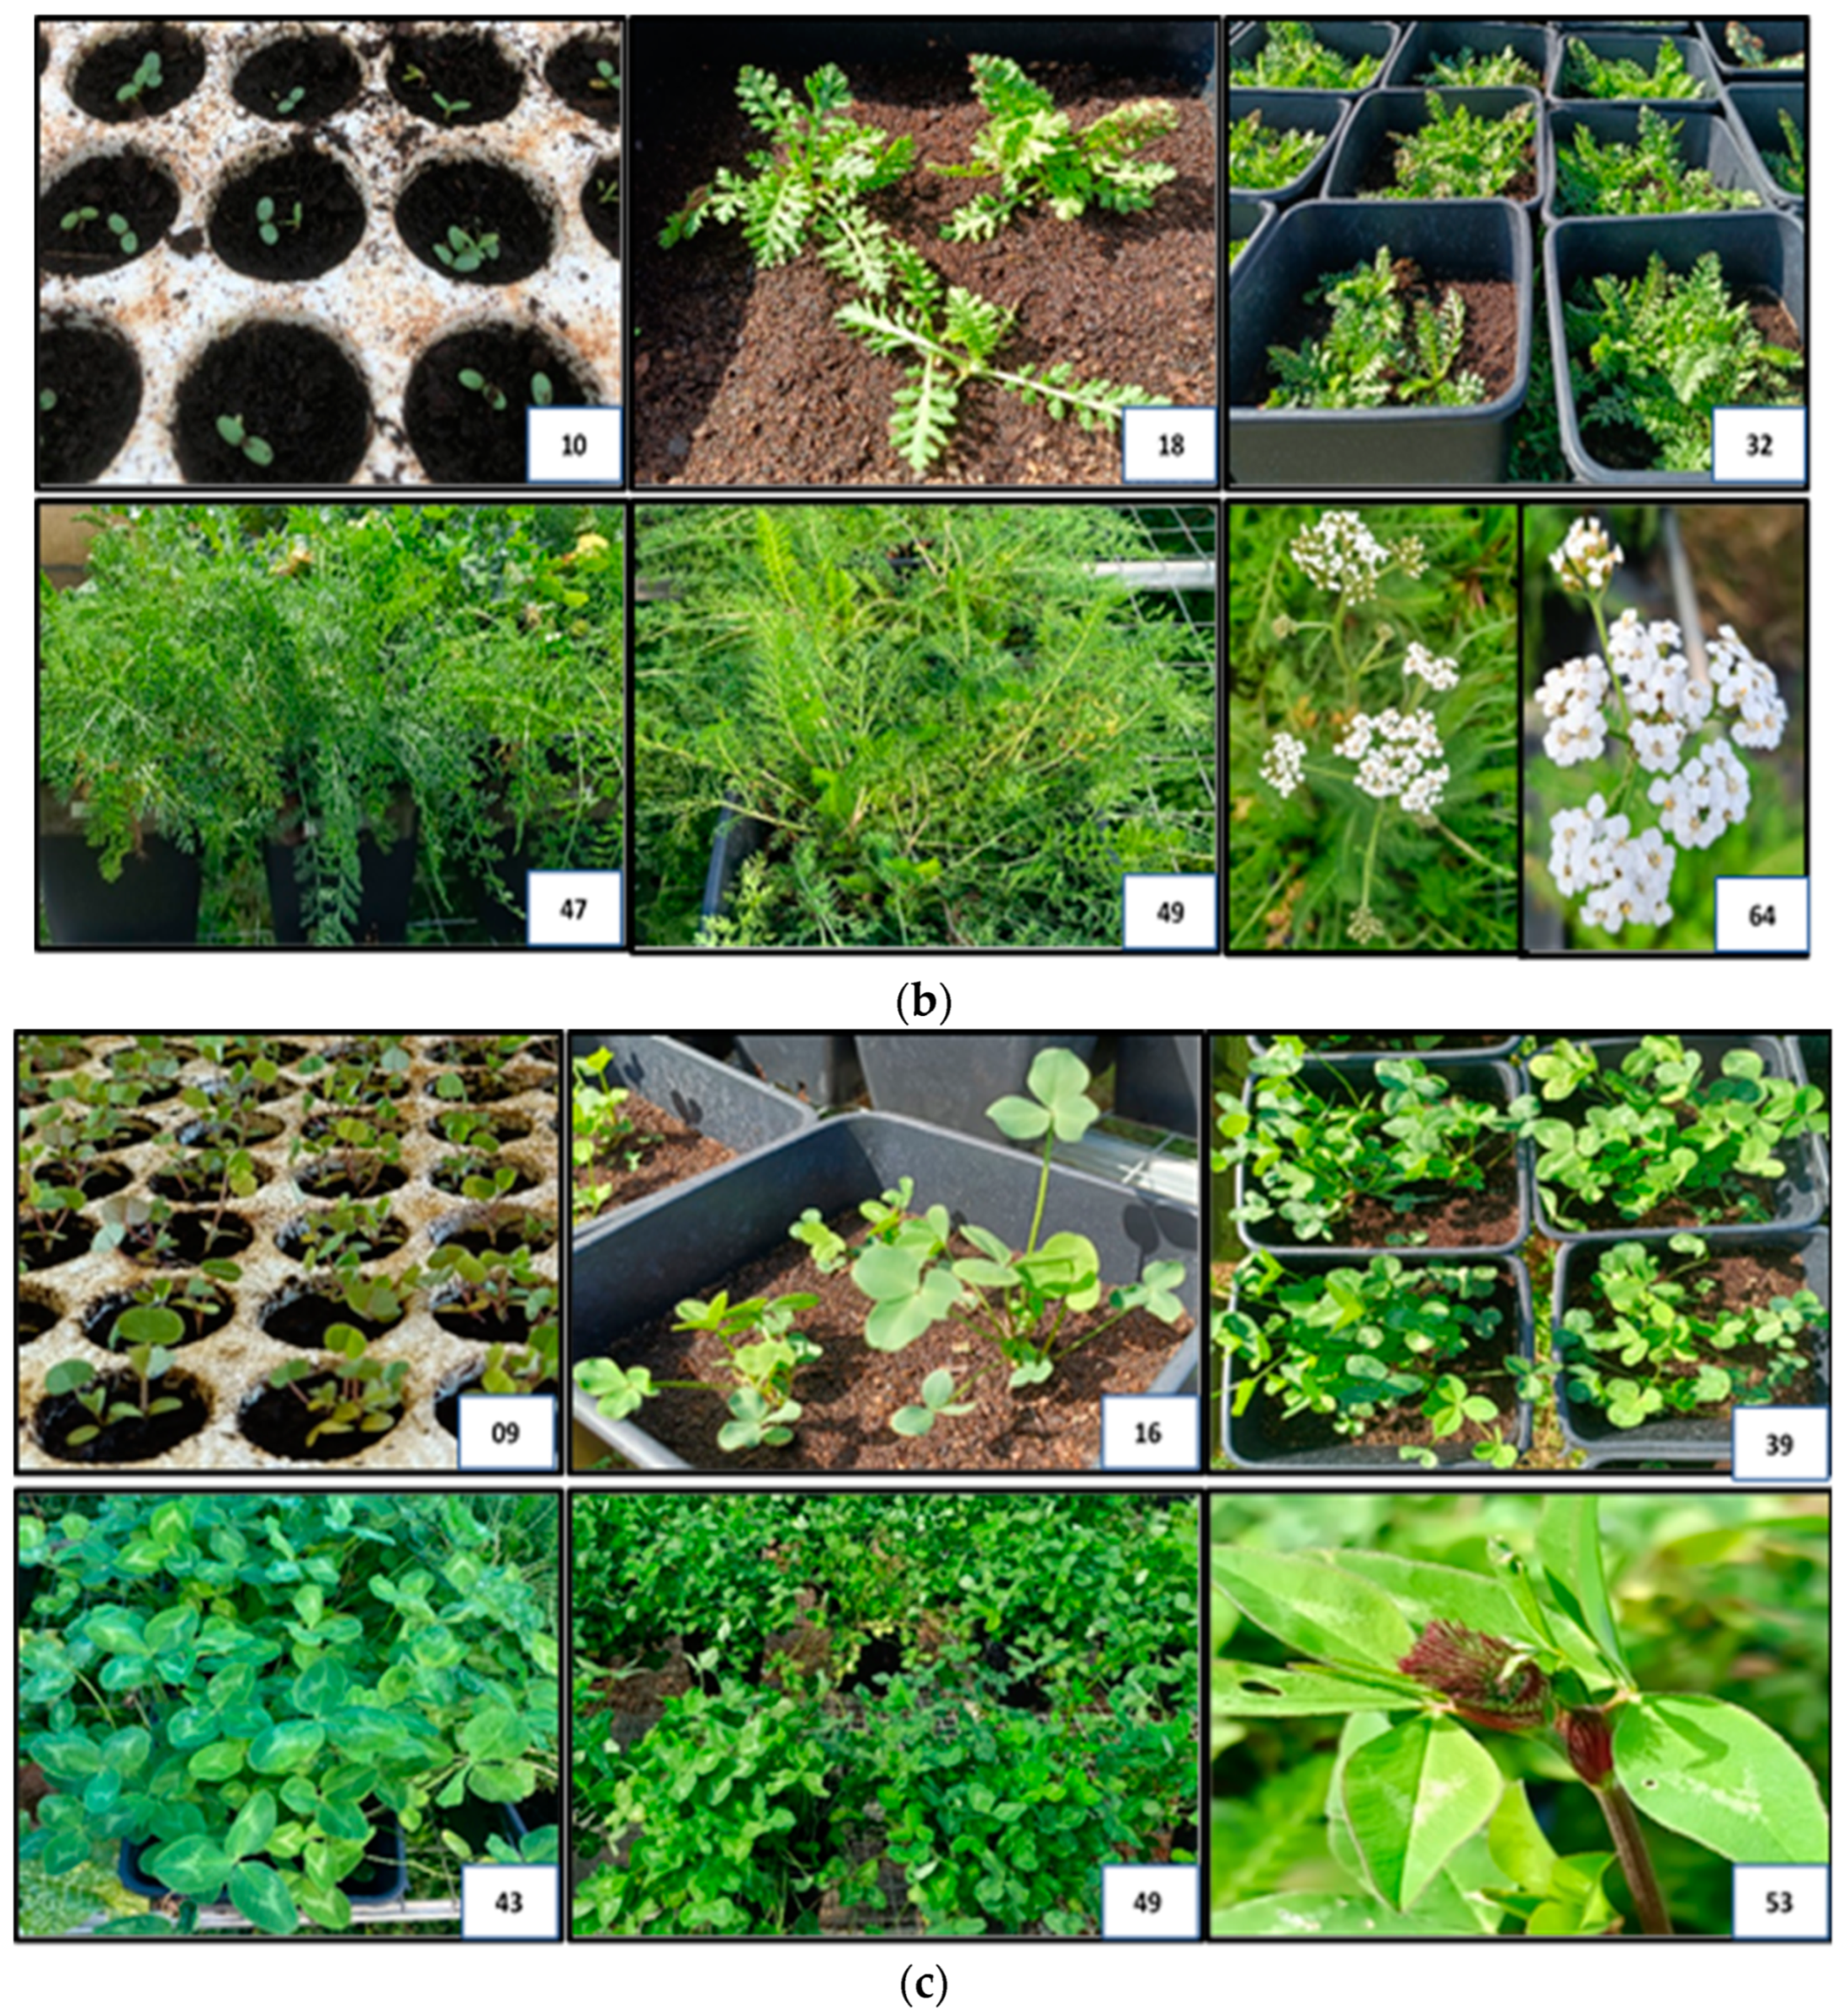
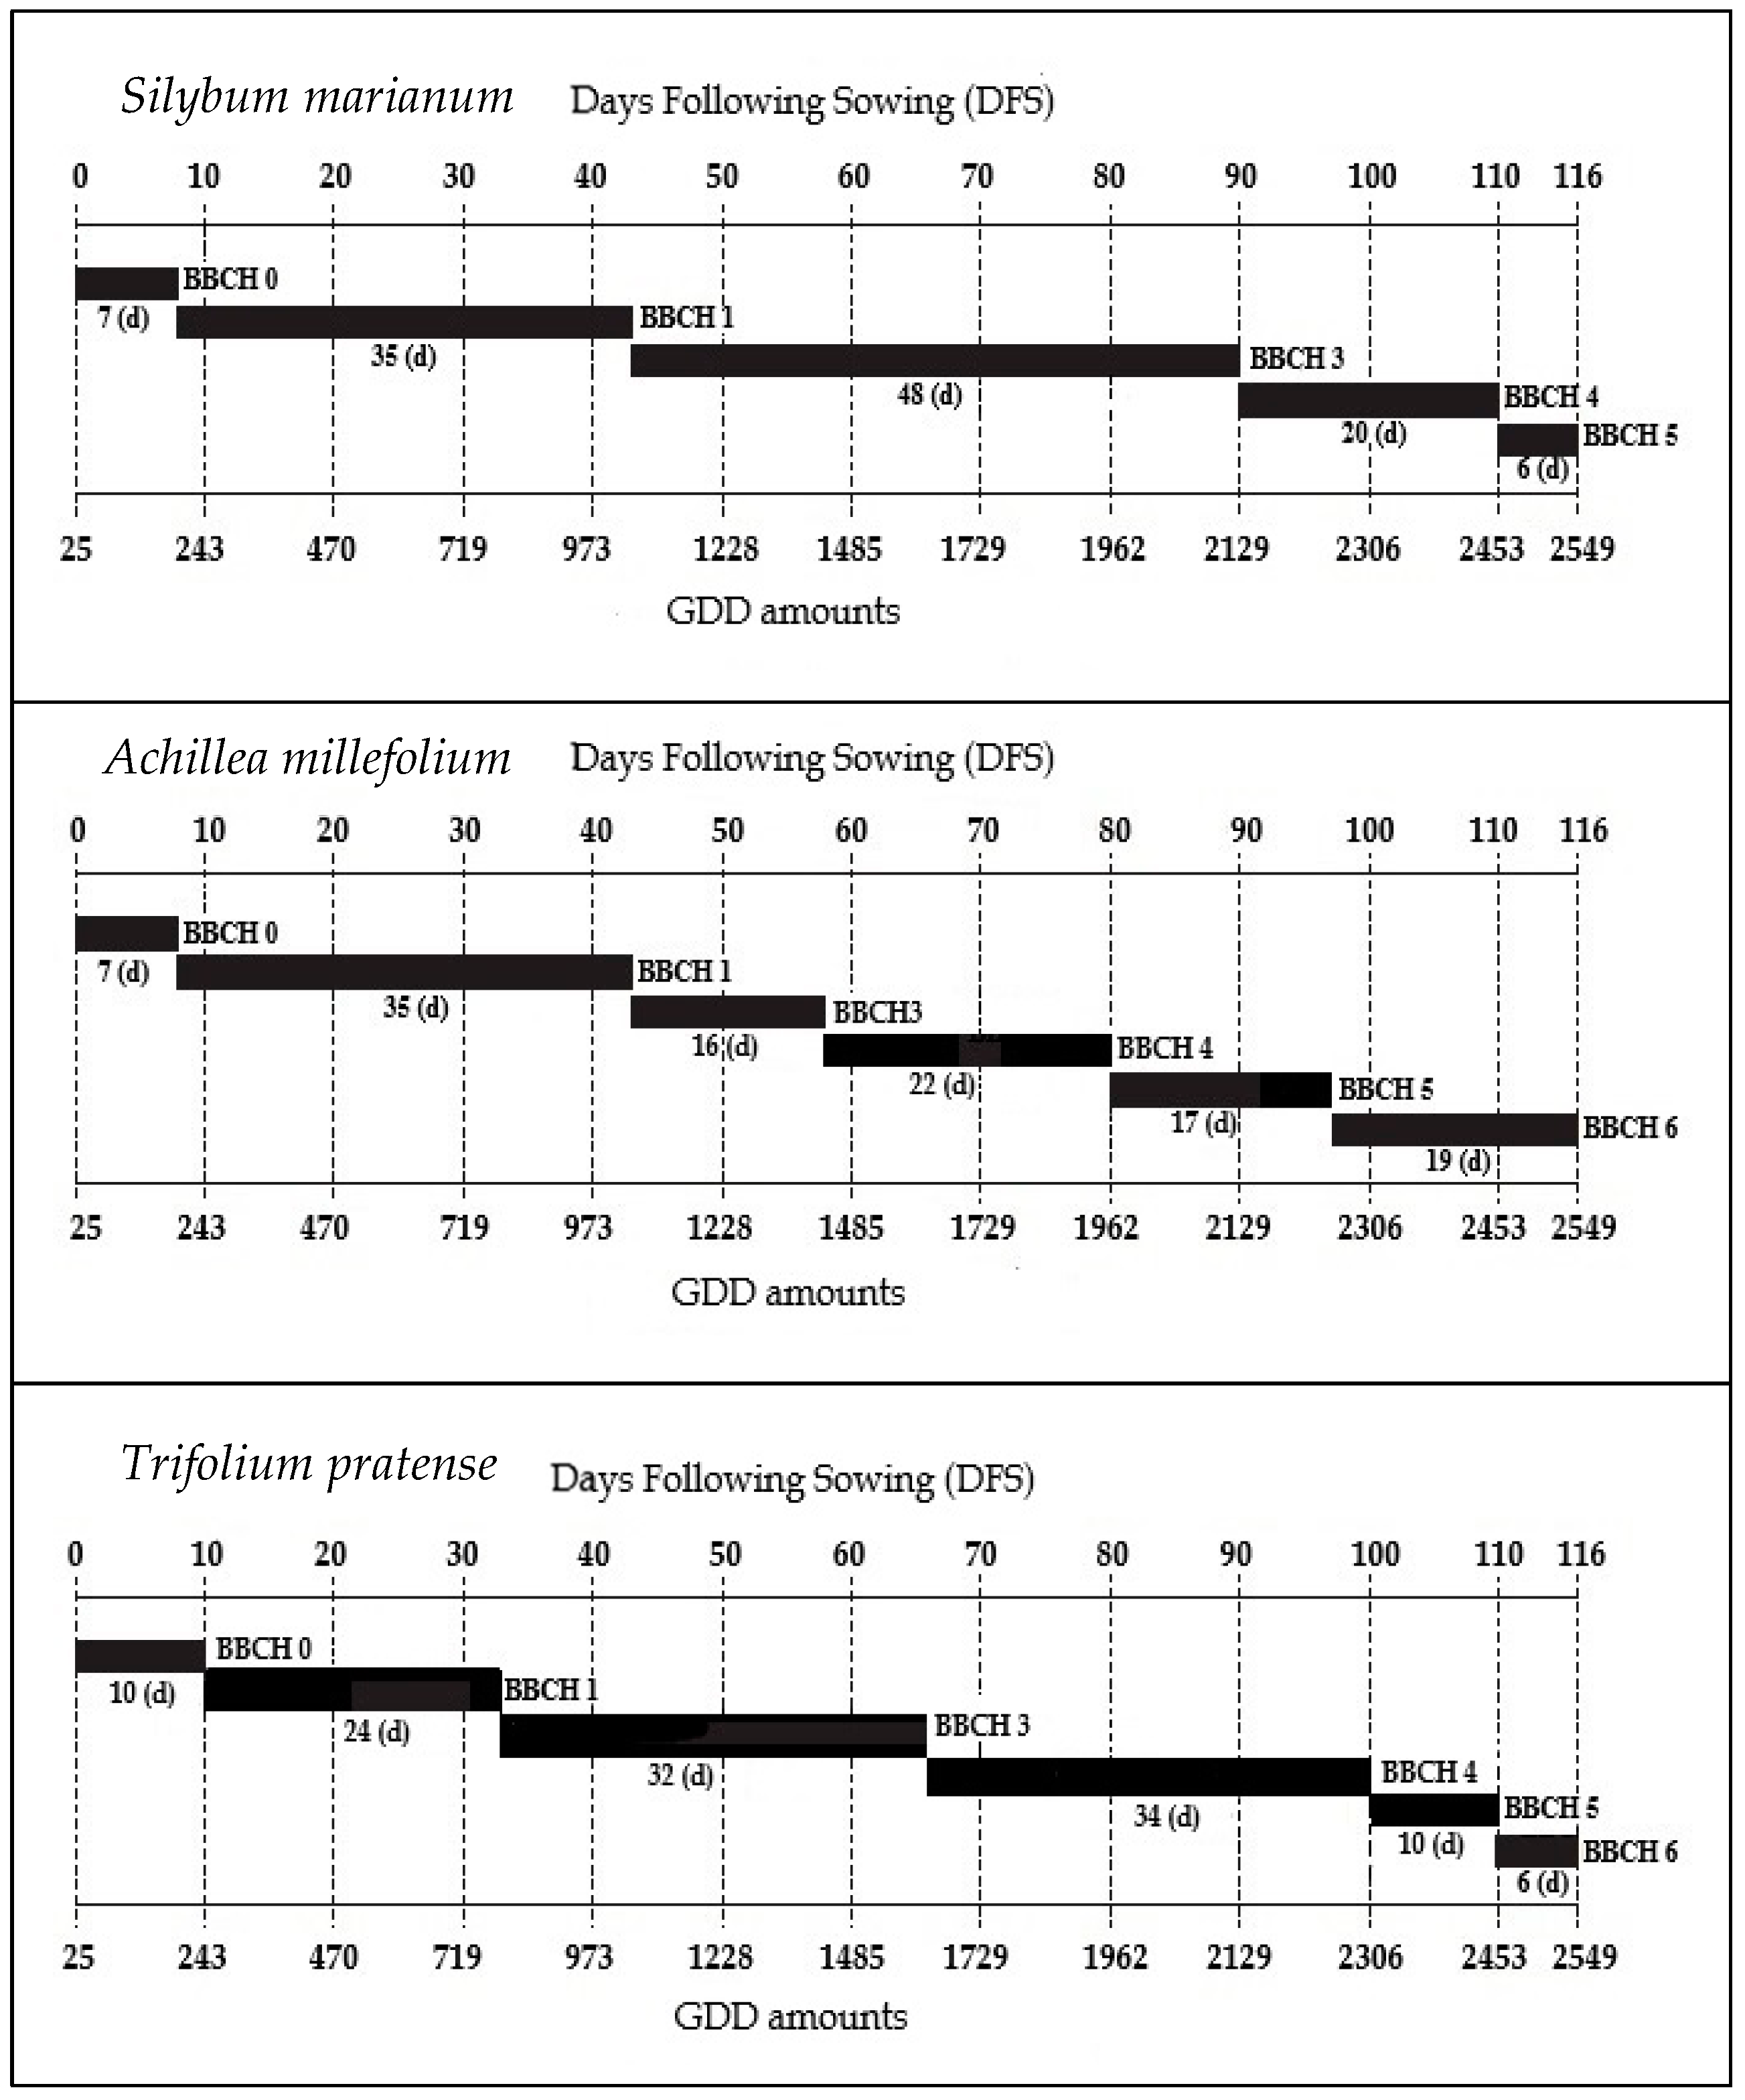
3.2. Phenological Observations

The seeds of the study plants were sown on 20 June 2024 in multi-pots and maintained under controlled temperature conditions. After germination, the shoots were transplanted into larger pots and placed outdoors for about 12 weeks under natural environmental conditions. In Silybum marianum, the beginning of leaf development, corresponding to BBCH 12 in Figure 2a, occurred just seven days following sowing (DFS). After the emergence of the first pair of true leaves, leaf development progressed with an increase in leaf number until a rosette stage was established at ground level (BBCH 31), which took place at 42_DFS, as shown in Table 2. By the 90th day following sowing, vegetative growth resumed as the plant transitioned into stage BBCH 4, marking the onset of vegetative biomass development. This process continued until reaching the phenological stage 49 by the 105_DFS, where peak biomass accumulation was observed.
As regards Silybum marianum, we recorded a growth cycle duration of 100–130 days, which is consistent with findings from other similar studies [29,30] where under severe winter conditions, the species can be defined as an annual summer crop [31]. The phenological analysis of the selected species showed significant differences in their vegetative development. After a first growth phase similar to the other species, the Silybum marianum reached the rosette phenological stage (BBCH 3) at a later time and maintained this stage for a longer duration than the other species. This extended period was because, differently from the other two perennial species, Silybum marianum follows a biennial cycle, with buds located at ground level.
Moreover, the response to temperature trends during the cultivation period showed different effects on the selected species. Silybum marianum transitioned from phase 3 to phase 4 at the onset of significant cooling recorded during September, shifting from horizontal vegetative growth (rosette) to vertical growth by developing the bud.
In the Achillea millefolium, the cotyledons unfolding (BBCH 10) was observed after 7_DFS, as shown in Figure 2b. The vegetative phenological development was similar to the other species of the same family (milk thistle) with the complete leaf development reached at 34_DFS and the stem elongation (BBCH 3) at 42_DFS, as shown in Table 3. The harvestable vegetative plant reached its final size at 76 DFS (BBCH 49). The reproductive phenological stage started at 90_DFS with inflorescence emergence while in the successive 4 weeks, the flowering process advanced to about 50% of flowers open. Generally, the Achillea millefolium takes less than 100 days from seed germination to flowering, although this can vary based on environmental conditions and care practices. As reported in the literature [32], the competitive ability of A. millefolium is mostly due to its relatively rapid growth.
In the Trifolium pratense, full germination was completed at 7_DFS, as shown in Figure 2c. The full stem elongation phase (BBCH 3) was completed at 67_DFS, followed by the development of harvestable vegetative parts that reached maximum biomass at 97_DFS (BBCH 49), as shown in Table 4. The reproductive phenological phase was observed after a delay of 2 weeks with respect to yarrow plants, showing inflorescence emergence at 105_DFS and the first open flowers after only 5 days (110_DFS). Trifolium pratense exhibited a constant trend, remaining in phase 4 of vegetative growth and thus prolonging the vegetative phase. In contrast, the species Achillea, despite being exposed to a temperature drop, did not show any slowdown in the progression of developmental stages. It completed its reproductive structures and initiated the flowering phase with the emergence of the first visible flowers. As for Trifolium pratense, an intermediate growth period was recorded compared to the other two studied species, lasting approximately 120 days from sowing to flowering and consistent with other studies on Trifolium [33], although this period is influenced by climatic conditions, which vary by year, climatic region, and sowing season.
The growth followed different patterns as each species reached its phenological stages at different times. In Figure 3, all the phenological trends of the three species studied can be observed. We observed that the two species belonging to the Asteraceae family (i.e., yarrow and milk thistle) exhibited similar behavior during the first two stages of their phenological development: Stage 0 (germination), which lasted for 7 days, and Stage 1 (leaf development), which lasted for 35 days for both species. A temperature accumulation of 848 GDD was required to complete phenological stage 1 for both Asteraceae species, whereas a lower accumulation of 573 GDD was sufficient for Trifolium pratense. For phenological stage 3, Achillea millefolium exhibited the lowest temperature accumulation, requiring 464 GDD, whereas Trifolium pratense necessitated a considerably higher GDD amount (1000 units), a very similar condition to that of Silybum marianum, where 1115 GDD were required. However, Trifolium pratense reached the stem elongation phenological stage (BBCH 3) earlier than the two Asteraceae species (characterized by composite flowers) and maintained this stage for 42 days. However, the Silybum marianum reached the rosette phenological stage (BBCH 3) at a later time, around day 42, and maintained this stage for a longer duration than the two other species, lasting 48 days as shown in Figure 3. During the phenological stage (BBCH 4), to complete the development of harvestable vegetative biomass, Silybum marianum required only a temperature accumulation of 325 GDD, while Achillea millefolium and Trifolium pratense necessitated higher accumulations amounting to 525 and 680 GDD, respectively.

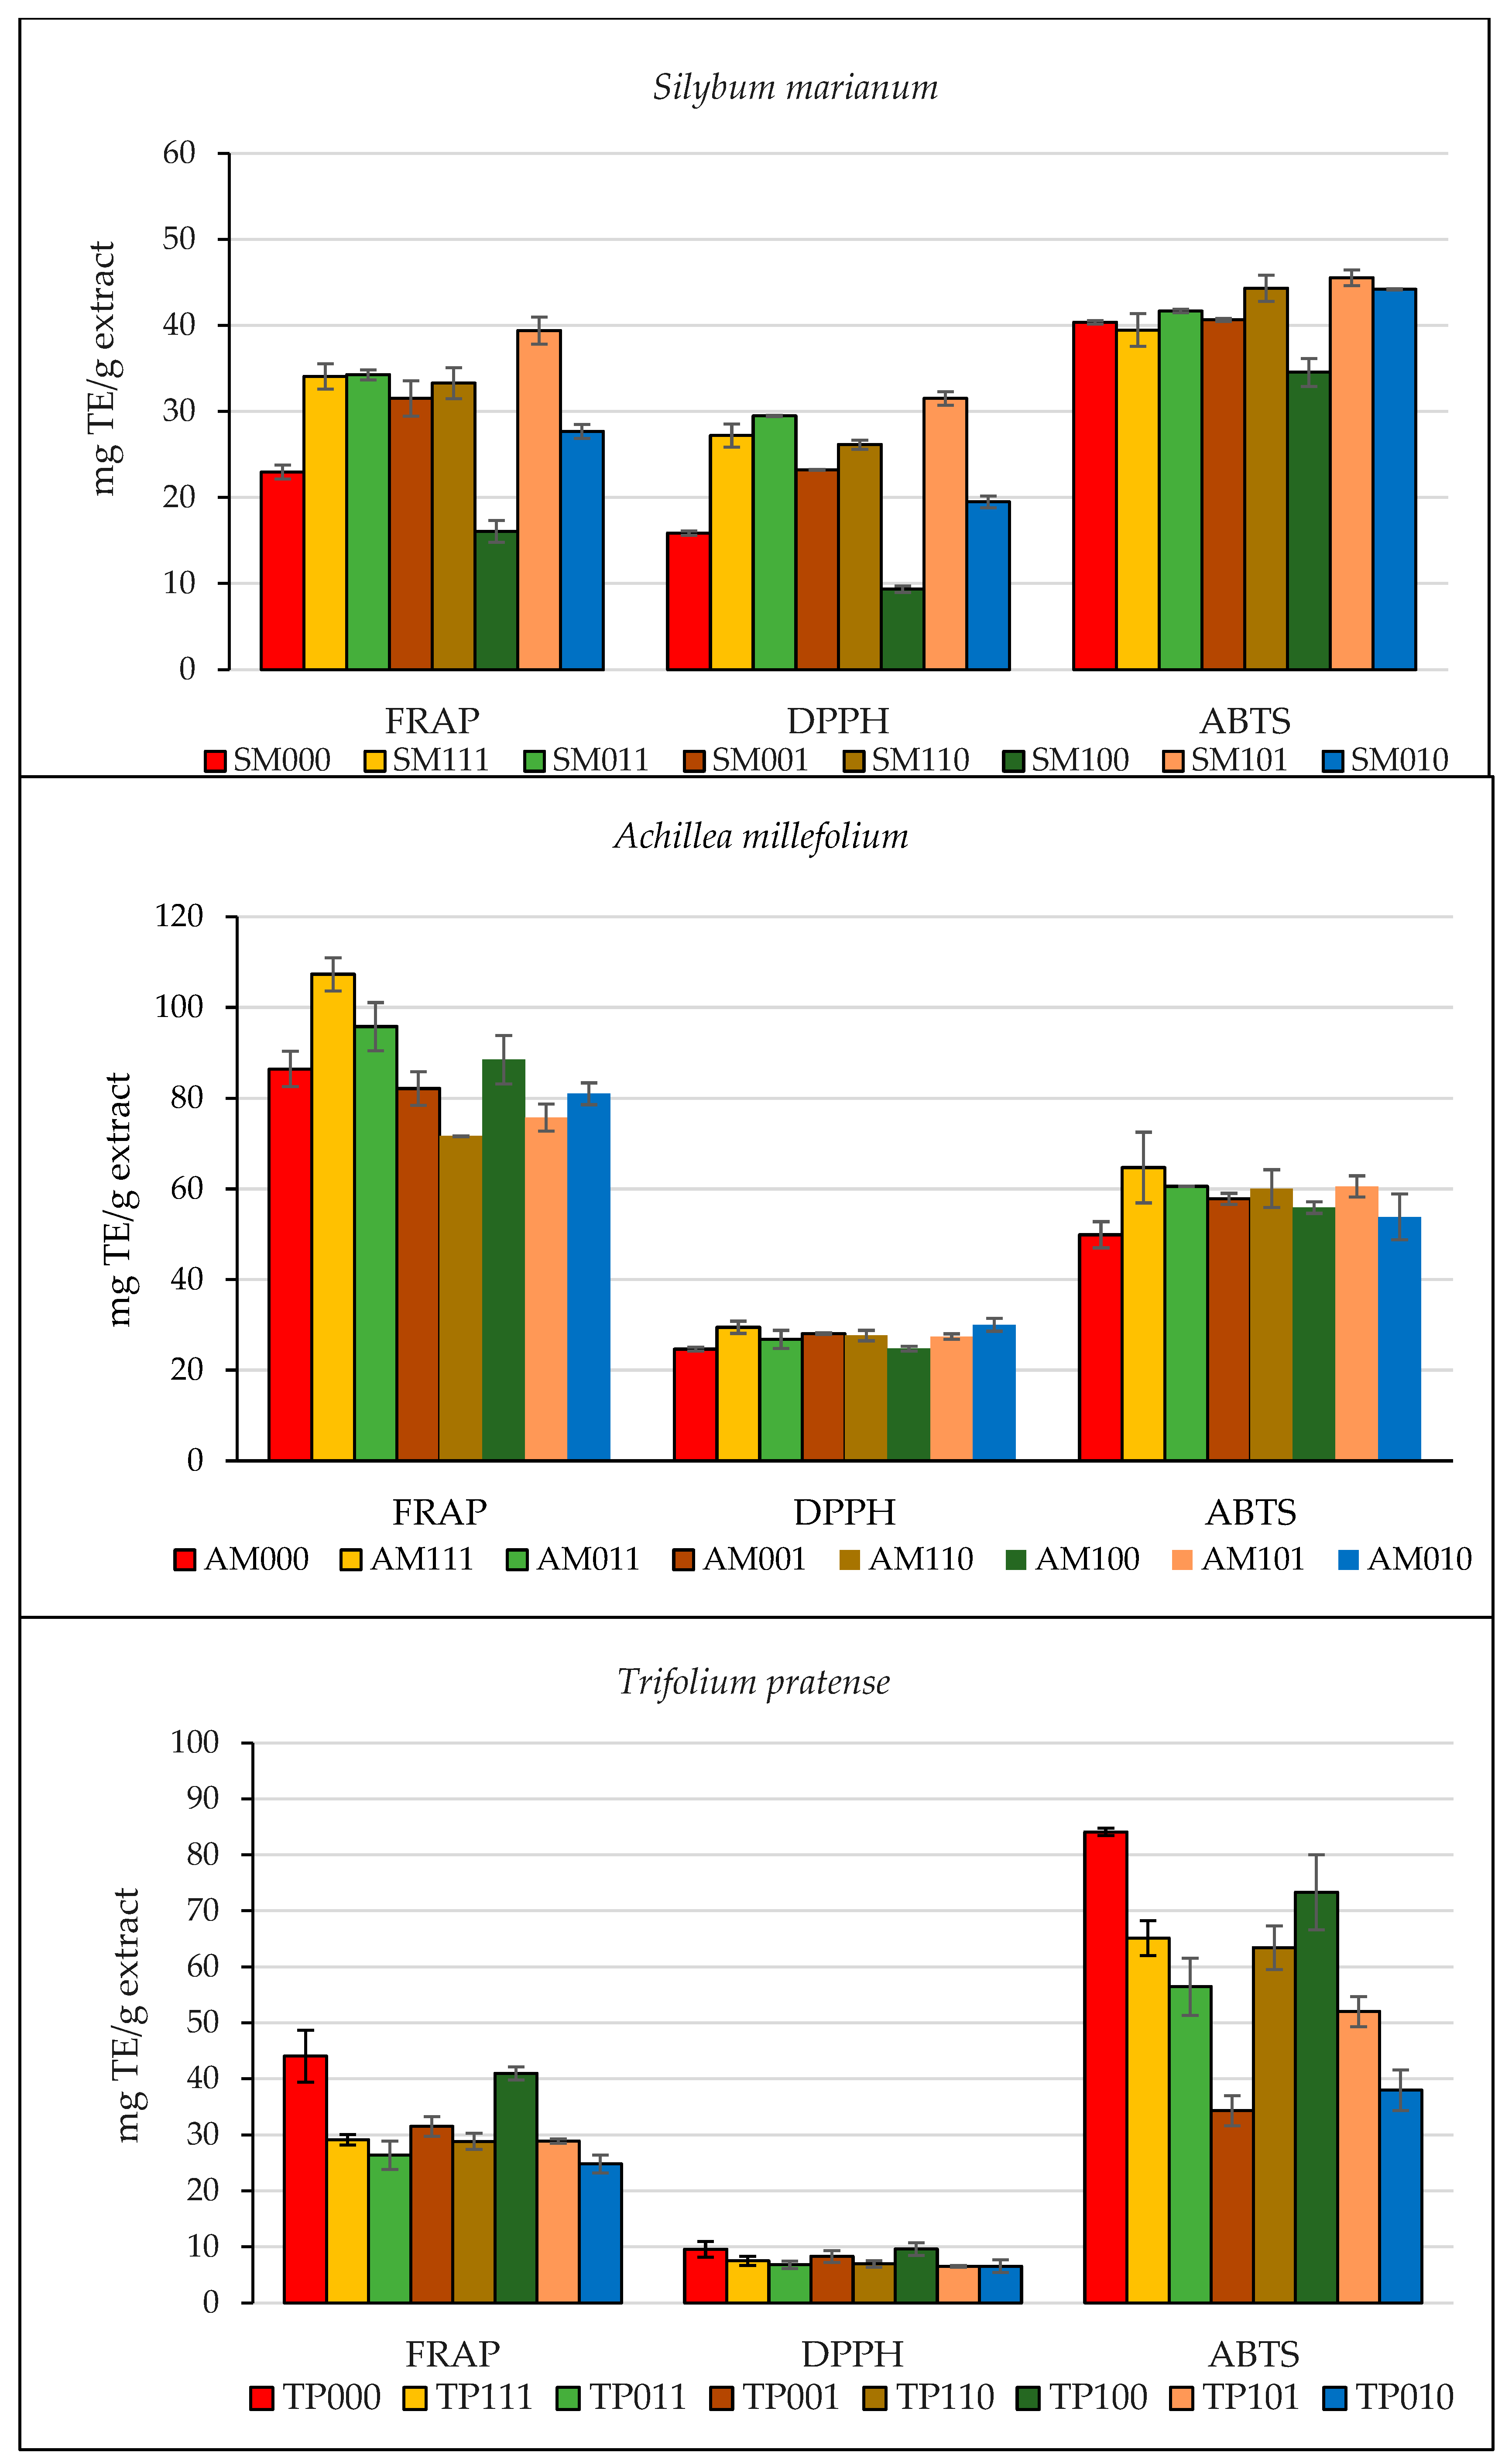
3.3. Evaluation of the Total Antioxidant Capacity (TAC) of Hydroalcoholic Extracts

Based on the considerations outlined in Section 2, it was decided that the three assays FRAP, ABTS, and DPPH be applied to the eight extracts obtained from the corresponding samples of the three species under study. Each of the 24 extracts was analyzed in triplicate. The main insight from the analysis is that each plant species studied has an optimal set of cultivation conditions that can maximize the total antioxidant capacity of its hydroalcoholic extract. In Table S1, the results from ANOVA test were shown to assess the statistically significant differences among the parameters studied.
For Silybum marianum (SM), the hydroalcoholic extract with the highest total antioxidant capacity was obtained under conditions that included the presence of PGPR, no fertilization with P2O5 and K2O, and full irrigation at field capacity (conditions SM101: FRAP = 39.39 ± 1.59 mg TE/g extract; DPPH = 31.50 ± 0.80 mg TE/g extract; ABTS = 45.55 ± 0.91 mg TE/g extract, Table 5). In contrast, the extract with the lowest total antioxidant capacity was obtained from plants grown under similar conditions but with irrigation at 40% relative soil moisture (conditions SM100: FRAP = 16.07 ± 1.28 mg TE/g extract; DPPH = 9.34 ± 0.38 mg TE/g extract; ABTS = 34.55 ± 1.62 mg TE/g extract, Table 5). Notably, the generally higher values observed in the ABTS assay compared to the DPPH assay suggest that both polar and non-polar compounds contribute to the total antioxidant capacity of the hydroalcoholic extract, acting through both the single electron transfer and hydrogen atom transfer mechanisms. The significant contribution of compounds operating via the single electron transfer mechanism is further supported by the relatively high values obtained in the FRAP assay (Figure 4). Somewhat converging information regarding the optimization of the total antioxidant capacity of extracts from Achillea millefolium (AM) was obtained using the three spectrophotometric assays (Figure 4). Specifically, it appears that the antioxidant power of hydroalcoholic extracts of this species can be mostly enhanced in the presence of PGPR, with fertilization using P2O5 and K2O, and under full irrigation at field capacity. For only the DPPH assay, the best combination was the absence of PGPR, the presence of fertilization, and a restricted irrigation regime at 40% of field capacity (condition AM111: FRAP = 107.31 ± 3.66 mg TE/g extract; ABTS = 64.74 ± 7.80 mg TE/g extract; AM010: DPPH = 30.02 ± 1.41 mg TE/g extract, Table 5). Moreover, findings indicate that the antioxidant capacity of the extract is predominantly driven by polar compounds, which exhibit their reducing power through a single electron transfer mechanism, as indicated by the exceptionally high values obtained with the FRAP assay. The significant contribution of hydrophilic species to the total antioxidant capacity of the extract is also supported by the higher values observed in the ABTS assay compared to those in the DPPH assay.
In analogy with what has already been stated for the other two species, the three spectrophotometric assays consistently suggested the optimal cultivation conditions for Trifolium pratense (TP) (condition TP000: FRAP = 44.02 ± 4.67 mg TE/g extract; DPPH = 9.34 ± 0.38 mg TE/g extract; ABTS = 84.11 ± 0.67 mgTE/g extract, Table 5); for the DPPH assay, the slightly better combination was the presence of PGPR, absence of fertilization, and a restricted irrigation regime (TP100: DPPH = 9.60 ± 1.15 mg TE/g extract; TP000: DPPH = 9.57 ± 1.37 mg TE/g extract). In this case (conditions TP100), the hydroalcoholic extract showed that the highest total antioxidant capacity was obtained by cultivating the plant in the absence of PGPR, without fertilization with P2O5 and K2O, and with irrigation at 40% relative soil moisture. A more detailed analysis of the results reveals that the species contributing to the antioxidant power of the hydroalcoholic extracts of Trifolium pratense are primarily hydrophilic in nature, as suggested by the higher values provided by the ABTS assay compared to those of the DPPH assay, as shown in Figure 4. Supporting this hypothesis further are the values obtained from the FRAP assay, which, as mentioned earlier, particularly responds to hydrophilic species. In terms of the mechanism of action, the results for the Trifolium pratense extracts seem to indicate that the species present act through both single electron transfer and hydrogen atom transfer mechanisms.
It is noteworthy that in Silybum marianum, all three spectrophotometric assays showed that the key parameter for optimizing the antioxidant properties of the hydroalcoholic extract is the irrigation level, indicating the presence/absence of water stress. Also, in Achillea millefolium species, the results from the spectrophotometric assays consistently indicate that water stress negatively affects the quality (in terms of antioxidant power) of the hydroalcoholic extract. The findings of this study do not reveal significant effects on antioxidant capacity due to fertilizer application in two out of the three species examined. However, in the case of Achillea millefolium, the addition of fertilizer resulted in an increase in antioxidant capacity. This observation aligns with the existing literature, which suggests that potassium application significantly influences the phenolic composition and antioxidant capacity of medicinal plants by enhancing potassium levels in plant leaves [6]. Potassium functions as an activator for enzymes involved in both photosynthesis and the biosynthesis of starch and proteins. Furthermore, higher potassium fertilization is associated with improved plant growth [34].
The analysis carried out in the Silybum marianum assays with only PGPR showed low values of total antioxidant capacity, probably due to an induction of systemic tolerance in plants towards drought stress through a variety of mechanisms like improvement of the antioxidant system [35,36]. A significant portion of plant damage under abiotic stress results from oxidative injury at the cellular level, caused by the production of reactive oxygen species (ROS) and their insufficient detoxification [37,38]. To counteract this, plant cells produce various antioxidant enzymes, such as catalase (CAT), peroxides (POX), superoxide dismutase (SOD), which neutralize reactive free radicals or inhibit their formation [39]. Notably, PGPR inoculation has been shown to enhance the activity of these antioxidant enzymes under severe drought conditions, suggesting its potential use in inoculants to mitigate oxidative damage induced by drought stress [40].

3.4. Ultra High-Performance Liquid Chromatography Coupled to Mass Spectrometry (UHPLC-MS/MS) Analysis of the Three Extracts SM101, AM111, and TP000

The three investigated extracts may potentially exhibit a broad spectrum of biological activities that deserve a more comprehensive investigation. Indeed, flavonoids such as apigenin, luteolin, and kaempferol are well documented for their potent antioxidant, anti-inflammatory, and anticancer properties [41], while rutin and quercitrin contribute to vascular protection [42] and immune modulation [43]. Phenolic acids, including gallic and caffeic acid, demonstrate antimicrobial, hepatoprotective, and neuroprotective effects [44,45]. Chlorogenic acid and cynarin (and, more generally, dicaffeoylquinic acid derivatives) are frequently associated with hypolipidemic and hepatoprotective activities [46,47], notably through the enhancement of bile flow and lipid metabolism.
The concomitant presence of these compounds suggests the potential for synergistic effects in mitigating oxidative stress, modulating inflammatory responses, and preventing chronic diseases. Based on these findings, it is plausible to hypothesize that this phytochemical profile underpins the extracts’ potential application in nutraceutical and therapeutic contexts aimed at promoting overall health and preventing metabolic or degenerative disorders.
Detailed information on the results of the UHPLC-MS/MS analysis are shown in Table 6, Table 7 and Table 8.

4. Conclusions

The results of the present study clearly demonstrate the importance of implementing specific cultivation management practices for MOWP to enhance the TAC of plant extract, with potential inherent health benefit implications. Accordingly, this study highlighted that, for Silybum marianum, the hydroalcoholic extract exhibiting the highest TAC was obtained under conditions involving the application of PGPR, no fertilization with P2O5 and K2O, and full irrigation at field capacity (condition SM101). In the case of Achillea millefolium, the antioxidant activity of its hydroalcoholic extracts was maximized under conditions that included PGPR inoculation, fertilization with P2O5 and K2O, and full irrigation at field capacity (condition AM111). Regarding Trifolium pratense, the highest total antioxidant capacity of the hydroalcoholic extract was observed when the plants were cultivated without PGPR, without P2O5 and K2O fertilization, and under limited irrigation at 40% relative soil moisture (condition TP000).
Further improvements could be attained by adjusting the harvesting periods to different plant development phases or by exploring alternative extraction techniques, such as ultrasound or microwave-assisted extraction, instead of the traditional maceration method. In this context, the application of Design of Experiments (DoE) protocols could help identify optimal extraction conditions and pinpoint critical process parameters. As a further progression of the current study, the three most promising extracts will be evaluated for their specific biological properties, with a particular focus on their potential effects in relation to lipid dysmetabolism.

Supplementary Materials

The following supporting information can be downloaded at: https://www.mdpi.com/article/10.3390/app15095153/s1, Table S1: ANOVA tables for the selected species with different antioxidant assays.

Author Contributions

Conceptualization: A.T., F.O. and I.V. Methodology: D.B., I.V. and R.S. Investigation: A.T., D.B., I.V. and R.S. Data curation: M.P. and I.V. Writing—original draft preparation: A.T., D.B., I.V., R.S. and M.P. Writing—review and editing: M.F., G.S. and F.O. Supervision: M.F., G.S., F.O., R.S. and D.B. Funding acquisition: G.S. All authors have read and agreed to the published version of the manuscript.

Funding

The present research was funded by the Project PRIN2022 Prot. 2022B8KE33 “PhytoMuscleBone” (Definition of a validated food supplement from controlled cultivation of Mediterranean plants to counteract osteosarcopenia in elderly).

Institutional Review Board Statement

Not applicable.

Informed Consent Statement

Not applicable.

Data Availability Statement

The original contributions presented in this study are included in the article and Supplementary Materials. Further inquiries can be directed to the corresponding authors.

Acknowledgments

We thank the administration and the technicians of the Terminillo Apennine Centre “Carlo Jucci” in the University of Perugia agricultural experimental center, Rieti, for their collaboration and in field activities support.

Conflicts of Interest

The authors declare no conflict of interest.

Abbreviations

The following abbreviations are used in this manuscript:
BBCHBiologische Bundesanstalt, Bundessortenamt and CHemical industry
TACTotal antioxidant capacity
TETrolox equivalent
PGPRPlant growth-promoting rhizobacteria
K2OPotassium oxide
P2O5Phosphorus pentoxide
MOWPsMediterranean Officinal Wild Plants
GDDGrowing degree day
DFSDays following sowing
SMSilybum marianum
AMAchillea millefolium
TPTrifolium pratense

References

  1. Davis, C.C.; Choisy, P. Medicinal Plants Meet Modern Biodiversity Science. Curr. Biol. 2024, 34, R158–R173. [Google Scholar] [CrossRef] [PubMed]
  2. Orlandi Fabio, P.C. Nutraceutical Compounds of Edible Wild Plants Collected in Central Italy. 2024. Available online: https://zenodo.org/records/13820009 (accessed on 19 September 2024).
  3. Li, Z.; Li, W.; Zhang, Y.; Hu, Y.; Sheward, R.; Irwin, A.J.; Finkel, Z.V. Dynamic Photophysiological Stress Response of a Model Diatom to Ten Environmental Stresses. J. Phycol. 2021, 57, 484–495. [Google Scholar] [CrossRef] [PubMed]
  4. Şeker, M.E.; Erdoğan, A. Phenolic and Carotenoid Composition of Rhododendron Luteum Sweet and Ferula communis L. Subsp. Communis Flowers. Front. Life Sci. Relat. Technol. 2023, 4, 37–42. [Google Scholar] [CrossRef]
  5. Rizvi, A.; Ahmed, B.; Khan, M.S.; El-Beltagi, H.S.; Umar, S.; Lee, J. Bioprospecting Plant Growth Promoting Rhizobacteria for Enhancing the Biological Properties and Phytochemical Composition of Medicinally Important Crops. Molecules 2022, 27, 1407. [Google Scholar] [CrossRef]
  6. Chrysargyris, A.; Drouza, C.; Tzortzakis, N. Optimization of Potassium Fertilization/Nutrition for Growth, Physiological Development, Essential Oil Composition and Antioxidant Activity of Lavandula Angustifolia Mill. J. Soil Sci. Plant Nutr. 2017, 17, 291–306. [Google Scholar] [CrossRef]
  7. Biesiada, A. The Effect of Nitrogen Fertilization on Yielding and Antioxidant Activity of Lavender (Lavandula Angustifolia Mill. Acta Sci. Pol. Hortorum Cultus 2008, 7, 33–40. [Google Scholar]
  8. Nguyen, P.M.; Niemeyer, E.D. Effects of Nitrogen Fertilization on the Phenolic Composition and Antioxidant Properties of Basil (Ocimum basilicum L.). J. Agric. Food Chem. 2008, 56, 8685–8691. [Google Scholar] [CrossRef]
  9. Peng, L.-C.; Ng, L.-T. Impacts of Nitrogen and Phosphorus Fertilization on Biomass, Polyphenol Contents, and Essential Oil Yield and Composition of Vitex Negundo Linn. Agriculture 2022, 12, 859. [Google Scholar] [CrossRef]
  10. Tagliazucchi, D.; Verzelloni, E.; Bertolini, D.; Conte, A. In Vitro Bio-Accessibility and Antioxidant Activity of Grape Polyphenols. Food Chem. 2010, 120, 599–606. [Google Scholar] [CrossRef]
  11. Christodoulou, M.C.; Orellana Palacios, J.C.; Hesami, G.; Jafarzadeh, S.; Lorenzo, J.M.; Domínguez, R.; Moreno, A.; Hadidi, M. Spectrophotometric Methods for Measurement of Antioxidant Activity in Food and Pharmaceuticals. Antioxidants 2022, 11, 2213. [Google Scholar] [CrossRef]
  12. Rumpf, J.; Burger, R.; Schulze, M. Statistical Evaluation of DPPH, ABTS, FRAP, and Folin-Ciocalteu Assays to Assess the Antioxidant Capacity of Lignins. Int. J. Biol. Macromol. 2023, 233, 123470. [Google Scholar] [CrossRef] [PubMed]
  13. Puri, C.; Pucciarini, L.; Tiecco, M.; Brighenti, V.; Volpi, C.; Gargaro, M.; Germani, R.; Pellati, F.; Sardella, R.; Clementi, C. Use of a Zwitterionic Surfactant to Improve the Biofunctional Properties of Wool Dyed with an Onion (Allium cepa L.) Skin Extract. Antioxidants 2020, 9, 1055. [Google Scholar] [CrossRef] [PubMed]
  14. Volpi, C.; Bartolini, D.; Brighenti, V.; Galli, F.; Tiecco, M.; Pellati, F.; Clementi, C.; Sardella, R. Antioxidant Power on Dermal Cells by Textiles Dyed with an Onion (Allium cepa L.) Skin Extract. Antioxidants 2021, 10, 1655. [Google Scholar] [CrossRef] [PubMed]
  15. Fanoudi, S.; Alavi, M.S.; Karimi, G.; Hosseinzadeh, H. Milk Thistle (Silybum Marianum) as an Antidote or a Protective Agent against Natural or Chemical Toxicities: A Review. Drug Chem. Toxicol. 2020, 43, 240–254. [Google Scholar] [CrossRef]
  16. Ayhan, N.K.; Tunc, M.G.K.; Noma, S.A.A.; Kurucay, A.; Ates, B. Characterization of the Antioxidant Activity, Total Phenolic Content, Enzyme Inhibition, and Anticancer Properties of Achillea millefolium L. (Yarrow). Instrum. Sci. Technol. 2022, 50, 654–667. [Google Scholar] [CrossRef]
  17. Khorasani Esmaeili, A.; Mat Taha, R.; Mohajer, S.; Banisalam, B. Antioxidant Activity and Total Phenolic and Flavonoid Content of Various Solvent Extracts from In Vivo and In Vitro Grown Trifolium pratense L. (Red Clover). BioMed Res. Int. 2015, 2015, 643285. [Google Scholar] [CrossRef]
  18. Marmouzi, I.; Bouyahya, A.; Ezzat, S.M.; El Jemli, M.; Kharbach, M. The Food Plant Silybum marianum (L.) Gaertn.: Phytochemistry, Ethnopharmacology and Clinical Evidence. J. Ethnopharmacol. 2021, 265, 113303. [Google Scholar] [CrossRef]
  19. Pignatti, S. Flora d’Italia, 3rd ed.; Edagricole: Bologna, Italy, 1982; pp. 154–159. [Google Scholar]
  20. Vargas-Mendoza, N. Hepatoprotective Effect of Silymarin. World J. Hepatol. 2014, 6, 144. [Google Scholar] [CrossRef]
  21. Freedman, N.D.; Curto, T.M.; Morishima, C.; Seeff, L.B.; Goodman, Z.D.; Wright, E.C.; Sinha, R.; Everhart, J.E.; the HALT-C Trial Group. Silymarin Use and Liver Disease Progression in the Hepatitis C Antiviral Long-Term Treatment against Cirrhosis Trial. Aliment. Pharmacol. Ther. 2011, 33, 127–137. [Google Scholar] [CrossRef]
  22. Székely-Szentmiklósi, I.; Rédai, E.M.; Kovács, B.; Gergely, A.-L.; Albert, C.; Szabó, Z.-I.; Székely-Szentmiklósi, B.; Sipos, E. Investigation of Yarrow Essential Oil Composition and Microencapsulation by Complex Coacervation Technology. Appl. Sci. 2024, 14, 7867. [Google Scholar] [CrossRef]
  23. Saviranta, N.M.; Anttonen, M.J.; Von Wright, A.; Karjalainen, R.O. Red Clover (Trifolium pratense L.) Isoflavones: Determination of Concentrations by Plant Stage, Flower Colour, Plant Part and Cultivar. J. Sci. Food Agric. 2008, 88, 125–132. [Google Scholar] [CrossRef]
  24. Kottek, M.; Grieser, J.; Beck, C.; Rudolf, B.; Rubel, F. World Map of the Köppen-Geiger Climate Classification Updated. Meteorol. Z. 2006, 15, 259–263. [Google Scholar] [CrossRef] [PubMed]
  25. Meier, U.; Bleiholder, H.; Buhr, L.; Feller, C.; Hack, H.; Heß, M.; Lancashire, P.D.; Schnock, U.; Stauß, R.; Van Den Boom, T.; et al. The BBCH System to Coding the Phenological Growth Stages of Plants—History and Publications. J. Cultiv. Plants 2009, 61, 41–52. [Google Scholar] [CrossRef]
  26. Pucciarini, L.; Ianni, F.; Petesse, V.; Pellati, F.; Brighenti, V.; Volpi, C.; Gargaro, M.; Natalini, B.; Clementi, C.; Sardella, R. Onion (Allium cepa L.) Skin: A Rich Resource of Biomolecules for the Sustainable Production of Colored Biofunctional Textiles. Molecules 2019, 24, 634. [Google Scholar] [CrossRef]
  27. Abualzulof, G.W.A.; Scandar, S.; Varfaj, I.; Dalla Costa, V.; Sardella, R.; Filippini, R.; Piovan, A.; Marcotullio, M.C. The Effect of Maturity Stage on Polyphenolic Composition, Antioxidant and Anti-Tyrosinase Activities of Ficus Rubiginosa Desf. Ex Vent. Extracts. Antioxidants 2024, 13, 1129. [Google Scholar] [CrossRef]
  28. Acito, M.; Varfaj, I.; Brighenti, V.; Cengiz, E.C.; Rondini, T.; Fatigoni, C.; Russo, C.; Pietrella, D.; Pellati, F.; Bartolini, D.; et al. A Novel Black Poplar Propolis Extract with Promising Health-Promoting Properties: Focus on Its Chemical Composition, Antioxidant, Anti-Inflammatory, and Anti-Genotoxic Activities. Food Funct. 2024, 15, 4983–4999. [Google Scholar] [CrossRef]
  29. Marceddu, R.; Dinolfo, L.; Carrubba, A.; Sarno, M.; Di Miceli, G. Milk Thistle (Silybum marianum L.) as a Novel Multipurpose Crop for Agriculture in Marginal Environments: A Review. Agronomy 2022, 12, 729. [Google Scholar] [CrossRef]
  30. Porwal, O.; Mohammed Ameen, M.S.; Anwer, E.T.; Uthirapathy, S.; Ahamad, J.; Tahsin, A. Silybum Marianum (Milk Thistle): Review on Its Chemistry, Morphology, Ethno Medical Uses, Phytochemistry and Pharmacological Activities. J. Drug Delivery Ther. 2019, 9, 199–206. [Google Scholar] [CrossRef]
  31. Andrzejewska, J.; Martinelli, T.; Sadowska, K. Silybum Marianum: Non-Medical Exploitation of the Species: Silybum Marianum: Non-Medical Exploitation of the Species. Ann. Appl. Biol. 2015, 167, 285–297. [Google Scholar] [CrossRef]
  32. BourdôT, G.W.; Field, R.J. Review on Ecology and Control of Achillea millefolium L. (Yarrow) on Arable Land in New Zealand. New Zealand J. Exp. Agric. 1988, 16, 99–108. [Google Scholar] [CrossRef]
  33. Booth, N.L.; Overk, C.R.; Yao, P.; Totura, S.; Deng, Y.; Hedayat, A.S.; Bolton, J.L.; Pauli, G.F.; Farnsworth, N.R. Seasonal Variation of Red Clover (Trifolium pratense L., Fabaceae) Isoflavones and Estrogenic Activity. J. Agric. Food Chem. 2006, 54, 1277–1282. [Google Scholar] [CrossRef] [PubMed]
  34. Amtmann, A.; Troufflard, S.; Armengaud, P. The Effect of Potassium Nutrition on Pest and Disease Resistance in Plants. Physiol. Plant. 2008, 133, 682–691. [Google Scholar] [CrossRef]
  35. Talbi, S.; Rojas, J.A.; Sahrawy, M.; Rodríguez-Serrano, M.; Cárdenas, K.E.; Debouba, M.; Sandalio, L.M. Effect of Drought on Growth, Photosynthesis and Total Antioxidant Capacity of the Saharan Plant Oudeneya Africana. Environ. Exp. Bot. 2020, 176, 104099. [Google Scholar] [CrossRef]
  36. Francis, B.; Aravindakumar, C.T.; Brewer, P.B.; Simon, S. Plant Nutrient Stress Adaptation: A Prospect for Fertilizer Limited Agriculture. Environ. Exp. Bot. 2023, 213, 105431. [Google Scholar] [CrossRef]
  37. Vardharajula, S.; Zulfikar Ali, S.; Grover, M.; Reddy, G.; Bandi, V. Drought-Tolerant Plant Growth Promoting Bacillus spp.: Effect on Growth, Osmolytes, and Antioxidant Status of Maize under Drought Stress. J. Plant Interact. 2011, 6, 1–14. [Google Scholar] [CrossRef]
  38. Ahluwalia, O.; Singh, P.C.; Bhatia, R. A Review on Drought Stress in Plants: Implications, Mitigation and the Role of Plant Growth Promoting Rhizobacteria. Resour. Environ. Sustain. 2021, 5, 100032. [Google Scholar] [CrossRef]
  39. Simova-Stoilova, L.; Demirevska, K.; Petrova, T.; Tsenov, N.; Feller, U. Antioxidative Protection in Wheat Varieties under Severe Recoverable Drought at Seedling Stag. Plant Soil Environ. 2008, 54, 529–536. [Google Scholar] [CrossRef]
  40. Kohler, J.; Hernández, J.A.; Caravaca, F.; Roldán, A. Plant-Growth-Promoting Rhizobacteria and Arbuscular Mycorrhizal Fungi Modify Alleviation Biochemical Mechanisms in Water-Stressed Plants. Funct. Plant Biol. 2008, 35, 141–151. [Google Scholar] [CrossRef]
  41. Tian, C.; Liu, X.; Chang, Y.; Wang, R.; Lv, T.; Cui, C.; Liu, M. Investigation of the anti-inflammatory and antioxidant activities of luteolin, kaempferol, apigenin and quercetin. S. Afr. J. Bot. 2021, 137, 257–264. [Google Scholar] [CrossRef]
  42. Zhang, W.; Zheng, Y.; Yan, F.; Dong, M.; Ren, Y. Research progress of quercetin in cardiovascular disease. Front. Cardiovasc. Med. 2023, 10, 1203713. [Google Scholar] [CrossRef]
  43. Bispo da Silva, A.; Cerqueira Coelho, P.L.; Neves Oliveira, M.; Luz Oliveira, J.; Oliveira Amparo, J.A.; Costa da Silva, K.; Pereira Soares, J.R.; Seara Pitanga, B.P.; Santos Souza, C.; Faria Lopes, G.P.; et al. The flavonoid rutin and its aglycone quercetin modulate the microglia inflammatory profile improving antiglioma activity. Brain Behav. Immun. 2020, 85, 170–185. [Google Scholar] [CrossRef]
  44. Kahkeshani, N.; Farzaei, F.; Fotouhi, M.; Alavi, S.S.; Bahramsoltani, R.; Naseri, R.; Momtaz, S.; Abbasabadi, Z.; Rahimi, R.; Farzaei, M.H.; et al. Pharmacological effects of gallic acid in health and diseases: A mechanistic review. Iran. J. Basic Med. Sci. 2019, 22, 225–237. [Google Scholar] [CrossRef] [PubMed]
  45. Alam, M.; Ahmed, S.; Elasbali, A.M.; Adnan, M.; Alam, S.; Hassan, M.I.; Pasupuleti, V.R. Therapeutic Implications of Caffeic Acid in Cancer and Neurological Diseases. Front. Oncol. 2022, 12, 860508. [Google Scholar] [CrossRef] [PubMed]
  46. Gonçalves, A.; Sampaio, C.I.; Ševčovičová, A.; Dias, A.M.; Oliveira, R. Cynaropicrin- and chlorogenic acid-rich extracts easily prepared from Cynara cardunculus var. scolymus: Antioxidant and antigenotoxic properties. Biocatal. Agric. Biotechnol. 2023, 53, 102808. [Google Scholar] [CrossRef]
  47. Gebhardt, R.; Fausel, M. Antioxidant and hepatoprotective effects of artichoke extracts and constituents in cultured rat hepatocytes. Toxicol. Vitr. 1997, 11, 669–672. [Google Scholar] [CrossRef]
Figure 1. Trend of mean temperature and GDD amounts during the plant developmental season.
Applsci 15 05153 g001
Figure 2. Selected species’ main phenological phases with BBCH codes: (a) Silybum marianum; (b) Achillea millefolium; (c) Trifolium pretense.
Applsci 15 05153 g002aApplsci 15 05153 g002b
Figure 3. Phenological phases duration expressed in days (d) following sowing (DFS) and corresponding GDD amount requirements.
Applsci 15 05153 g003
Figure 4. Graphical summary of the antioxidant assays: FRAP, DPPH, and ABTS; values of the hydroalcoholic extract from selected species.
Applsci 15 05153 g004
Table 1. Experimental factors (PGPR application, fertilization, and irrigation) combined in the different cultivation protocols.
CombinationPGPRFertilization Water Supply
Inoculation(K2O-P2O5)(Field Capacity)
0,0,0000
0,1,0010
0,1,1011
0,0,1001
1,1,0110
1,0,0100
1,0,1101
1,1,1111
PGPR: 0 = absence; 1 = presence. Fertilizer: 0 = low; 1 = high. WS: 0 = 40%; 1 = 100% field capacity.
Table 2. BBCH phenological scale of Silybum marianum with days following sowing (DFS).
DFSBBCH Code Description
00Germination—Dry seeds
712Leaf development—First pair of elliptic true leaves visible
2115Leaf development—Five leaves visible
3418Leaf development—Eight leaves visible
4231Rosette growth—10% of ground covered by leaves
6737Rosette growth—70% of ground covered by leaves
7639Rosette growth—90% of ground covered by leaves
904220% of the maximum biomass reached
974770% of the maximum biomass reached
1054990% of the maximum biomass reached
11050Flower central head present (3–5 mm ∅) but completely enclosed between developing leaves
11651Flower central head clearly visible between leaves, vertical bract tips, and internodes of main stem clearly elongating
Table 3. BBCH phenological scale of Achillea millefolium with days following sowing (DFS).
DFSBBCH Code Description
00Germination—Dry seeds
710Leaf development—Cotyledons completely unfolded
2112Leaf development—2 true leaves
3418Leaf development—8 or more true leaves
4232Steam elongation—Stem 20% of final length
6747Harvestable vegetative plant parts have reached 70% of final size
7649Harvestable vegetative plant parts have reached final size
9059Inflorescence emergence—First flower petals visible
9760Flowering—First flowers open
10561Flowering—10% of flowers open
11062Flowering—20% of flowers open
11664Flowering—40% of flowers open
Table 4. BBCH phenological scale of Trifolium pratense with days following sowing (DFS).
DFSBBCH CodeDescription
00Germination—Dry seeds
79Germination—Emergence of cotyledons break through soil surface
2116Leaf development—Six true leaf
3430Steam elongation- Start of steam elongation
4233Steam elongation—Three visible nodes
6739Steam elongation—nine or more visible nodes
764330% of maximum biomass reached
904770% of maximum biomass reached
974990% of maximum biomass reached
10553Inflorescence emergence—Flower buds enlarged; petals visible
11060Flowering—Beginning of anthesis: First open flower
11662Flowering—20% of flowers open
Table 5. Results of the measured FRAP, DPPH, and ABTS values of the extracts of plants obtained under different cultivation conditions. SM: Silybum marianum; AM: Achillea millefolium; TP: Trifolium pratense. The triplets of numbers refer to the applied cultivation conditions as reported in the text (Table 1). All data are reported as the mean value of three independent measurements, along with the corresponding standard deviation. Different letters (a b c d e f g) indicate statistically different mean values (p ≤ 0.01; ANOVA one-way, Tukey’s HSD tests) from highest to lowest. For each assay and plant source, the highest and lowest values are reported in bold and italics, respectively.
SampleType of Assay
FRAP (mg TE/g Extract)DPPH (mg TE/g Extract)ABTS (mg TE/g Extract)
SM00022.94 ± 0.82 d15.87 ± 0.27 f40.37 ± 0.21 c
SM11134.08 ± 1.46 b27.20 ± 1.33 c39.46 ± 1.91 c
SM01134.27 ± 0.58 b29.48 ± 0.08 b41.67 ± 0.21 cb
SM00131.50 ± 2.04 b23.23 ± 0.04 d40.64 ± 0.17 c
SM11033.28 ± 1.80 b26.15 ± 0.53 b44.32 ± 1.54 ab
SM10016.07 ± 1.28 e9.34 ± 0.38 g34.55 ± 1.62  d
SM10139.39 ± 1.59 a31.50 ± 0.80 a45.55 ± 0.91  a
SM01027.67 ± 0.83 c19.49 ± 0.68 e44.20 ± 0.08 bc
AM00086.47 ± 3.85 bc24.64 ± 0.43 d49.90 ± 2.89 c
AM111107.31 ± 3.66  a29.46 ± 1.34 ba64.74 ± 7.80  a
AM01195.76 ± 5.31 b26.79 ± 2.00 dcb60.60 ± 0.04 ba
AM00182.19 ± 3.72 cd28.06 ± 0.18 ba57.85 ± 1.23 ba
AM11071.67 ± 0.06  e27.65 ± 1.15 ba60.09 ± 4.16 ba
AM10088.52 ± 5.31 bc24.77 ± 0.54 dc55.92 ± 1.27 cb
AM10175.79 ± 3.00 ed27.44 ± 0.59 cba60.60 ± 2.34 ba
AM01081.04 ± 2.43 cd30.02 ± 1.41  a53.85 ± 5.07 cb
TP00044.02 ± 4.67 a9.57 ± 1.37 a84.11 ± 0.67 a
TP11129.14 ± 0.91 cb7.51 ± 0.79 ba65.13 ± 3.13 cb
TP01126.39 ± 2.51 cb6.81 ± 0.68 b56.45 ± 5.11 dc
TP00131.54 ± 1.73 b8.30 ± 1.05 ba34.28 ± 2.65  e
TP11028.86 ± 1.44 cb6.95 ± 0.61 b63.40 ± 3.92 c
TP10040.93 ± 1.15 a9.60 ± 1.15  a73.34 ± 6.73 b
TP10128.93 ± 0.38 cb6.51 ± 0.16  b52.00 ± 2.69 d
TP01024.83 ± 1.59  c6.55 ± 1.14 b37.95 ± 3.64 e
Table 6. Results of the MS and MS2 analysis of the extract SM101. Compounds are listed in alphabetical order. All compounds were identified as [M-H]- ions.
Possible CandidateFormulaRt (min)m/zMS/MS Fragments (m/z)Exp MassDetected MassScoreError
(in ppm)
ApigeninC15H10O512.07269.03117.03270.0528270.052889.561.88
Chlorogenic AcidC16H18O910.58353.0883191.0548, 137.02354.3100354.093998.812.19
ChrysinC15H10O411.29, 12.20253.059 254.2400254.058388.52−3.10
Cinnamic AcidC9H8O28.28147.04 148.1586148.052499.770.90
Coumaric AcidC9H8O35.44, 6.53163.0405119.05164.1600164.047399.840.41
CynarinC25H24O1210.58515.27 516.4500516.128096.532.43
Ferulic AcidC10H10O47.15193.01117.03, 134.03, 175.78194.1800194.057986.002.48
Fumaric AcidC7H6O32.75137.0293.03138.1200138.031885.960.45
Hydroxybenzoic AcidC7H6O33.19137.0293.0329138.1200138.031799.34−0.79
Kaempferol (or luteolin)C15H10O611.38285.0411184.23286.2300286.047798.441.01
Malic AcidC4H6O55.56133.1442115.0013184.8400134.021596.535.07
NaringeninC15H12O512.03271.062151.41272.2500272.068599.570.22
Protechatecuic AcidC7H6O45.01153.0181109.02154.1200154.026686.06−2.14
QuercetinC15H10O710.18301.0362151.0037302.2360302.042782.883.31
QuercitrinC21H20O1110.68447.0946284.0326, 255.02448.3800448.007098.851.07
Quinic AcidC7H12O65.48, 7.53191.0563 192.1700192.063599.461.38
RutinC27H30O1610.21609.14300.1610.5200610.154389.52−3.46
Table 7. Results of the MS and MS2 analysis of the extract AM111. Compounds are listed in alphabetical order. All compounds were identified as [M-H]- ions.
Possible CandidateFormulaRt (min)m/zMS/MS Fragments (m/z)Exp MassDetected MassScoreError
(in ppm)
ApigeninC15H10O512.27269.03225270.0528270.052896.791.27
Caffeic AcidC9H8O46.34179.034135.179180.1600180.042399.481.44
Chlorogenic AcidC16H18O97.74, 9.74, 10.63353.0883191.0548354.3100354.093998.551.66
ChrysinC15H10O411.29, 12.19253.059 254.2400254.058399.530.53
Cinnamic AcidC9H8O210.73, 11.65147.04 148.1586148.052497.933.54
Coumaric AcidC9H8O35.44, 6.53163.0405119.05164.1600164.047398.540.07
Fumaric AcidC7H6O33.26137.0293.03138.1200138.031899.830.30
Gallic AcidC7H6O51.18169.0138 170.1200170.021595.83−0.91
Hydroxybenzoic AcidC7H6O33.19137.0293.0329138.1200138.031798.850.59
KaempferolC15H10O611.53285.0411184.23286.2300286.047785.640.30
Malic AcidC4H6O55.92133.1442115.87184.8400134.021597.503.07
NaringeninC15H12O510.67271.062317.0667, 331.0823272.2500272.068596.992.53
Protechatecuic AcidC7H6O44.97153.0181109.02154.1200154.026686.64−0.44
QuercitrinC21H20O1110.30447.0946284.0326, 255.02448.3800448.007097.022.93
Quinic AcidC7H12O65.56191.056385.03192.1700192.063599.810.78
RutinC27H30O1610.16609.14300.1610.5200610.154397.072.11
Table 8. Results of the MS and MS2 analysis of the extract TP000. Compounds are listed in alphabetical order. All compounds were identified as [M-H]- ions.
Possible CandidateFormulaRt (min)m/zMS/MS Fragments (m/z)Exp MassDetected MassScoreError
(in ppm)
Apigenin C15H10O512.06269.15117.03270.2300270.052898.522.13
ApigetrinC21H20O1012.10431.0995 432.3810432.126797.022.41
Caffeic AcidC9H8O48.58179.034135, 179180.1600180.042399.840.56
Chrlorogenic AcidC16H18O99.74353.0883191.05, 137.02354.3100354.093998.81−2.78
ChrysinC15H10O411.28235.059 254.2400254.058398.241.69
Cinnamic AcidC9H8O210.73, 11.65147.04 148.1586148.052499.040.52
Coumaric AcidC9H8O35.44, 10.13163.0405119.05164.1600164.047399.370.41
Ferulic AcidC10H10O410.24193.01105.46, 106.04, 117.03, 134.03, 175.78194.1800194.057999.301.70
Fumaric AcidC7H6O32.75137.0293.03138.1200138.031899.910.43
Gallic AcidC7H6O51.63169.0138127.002170.1200170.021595.83−0.91
Hydroxybenzoic AcidC7H6O33.18137.0293.0329138.1200138.031799.910.43
Kaempferol (or lueolin)C15H10O611.38285.0411184.23286.2300286.047785.640.30
Malic AcidC4H6O58.78133.1442115.0013184.8400134.021599.861.10
NaringeninC15H12O512.63271.062151.41272.2500272.068597.612.39
Protechatecuic AcidC7H6O44.92153.0181109.02154.1200154.026699.13−1.00
QuercetinC15H10O711.60301.0362151.0037, 135.65302.2360302.042793.682.14
QuercitrinC21H20O1110.61447.0946284.0326, 255.02448.3800448.007096.460.28
Quinic AcidC7H12O66.18191.0563 192.1700192.063581.90−6.78
RutinC27H30O1610.14609.14300.1610.5200610.154397.911.50
Vanillic AcidC8H8O46.87167.0348 168.1400168.042086.42−0.87
Disclaimer/Publisher’s Note: The statements, opinions and data contained in all publications are solely those of the individual author(s) and contributor(s) and not of MDPI and/or the editor(s). MDPI and/or the editor(s) disclaim responsibility for any injury to people or property resulting from any ideas, methods, instructions or products referred to in the content.

