1. Introduction
One of the tasks that clinicians find difficult is pain assessment [
1]. The challenges in pain assessment vary across individuals, age groups, and circumstances, especially for those with communication difficulties. The subjective nature of pain makes it challenging for clinicians to assess patient behavior when determining pain levels. Additionally, certain conditions, such as cognitive impairments or severe disability, can further complicate accurate pain evaluation. Developing objective and reliable pain assessment tools that incorporate advanced technologies, such as multimodal data integration from video and biosignals (e.g., functional near-infrared spectroscopy (fNIRS)), is important for improving clinical outcomes and patient care. While biosignals offer valuable insights into brain and physiological responses associated with pain [
2,
3], they can also be susceptible to noise and artifacts [
4]. Therefore, effective preprocessing and multimodal fusion strategies are essential to fully leverage biosignal information in automated pain assessment. Breivik et al. attempted to scale the level of pain based on facial expression [
5]. The same study also investigated methods for assessing pain in individuals with communication difficulties.
The Visual Analogue Scale (VAS)/Graphic Rating Scale, Numerical Rating Scale (NRS), and Verbal Rating Scale (VRS) are examples of instruments for pain intensity measurement based on patient feedback. In the VAS assessment, a graphical line represents “no pain at all” to “pain as bad as it could be”. In NRS assessment, individuals are asked to indicate which number in between two limits can represent the level of pain that the individual is having. In the VRS assessment, patients are asked to describe the level of pain they experience [
2]. Although pain level assessment is possible through VAS, NRS, and VRS, these methods rely on subjective patient feedback.
Numerous studies have been conducted to evaluate pain without relying on patient self-reports. In addition to self-report methods, observational scales are commonly used, and most consider facial expression, vocalization, and body language as important characteristics [
6]. However, these scales are still manually performed by the observer; therefore, to overcome this drawback, Werner et al. performed automatic pain assessment on facial features activity using machine learning methods [
7]. In contrast, Alghamdi et. al. in [
8] conducted similar tasks automatically from facial images using deep learning. Other researchers have utilized modalities such as audio, electrodermal activity, and respiration rate in their studies [
9].
Conventional methods, such as VAS, NRS, and VRS, are highly demanding in terms of manual feedback from patients. Relying on self-reporting can result in inconsistencies in pain assessment, as it is influenced by individual variations in patients’ perceptions, communication skills, and inclination to provide accurate pain reports [
5]. The research in [
7] aimed to automate this task primarily by relying on machine learning models. However, machine learning models usually require domain knowledge and expertise for manual feature extraction. Significant advancements in deep learning can provide opportunities for improved pain evaluation.
Deep learning often outperforms traditional machine learning and conventional methods, particularly in tasks involving large datasets and complex patterns, such as image and speech recognition. This advantage is due to its ability to automatically learn and extract features from raw data, reducing the need for manual feature engineering, as shown in [
8]. In recent years, deep learning and the availability of public datasets have played a crucial role. They have made improvements in various fields like computer vision and healthcare. Diverse models have been developed to accomplish difficult tasks, such as natural language processing models and generative models.
Datasets serve as fundamental building blocks for researchers, enabling the effective training and evaluation of models. The Fourth International Workshop on the Automated Assessment of Pain (AAP 2024) introduced a new dataset for pain assessment, featuring both video and functional near-infrared spectroscopy (fNIRS) modalities. This presents significant challenges in integrating and synchronizing diverse data types to ensure an accurate and meaningful pain assessment. Additionally, they conducted the AI4Pain challenge [
10], encouraging participants to evaluate pain levels using the provided dataset.
The development of a multimodal model that effectively integrates and synchronizes the diverse data types from video and functional near-infrared spectroscopy (fNIRS) modalities presents several challenges. First, the data from these two modalities have different characteristics and sampling rates, necessitating sophisticated alignment and fusion techniques. Video data, typically high-dimensional and temporally rich, require extensive preprocessing, including frame extraction, facial feature detection, and expression analysis [
11]. In contrast, fNIRS data, which capture hemodynamic responses, require careful filtering and noise reduction to ensure the signal quality [
12]. Combining these modalities to create a cohesive representation of pain signals is a complex task. In addition to the AI4Pain dataset, we also evaluated our method on the BioVid Heat Pain Database [
3,
13], which contains multimodal recordings of pain responses to calibrated heat stimuli. Including this dataset allows us to assess the generalizability and robustness of the proposed method across different data sources and experimental settings.
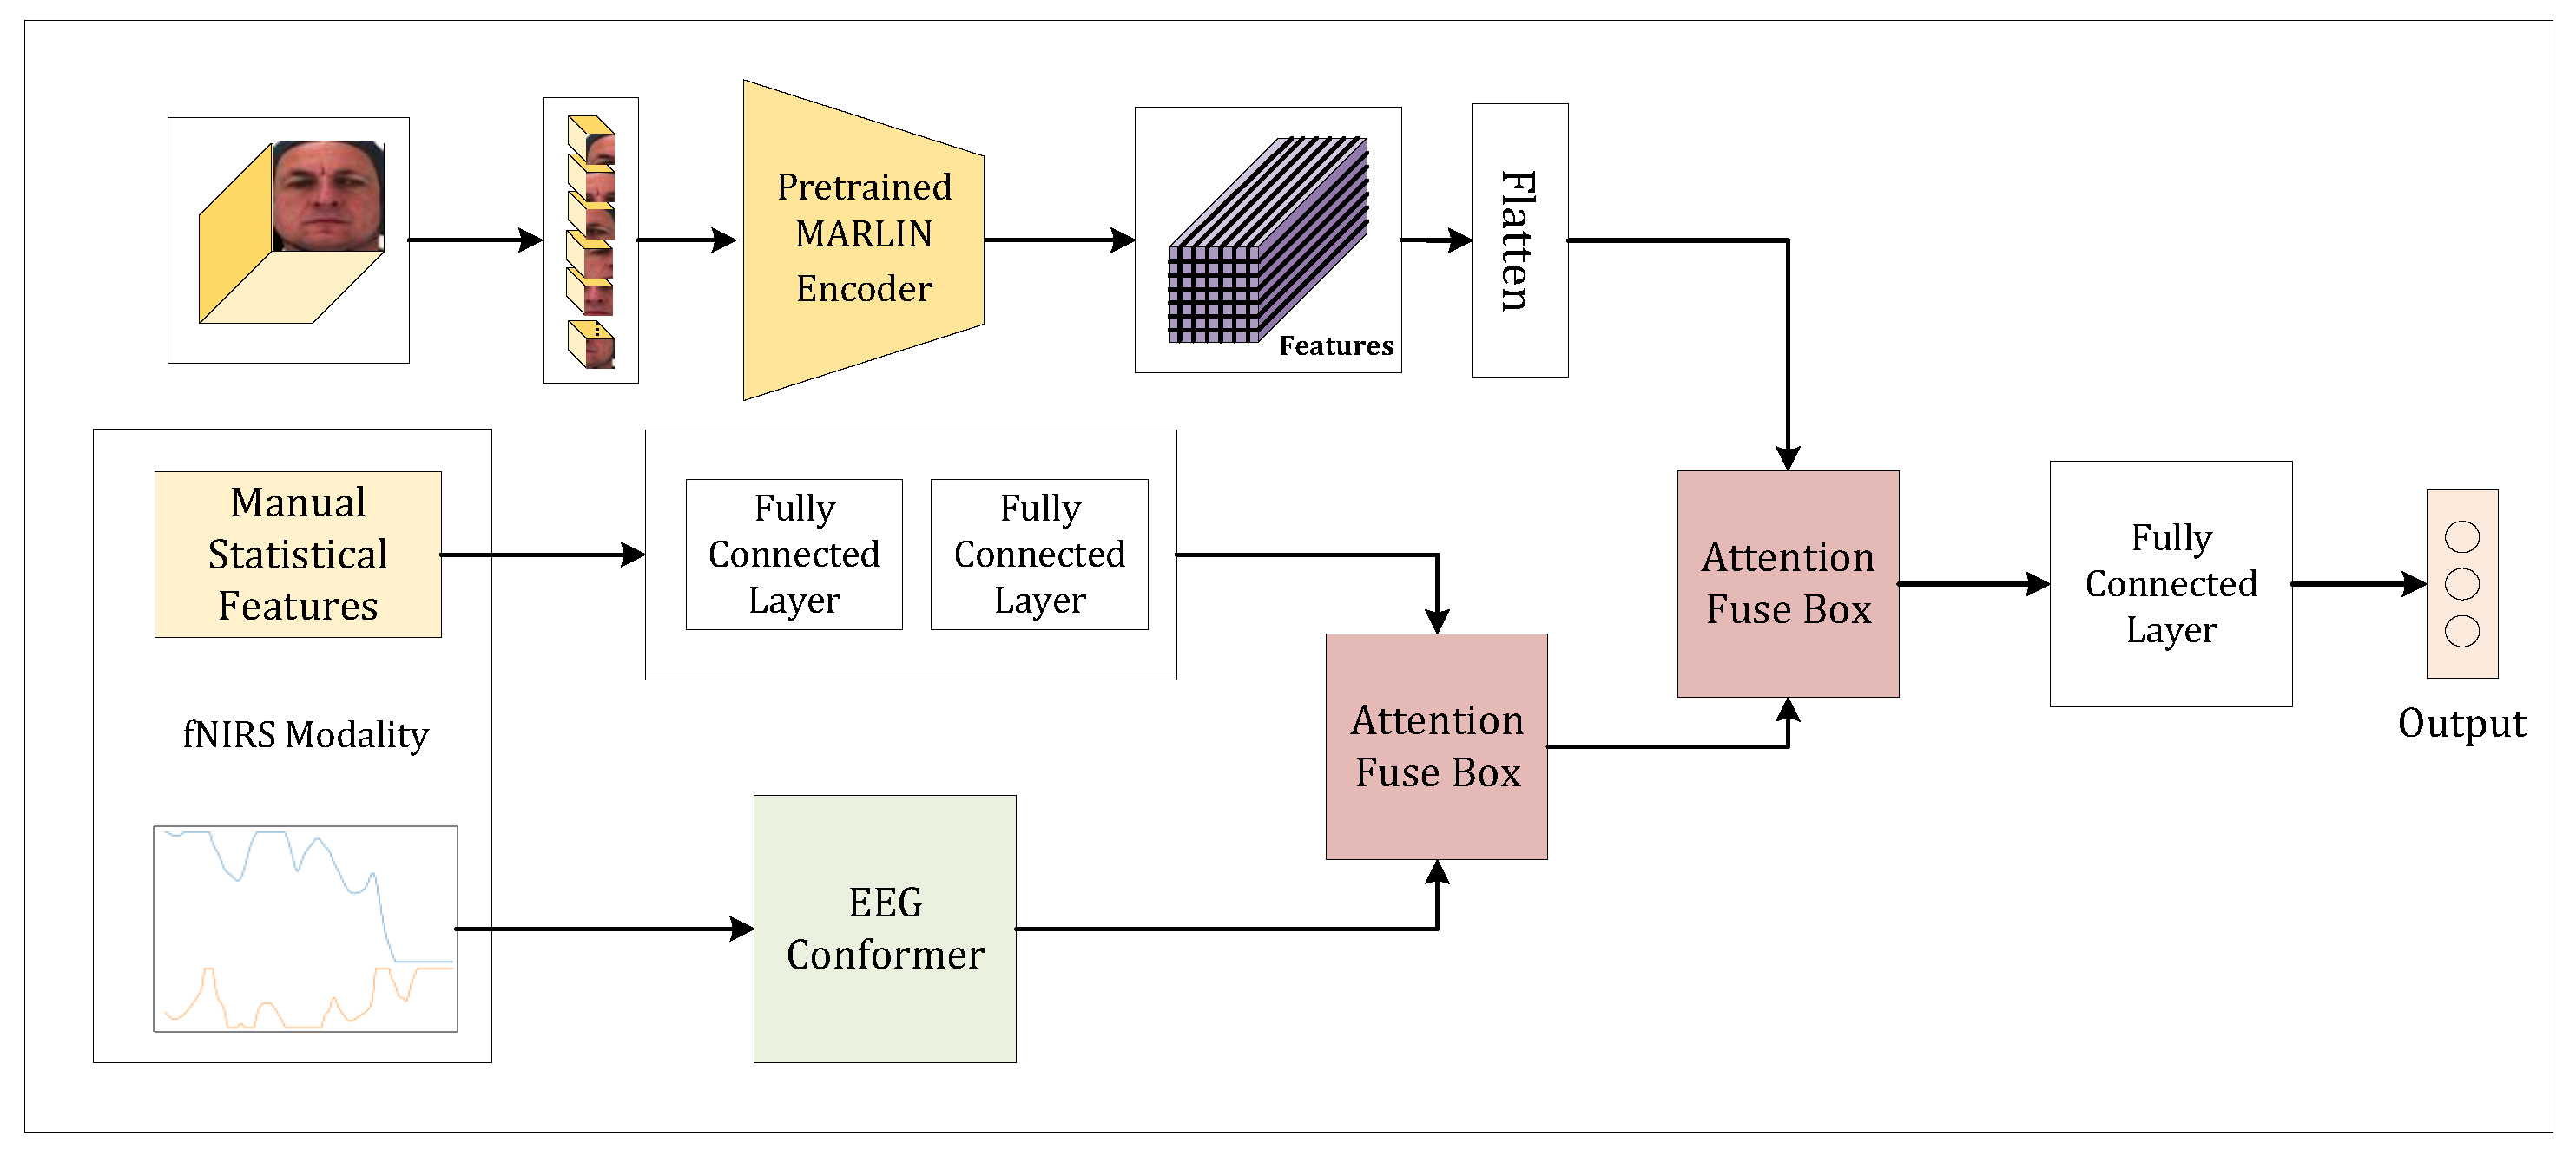
We propose a novel MMAPA multimodal deep learning model for the AI4Pain Challenge datasets. To achieve robust performance, we employed a transformer-based [
14] model for feature extraction on fNIRS modality and multimodality fusion. We demonstrate a preprocessing technique that works effectively on fNIRS modality. Statistical feature extraction of the fNIRS signal was also performed, making it one of the modalities in our model. The video data, raw fNIRS signals, and fNIRS statistical features were fed into MARLIN [
15], a multi-layer perceptron, and EEG Conformer [
16], respectively. This comprehensive approach ensures that each modality is effectively leveraged, enhancing the overall accuracy and reliability of pain assessment. Our model demonstrates the potential for integrating diverse data types to significantly improve automated pain evaluation.
Our main contributions are summarized as follows: (1) We proposed a novel multimodality model for pain assessment using the AI4Pain dataset. (2) We demonstrated a preprocessing technique for fNIRS signals on the AI4Pain dataset. (3) We conducted extensive experiments and analyses for each modality to demonstrate the performance of the proposed model and benchmark it against multiple well-known state-of-the-art models.
The remainder of this paper is organized as follows.
Section 2: Related Works reviews existing studies on Automated Pain Assessment.
Section 3: Methods describes the proposed methodology, including preprocessing steps, feature extraction, fNIRS and video encoders, and fusion techniques.
Section 4: Experiments and Results outlines the experimental setup, datasets, and evaluation metrics used to assess our approach. This section also presents the results and discussion, comparing our model’s performance with existing methods.
Section 5: Discussion discusses MMAPA’s real-time performance, ethical concerns, and challenges in accurately detecting the “No Pain” category. Finally,
Section 6: Conclusion summarizes our findings and suggests potential directions for future research. Our models and codes can be accessed at
https://sdsuster.github.io/ai4painmm (accessed on 28 April 2025).
2. Related Works
Facial expressions have become a popular feature in pain assessment tasks. When experiencing pain, our nervous system responds by exhibiting several expressions, such as closed eyes, lowered brows, raised cheeks, raised upper lip, and parted lips [
6]. Nowadays, data-driven models have become popular, enabling clinicians to automatically assess the level of pain a patient is experiencing. Reference [
7] employed random forest and support vector machines in their research to automatically assess the level of pain a patient is experiencing. Facial feature positions, such as those of the eyes, mouth, and brows, were extracted. Their method aims to detect changes in facial expressions when a patient is experiencing pain. References [
8,
17] directly classified the level of pain from two images using CNN. The main advantage of CNNs is their ability to emphasize and learn from images without relying heavily on manual feature extraction techniques. This technique enhances model performance. However, these studies on pain assessment focused exclusively on facial expressions instead of employing a multimodal approach, potentially limiting the comprehensiveness of their evaluations. However, these models often lack temporal context, making it difficult to assess ongoing or changing pain levels accurately.
The fNIRS modality is often highlighted for its versatility and non-invasive nature [
4]. It has been proven to be able to detect depression in [
18]. They proposed a domain and frequency feature extraction method using AlexNet. They used three types of features: raw data, statistical features, and channel correlation. These features were extracted from raw fNIRS data. However, they conducted separate experiments for each feature modality. They found that channel correlation features yielded the highest accuracy. Similar to the previous study, Jinlong et al. [
19] conducted a study using fNIRS to distinguish healthy controls from patients with major depression. Other tasks utilized the fNIRS modality such as specific finger tapping or rest prediction [
20], motor execution or rest prediction [
21], and mental workload prediction [
22]. Although these studies highlight the potential of fNIRS in diverse contexts, many early studies relied on handcrafted features and did not fully leverage advanced preprocessing and multimodal integration strategies that can address challenges like signal noise and variability.
Several pain assessment tools have been developed using fNIRS. Using raw data, [
23] attempted to mitigate automatic feature extraction issues in their experiments. Raw signals were then fitted and evaluated using the Bi-directional Long Short-Term Memory (Bi-LSTM) model. Another study [
24] used the window-sliding method to extract local features from the fNIRS raw signal. However, recent studies have shown that traditional machine learning methods are often outperformed by deep learning approaches, which are better suited for modeling the complex, non-linear, and temporal patterns present in physiological signals such as video.
Limited research has explored the integration of video and fNIRS modalities, particularly with the AI4Pain dataset, which focuses on multimodal pain assessment. Two notable publications in this area stand out. The first study leverages the AI4Pain dataset by applying transfer learning from a pre-trained VGGNet to extract features from the video modality. These features are then used with classifiers such as ANN, majority voting, and LSTM for pain classification. However, a notable limitation of this study is that it does not utilize the fNIRS modality, which could further improve performance through multimodal fusion. The second research proposed the Twins-PainViT framework. It comprises two models, PainViT–1 and PainViT–2, which were designed for pain assessment using video and fNIRS signals. PainViT–1 extracts embeddings from both modalities, and these embeddings are visualized as waveform diagrams, which are then fused into a single image. PainViT–2 processes this unified visual representation to complete the pain assessment, utilizing a hierarchical structure with token mixing and cascaded attention mechanisms for efficient feature extraction and fusion. These studies highlight the potential of combining video and fNIRS data to enhance pain detection and analysis, advancing research in this domain.
Lu et al. [
25] proposed PainAttnNet, which is a transformer-based deep learning framework designed for pain intensity classification using a single modality of physiological signals. Their methodology consists of a multi-stage unimodal architecture: a Multiscale Convolutional Network (MSCN) first captures both short- and long-range dependencies using parallel convolutional branches with varying receptive fields; this is followed by a Squeeze-and-Excitation ResNet (SE-ResNet) to enhance salient features through channel-wise attention. Finally, a transformer encoder incorporating temporal convolution and multi-head self-attention is used to model temporal dependencies. By relying solely on physiological signals (such as electrodermal activity), the model achieves competitive performance on the BioVid dataset, outperforming several prior state-of-the-art approaches. However, its unimodal nature limits its ability to exploit complementary information from other modalities, such as video or audio, which can be critical in pain assessment tasks.
EEG Conformer is a compact convolutional neural network model originally designed for electroencephalogram (EEG) modality, which is aimed at feature extraction and classification tasks [
26]. They claimed that the model worked across several tasks. It also works with a very limited data size. EEG and fNIRS signals have similar characteristics, consisting of temporal and spatial information. However, EEG has high-resolution temporal and low-resolution spatial information and vice versa [
16]. In our experiment, EEG Conformer will be utilized on the fNIRS modality to evaluate how well it works for pain assessment.
The EEG Conformer is a combination of CNN for feature extraction and self-attention modules inspired by the transformer model. The model uses convolution to extract temporal and spatial features and then performs global temporal feature encapsulation using a self-attention mechanism. Multi-head attention was utilized in their experiments, which demonstrated improvements compared to its baseline, EEGNet. Multi-head attention, introduced in [
14], enhances the model’s ability to project queries, keys, and values. The core concept of multi-head attention is to enhance the model’s ability to focus on different parts of the input sequence simultaneously, capturing a richer representation of the data.
A multimodal fusion strategy is a process of integrating information from multiple modalities to improve the performance of the model. Qiu et al. [
27] proposed a multi-level progressive learning method to fuse EEG-fNIRS modalities. Time-domain and frequency-domain features of both modalities were combined before feature selection using the Atom Search Optimization algorithm. EEG and fNIRS have similar characteristics in terms of data representation; however, video and fNIRS have significantly different data representations. Video data are represented in a higher-dimensional space compared to fNIRS. To address this issue, Gkikas and Tsiknakis [
12] proposed a fusion method for video and physiological signals (e.g., ECG), introducing a video preprocessing method and employing transformer-based architectures with hierarchical attention modules for effective multimodal fusion. Although this study used ECG instead of fNIRS, due to their similar representations, fNIRS and ECG could be interchangeable.
4. Experiment and Results
4.1. Datasets
The integration of artificial intelligence (AI) and sensing technologies offers a promising opportunity to enhance pain recognition, which is a critical aspect of healthcare and affective computing. The proposed Grand Challenge aims to leverage fNIRS and facial video analysis to advance automated pain assessment. By combining these sensing modalities, the challenge seeks to capture both neurophysiological and behavioral aspects of pain, providing a more comprehensive and objective approach that has not been previously explored. Participants are invited to develop novel algorithms for pain recognition, contributing to the creation of a multimodal sensing dataset that can serve as a benchmark and resource for future research in this field [
10].
The AI4Pain dataset, consisting of 65 subjects, was divided into 41 for training, 12 for validation, and 12 for testing. In each experiment, transcutaneous electrical nerve stimulation (TENS) electrodes were placed on the forearm and the back of the hand to deliver controlled pain stimuli. TENS was used to induce both High Pain and Low Pain conditions in randomized order across 12 repetitions per subject. Each trial began with a 60-s baseline recording, which was followed by a 10-s stimulation phase and a 40-s rest period. The baseline segment was labeled as No Pain. The resulting class distribution was No Pain:Low Pain:High Pain = 1:12:12. The classification task involves distinguishing among these three pain levels using multimodal signals. The fNIRS modality includes 24 channels with each channel consisting a pair of signals: HbO2 and HHb.
In addition to AI4Pain, we also utilize the BioVid Heat Pain Database (Part A) [
3,
13], which is a publicly available benchmark dataset for pain recognition. BioVid includes recordings from 87 participants exposed to calibrated heat pain stimuli administered via a thermode applied to the forearm. Each subject underwent a personalized pain calibration procedure to determine five thermal thresholds (T0–T4), where T0 represents no pain and T4 corresponds to the maximum tolerable pain level. Participants received 20 stimuli per pain level, each lasting four seconds, with randomized ordering and rest periods in between to avoid adaptation. The dataset comprises synchronized multimodal recordings, including high-resolution video of the upper body and face, electrodermal activity (EDA), electromyogram (EMG), and electrocardiogram (ECG). Following prior studies such as PainNet [
25] and AI4Pain [
10], we adopt a three-class classification scheme by grouping the five pain levels into No Pain (T0), Low Pain (T1–T2), and High Pain (T3–T4). While both datasets are employed, our primary experiments and model evaluation are conducted using the AI4Pain dataset due to its relevance to the Grand Challenge setting.
4.2. Implementation Details
Our model, illustrated in
Figure 1, was implemented using the TensorFlow-Keras framework. We employed the Adam optimizer with a learning rate of 0.0001 and trained the model with a batch size of 64. The cross-entropy loss function was used for training. Although we initially set the maximum number of epochs to 300, as the validation loss increased while training loss decreased, indicating overfitting, we applied early stopping based on the validation loss, halting training when no improvement was observed. Our experiments on the AI4Pain dataset involved two types of dataset treatments. In the first treatment (denoted as B-1), we used the original class ratio without additional preprocessing. In the second treatment (denoted as B-6), we divided the baseline “No Pain” samples into six parts to investigate the impact of class imbalance on the model’s performance. Additionally, we validated our model using the original class ratio to ensure the robustness of our findings. Due to the relatively small dataset size, a dropout rate of 0.25 was applied to the multi-head attention modules. For data sampling, we extracted the first
frames from each video and the corresponding first 8 s of fNIRS signals, using a stride of 5. Our experiments showed that these sampling parameters had minimal impact on the overall model performance.
4.3. Test Accuracy Against Competitors
The AI4Pin test labels are not publicly available. To evaluate our model’s performance, we submitted our predicted labels to the challenge organizers for testing. The organizers allow a maximum of two submissions for each team. In one of our submissions, our model achieved an accuracy of 51.33%. This score was the highest among all competitors in the challenge, positioning our model at the top in terms of performance. A detailed comparison of our model’s results with other methods can be found in
Table 3. After careful consideration, we submitted the video + fNIRS model for the final evaluation, as it achieved the highest validation accuracy in our internal tests. However, this accuracy was not significantly higher than that of the model that combined video, fNIRS, and manually engineered features. Although the simpler model performed well, the marginal difference suggests that additional manual features did not enhance its effectiveness in this case.
Based on the results presented in
Table 4, our proposed method demonstrates strong performance, particularly under the 10-fold cross-validation setting. In this protocol, a larger portion of the dataset is used for training, while a smaller portion is reserved for testing in each fold. This setup contrasts with LOOCV, which typically exposes models to higher variance due to the minimal size of the test set. Notably, our multimodal attention-based fusion model (MMAPA – G + V) achieved the highest accuracy in the 10-fold setting, outperforming both unimodal baselines and the established PainAttNet benchmark. This improvement suggests that our model is better suited for scenarios where more training data are available, indicating stronger fitting capacity and better generalization under constrained test conditions.
The results also reveal that the video-only modality consistently underperforms compared to the GSR-based model on the BioVid dataset. This observation indicates that physiological signals, particularly GSR, provide more reliable and discriminative features for pain detection in this context. The effectiveness of GSR likely stems from its direct association with autonomic nervous system responses to nociceptive stimuli. Furthermore, the integration of GSR and video through our attention-based fusion mechanism allows the model to capture complementary patterns across modalities. Overall, our model exhibits not only superior accuracy but also enhanced robustness and generalizability across different validation schemes.
4.4. Quantitative Analysis
To analyze and benchmark our model, we conducted extensive experiments. We evaluated our model performance using accuracy and F1 score metrics. The baseline does not have any information about F1 score metric provided. Since we have limited trials submitting test results, only test accuracy on the “video + fNIRS” model was submitted.
Table 3 shows a performance comparison of pain detection models using different modalities: fNIRS, video, manual assessments, and their combinations. It includes results for baseline models and the proposed models (referred to as “MMAPA-Ours*”) under two conditions, B-6 and B-1. The baseline models using fNIRS, video, and their combination achieved validation accuracies of 43.20%, 40.00%, and 40.20%, respectively, with corresponding test accuracies of 43.30%, 40.10%, and 41.70%.
The proposed models significantly outperformed the baseline models in validation accuracy. Under condition B-6, the fNIRS-based model achieved a validation accuracy of 58.67%, while the video-based model reached 61.67%. Manually extracted statistical features and combined modalities (video + fNIRS, video + manual, fNIRS + manual, and video + fNIRS + manual) showed varying accuracies from 58.33% to 61.00%. Similar trends were observed under condition B-1, with the highest validation accuracy of 62.67% achieved by both the video + fNIRS and video + manual modalities.
In terms of F1 scores, the models generally performed well in detecting “Low Pain” and “High Pain” levels, although they struggled significantly with the “No Pain” category, often showing a score of 0.00%. We attempted to mitigate this imbalance by applying both weighted loss and synthetic sample generation. While these methods improved the detection of “No Pain”, they ultimately degraded the model’s ability to predict “Low Pain” and “High Pain” categories, resulting in a net decrease in overall accuracy. This phenomenon occurred because both the challenge validation and test sets maintained a heavily imbalanced distribution (approximately 1:6:6 for No Pain, Low Pain, and High Pain), which limited the effectiveness of balancing strategies. In contrast, when evaluated on the balanced BioVid dataset, our model exhibited robust performance across all classes. Overall, the results highlight that the proposed models, particularly those utilizing multiple modalities, provide enhanced accuracy and better overall performance in pain detection compared to baseline models, demonstrating the effectiveness of integrating various data sources for this task.
To better understand the model’s performance across pain levels, we analyzed the confusion matrix (
Figure 5). The diagonal elements represent correctly classified samples, while off-diagonal entries indicate misclassifications. The model failed to correctly classify any samples from the No Pain class with all instances being misclassified as “Low Pain” or “High Pain”. This is likely due to a significant class imbalance in the dataset, where “No Pain” samples are underrepresented compared to the other classes. In contrast, the “Low Pain” class achieved strong performance, with 116 out of 144 samples correctly classified, and 28 misclassified as High Pain. The High Pain class also showed moderate performance, with 72 correct classifications and 74 misclassified as Low Pain. These results highlight the model’s sensitivity to class distribution and its tendency to confuse High Pain with Low Pain, suggesting the need for class-balancing strategies, loss weighting to improve the recognition of underrepresented classes, or a more class-balanced sample dataset.
Although biosignal modalities such as GSR demonstrated stronger performance compared to fNIRS in the BioVid experiments, this difference is primarily due to the nature of the physiological responses captured. Peripheral biosignals, such as GSR and ECG, tend to provide faster and more direct autonomic nervous system responses to acute pain stimuli [
3], whereas cortical signals captured by fNIRS reflect slower hemodynamic changes that are often more susceptible to noise and motion artifacts [
4]. Despite these challenges, fNIRS remains valuable in clinical contexts where direct brain activity monitoring is essential. Therefore, while certain biosignals may outperform others depending on the dataset characteristics and response types, each modality offers distinct advantages depending on the application scenario.
Moreover, the observed gap between validation and test accuracy could be partially attributed to overfitting. Given the limited training set size, the model may have captured validation-specific patterns that do not generalize well to the test set. This overfitting risk is further amplified by the inherent class imbalance across both splits, suggesting that larger and more diverse datasets would be beneficial for improving generalization performance.
In addition to accuracy and F1 analysis, we also evaluated model performance using ROC curves and AUC scores (
Figure 6). On the BioVid dataset, the model achieved a strong AUC of 0.88, whereas on the AI4Pain dataset, AUC values ranged from 0.54 to 0.61, reflecting the challenges posed by subtle signal differences and class imbalance.
4.5. Effectiveness of Artifact Noise Reduction and Vizualiation
The effectiveness of artifact noise reduction is highlighted in
Table 3, which focuses exclusively on models utilizing the fNIRS modality. In the table, the column labeled “Val Acc w/o AF” presents the validation accuracy achieved by our model when trained without any artifact noise filtering. This baseline result allows for a clear comparison of how much the filtering process impacts overall model performance. Notably, artifact noise filtering significantly improves accuracy. This improvement is particularly pronounced in the “(Video + fNIRS) B-1” model, where the application of noise filtering increased the overall accuracy by 2.67%. This demonstrates the critical role of effective noise reduction in enhancing model performance, especially in multimodal systems where signal quality can vary significantly between sources.
In addition to our noise filtering approach, we also compared MMAPA with traditional noise reduction techniques such as ICA, as summarized in
Table 5. While ICA-based preprocessing improved the fNIRS model accuracy to 58.00%, our proposed MMAPA method achieved a slightly higher validation accuracy of 58.67% and a marginally better F1 score. This comparison highlights that while classical techniques like ICA can mitigate some artifacts, integrating task-specific multimodal processing and attention mechanisms, as seen in MMAPA, further enhances robustness and classification performance.
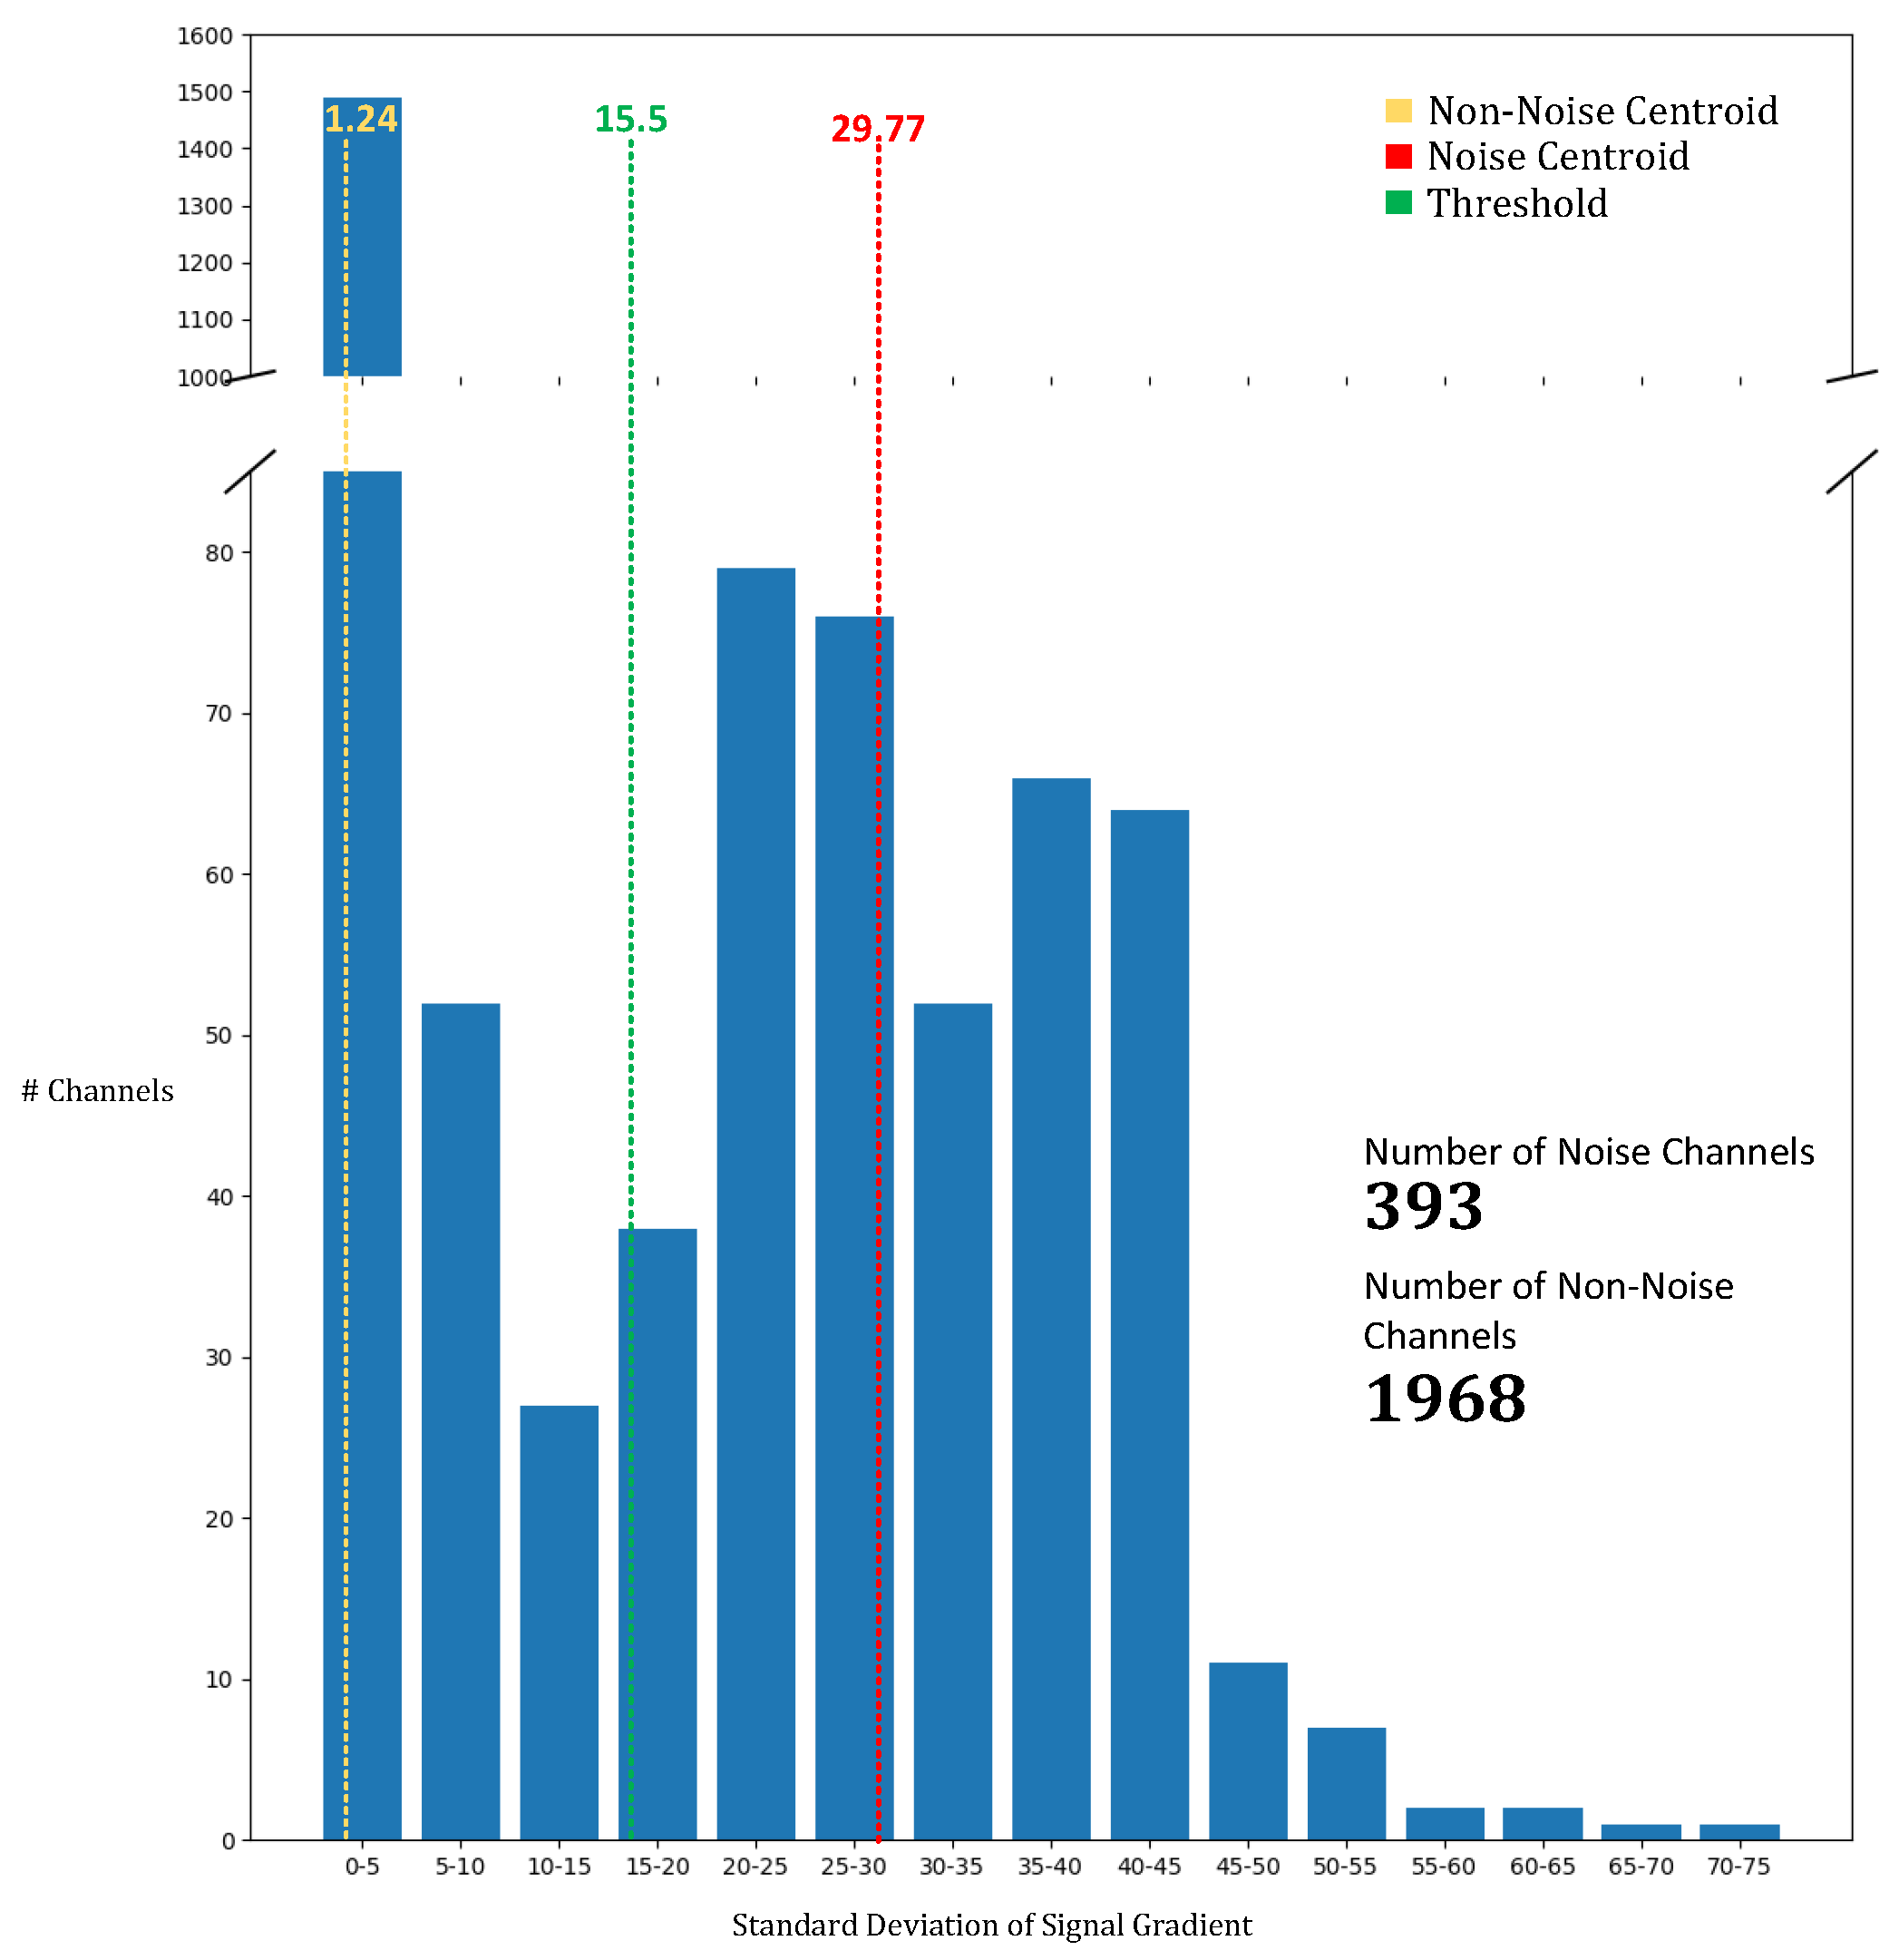
To identify and mitigate noisy channels, we employed the K-means clustering algorithm, which enabled us to differentiate between noisy and non-noisy signals. As shown in
Figure 7, the centroids for the noisy and non-noisy channels were calculated as 29.77 and 1.24, respectively. The threshold between the two clusters was determined to be 15.5. Any channel with a standard deviation of gradient below 15.5 was classified as non-noisy, while channels with a standard deviation exceeding this value were deemed noisy. This systematic classification enabled us to process and filter the noise from a significant portion of the channels, totaling 393 channels. The K-means-based approach for noise detection proved to be an effective method for isolating noisy channels, allowing for more precise artifact noise filtering and contributing to the overall enhancement of model accuracy. The use of this noise reduction technique is essential for improving the reliability of models trained with fNIRS data, as it reduces the impact of sensor and environmental interference.
4.6. Comparison of EEG Conformer with SOTA Models
Table 6 shows our model performance using the EEG Conformer compared with other state-of-the-art models (Bi-LSTM and Bi-GRU). Most methods struggle significantly with the “No Pain” category. In the B-6 experiment, both Bi-LSTM and Bi-GRU have slightly low accuracy due to their sensitivity in detecting “No Pain”. Their high “No Pain” F1 score retracted accuracy on “Low Pain” and “High Pain”. It also show an accuracy trade-off between “No Pain” and other classes. Both Bi-LSTM and Bi-GRU tend to be overfitted easily compared to our model. Due to this issue, the model struggles to achieve the best validation accuracy. Bi-GRU also shows less effectiveness compared to other methods.
Additionally, in the B-1 experiment, the EEG Conformer model maintains its performance with a validation accuracy of 58.67% but shows a slight decrease in the mean F1 score to 39.59%. The Bi-LSTM and Bi-GRU models demonstrate improved accuracy with the smaller batch size, where Bi-LSTM (48 units) achieves the highest validation accuracy of 59.00% and a mean F1 score of 40.35%. To evaluate the proposed Algorithm 1, we validated the accuracy of fNIRS data (both unimodal and multimodal) that was preprocessed using only a Butterworth band-pass filter. The results in
Table 6 show that the proposed Algorithm 1 can improve model accuracy.
4.7. EEG Conformer Parameter Effectiveness
In this ablation study on EEG Conformer parameter effectiveness, we evaluate the impact of different K values and attention dimensions on validation accuracy. The results show that for K values of 20, 30, and 40, the validation accuracies are 58.33%, 57.67%, and 58.67%, respectively, with the best performance at K = 40. However, for attention dimensions of 156, 16, and 56, the validation accuracies are 59%, 58.33%, and 59%, respectively, with no significant improvement as the attention dimensions increase, indicating potential overfitting. Thus, we selected 16 attention dimensions to avoid overfitting and optimize efficiency. For detailed results, see
Table 7.
4.8. Visual Explanation Using Grad-CAM
We employed Grad-CAM (Gradient-weighted Class Activation Mapping) [
34] to visualize which regions of the input video frames most influenced the model’s predictions. Grad-CAM computes the gradients of the target class score with respect to the convolutional feature maps and uses them to generate class-discriminative localization maps. These maps highlight the spatial regions that the model focuses on when making its decision.
In our experiments, we applied Grad-CAM to the output of the MARLIN encoder to generate attention heatmaps for the pain classification task. As illustrated in
Figure 8, the model consistently showed moderate attention to facial regions such as the eyes and mouth corners when classifying High Pain inputs. These regions became more pronounced and visually distinguishable when the subject exhibited clear facial expressions associated with pain. However, the overall Grad-CAM activations were relatively abstract and lacked sharp localization, suggesting that the model’s attention was distributed rather than highly focused. In contrast, for No Pain inputs, the model displayed diffuse or minimal activation, often spreading attention across the entire face without clearly defined focal points. This indicates that the absence of distinctive facial features in neutral expressions may hinder the model’s ability to confidently localize informative regions, contributing to lower discriminative capacity for this class.
4.9. Effectiveness of Fusion Methods
Figure 9 illustrates the effectiveness of our attention-fused approach compared to other methods in terms of accuracy. Based on the experiment conducted under the “B-1” condition across all modalities, our attention-based fusion approach outperforms all modality combinations except for “fNIRS + manual”. While our method demonstrates superior performance, the differences in accuracy between various modality combinations remain relatively small. This suggests that while fusion strategies can enhance performance, the choice of modality pairing also plays a crucial role in achieving optimal results.
4.10. Model Complexity and Speed
Table 8 presents a comparison of model complexity and inference speed across different modalities. The MMAPA model using only fNIRS data contains significantly fewer parameters (0.49 M) compared to the video-based models (over 86 M parameters). Despite this substantial reduction in model size, the fNIRS-only model achieves competitive accuracy while offering a remarkable inference speed of 3620 samples per second. In contrast, video-based models achieve only around seven samples per second due to their much larger architectures. These results suggest that fNIRS-based models represent a more efficient and practical choice, particularly for real-time or resource-constrained applications. The lightweight nature and high inference speed of the MMAPA (fNIRS) model make it highly suitable for deployment on edge devices, enabling fast and scalable pain detection without the need for heavy computational infrastructure.
5. Discussion
Our proposed MMAPA framework is designed with potential real-time deployment in mind. During validation, we observed that the average inference speed for the fNIRS-only model was approximately 3620 samples per second, while video-based models achieved only around seven samples per second. These results suggest that the fNIRS-based MMAPA variant is highly capable of supporting real-time pain assessment even on resource-constrained devices. In contrast, the large computational overhead of video-based models highlights the need for the further optimization of video embeddings. Future work should explore more lightweight yet effective video feature extraction methods to enhance real-time applicability without sacrificing accuracy. Additionally, deployment on lower-power edge devices could benefit from techniques such as model pruning, quantization, or knowledge distillation, which we leave as future directions.
From an ethical standpoint, we acknowledge the risk of bias when applying MMAPA to underrepresented groups such as elderly or non-Western populations, particularly given the demographic limitations of the AI4Pain and BioVid datasets. Broader validation across diverse cohorts is necessary before clinical adoption to ensure fairness and generalizability.
Regarding model failure analysis, MMAPA consistently struggled in detecting the “No Pain” category, often misclassifying these instances as “Low Pain” or “High Pain”. This challenge likely arises from the more subtle facial and physiological cues present when no pain is experienced, which is a phenomenon similarly noted in prior studies. Due to dataset restrictions, we could not publicly share qualitative examples, but internal error analysis confirmed the difficulty in distinguishing the “No Pain” class reliably.
6. Conclusions
Our proposed method demonstrated a high validation accuracy. Its validation accuracy reached up to 62.7% for both the video + fNIRS and the video + manual statistical features configurations. For the final submission, we chose to report results using the video + fNIRS modality, as it showed the best performance in internal validation. However, our model achieved only 51.33% accuracy on the hidden test set. This performance gap can be primarily attributed to the high class imbalance in the test dataset, where the “No Pain” category was significantly underrepresented. A simple up-sampling strategy to generate more “No Pain” samples proved ineffective for our model. Moreover, since the challenge was designed to reward the highest overall accuracy, we prioritized optimizing for general performance and did not conduct extensive experiments specifically aimed at improving the “No Pain” classification.
The fNIRS modality faced challenges due to artifact noise, which is a known issue that requires rigorous preprocessing for optimal signal quality. Our artifact filtering approach partially mitigated these effects, although some residual noise may have impacted the final model performance. This noise is typically introduced by ambient lighting, subject movement, or improper sensor placement, resulting in signal contamination and information loss. As a result, physiological patterns became harder to distinguish, making it more difficult for the model to learn meaningful features from the fNIRS data. Without thorough preprocessing—such as the artifact filtering discussed in this study—fNIRS data remain highly susceptible to noise, limiting its standalone effectiveness in pain classification tasks.
In contrast, our experiments on the BioVid Heat Pain database demonstrated that the GSR modality provided more discriminative features for pain detection than the video modality alone. The fusion of GSR and video using our attention-based model achieved the highest accuracy in the 10-fold cross-validation setting, outperforming both unimodal baselines and prior models such as PainAttNet. These results support the value of physiological signals in automatic pain recognition and highlight the effectiveness of our multimodal attention-based fusion approach in capturing complementary information.
These findings underscore the complexity of pain classification and highlight the challenge of achieving balanced sensitivity across all pain categories. Future work should explore more advanced fusion strategies, semi-supervised or self-supervised learning to leverage underrepresented classes such as “No Pain” and the inclusion of additional datasets or modalities (e.g., EEG or EMG) to further enhance generalization. Testing the model in real-world clinical scenarios would also be a valuable next step to evaluate its practical applicability.

 ,
, 


