Article

Predicting Risk Factors for Dyslipidemia Based on Health Behaviors by Age in Adults Using Machine Learning

1
Division of Software Liberal Arts, University of Mokwon, Daejeon 35349, Republic of Korea
2
Well-Dying Convergence Laboratory, University of Konyang, Daejeon 35365, Republic of Korea
*
Author to whom correspondence should be addressed.
Appl. Sci. 2025, 15(9), 5131; https://doi.org/10.3390/app15095131
Submission received: 11 April 2025 / Revised: 2 May 2025 / Accepted: 3 May 2025 / Published: 5 May 2025

Abstract

:
According to the 2022 Korean Society of Lipidology and Atherosclerosis, in Korea, dyslipidemia is a common disease that occurs in 40.2% of adults aged 20 or older, and its prevalence increases with age. Although dyslipidemia has a high prevalence of 47.8% in adults aged 30 or older, it is known to be preventable and manageable through lifestyle improvements in areas including eating habits, alcohol consumption, smoking, and physical activity. In this study, we propose a model for predicting age-specific dyslipidemia risk factors according to adult health behavior characteristics and diet. By analyzing the correlation between age-specific health behaviors and diet and the presence or absence of dyslipidemia, we aimed to predict dyslipidemia risk factors through a combination of multiple factor variables. This study utilized data from the 8th National Health and Nutrition Examination Survey, and selected 12,028 adults who received a doctor’s diagnosis of dyslipidemia as the subjects. In order to compare the characteristics of the dyslipidemia diagnosis group and the non-diagnosed group, a Rao–Scott χ2 test was performed, and machine learning-based logistic regression and decision tree analyses were performed to predict the dyslipidemia risk factors. Analyzing the difference in the dyslipidemia prevalence according to the general characteristics and health status showed no significant difference between the men and women in the 19–34, 35–49, and 50–64 age groups, but there was a significant difference in the dyslipidemia prevalence in the 65 and older group. It was found that the dyslipidemia risk also increased with age. In terms of health behavior characteristics, the alcohol intake frequency and aerobic exercise frequency were found to have statistically significant effects and, in terms of eating habits, the breakfast frequency and dining out frequency were found to be significant factor variables in the dyslipidemia prevalence. As a result of the decision tree analysis, the most important dyslipidemia predictive factor showed differences according to the age group. The most important predictive variable for the presence or absence of dyslipidemia in the 19–34 age group was the BMI; for the 35–49 age group, it was gender and subjective health perception; for the 50–64 age group, it was subjective health perception and the BMI; and for the 65 and older group, it was the BMI. This suggests that healthy eating habits and behaviors such as aerobic exercise are very important for preventing and managing dyslipidemia as age increases.

1. Introduction

Cardiovascular disease (CVD) is a major cause of death worldwide, linked to an estimated 17.9 million deaths annually, accounting for 32% of all deaths globally [1,2]. In particular, dyslipidemia is a major risk factor for cardiovascular disease along with hypertension and smoking [3], and it is estimated that its increased occurrence is one of the reasons why cerebrovascular disease prevalence is decreasing, along with that of all cardiovascular diseases, while coronary artery disease prevalence is steadily increasing [3,4].
The criteria for dyslipidemia generally include a total blood cholesterol of 240 mg/dL or higher, LDL (low-density lipoprotein) cholesterol of 160 mg/dL or higher, neutral fat of 200 mg/dL or higher, and HDL (high-density lipoprotein) cholesterol of less than 40 mg/dL, and if any one of these four criteria is met, a diagnosis of dyslipidemia is warranted [5].
According to the 2022 Korean Society of Lipid and Atherosclerosis, in Korea, dyslipidemia is a common disease that occurs in 40.2% of adults aged 20 years or older, and its prevalence increases with age. Regarding the prevalence rate by gender, approximately 47.4% of the men in all age groups exhibit dyslipidemia. The prevalence in women is 33% and, although, before menopause, the prevalence is lower than that in men, the prevalence increases with age to a rate similar to that in men after menopause [2].
In this way, dyslipidemia shows different characteristics according to gender and age. Regarding the distribution of specific lipid concentrations, the total cholesterol is higher in men than in women in their 30s and 40s, but this changes around the age of 50, and after the mid-50s, it is actually higher in women [2,4,6]. The hypercholesterolemia prevalence is the lowest in men in the 20–24 age group, at 1.5%, and is the highest in the 55–59 age group, at 16.3%. On the other hand, the hypercholesterolemia prevalence in women in the 20–24 age group is 1.9%, which is not much different from that of men, but it increases rapidly after the age of 50, reaching 31.7% in the 60–64 and 65–69 age groups, which is more than twice as high as that of men [4]. Neutral fat increases rapidly in men from the age of 10 to 40, maintains a high level in the 40–60 age group, and then gradually decreases after the age of 60.
On the other hand, women’s neutral fat levels remain very low until their 30s, then begin to increase after their mid-40s and reach their highest levels after 65. Therefore, men have significantly higher triglyceride concentrations than women in their 20s to 50s, but women have higher levels than men after reaching their 60s, showing inverse characteristics depending on age [2,6,7]. LDL cholesterol, which is highly related to cardiovascular disease, shows a similar distribution to that of the total cholesterol concentration. In men, it increases rapidly from the early 20s, maintains a high level in the 30s to 50s, and then gradually decreases. In women, it increases until age 60 and gradually decreases thereafter.
When examining the details of dyslipidemia independent of age and gender, the prevalence of hyper-LDL cholesterolemia was 20.4%, the prevalence of hypertriglyceridemia was 15.5%, and the prevalence of low-HDL cholesterolemia was 16.7% [2]. Overseas, in the United States, women were found to have a higher hyper-LDL-cholesterolemia prevalence and lower hypertriglyceridemia than men. In China, women had a higher prevalence of both hyper-LDL cholesterolemia and hypertriglyceridemia than men [6,7], and dyslipidemia was more common in women than in men [6,7,8].
The dyslipidemia prevalence varies greatly depending on the presence or absence of comorbidities [2,3,4,6,7,8]. The dyslipidemia prevalence is 26% in people without diabetes, but is 87.1% in people with diabetes. The dyslipidemia prevalence is 27% in people without hypertension, but 72.1% in people with hypertension. In addition, dyslipidemia is related to the degree of obesity, and the prevalence rates for underweight, healthy weight, overweight, and obese individuals are 10.5%, 26.2%, 44.0%, and 55.4%, respectively [2].
According to several previous studies, dyslipidemia is related to lifestyle habits such as diet, drinking alcohol, smoking, and physical activity, and can be prevented and managed through lifestyle improvements. In particular, a healthy diet is reported to be an important factor in preventing chronic diseases including dyslipidemia and cardiovascular disease [9,10]. When examining the relationship between physical activity status and dyslipidemia in adults, there was no significant difference between dyslipidemia indices in the moderate-intensity physical activity group, but the total cholesterol levels were significantly lower according to the number of days of high-intensity physical activity [11,12]. In addition, in a group that exercised through walking, compared to a group that did not, the greater the total number of physical activities performed, the more significantly reduced the neutral fat, neutral fat/high-density cholesterol ratio, and total cholesterol/high-density cholesterol ratios were, showing a significant relationship with different specific dyslipidemia indices depending on the physical activity status [11].
In the case of adult women partaking in aerobic exercise and walking, there was a significant difference in the hyper-LDL-cholesterolemia and hypertriglyceridemia prevalence dependent on aerobic exercise participation in the 50–64 age group, and there was a significant difference in the hypertriglyceridemia prevalence with exercising through walking. In addition, the risk factors for hyper-LDL-cholesterolemia and hypertriglyceridemia differed by age, but common risk factors in all age groups were hypertension and smoking [6]; additionally, the body mass index and abdominal circumference in adult women aged 19–59 were significant predictors of dyslipidemia [6,8].
In this way, dyslipidemia is reported to be closely related to not only disease factors such as hypertension, diabetes, and obesity, but also demographic factors such as age and gender and health behavior factors such as drinking alcohol, smoking, eating habits, and physical activity [6,7,8,9,10], so it is necessary to predict dyslipidemia by considering these various factors. It is required to analyze not only the independent influence of each explanatory variable on dyslipidemia, but also the number of cases of interaction between various explanatory variables, in order to explore risk groups.
In this study, we analyzed dyslipidemia risk factors according to sociodemographic characteristics and health behaviors such as eating habits and physical activity using the 8th KNHANES (2019–2021) data on adults aged 19 years or older, and through this, provided health behavior information for preventing and managing dyslipidemia.

2. Methods

This study is a secondary data analysis study using raw data from the 8th KNHANES (2019–2021) conducted by the Ministry of Health and Welfare and the Korea Disease Control and Prevention Agency [13]. This was a study that attempted to identify risk groups through a combination of factors that correlate with dyslipidemia and predict factors according to health behaviors in adults aged 19 years or older according to age group. KNHANES (The Korea National Health and Nutrition Examination Survey) is a statutory survey conducted annually to determine the health and nutritional level of Korean citizens, and investigates health behaviors, chronic diseases, disease prevalence, and food and nutritional intake status.

2.1. Research Subjects and Data Collection

The subjects of this study were 12,028 adults aged 19 years or older (5603 males and 6425 females) who had no missing values for the research variables health behavior characteristics and dyslipidemia diagnosis, taken from the 22,559 people who participated in the 8th KNHANES (2019–2021). The researchers received approval to use the data through the KNHANES website, which provides the raw data with the participants’ identifying and sensitive information deleted, and conducted the study after receiving approval for exemption from deliberation by the Research Ethics Committee of K University (KYU 2024-09-027).
In this study, variables related to health behavior characteristics were selected as explanatory variables, and the dependent variable was classified as a diagnosis or no diagnosis of dyslipidemia by a doctor (“yes” or “no”).

2.2. Research Tools

2.2.1. Demographic Characteristics and Health Status

The demographic characteristics included gender, age, marital status, household income, and education level, and the health status included body mass index (kg/m2), subjective health perception, dyslipidemia diagnosis, and family history as variables. When there were too many categories in the raw data, the distribution and frequency were severely uneven, and it was difficult to compare the results with those of other previous studies, so the categories were reorganized to suit the research purpose. Gender was divided into male and female, and age was divided into youth (19–34 years old), early middle age (35–49 years old), late middle age (50–64 years old), and old age (65 years old or older) by life cycle. Marital status was classified as married/not married; household income was classified as low/middle/high; education level was classified as middle school graduate or less/high school graduate/college graduate or higher; and body mass index was classified into underweight/normal/obesity. Also included were the subjective health perception (good/normal/bad), dyslipidemia diagnosis (yes/no), and family history (yes/no).

2.2.2. Health Behavior Characteristics

Health behavior characteristics included drinking alcohol, smoking, high-intensity physical activity time, medium-intensity physical activity time, number of walking days, walking duration, number of strength exercise days per week, aerobic exercise practice rate, and perceived stress level. Alcohol intake was categorized as no drinking/less than once a month/2–4 times a month/2–3 times a week/more than 4 times a week, and smoking rate was categorized as non-smoker/less than 5 packs/more than 5 packs. High-intensity physical activity time and medium-intensity physical activity time were categorized as none/1 h/more than 2 h; walking days were categorized as not practiced/less than 5 days/more than 5 days; and walking duration was categorized as not practiced/1 h/more than 2 h. The number of strength exercise days per week was categorized as not practiced/less than 3 days/more than 3 days; aerobic exercise practice rate was categorized as not practiced/practiced; and perceived stress level was categorized as feel a lot/feel a little/do not feel.

2.2.3. Practice of Healthy Eating Habits

The questions related to healthy eating habits enquired about breakfast frequency, lunch frequency, dinner frequency, and dining out frequency. Breakfast frequency, lunch frequency, and dinner frequency were categorized as almost never/1–2 times a week/3–4 times a week/5–7 times a week, and dining out frequency was categorized as almost never/1–3 times a month/1–4 times a week/5–6 times a week/1 or more times a day.

2.3. Data Analysis Methods

The data used in this study were collected using a complex sample method, so a complex sample statistical analysis was used that considered weight variables, stratification variables, and cluster variables [13]. The analysis program used was SPSS/WIN 29.0, and the statistical significance level was <0.05. The specific analysis methods were as follows.
(1) The subjects were divided into age groups of 19–34 years old, 35–49 years old, 50–64 years old, and 65 years old or older, and the differences in the dyslipidemia prevalence according to demographic characteristics, health behavior characteristics, and healthy eating habits in each age group were confirmed through cross-analysis, while the Rao–Scott chi-square test was performed to verify significance. (2) Multiple logistic regression analysis was performed to confirm the correlation between health behavior practice and dyslipidemia, and the odds ratio (OR) and 95% confidence interval (CI) were calculated as relative risks. (3) Decision tree analysis was performed to explore the risk group for dyslipidemia by considering the number of cases of interaction between various explanatory variables.
Looking at previous domestic and international studies that analyzed the risk factors of dyslipidemia, logistic regression analysis was used with dyslipidemia as the dependent variable [6,8,9,10]. Logistic regression analysis is a widely used statistical technique for predicting the probability of an event by using linear combinations of explanatory variables when the dependent variable is binomial form, and its purpose is data classification. Logistic regression analysis has the advantage of being able to identify the influence of each variable, but it is almost impossible to analyze all cases of interactions between multiple explanatory variables entered into the prediction model because it assumes that the effect of one explanatory variable does not depend on the level of other explanatory variables [14,15].
In this study, the influence of each variable affecting dyslipidemia was identified through logistic regression analysis, and the number of cases of interaction between various variables was explored through decision tree analysis. Decision tree analysis is an algorithm that finds the effects of influential variables or interactions, and the decision tree itself can be used as a classification or prediction model. Decision tree analysis presents a combination of influential variables in a nonparametric way, so that users can easily understand the model [15]. Decision tree analysis has the limitation that it cannot interpret the influence of useful variables, but it is useful for exploring risk groups and has the function of supporting the results of regression analysis [16,17].

3. Results and Discussion

3.1. Differences in the Dyslipidemia Prevalence by Subject Characteristics by Age

3.1.1. Differences by General Characteristics and Health Status

The subjects of this study were 12,028 adults who received a diagnosis of dyslipidemia, including 2310 (19.2%) aged 19–34; 3330 (27.7%) aged 35–49; 3533 (29.4%) aged 50–64; and 2855 (23.7%) aged 65 or older. The dyslipidemia prevalence in the subjects was 16.7% for those aged 19–34; 12.8% for those aged 35–49; 18.8% for those aged 50–64; and 32.5% for those aged 65 or older, and there was a significant difference by age (χ2 = 392.767, p < 0.001).
Through analyzing the difference in the dyslipidemia prevalence according to general characteristics and health status by age (Table 1), a significant difference was found by age in general characteristics such as gender (χ2 = 4.734, p < 0.004), marital status (χ2 = 1347.042, p < 0.001), household income (χ2 = 158.485, p < 0.001), and education level (χ2 = 486.545, p < 0.001). When examined by age, there was no significant difference between the men and women in the 19–34, 35–49, and 50–64 age groups, but there was a significant difference in the dyslipidemia prevalence in the 65 and older group.
A “good” subjective health status showed the highest rate in the 19–35 age group, at 41.9%, and a “bad” health status showed the highest rate in the 65 and older age group, at 26.4%. Regarding weight, underweight or healthy weight occurrence showed the highest rate in the 19–34 age group, and obesity showed a higher rate in the 50–64 age group and the 65 and older age group compared to that in the other groups. There were significant differences by age in terms of the subjective health status (χ2 = 35.501, p < 0.001), body mass index (χ2 = 39.149, p < 0.001), and family history (χ2 = 59.417, p < 0.001).

3.1.2. Differences by Health Behavior and Eating Habits

Table 2 shows the difference in the dyslipidemia prevalence according to health behavior characteristics by age. An alcohol intake frequency of 2–4 times a month was most common in all of the age groups, and the no drinking rate was highest in the 64 years or older group, at 55.8%. The lifetime smoking rate of “more than 5 packs” was relatively low in the 19–35 age group and relatively high in the 65 years or older group. The group that responded that they “feel a lot” in terms of perceived stress was relatively high in the 19–34 age group, at 35.0%, and the perceived stress decreased with age.
For high-intensity and moderate-intensity physical activities, “none” was reported in more than 90% of all of the age groups. A number of walking days of “less than 5 days” was the most common in all of the age groups and a walking duration of “none/less than 1 h” was the most common. A number of strength training days of “less than 3 days” was most common. Aerobic exercise was most frequent in the 19–34 age group, and the aerobic exercise rate decreased with age.
In terms of the health behavior characteristics, all variables showed statistically significant differences in terms of the presence or absence of dyslipidemia, including drinking alcohol (χ2 = 38.607, p < 0.001), smoking (χ2 = 35.910, p < 0.001), perceived stress (χ2 = 80.621, p < 0.001), high-intensity physical activity (χ2 = 4.456, p < 0.001), moderate-intensity physical activity (χ2 = 10.901, p < 0.001), number of walking days (χ2 = 24.055, p < 0.001), walking duration (χ2 = 10.715, p < 0.001), number of strength training days (χ2 = 9.599, p < 0.001), and aerobic exercise (χ2 = 69.304, p < 0.001). However, when looking at each age group, only the 65 years and older group showed a statistically significant difference in high-intensity physical activity. In addition, there was no significant difference in the number of days of strength training in the 50–64 age group and in aerobic exercise in the 35–49 age group.
Table 3 shows the difference in the dyslipidemia prevalence according to the subjects’ eating habits. In terms of the breakfast frequency, a frequency of “5–7 times a week” was the highest in those aged 65 or older, at 91.8%, while a frequency of “almost never” was the highest in those aged 19–35, at 36.3%. In terms of the lunch and dinner frequency, a frequency of “5–7 times a week” was the highest in all of the age groups. In terms of the dining out frequency, a frequency of “almost never” increased with age, and the highest frequency was “1–4 times a week” in all of the age groups. In terms of dietary habit practices, the breakfast frequency (χ2 = 215.485, p < 0.001), lunch frequency (χ2 = 7.988, p < 0.001), dinner frequency (χ2 = 18.498, p < 0.001), and dining out frequency (χ2 = 162.134, p < 0.001) showed significant differences by age in terms of the relationship with the presence or absence of dyslipidemia.

3.2. The Effect of Health Behavior and Eating Habits on the Dyslipidemia Prevalence

In this study, a logistic regression analysis was performed to determine the influence on the dyslipidemia prevalence. The logistic regression model uses the maximum likelihood estimation method, so it is an analysis method suitable for a sufficiently large sample such as the subject of this study to obtain a reliable estimate. The logistic regression model does not require assumptions on normality and homoscedasticity because the relationship between the dependent variable and the independent variables is identified as nonlinear, but nonlinearity between the independent variables must be assumed. Since the linear relationship between two variables is expressed in the form of a straight line, the larger the correlation, the stronger the linearity between the two variables.
As a result of analyzing the correlation between the independent variables to improve the accuracy of the prediction model, the variable that was most relatively highly correlated with the dyslipidemia prevalence regarding the general characteristics of the subjects was found to be age (Figure 1).
In addition, although the problem of multicollinearity between the variables was not specifically observed (Figure 2), the purpose of this study was to identify the relationship between the dyslipidemia prevalence and health behavior and eating habits by age, and, thus, the variables of household income and education level, which showed relatively high correlations, were excluded from the logistic regression analysis.
The logistic regression analysis results (Table 4) showed that the age, marital status, subjective health perception, body mass index, and family history significantly affected the presence or absence of dyslipidemia in terms of the general characteristics. Regarding the health behavior characteristics, the alcohol intake frequency and aerobic exercise frequency were found to have statistically significant effects, and in terms of eating habits, the breakfast frequency and dining out frequency were found to be significant factors in terms of the presence or absence of dyslipidemia.
In Table 4, coef is the logit function coefficient of each independent variable and is the log (odds ratio) value (Equation (1)). The closer this value is to 0, the less influence it has on the dependent variable, and the further it is from 0, the greater influence it has on the dependent variable. The odds ratio is the probability of an event occurring divided by the probability of it not occurring. In this study, the presence or absence of dyslipidemia is the dependent variable, so the ratio is of the number of people with risk factors for dyslipidemia to the number of people without risk factors for dyslipidemia.
log o d d s = log p 1 p = β 0 + β 1 X 1 + + β n X n ,    P y = 1 X = p = e β 0 + β 1 X 1 + + β n X n 1 + e β 0 + β 1 X 1 + + β n X n β n   :   w h e n   X n   i n c r e a s e s   b y   1 ,   t h e   c h a n g e   i n   t h e   l o g i t   v a l u e e β n   :   w h e n   X n   i n c r e a s e s   b y   1 ,   t h e   c h a n g e   i n   t h e   e l o g i t = o d d s   v a l u e  
Equation (1) shows the calculation formulas for the coefficients and odds ratio. Since the odds ratio indicates the presence or absence of dyslipidemia, the logit function is a conversion function that takes the log function of the odds ratio. In Equation (1), the influence of the independent variable can be confirmed with the beta value.
As shown in Table 4, the risk of dyslipidemia is predicted to increase by 1.605 times when the age increases by 1 unit. The odds ratio of gender is 0.869, which can be interpreted as there being a lower dyslipidemia risk in women (gender = 1) than in men (gender = 0). The dyslipidemia risk is increased by 0.136 times if an individual’s marriage status changes from married to unmarried (divorced, widowed, etc.). In other words, the dyslipidemia risk is predicted to decrease if one becomes single. The dyslipidemia risk also increases by 1.432 times in those who perceive their health as bad compared to those who perceive their health as good. In addition, the dyslipidemia risk is predicted to increase by 1.477 times in those with obesity according to their BMI and by 1.454 times in those with a family history of the condition.
Figure 3 displays the confusion matrix and ROC curve for evaluating the performance of this prediction model. A confusion matrix is a matrix created by comparing the results predicted by the model with the actual results. In Figure 3a, accuracy is the ratio of how much the results predicted by the model match the actual results. Precision indicates the ratio of data that are actually true out of the data predicted by the model as true, so the higher this index is, the more accurate the model’s predictions are.

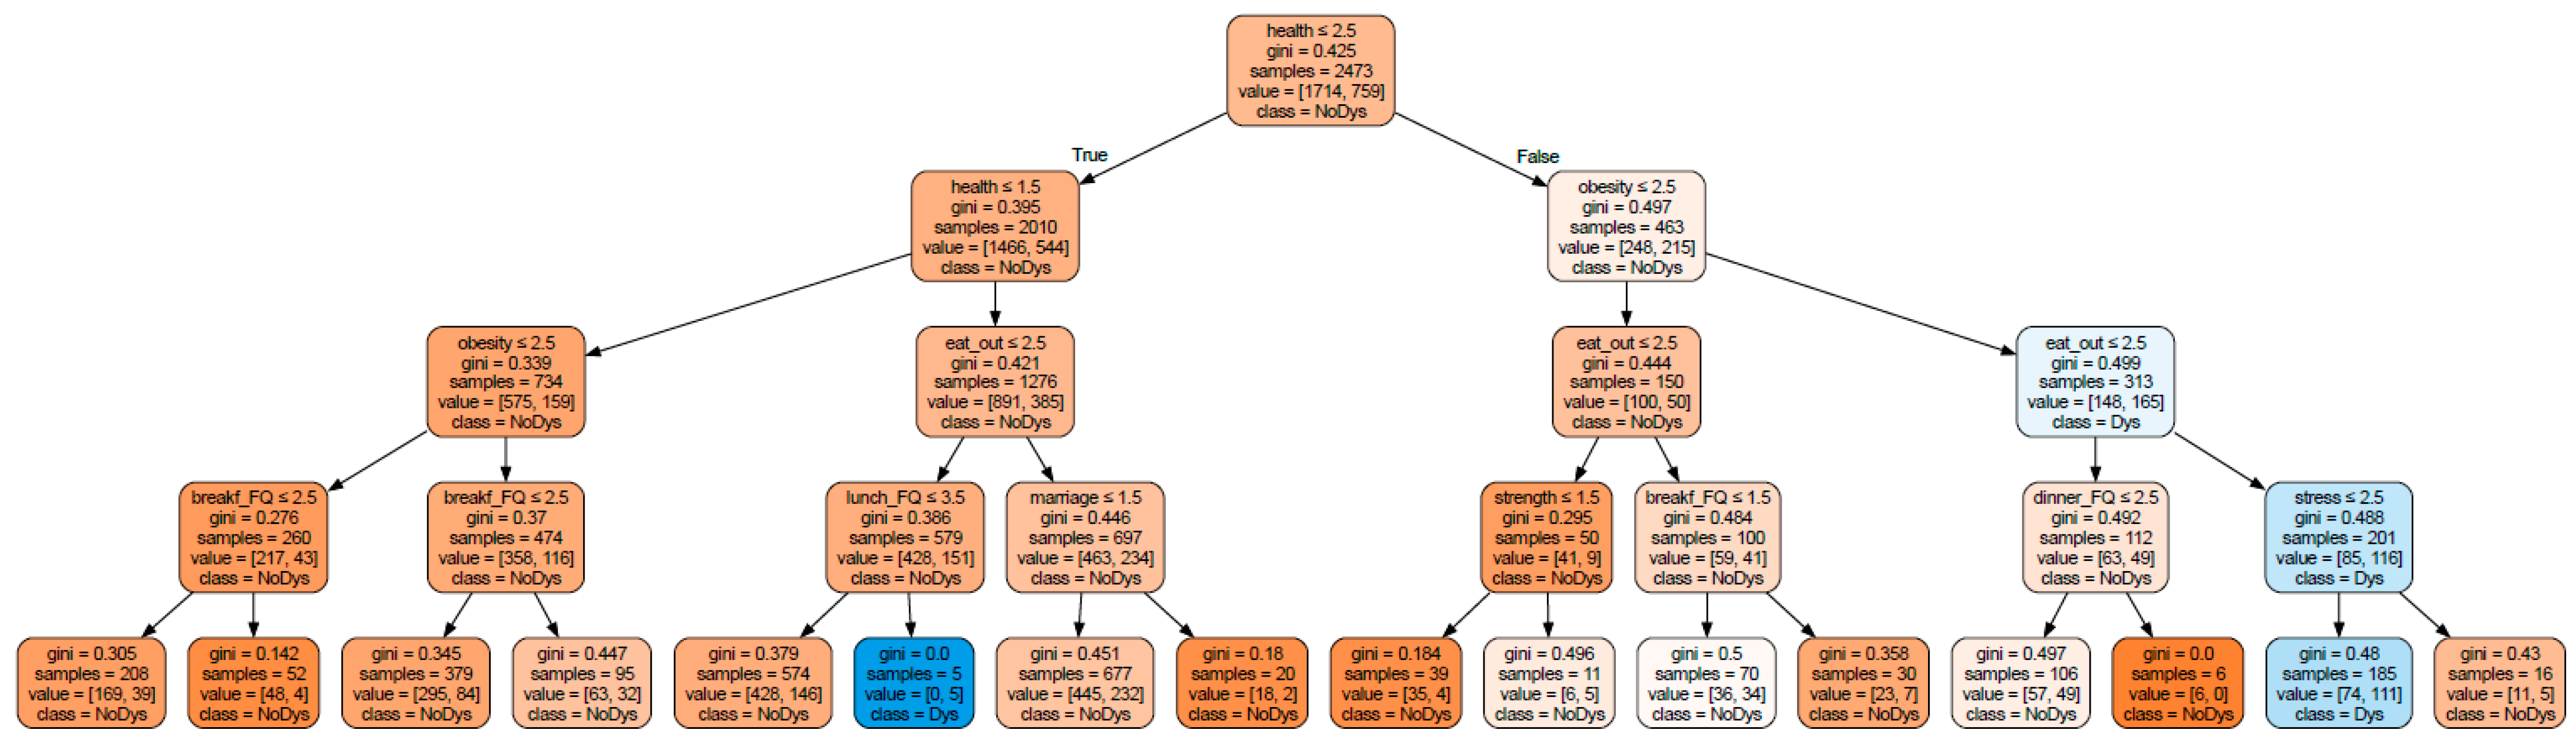
3.3. Prediction of Risk Factors for Dyslipidemia Based on Health Behavior by Age

A decision tree analysis was performed to examine the combination of dyslipidemia risk factors according to health behavior by age. A decision tree analysis has the advantage of being able to intuitively examine the combination of factors with the highest level classified as the dependent variable for dyslipidemia and the conditions of independent variables that classify dyslipidemia. Figure 4 shows the results of the decision tree analysis for the entire sample of 12,025 people. In addition to the general characteristics of the subjects, 19 variables were used in the analysis, including variables related to health behavior, and the max_depth was set to 5 to specifically examine the prediction results of each explanatory variable classified as dyslipidemia.
The model’s train accuracy was 0.987, and the test accuracy was 0.830, but cross-validation was performed to avoid overfitting, which may occur during the model learning process and to evaluate the model reliably. In this study, the KFold cross-validation method was used to create a general model through multiple validations and tune the parameters. As a result of performing parameter tuning and cross-validation using the GridSearchCV function, the best performance was achieved when the tuned parameters were max_depth = 5, min_samples_split = 3, and splitter = random. In addition, in order to find the optimal max_depth in cross-validation using KFold, we fitted the random forest model from 1 to the number of sample variables. As a result, the average accuracy was 0.901 when max_depth = 5 and 0.899 when max_depth = 6, and it was confirmed that the average accuracy was the highest when max_depth = 5.
The cross-validation average was 0.961, so the accuracy of the classification model can be expected to be approximately 96%. The objective function that determines the separation criteria in the decision tree uses the chi-square statistic, Gini index, and entropy as measures of impurity. The closer the entropy is to 0, the lower the impurity is, and if the impurity is 0, this means that there is only one data point in one category.
Χ 2 = k = 1 m ( E k O k ) 2 / E k
Equation (2) is the calculation formula for the chi-square statistic. E and O are the expected frequency and the observed frequency, respectively, and the separation criterion is set to the value at which the chi-square statistic is maximized.
G = 1 k = 1 m ( p k ) 2
In Equation (3), PK is the proportion of data belonging to class k.
G = i = 1 d R i ( 1 k = 1 m ( p k ) 2 )
In Equation (4), Ri is the proportion after splitting.
In this study, the Gini coefficient was used as a measure of impurity, and its value becomes smaller when one class (no dyslipidemia) is more numerous than another class (dyslipidemia), which means that impurity is minimized [18,19].
The results of classifying the risk factors for dyslipidemia in all of the 12,025 subjects regardless of age are shown in Figure 4. The higher the node formed first, the more important the variable is in terms of influence factors.
As shown in Figure 4, the Gini coefficients of all of the nodes are less than 0.5, indicating good impurity. Regarding the factors that influenced the classification of the dependent variable, a dyslipidemia diagnosis, in all of the 12,025 subjects, those for the 19–34 and 35–49 age groups included age, family history, gender, and obesity, while health behaviors and eating habits did not have a significant effect.
On the other hand, age was found to be the most important factor in the 50–64 and 65 and older groups, and other significant predictors were health awareness, obesity, and gender, in that order. Drinking alcohol, smoking, walking days, and eating habits also appeared as significant predictors for classifying dyslipidemia. This supports the research result that the dyslipidemia prevalence increases with age [2].
The root node was classified into the 19–34, 35–49, 50–64, and 65 or older groups based on the age variable. A proportion of 70% of the samples was used for model learning. At the second level, the 19–34 and 35–49 groups were classified based on age as a classification criterion that affects whether or not dyslipidemia is diagnosed, and the 50–64 and 65 or older groups were classified based on the body mass index. At the third level and above, the 19–34 and 35–49 groups were classified as not having dyslipidemia. The actual dyslipidemia rates in the 19–34 and 35–49 groups were 16.7% and 12.8%, respectively, which were lower than those in the 50–64 and 65 or older groups.
In the 50–64 and 65 or older groups, those who were underweight or had a normal BMI (obesity ≤ 2.438) showed dyslipidemia according to their drinking frequency, and a poor subjective health awareness and walking frequency of less than 1 day affected the dyslipidemia classification. When the alcohol intake frequency exceeded 2–4 times a month and 2–3 times a week or less (drinking > 2.152 and drinking ≤ 4.424), and lunch frequency was 3–4 times a week or more (lunch_FQ > 2.537), this combination was classified as dyslipidemia. In particular, in the 50 or older group, those who were obese and had poor health awareness were classified as having dyslipidemia, and when they were female (gender > 1.903) and had an alcohol intake frequency of 2.524 or less, dyslipidemia was predicted.
We examined the combination of factors affecting dyslipidemia by age group. Figure 5 shows the results of the decision tree analysis targeting the 19–34 age group; the dyslipidemia prevalence in this group was 1% (22 people) out of 2310 people. As shown in Figure 5, a good prediction model with a relatively low impurity and no need for pre-pruning was presented. In this age group, the BMI was found to be the most important prediction factor. In cases where the BMI indicated underweight/healthy weight, dyslipidemia was classified in 2 people, but in cases where the BMI indicated obesity, it was classified in 12 people. Most of these cases were in the group that felt a lot of stress, and looking at the following separation criteria, it was found that the higher the dinner frequency, the more the dyslipidemia prevalence was affected.
Figure 6 shows the results of the decision tree analysis for the 35–49 age group. The dyslipidemia prevalence in the 35–49 age group was 8.3% (278 people) out of a total of 3330 people. In this group, the most important predictor variable for the presence or absence of dyslipidemia was gender, and the next most important variable was subjective health perception. In the case of men with a “bad” health perception, their perceived stress and dinner frequency were found to be related to the dyslipidemia prevalence. In the case of women with a “bad” health perception, a higher lunch frequency predicted dyslipidemia.
Figure 7 shows the results of the decision tree analysis of the 50–64 age group. The dyslipidemia prevalence in the 50–64 age group was 30.7% (1085 people) out of a total of 3533 people. The most important factor for dyslipidemia in this group was the subjective health perception. In cases where health was perceived as “bad”, the second-level separation criterion was the BMI. If the BMI indicated obesity, looking at the third-level node, we can see that there were more samples predicted as having dyslipidemia (“No” (148 people) and “Yes” (165 people). In this node, dyslipidemia was predicted when the dining out frequency was 1–4 times a week or more. On the other hand, in cases where health was perceived as “good/normal”, the final number of samples predicted as having dyslipidemia was five.
The dyslipidemia prevalence in the group aged 65 or older was 39.3% (1123 people) of the total 2855 people. Figure 8 shows the results of the decision tree analysis for the group aged 65 and over. In this group, the most important predictor variable for the presence or absence of dyslipidemia was BMI. In cases where the BMI indicated obesity, this was classified based on gender, and dyslipidemia was predicted based on the BMI for men and the number of walking days for women.
On the other hand, in cases where the BMI indicated underweight or a healthy weight, the subjective health perception was found to be an important predictor variable for the presence or absence of dyslipidemia. In the case of good health awareness, family history and stress emerged as the main predictors, and in the case of poor health awareness, the samples were classified according to whether aerobic exercise was practiced and the number of times they ate breakfast. In cases where aerobic exercise was not practiced (aerobic > 0.5), stress emerged as the main predictor. In particular, in the group aged 65 years or older, stress was found to be related to the dyslipidemia prevalence regardless of the level of awareness.

4. Conclusions

This study compared the characteristics of groups with and without dyslipidemia by age group using data from the 8th National Health and Nutrition Examination Survey (2019–2021) and analyzed the risk factors by constructing a dyslipidemia prediction model by adult age group through a logistic regression analysis and decision tree analysis. Previous studies have shown that dyslipidemia can be prevented and managed through health behaviors and healthy eating habits. In this study, the possibility of dyslipidemia occurrence according to a combination of various factor variables was predicted by analyzing the correlation between dyslipidemia and health behaviors and eating habits by age group.
As a result of analyzing the difference in the dyslipidemia prevalence according to the general characteristics and health status, there was no significant difference between the men and women in the 19–34, 35–49, and 50–64 age groups, but there was a significant difference in the dyslipidemia prevalence in the 65 years or older group. It was found that the dyslipidemia risk also increases with age.
The logistic regression analysis results showed that the age, marital status, subjective health perception, body mass index, and family history had a significant effect on the dyslipidemia prevalence in terms of the general characteristics. In terms of the health behavior characteristics, the alcohol intake frequency and aerobic exercise frequency were found to have a statistically significant effect and, in terms of eating habits, the breakfast frequency and dining out frequency were significant factor variables in the dyslipidemia prevalence.
In the decision tree analysis results, the most important dyslipidemia predictor showed differences by age group. In the 19–34 age group, the BMI was the most important variable, and in the 35–49 age group, gender was the most important variable, followed by subjective health perception. In the 50–64 age group, the subjective health perception was the most important classification criterion, and the BMI was the next most important variable. In addition, in the 65 and older age group, the BMI was the most important predictor variable in the dyslipidemia prevalence, and in this group, females with obesity were predicted to have a greater risk of dyslipidemia than those who were not. As age increases, health behaviors such as healthy eating habits and aerobic exercise become very important for preventing and managing dyslipidemia.

Author Contributions

Conceptualization, J.-H.K. and J.-S.K.; methodology, J.-H.K.; software, J.-H.K. and J.-S.K.; validation, J.-H.K. and K.-H.K.; formal analysis, J.-H.K.; investigation, J.-S.K.; resources, J.-S.K.; data curation, J.-S.K.; writing—original draft preparation, J.-S.K.; writing—review and editing, J.-H.K.; visualization, J.-H.K.; supervision, K.-H.K.; project administration, K.-H.K.; funding acquisition, K.-H.K. All authors have read and agreed to the published version of the manuscript.

Funding

This work was supported by the Ministry of Education of the Republic of the Korea and National Research Foundation of Korea (NRF-2020S1A5C2A04092504).

Institutional Review Board Statement

This study was conducted according to the principles of the World Medical Association Declaration of Helsinki and was received approval for exemption from deliberation by the Research Ethics Committee of Konyang University (KYU 2024-09-027).

Informed Consent Statement

Not applicable.

Data Availability Statement

The data underlying this article will be shared upon a reasonable request and the authors are not authorized to disclose the relevant data.

Conflicts of Interest

The authors declare no conflicts of interest.

References

  1. World Health Organization. Available online: https://www.who.int/news-room/fact-sheets/detail/cardiovascular-diseases-(cvds) (accessed on 1 October 2024).
  2. Korea Disease Control and Prevention Agency. National Health Information Portal, Dislipidemia. Available online: https://health.kdca.go.kr/healthinfo/biz/health/gnrlzHealthInfo/gnrlzHealthInfo/gnrlzHealthInfoView.do?cntnts_sn=6054 (accessed on 1 October 2024).
  3. Kim, H.C.; Oh, S.M. Noncommunicable diseases: Current status of major modifiable risk factors in Korea. J. Prev. Med. Public Health 2013, 46, 165–172. [Google Scholar] [CrossRef] [PubMed]
  4. Kim, H.C. Epidemiology of dyslipidemia in Korea. J. Korean Med. Assoc. 2016, 59, 352–357. [Google Scholar] [CrossRef]
  5. Korean Society of Lipid Atherosclerosis. The Committee of Clinical Practice Guideline of Korean Guidelines for the Management of Dyslipidemia, 4th ed.; The Korean Society of Lipid and Atherosclerosis: Seoul, Republic of Korea, 2018; pp. 31–33. [Google Scholar]
  6. Cha, B.K. Risk Factors affecting Dyslipidemia according to Age Group in Women: Data from the Korea National Health and Nutrition Examination Survey, 2014~2017. J. Korean Acad. Fundam. Nurs. 2020, 27, 310–322. [Google Scholar] [CrossRef]
  7. Park, J.H.; Lee, M.H.; Shim, J.S.; Choi, D.P.; Song, B.M.; Lee, S.W.; Choi, H.; Kim, H.C. Effects of age, sex, and menopausal status on lood cholesterol profile in the Korean population. Korean Circ. J. 2015, 45, 141–148. [Google Scholar] [CrossRef] [PubMed]
  8. Opoku, S.; Gan, Y.; Fu, W.; Chen, D.; Emmanuel, A.Y.; Trofimovitch, D.; Yue, W.; Yan, F.; Wang, Z.; Lu, Z. Prevalence and risk factors for dyslipidemia among adults in rural and urban China: Findings from the China National Stroke Screening and prevention project (CNSSPP). BMC Public Health 2019, 19, 1500. [Google Scholar] [CrossRef] [PubMed]
  9. Yoo, L.H.; Baik, D.I.; Lee, M.J. Relationship between age-specific practicing of a healthy diet and dyslipidemia in Korean Adults: A study of Korean adults without diagnosed cardiovascular disease. J. Korea Acad.-Ind. Coop. Soc. 2023, 24, 387–397. [Google Scholar] [CrossRef]
  10. Choi, W.H.; Seo, Y.M.; Jeon, M.Y.; Choi, S.Y. Convergence Study on the Comparison of Risk Factors for Dyslipidemia by Age and Gender: Based on the Korea National Health and Nutrition Examination Survey (2013~2015 year). J. Korea Converg. Soc. 2018, 9, 571–587. [Google Scholar] [CrossRef]
  11. Jeong, J.H.; Choi, Y.S.; Kim, S.M.; Choi, S.Y.; Kim, J.E.; Kim, E.Y.; Lee, H.Y.; Jung, J.H.; Jin, R. Correlation between Physical Activity Status and Dyslipidemia in Korean Adults: The 2010 Korea National Health and Nutrition Examination Survey. Korean J. Geriatr. Gerontol. 2014, 15, 35–44. [Google Scholar] [CrossRef]
  12. Han, I.H.; Chong, M.Y. The Study on the Difference of Blood Level of HDL-Cholesterol by Obesity and Health Behavior from the Seventh (2016) Korea National Health and Nutrition Examination Survey. J. Korea Soc. Food Sci. Nutr. (JFKN) 2020, 49, 1377–1388. [Google Scholar] [CrossRef]
  13. Korea Centers of Disease Control and Prevention. Sampling Design of the 6th KNHNES and Weighting Adjustment of the 8th KNHNES. Available online: https://knhanes.kdca.go.kr/knhanes/main.do (accessed on 20 April 2024).
  14. Cox, D.R. The regression analysis of binary sequences. J. R. Stat. Soc. Ser. B (Methodol.) 1958, 20, 215–232, Correction in: J. R. Stat. Soc. Ser. B (Methodol.) 2018, 21, 238. [Google Scholar] [CrossRef]
  15. Breiman, L.; Friedman, J.H.; Olshen, R.A.; Stone, C.J. Classification and Regression Trees; Wadsworth International Group: Belmont, CA, USA, 1984; pp. 237–251. [Google Scholar]
  16. Long, W.J.; Griffith, J.L.; Selker, H.P.; D’Agostino, R.B. A comparison of logistic regression to decision-tree induction in a medical domain. Comput. Biomed. Res. 1993, 26, 74–97. [Google Scholar] [CrossRef] [PubMed]
  17. Rudolfer, S.M.; Paliouras, G.; Peers, I.S. comparison of logistic regression to decision tree induction in the diagnosis of carpal tunnel syndrome. Comput. Biomed. Res. 1999, 32, 391–414. [Google Scholar] [CrossRef] [PubMed]
  18. QuantDare. Available online: https://quantdare.com/decision-trees-gini-vs-entropy (accessed on 15 December 2024).
  19. Scikit-Learn Machine Learning in Python. Available online: https://scikit-learn.org/stable/modules/tree.html (accessed on 20 February 2025).
Figure 1. Correlation analysis between independent variables (general characteristics).
Applsci 15 05131 g001
Figure 2. Correlation analysis between independent variables (health behavior).
Applsci 15 05131 g002
Figure 3. The confusion matrix and ROC curve for evaluating the performance of this prediction model. (a) The accuracy of this model was 86.971%(=3805/4375 × 100) and the precision was 94.271%; (b) the area under the ROC curve, AUC, was 0.764.
Applsci 15 05131 g003
Figure 4. Decision tree for predicting risk factors for dyslipidemia (regardless of age).
Applsci 15 05131 g004
Figure 5. Decision tree analysis results for the 19–34 age group.
Applsci 15 05131 g005
Figure 6. Decision tree analysis results for the 35–49 age group.
Applsci 15 05131 g006
Figure 7. Decision tree analysis results for the 50–64 age group.
Applsci 15 05131 g007
Figure 8. Decision tree analysis results for the group aged 65 or older.
Applsci 15 05131 g008
Table 1. Differences by general characteristics and health status of the selected sample.
Variables and Categories19–34 (%)p35–49 (%)p50–64 (%)p≥65 (%)pRao-Scott χ2
(p)
Gender
   Male
   Female
4.734
1110 (48.1)0.3501428 (42.9)0.3901544 (43.7)0.0051521 (53.3)<0.001(<0.004)
1200 (51.9) 1902 (57.1) 1989 (56.3) 1334 (46.7)
Marital status
   Married
   Not married
1347.042
512 (22.2)<0.0012925 (87.8)<0.0013396 (96.1)<0.0012833 (99.2)<0.001(<0.001)
1798 (77.8) 405 (12.2) 137 (3.9) 22 (0.8)
Household income
   Low
   Middle
   High
158.485
416 (18.0)<0.001533 (16.0)<0.001830 (23.5)<0.0011815 (63.6)<0.001(<0.001)
506 (21.9) 824 (24.7) 735 (20.8) 445 (15.6)
1388 (60.1) 1973 (59.2) 1968 (55.7) 595 (20.8)
Education level
   ≤Middle school graduate
   High school graduate
   ≥College graduate
486.545
31 (1.3)<0.00197 (2.9)<0.001897 (25.4)<0.0011918 (67.2)<0.001(<0.001)
1040 (45.0) 1057 (31.7) 1487 (42.1) 597 (20.9)
1239 (53.6) 2176 (65.3) 1149 (32.5) 340 (11.9)
Subjective health status
   Good
   Normal
   Bad
35.501
967 (41.9)<0.0011095 (32.9)<0.0011027 (29.1)<0.001742 (26.0)<0.001(<0.001)
1053 (45.6) 1781 (53.5) 1827 (51.7) 1358 (47.6)
290 (12.6) 454 (13.6) 679 (19.2) 755 (26.4)
BMI
   Underweight
   Healthy weight
   Obesity
39.149
199 (8.6)<0.001130 (3.9)0.00682 (2.3)<0.00176 (2.7)<0.001(<0.001)
1023 (44.3) 1277 (38.3) 1230 (34.8) 920 (32.2)
1088 (47.1) 1923 (57.7) 2221 (62.9) 1859 (65.1)
Family history
   No
   Yes
59.417
1578 (68.3)<0.0011988 (59.7)<0.0012084 (59.0)<0.0011551 (54.3)<0.001(<0.001)
732 (31.7) 1342 (40.3) 1449 (41.0) 1304 (45.7)
Dyslipidemia
   No
   Yes
392.767
2288 (99.0)<0.0013052 (91.7)<0.0012448 (69.3)<0.0011732 (60.7)<0.001(<0.001)
22 (1.0) 278 (8.3) 1085 (30.7) 1123 (39.3)
Table 2. Differences by health behavior of the selected sample.
Variables and Categories19–34 (%)p35–49 (%)p50–64 (%)p≥65 (%)pRao-Scott χ2
(p)
Drinking alcohol
   No drinking
   Once a month
   2–4 times a month
   2–3 times a week
   ≥4 times a week
38.607
758 (32.8)<0.0011207 (36.2)<0.0011641 (46.4)<0.0011594 (55.8)<0.001(<0.001)
372 (16.1) 396 (11.9) 379 (10.7) 253 (8.9)
758 (32.8) 874 (26.2) 726 (20.5) 433 (15.2)
345 (14.9) 639 (19.2) 512 (14.5) 348 (12.2)
77 (3.3) 214 (6.4) 275 (7.8) 227 (8.0)
Smoking (lifetime)
   Never smoked
   Less than 5 packs
   More than 5 packs
35.910
1455 (63.0)<0.0011892 (56.8)<0.0012033 (57.5)<0.0011522 (53.3)<0.001(<0.001)
123 (5.3) 96 (2.9) 51 (1.5) 29 (1.0)
732 (31.7) 1342 (40.3) 1449 (41.0) 1304 (45.7)
Stress perception
   Feel a lot
   Feel a little
   Do not feel
80.621
808 (35.0)<0.0011101 (33.1)<0.001815 (23.1)<0.001446 (15.6)<0.001(<0.001)
1251 (54.2) 1944 (58.4) 2206 (62.4) 1625 (56.9)
251 (10.9) 285 (8.6) 512 (14.5) 784 (27.5)
High-intensity physical activity
   None
   1 h
   More than 2 h
0.058 0.149 0.277 <0.0014.456
2280 (98.7) 3288 (98.7) 3507 (99.3) 2853 (99.9) (<0.001)
24 (1.0) 30 (0.9) 18 (0.5) 1 (0.0)
6 (0.3) 12 (0.4) 8 (0.2) 1 (0.0)
Medium-intensity physical activity
   None
   1 h
   More than 2 h
<0.001 <0.001 <0.001 <0.00110.901
2161 (93.5) 3114 (93.5) 3409 (96.5) 2796 (97.9) (<0.001)
118 (5.1) 158 (4.7) 85 (2.4) 42 (1.5)
31 (1.3) 58 (1.7) 39 (1.1) 17 (0.6)
Walking days
   None
   Less than 5 days
   More than 5 days
<0.001 <0.001 <0.001 <0.00124.055
718 (31.1) 799 (24.0) 993 (28.1) 983 (34.4) (<0.001)
1057 (45.8) 1936 (58.1) 1951 (55.2) 1461 (51.2)
535 (23.2) 595 (17.9) 589 (16.7) 411 (14.4)
Walking duration
   None
   1 h
   More than 2 h
<0.001 <0.001 <0.001 0.00410.715
1485 (64.3) 2137 (64.2) 1999 (56.6) 1723 (60.4) (<0.001)
613 (26.5) 850 (25.5) 1060 (30.0) 761 (26.7)
212 (9.2) 343 (10.3) 474 (13.4) 371 (13.0)
Strength training days
   None
   Less than 3 days
   More than 3 days
<0.001 <0.001 0.207 0.0049.599
0 (0.0) 1 (0.0) 0 (0.0) 5 (0.2) (<0.001)
1815 (78.6) 2865 (86.0) 2910 (82.4) 2280 (79.9)
495 (21.4) 464 (13.9) 623 (17.6) 570 (20.0)
Aerobic exercise
   Non-practiced
   Practiced
<0.001 0.623 <0.001 <0.00169.304
1007 (43.6) 1810 (54.4) 2063 (58.4) 1915 (67.1) (<0.001)
1303 (56.4) 1520 (45.6) 1470 (41.6) 940 (32.9)
Table 3. Differences by eating habit of the selected sample.
Variables and Categories19–34 (%)p35–49 (%)p50–64 (%)p≥65 (%)pRao-Scott χ2
(p)
Breakfast Frequency
   Almost Never
   1–2 times a week
   3–4 times a week
   5–7 times a week
215.485
838 (36.3)<0.001825 (24.8)<0.001436 (12.3)<0.001104 (3.6)<0.001(<0.001)
541 (23.4) 609 (18.3) 288 (8.2) 64 (2.2)
352 (15.2) 440 (13.2) 283 (8.0) 66 (2.3)
579 (25.1) 1456 (43.7) 2526 (71.5) 2621 (91.8)
Lunch Frequency
   Almost Never
   1–2 times a week
   3–4 times a week
   5–7 times a week
7.988
37 (1.6)<0.00161 (1.8)0.05582 (2.3)<0.00190 (3.2)<0.001(<0.001)
66 (2.9) 97 (2.9) 75 (2.1) 50 (1.8)
191 (8.3) 227 (6.8) 149 (4.2) 99 (3.5)
2016 (87.3) 2945 (88.4) 3227 (91.3) 2616 (91.6)
Dinner Frequency
   Almost Never
   1–2 times a week
   3–4 times a week
   5–7 times a week
18.498
21 (0.9)<0.00127 (0.8)0.03625 (0.7)<0.00121 (0.7)<0.001(<0.001)
55 (2.4) 89 (2.7) 65 (1.8) 30 (1.1)
271 (11.7) 293 (8.8) 169 (4.8) 68 (2.4)
1963 (85.0) 2921 (87.7) 3274 (92.7) 2736 (95.8)
Dining out
   Almost never
   1–3 times a month
   1–4 times a week
   5–6 times a week
   More than once a day
162.134
758 (32.8)<0.0011207 (36.2)<0.0011641 (46.4)<0.0011594 (55.8)<0.001(<0.001)
372 (16.1) 396 (11.9) 379 (10.7) 253 (8.9)
758 (32.8) 874 (26.2) 726 (20.5) 433 (15.2)
345 (14.9) 639 (19.2) 512 (14.5) 348 (12.2)
77 (3.3) 214 (6.4) 275 (7.8) 227 (8.0)
Table 4. Logistic regression.
VariablesCoefStd Errzp > |z|[0.025 (CI)0.975] (CI)Odds Ratio
Age0.47320.04510.6290.000 ***0.3860.5601.605178
Gender−0.14000.081−1.7240.085−0.2990.0190.869377
Marital Status−1.99330.188−10.5860.000 ***−2.362−1.6240.136242
Subjective health status0.35940.0497.3760.000 ***0.2640.4551.432420
Drinking alcohol−0.14320.026−5.5880.000 ***−0.193−0.0930.866616
Smoking−0.14780.083−1.7760.076−0.3110.0150.862626
Stress perception0.06870.0521.3110.190−0.0340.1711.071074
BMI0.39000.0596.6470.000 ***0.2750.5051.477005
Family history0.37410.0725.2310.000 ***0.2340.5141.453676
Breakfast frequency−0.13050.034−3.8390.000 ***−0.197−0.0640.877618
Lunch frequency−0.08070.058−1.3920.164−0.1940.0330.922498
Dinner frequency−0.15780.084−1.8740.061−0.3230.0070.853980
Dining out−0.10080.031−3.2950.001 ***−0.161−0.0410.904153
High-intensity activity−0.09340.316−0.2960.767−0.7120.5250.910874
Medium-intensity activity−0.13230.123−1.0710.284−0.3740.1100.876100
Aerobic exercise−0.21390.070−3.0550.002 ***−0.351−0.0770.807455
Strength training days0.01850.0430.4280.668−0.0660.1031.018680
Walking days−0.03460.048−0.7170.473−0.1290.0600.965952
Walking duration0.04060.0470.8660.387−0.0510.1321.041410
CI = confidence interval; * p < 0.05, ** p < 0.01, *** p < 0.001.
Disclaimer/Publisher’s Note: The statements, opinions and data contained in all publications are solely those of the individual author(s) and contributor(s) and not of MDPI and/or the editor(s). MDPI and/or the editor(s) disclaim responsibility for any injury to people or property resulting from any ideas, methods, instructions or products referred to in the content.

