Article

Enrichment of Z-DNA-Forming Sequences Within Super-Enhancers: A Computational and Population-Based Study

1
Prokhorov General Physics Institute of the Russian Academy of Sciences, 38 Vavilov St., 119991 Moscow, Russia
2
Faculty of Computer Science, Higher School of Economics, Myasnitskaya St. 20, 101000 Moscow, Russia
3
Institute for Information Transmission Problems RAS, 127051 Moscow, Russia
*
Authors to whom correspondence should be addressed.
Appl. Sci. 2025, 15(9), 5113; https://doi.org/10.3390/app15095113
Submission received: 25 March 2025 / Revised: 24 April 2025 / Accepted: 28 April 2025 / Published: 4 May 2025
(This article belongs to the Special Issue Research on Computational Biology and Bioinformatics)

Abstract

:
Super-enhancers (SEs) orchestrate high-level transcription by integrating multiple regulatory elements and signals. Although chromatin accessibility and transcription factor binding within SEs are extensively studied, the role of non-canonical DNA structures, particularly Z-DNA, remains underexplored. In this study, genome-wide predictions of Z-DNA-forming sequences (generated by the Z-DNA-BERT model) were applied to systematically investigate their distribution within typical enhancers and SEs across multiple human cancer cell lines. Statistically significant enrichment of Z-DNA sequences within SE regions, compared to random genomic controls, was observed. Furthermore, genetic variants overlapping these Z-DNA regions, identified using data from the 1000 Genomes Project, were found to alter binding motifs of the SP/KLF transcription factor family. These mutations exhibited population-specific clustering and overlapped previously reported pathogenic copy-number variations (CNVs) associated with neurodevelopmental disorders, potentially affecting transcription factor binding motifs related to neuronal growth and differentiation pathways. Population-level phylogenetic analysis revealed distinct clustering patterns of these variants, suggesting frequency-specific genetic architecture. Overall, the computational findings indicate that Z-DNA structures within super-enhancers might play regulatory roles and potentially influence population-specific genetic variation, highlighting specific genomic targets and providing new avenues for future experimental research.

1. Introduction

Super-enhancers (SEs) are large genomic domains composed of multiple enhancer elements that facilitate high levels of gene expression [1,2,3,4,5]. SEs are characterized by dense clusters of transcription factors (TFs), chromatin regulators, such as H3K27ac and BRD4, and coactivator complexes, such as Mediator [4,5,6,7,8,9,10]. They are pivotal in regulating cell identity, lineage commitment, and pathways implicated in various diseases [11,12,13,14,15,16]. For example, in cancer, aberrant SE activity promotes oncogenesis by driving oncogene expression and supporting non-coding RNA transcription [17,18,19,20,21]. Unlike standard enhancers, SEs integrate multiple signals to sustain robust transcription, exhibiting dynamic states—conserved, temporally hierarchical, or de novo—during development and differentiation [22]. Although chromatin accessibility, TF-binding peaks, and histone modifications are central to defining SEs, these markers often show heterogeneous patterns [10,23,24]. Secondary DNA structures may play a role in further stratifying SE function, adding an additional layer of regulatory specificity [25,26,27].
One such secondary DNA structure attracting considerable attention is Z-DNA, a left-handed helical form stabilized by particular sequence motifs and torsional strain that has garnered increasing interest for its potential role in transcriptional regulation [28,29,30,31]. Z-DNA often arises in actively transcribed regions due to negative supercoiling generated by RNA polymerase, with its formation relying on alternating syn- and anti-conformations in guanine and cytosine residues, where CpG dinucleotides adopt a characteristic “Z-step” conformation [30,32]. Although Z-DNA has been associated with transcriptional activation by promoting nucleosome displacement or chromatin opening at promoters, its genome-wide distribution and functional significance in complex regulatory domains such as SEs remain insufficiently explored. It is well-established that Z-DNA can form chromosomal ‘protrusions,’ rendering Z-DNA-containing regions potential scaffolds for transcription factor (TF) binding [33]. Furthermore, the investigation revealed that predicted Z-DNA-forming sequences harbor binding motifs for zinc-finger family transcription factors. Given both the steric accessibility of Z-DNA-bearing regions and the identified TF binding sites, it is proposed that Z-DNA may employ a dual mechanism in transcriptional gene regulation.
Z-DNA likely influences enhancer and super-enhancer activity by recruiting epigenetic modifiers that modulate various histone marks or DNA methylation profiles. Another possible Z-DNA function could be defined through Z-DNA as a structural determinant for long-range interactions through CTCF/cohesin-dependent mechanisms of action. Also, Z-DNA, due to its structural rigidity, may sustain torsional stress and therefore facilitate phase separation during looping and form the basis of essential SE-promotor insulation. Therefore, the suggested roles of Z-DNA may explain the observed enrichment of its structures within the described super-enhancers. It should be noted that future work is needed in order to test these models using epigenomic and 3D genome mapping approaches.
Given that SEs span tens of kilobases and contain numerous high-density TF-binding sites, localized shifts to Z-DNA could plausibly impact chromatin accessibility, TF recruitment, or enhancer-promoter communication. Z-DNA-forming sequences also frequently coincide with promoter sites for the nuclear factor I (NFI) family, reinforcing the idea that these secondary structures have a functional impact on transcriptional dynamics [34]. Moreover, Z-DNA formation has been implicated in oncogene regulation (e.g., c-MYC and ADAM12) and genomic instability, further linking it to the dysregulation observed in cancer [35,36,37,38,39]. In addition to SEs and Z-DNA, various feedback loops can also modulate transcription levels, ultimately influencing cell fate decisions. This interplay suggests that overall gene expression is the product of multiple integrated regulatory layers, including SE activity, non-B DNA conformations, and higher-order chromatin architecture.
Despite growing interest in alternative DNA structures, a significant knowledge gap remains regarding their functional significance within SE regions. Investigating whether Z-DNA formation within SEs affects transcription factor recruitment, enhancer-promoter communication, or chromatin accessibility could provide novel insights into how these powerful regulatory domains achieve their functional output.
In this study, computational analyses were employed based on previously published genome-wide predictions of Z-DNA-forming sequences, obtained using the Z-DNA-BERT model developed by Umerenkov et al. [40], to systematically investigate their distribution within typical enhancers and super-enhancers across multiple human cancer cell lines. The results demonstrate a non-random enrichment pattern, with the strongest association observed in typical enhancers, moderate enrichment within super-enhancer enhancers and spacers, and negligible occurrence in background genomic regions. Using permutation tests, these associations were confirmed to be statistically significant. Furthermore, genetic variants were analyzed from the 1000 Genomes Project [41] and identified mutations overlapping Z-DNA loci within super-enhancers, which alter transcription factor binding motifs. Specifically, motifs were detected linked to the SP/KLF transcription factor family. Notably, these mutations were concentrated within a single super-enhancer locus. Moreover, the identified super-enhancer locus overlaps with known CNVs that have been previously associated with the development of neurodegenerative disorders. Mutations leading to the loss or gain of TFs binding motifs, as well as aberrations in their functional activity, are linked to a similar spectrum of pathologies. This may serve as evidence of a potential connection between the studied mutations and this type of disease. Phylogenetic clustering of individuals carrying these mutations revealed distinct groups separated by deep clades, reflecting population-wide variation and frequency-specific genetic architecture.
Thus, the innovative aspects of this study include the first systematic computational analysis integrating Z-DNA structure prediction within enhancer and super-enhancer domains across multiple cancer cell lines, utilizing the state-of-the-art Z-DNA-BERT predictive model. Additionally, the work uniquely incorporates large-scale population genetic variation data to identify novel mutations within these Z-DNA-enriched regulatory regions. The subsequent functional and evolutionary analysis of these mutations highlights potential new mechanisms linking Z-DNA formation to transcription factor recruitment and disease etiology. Overall, this approach combines computational prediction, population genetics, and evolutionary analysis, providing novel insights into the regulatory roles of non-canonical DNA structures within super-enhancers.

2. Materials and Methods

2.1. Annotation of Enhancer Elements in Cell Lines

Enhancer and super-enhancer coordinates for six cell lines (HeLa, HCT116, MDA-MB-231, MCF7, BT-549, and LNCap) were obtained from the SEdb 2.0 database [42]. Super-enhancer enhancers (SE-E) were defined as enhancers located within super-enhancers. Super-enhancer spacers (SE-S) corresponded to inter-enhancer intervals within SEs. Typical enhancers were defined as non-super-enhancer enhancers in the filtered dataset. Background (BG) regions consisted of 268-base-pair genomic segments (matching the median length of TE) devoid of known functional elements (ENCODE v4) and equal in number to the TE records.

2.2. Z-DNA Prediction

Predicted Z-DNA coordinates were obtained from the study by Umerenkov et al. [40], coordinates were generated by the Z-DNA-BERT model. The model itself and the published generated data are available at https://github.com/mitiau/Z-DNABERT (accessed on 16 April 2025) [43]. We used these published Z-DNA predictions for the human hg38 assembly and intersected them with SE-E, SE-S, TE, and background coordinates using BEDtools [44] intersect with the -u flag. To visualize the genomic distribution of Z-DNA predictions across SE-E, SE-S, TE, and background, each chromosome (hg38) was divided into equal-sized bins. The number of overlapping intervals in each bin was calculated, transformed using log1p, and plotted in heatmaps. This allowed qualitative assessment of the relative density of Z-DNA-forming sequences among different enhancer categories and background regions.

2.3. Permutation Test for Z-DNA Overlap Analysis

Random genomic coordinates were generated for each of the 22 human chromosomes based on the hg38 assembly. For each chromosome, 1000 sets of random coordinates were produced using a uniform distribution, with telomeric and centromeric regions excluded from the sampling. These random sets were generated to match the length distribution of predicted Z-DNA regions (minimum length ≥ 10 bp). Predicted Z-DNA regions were derived from prior computational analysis using the Z-DNA-BERT model. Enhancer coordinates were obtained from the SEdb 2.0 database for six solid tumor cell lines (HeLa, HCT116, MDA-MB-231, MCF7, BT-549, and LNCap). Three categories of enhancer elements were analyzed: SE, SE-E, and TE. For each chromosome and cell line, the predicted Z-DNA coordinates were intersected with the enhancer coordinates as well as with each of the 1000 sets of random coordinates. A p-value was computed as the fraction of iterations in which the number of overlaps between random Z-DNA coordinates and enhancer coordinates equaled or exceeded the observed number of overlaps using the actual predicted Z-DNA regions. These p-values were then used to assess the enrichment of Z-DNA predictions within each enhancer category.

2.4. Mapping and Quantification of Mutations in Z-DNA-Associated Enhancer Regions

Enhancer and super-enhancer annotations utilized for this analysis were obtained from ENCODE and SEA databases, specifically for monocytes. Predicted Z-DNA coordinates were identical to those described in Section 2.2. For this study, we analyzed data from 100 individuals obtained from the 1000 Genomes Project; data for these individuals are provided in Table S1 in the Supplementary Materials. All data are publicly available and were obtained from open-access sources, in accordance with the disclaimer provided on the project [41]. Variants from VCF files corresponding to the selected individuals were mapped onto enhancer and super-enhancer regions intersected by predicted Z-DNA loci (SE-E, SE-S, TE), as well as onto background regions. Mutation concentrations were calculated individually for each individual and each genomic region by normalizing the number of mutations by the length of the respective region. For comparative analyses, regions within the upper quartile (top 25%) of mutation density for each category (SE-E, SE-S, TE, and BG) were selected. Statistical comparisons of mutation frequencies among these region types were performed using the Mann–Whitney test.
For allele frequency analysis and initial characterization of Z-DNA-enriched SEs, genomic data from 100 individuals of European ancestry were used to provide consistency in population-specific allele frequencies. This cohort represents a foundational dataset for variant analysis within Z-DNA-enriched SEs loci. For future analyses, expanded population diversity is needed to assess the generalizability of Z-DNA-SE regulatory dynamics across ancestries.

2.5. Motif Analysis of Mutations in Z-DNA-Associated Enhancer Regions

Single-nucleotide polymorphisms (SNPs) and insertion-deletion variants (indels) were annotated using snpEff [45], referencing dbSNP [46] (build version hg38) and ClinVar [47] databases to retrieve known clinical associations and variant metadata. Clinically significant mutations were filtered based on specific clinical significance categories, including ‘Likely risk allele’, ‘Pathogenic’, ‘Pathogenic/Likely pathogenic’, ‘Pathogenic/Likely risk allele risk factor’, ‘risk factor’, and ‘drug response’, as annotated in the clinical significance field. Both clinically significant and novel mutations were retained only if their genomic coordinates overlapped predicted Z-DNA-forming sequences.
Subsequent analysis prioritized unknown mutations due to the absence of known pathogenic variants within Z-DNA-forming regions. These mutations were categorized into SNPs, long insertions (>10 bp), short insertions (≤10 bp), long deletions (>10 bp), and short deletions (≤10 bp). Inherited mutations were prioritized by selecting sequences where mutations were detected in at least 10% of the analyzed genomes to reduce the likelihood of including somatic mutations or sequencing artifacts.
For each selected mutation, nucleotide sequences were generated from the human reference genome (hg38 assembly), encompassing the mutation site and extending 100 nucleotides upstream and downstream. These sequences served as input for motif prediction analyses using HOMER2 (findMotifs.pl) [48]. Motif presence was evaluated separately for mutation-containing sequences and reference sequences from the corresponding genomic regions in the hg38 assembly. For the analysis, only known motifs with a p-value < 0,01 were considered.
To identify transcription factor (TF) interactions for the detected motifs, a motif similarity search was conducted using MEME Tomtom [49] with an e-value cutoff of 0.01. Subsequently, motifs identified in mutated sequences were mapped onto the reference genome using MEME Fimo [50] to determine whether mutations led to motif gain or loss. Fimo was executed with a p-value threshold of 0.0001. Conversely, reference motifs were also mapped to the mutated sequences to identify motifs disrupted by mutations.

2.6. Tree-Based Clusterization of Individuals Based on Novel Mutations in SE-Z-DNA Loci

Clusterization of individuals was performed on novel mutations within single SE-Z-DNA loci. To generate sequences for multiple sequence alignment and further clusterization, reference and alternative alleles were merged across each individual without remaining genomic context in order to perform specific clustering for the selected variants. Analyzed individuals possessed at least one out of five mutations associated with known pathogenic variants at specific genomic positions. The proposed CAFS metric is to quantify allele frequency within Z-DNA-forming regions of SEs for these datasets. Obtained CAFS values were used for phylogenetic clustering to reveal evolutionary conservation within the dataset of 100 selected individuals in comparison with population-level data. Namely, Spearman correlation between CAFS values revealed consistency of mutation patterns, while variable loci were interpreted as loci under differential selection. The merged sequences were aligned using the MUSCLE algorithm (v5.1) implemented within the MEGA software (v11.0).
For tree-based clusterization, we employed the maximum likelihood algorithm with 500 bootstrap replicates for the robust phylogenetic clusterization. Each individual and corresponding sequence were annotated with cohort-specific frequencies and populational frequencies. Population frequencies were obtained from the gnomAD database (v4.0), with the focus on non-Finnish European allele frequencies, and were further cross-referenced with pathogenic annotations from the ClinVar database to assess associations with known pathologies.

2.7. Infrastructure and Software

All computational analyses were performed using virtual machines and storage services provided by Yandex Cloud. This study employed standard Python 3 libraries, including pandas, numpy, matplotlib.pyplot, tqdm, seaborn, IntervalTree, and stats. All scripts used in the computational analysis, including documentation, input/output file formats, dependencies, and usage instructions, are available at https://github.com/ymakus/Z_DNA_within_SEs (accessed on 24 April 2025).

3. Results and Discussion

3.1. Analysis of Z-DNA Distribution Across Enhancer Elements

The first stage of this study focused on examining the intersection between predicted Z-DNA-forming sequences and different classes of enhancer elements. Z-DNA loci were identified using the Z-DNA-BERT model, a neural network architecture specifically optimized for Z-DNA prediction, as described by Umerenkov et al. [40]. This model, trained with sequence-optimized parameters, demonstrated superior predictive performance compared to alternative machine learning approaches. The predicted Z-DNA coordinates, derived from the human genome assembly hg38, were intersected with datasets representing typical enhancers, super-enhancer enhancers, super-enhancer spacers, and background regions. To ensure balanced comparisons, background regions were defined as genomic segments without regulatory elements, matching the length distribution of typical enhancers (see details in Section 2.1 of Materials and Methods). In this part of the study, analyses were conducted for six cell lines: HeLa, HCT116, MDA-MB-231, MCF7, BT-549, and LNCap.
Given the known association of Z-DNA with chromatin activity regulation and its role in epigenetic regulation processes, such as modulating chromatin accessibility through the recruitment of chromatin-remodeling proteins [31], the goal was to explore its potential functional relevance in the genome. To this end, the investigation began by examining the co-occurrence patterns of Z-DNA with functional genomic regions, including super-enhancers, enhancers within super-enhancers, and typical enhancers.
To visualize the distribution patterns of Z-DNA across different enhancer classes, heat maps were generated, capturing the density of intersections across chromosomal regions (Figure 1). For illustration, Figure 1 presents the heat maps corresponding to the HCT116 cell line; similar distribution patterns were observed in the other cell lines, with detailed results provided in Figure S1 in the Supplementary Materials. Notably, Figure 1 reveals that at the proximal ends of chromosomes 13, 14, 15, 21, and 22, there is a visibly lower distribution of Z-DNA-forming sequences. This can be explained by the acrocentric nature of these chromosomes, which are known to exhibit a reduced density of enhancer elements in these regions. The heat maps revealed a marked decrease in signal intensity for background regions, suggesting a lower prevalence of Z-DNA-forming sequences in non-regulatory genomic segments. This aligns with previous reports indicating that non-canonical DNA structures constitute approximately 13% of the human genome [51], with around 0.8% specifically attributed to Z-DNA [31].
Importantly, previous studies employing knock-in and CRISPR interference (CRISPRi) strategies have shown that targeted disruption of Z-DNA-forming regions within enhancer elements leads to a measurable reduction in enhancer activity and chromatin accessibility, predominantly through compromised transcription factor recruitment and disruption of chromatin phase-separation dynamics [9,52,53]. Consistent with these observations, our computational identification of enriched Z-DNA sequences within super-enhancers highlights their potential functional relevance, providing robust genomic targets for future experimental validation. Subsequent experimental work using targeted CRISPR-based perturbations at these Z-DNA loci will be essential to conclusively elucidate their precise regulatory contributions.
The observed 93-fold reduction in background regions (Table S2) suggests that these overlaps are likely due to random occurrences. Specifically, typical enhancers (TE) showed a moderate reduction (mean fold-change across six cell lines = 2.79 ± 0.38) and enhancers within super-enhancers (SE-E) demonstrated a similar moderate reduction (mean = 3.72 ± 1.05), whereas super-enhancer regions (SE) exhibited only slight reductions (mean = 1.13 ± 0.04) (Table S2). Thus, the enhancer-related elements (TE, SE, and SE-E) did not exhibit such a dramatic drop, indicating a structured, non-random pattern of Z-DNA localization. To formally assess whether this enrichment is statistically significant and not due to chance, permutation tests were then applied.

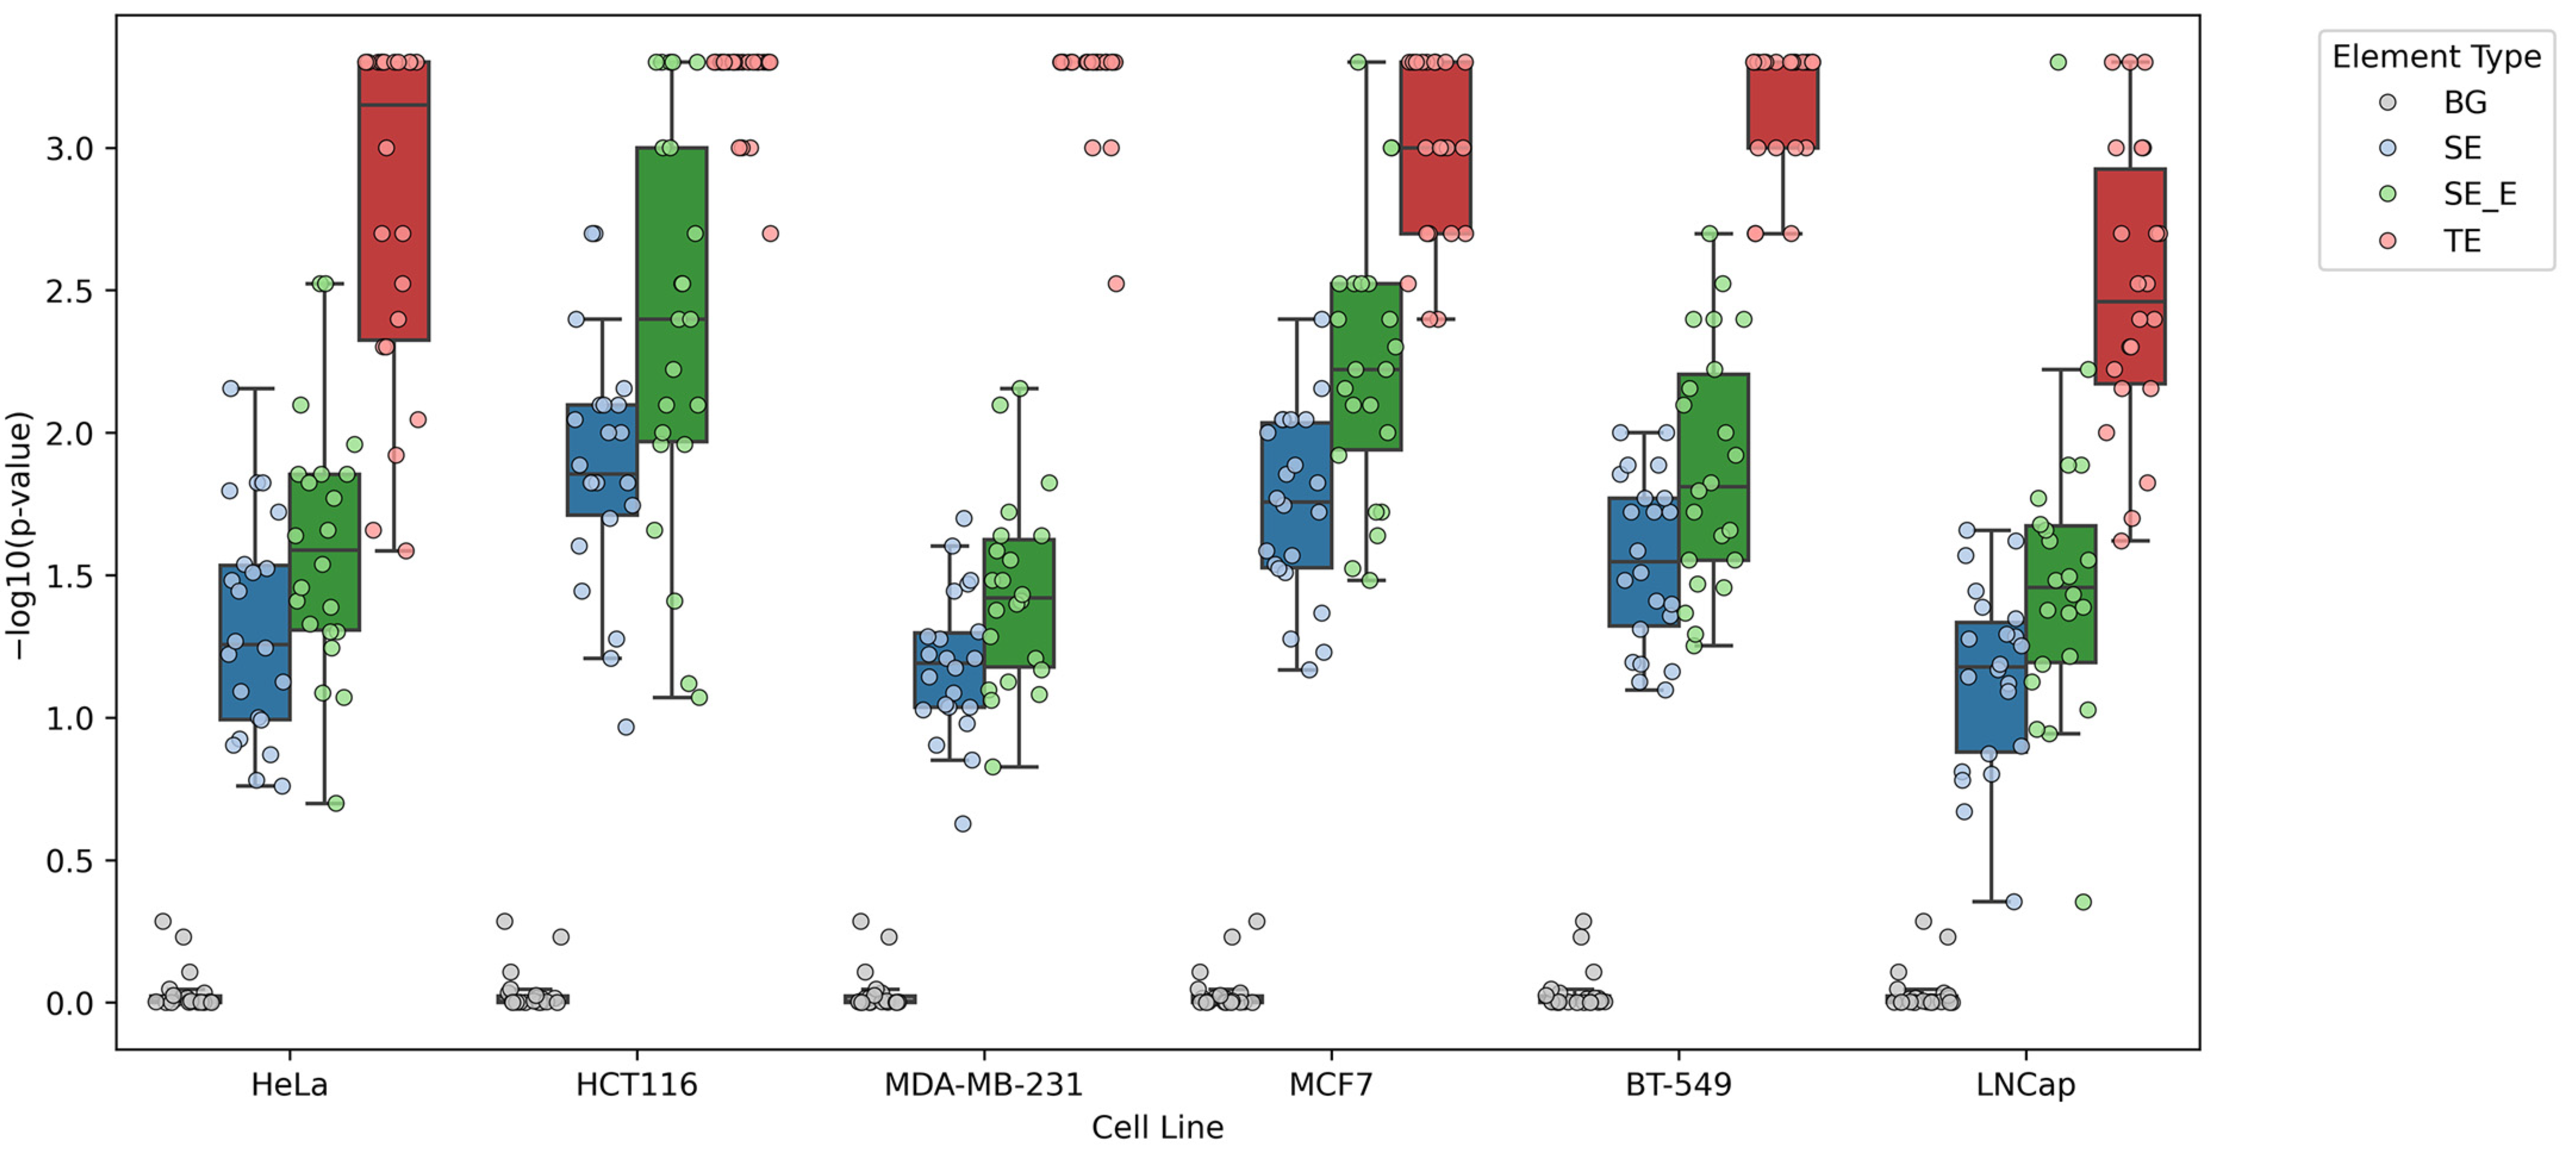
3.2. Permutation Test and Analysis of Z-DNA Overlap with Enhancer Elements

To evaluate the statistical significance of overlaps between predicted Z-DNA regions and enhancer-related elements (TE, SE, and SE-E) in six cell lines, permutation tests were conducted as described in Section 2.3 of the Materials and Methods. We compared the actual overlaps between Z-DNA sequences and enhancer annotations against overlaps expected by random genomic distribution. Specifically, predicted Z-DNA regions were intersected with SE-E, TE, SE, and background regions, and their overlap frequencies were evaluated against intersections obtained using 1000 randomly generated genomic coordinate sets, matched by length and excluding centromeric and telomeric regions (see details in Materials and Methods, Section 2.3).
Figure 2 presents the results of the permutation test. This test was based on calculating match scores between Z-DNA coordinates and regulatory elements for both their actual predictions and randomly generated ones. Lower p-values indicate a lower probability of the coordinate overlaps occurring by chance. Background regions consistently demonstrated high p-values (median = 0.994, interquartile range: 0.950–0.998), indicating that intersections within these genomic segments occur predominantly due to random chance. In contrast, super-enhancer enhancers and typical enhancers showed significantly lower median p-values (SE-E median range: 0.006–0.035; TE median range: 0.0006–0.0035), clearly signifying a statistically significant enrichment of Z-DNA loci in these regulatory elements. Notably, super-enhancer regions, despite containing spacer elements characterized by lower regulatory activity, also exhibited substantial enrichment (median p-value range: 0.014–0.066), markedly distinct from the background.
These robust statistical differences suggest that the observed intersection between Z-DNA regions and enhancer elements is likely not coincidental and indicates a potential functional relationship. It is known that Z-DNA serves as a crucial tool in the regulation of gene transcription. Studies have shown that conserved Z-DNA flipons in promoter regions of humans and mice are associated with increased transcription reinitiation rates, indicating higher levels of mRNA synthesis in such genes. Additionally, these regions exhibit an enrichment of transcription factors and histone marks of active chromatin [31]. This observation is further supported by the elevated occurrence of Z-DNA motifs in the promoters of birds with shortened ontogenetic periods. Genes with such promoters are involved in key regulatory pathways related to growth and development [54]. Enhancers and super-enhancers are functionally similar to promoters, as all these sequences act as cis-regulatory elements. It has been demonstrated that both enhancers and promoters exhibit a significantly increased presence of Z-DNA-forming regions—by 3- and 6.7-fold, respectively—suggesting a regulatory role for Z-DNA [40]. Thus, the permutation test conducted here corroborates previous findings on the enrichment of Z-DNA motifs in cis-regulatory elements. Given the established role of Z-DNA in promoters and enhancers, we hypothesize that super-enhancers with a higher density of Z-DNA-forming sequences may also be associated with more intense transcription of their target genes. Furthermore, the previously described ability of Z-DNA to maintain a transcriptionally active state in promoters due to its structural properties may also apply to super-enhancers. That is, in super-enhancers, Z-DNA could serve both as a transcription factor (TF)-binding element and as a structural component. To further dissect the significance of these intersections, we next investigate mutation accumulation patterns within these overlapping regions using population-scale data.

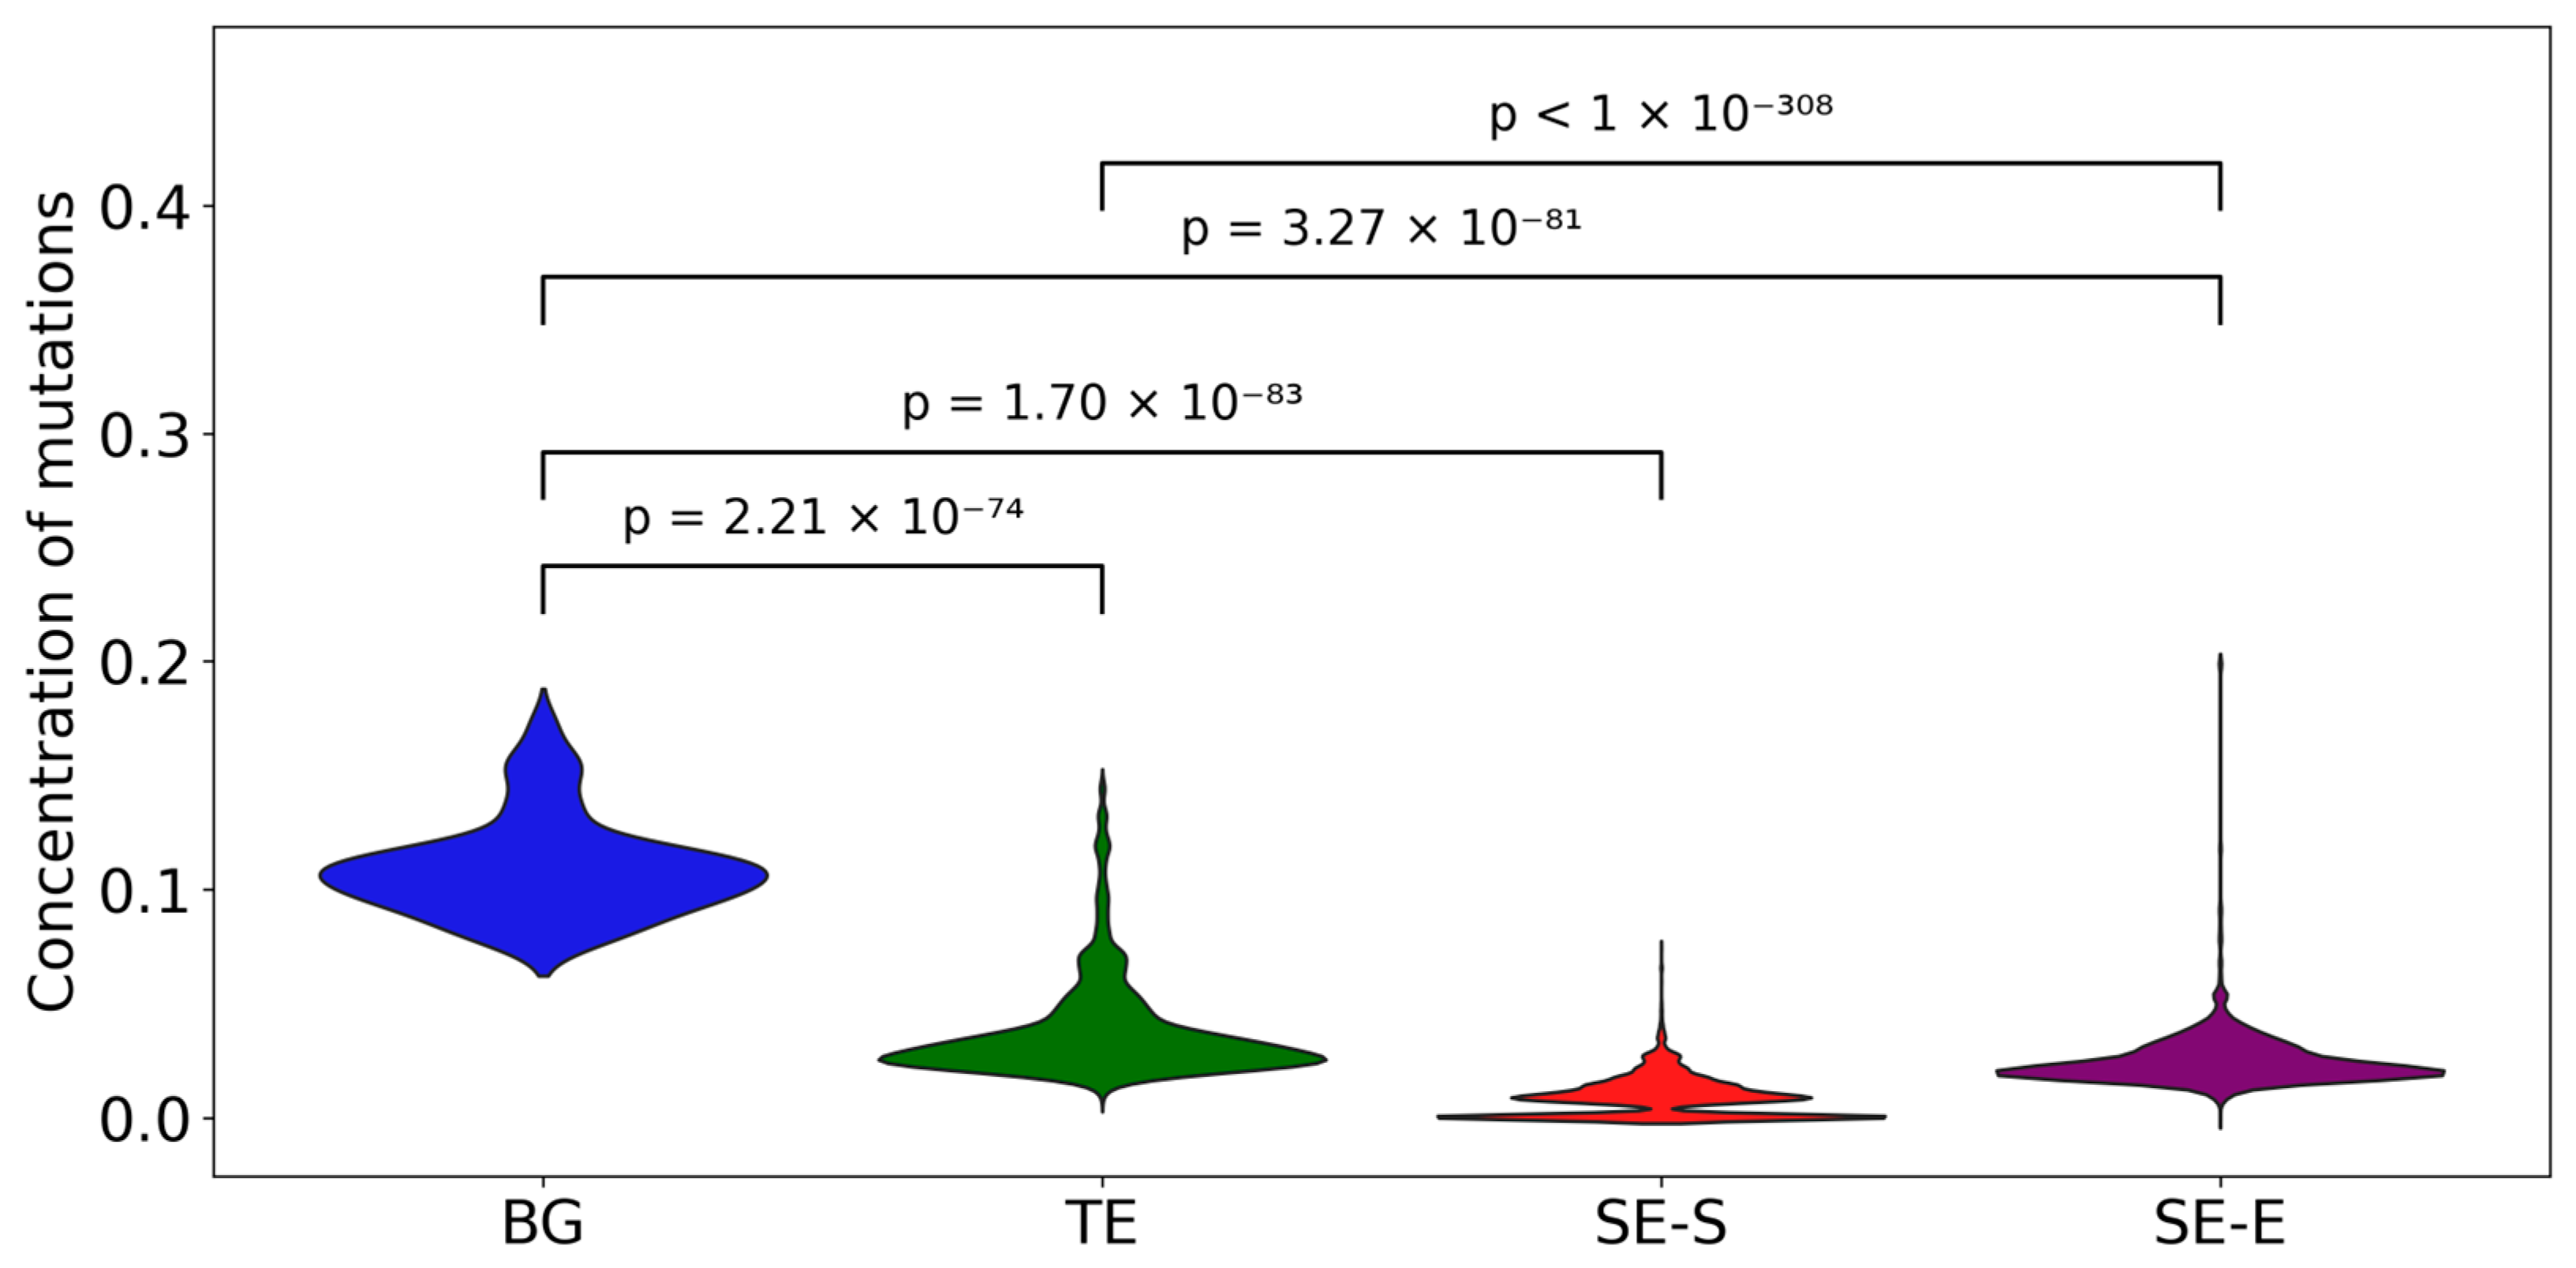
3.3. Mutation Accumulation Analysis in Z-DNA-Intersected Enhancer Elements

Given the significant enrichment of Z-DNA regions within enhancer elements, the potential functional significance of these intersections was explored by examining mutation accumulation patterns. For this purpose, we mapped mutations from 100 individuals of European ancestry (1000 Genomes Project) onto enhancer regions intersected by predicted Z-DNA loci (SE-E, SE-S, TE) and compared their mutation distributions to those observed in background regions (see details in Section 3.4 of the Materials and Methods). To evaluate mutation densities, we calculated the number of mutations per individual in each region and normalized these values by region length. Due to the sparse nature of mutation data across all regions, a direct comparison proved challenging. To facilitate meaningful comparisons, we focused on regions with the highest mutation frequencies, specifically selecting the top quartile (top 25%) of regions from each category (SE-E, SE-S, TE, and BG).
Comparative analysis of these mutation-enriched regions revealed clear differences (Figure 3). According to the Mann–Whitney test, all four distributions differed significantly from each other (pairwise p-values did not exceed 10−73). In terms of median mutation concentrations (mutations per unit region length), BG regions were the most variable, with a median of 0.108. TE and SE-E regions exhibited similar mutation frequencies with medians of 0.031 and 0.022, respectively, indicating comparable levels of evolutionary constraint. Visually, their distributions appear most similar among those examined. Notably, SE-S regions displayed the lowest mutation frequencies (median = 0.009), suggesting that they are the most conserved. Moreover, the mutation frequency distribution in SE-S exhibited a pronounced bimodal pattern, which may suggest the presence of both protein-coding segments, which are under stringent evolutionary conservation, and non-coding spacer sequences.

3.4. Analysis of Mutation-Associated Motifs in Z-DNA-Intersected Enhancer Elements

The next stage of our investigation into the mutations identified within the loci of functional regions and Z-DNA-forming sequences involved annotating their clinical significance using snpEff, based on data from the dbSNP and ClinVar databases. Our primary focus was on pathogenic and unknown mutations. It was found that all known pathogenic mutations (the list of keywords is provided in Section 2.5 of the Materials and Methods) were located within TEs. Consequently, further analysis focused on unknown mutations located within SEs. We categorized the dataset containing unknown mutations into five subsets, classifying them as follows: SNPs, long insertions, short insertions, long deletions, and short deletions. Since our primary interest lay in inherited mutations, we focused on identifying motifs in sequences where mutations were present in at least 10% of the analyzed genomes. This filtering step allowed us to exclude potential somatic mutations and artifacts arising from sequencing data processing. The data table was structured to include mutation occurrences, with unique identifiers summarized in columns. To assess the conservation of mutation loci, we predicted transcription factor binding motifs. First, nucleotide sequences were generated for each mutation. These sequences were defined by the mutation itself, as well as by 100-nucleotide flanks from the start and end of the mutation region, according to the coordinates in the hg38 genome. The corresponding region from hg38 was used as the reference sequence. Subsequently, for both the mutation-containing sequences and their corresponding reference sequences, transcription factor binding motifs were predicted using HOMER2.
Thus, we obtained sets of motifs identified in the reference sequences and in the sequences generated at the positions of the studied mutations. To understand the functional implications of these motifs and their alterations, it is essential to analyze how they influence transcriptional regulation and potentially other cellular processes. Changes in motifs can influence the binding affinity of transcription factors. Binding motifs of transcription factors are mainly located in gene promoters and enhancers. Additionally, these motifs exhibit additive properties. Consequently, alterations in the number of TF binding motifs can directly impact the efficiency of gene expression [55]. To determine whether a mutation leads to the gain or loss of a specific motif at its locus, we mapped the motifs generated from the mutated sequences onto the reference genome using MEME FIMO. Similarly, we scanned the mutated sequences for occurrences of motifs derived from the reference sequences. Four distinct motifs emerged within the super-enhancer region on chromosome 10, with three motifs identified in spacer elements (motif 1: RGKGGGCGKGGC, motif 2: GGGGGTGTGTCC, motif 4: GCCACRCCCACY) and one motif located within the active enhancer itself (motif 3: DGGGYGKGGC) (Figure 4). Notably, motifs 1, 2, and 4 were found in the spacer region of the super-enhancer, while motif 3 was located within the enhancer region itself. This super-enhancer region is characterized by low sequence complexity, predominantly consisting of (GT) n repeats (Match Percentage: 67%). Within the spacer, a tandem repeat sequence, (GT)9G3(TG)2TATCT(GT)3G5CACGTGTATG(T)3(G)3T, was also identified (Match Percentage: 80%) [56]. Tandem repeats are characterized by an increased rate of mutagenesis, as well as elevated frequencies of aberrant recombinations and structural rearrangements [57]. Thus, the localization of mutations in low-complexity regions and tandem repeats may be associated with the underlying mechanisms of their occurrence.
The identified motifs, due to their localization, exhibit certain similarities. To determine which transcription factors they interact with, a search was performed for each motif using MEME Tomtom. It was found that all the presented motifs demonstrate statistically significant binding to the following TFs: KLF4, KLF9, KLF11, KLF16, SP3, SP8, and SP9. KLF and SP (Krüppel-like factor and specificity protein) transcription factors play critical roles in processes such as cell proliferation and differentiation, embryogenesis, and other physiological processes, the dysregulation of which can lead to the development of various pathologies [58]. These TFs belong to the same family, with the only distinction being the presence of a Buttonhead box domain in SPs [59]. Of particular interest are the associations of certain KLFs/SPs with the development of neurodevelopmental disorders and cognitive impairments. For instance, KLF9 plays an essential role in adult hippocampal neurogenesis. Dysregulation of KLF9 expression in dentate granule neurons is associated with delayed cell maturation, impaired neuronal differentiation, and reduced neurogenesis-dependent synaptic plasticity [60]. KLFs are also capable of regulating axonal growth. KLF4 acts as an inhibitor of axonal growth in the central nervous system. In experiments with modified neurons, it was demonstrated that KLF15, KLF9, KLF16, KLF14, KLF13, KLF5, KLF4, KLF2, and KLF1 decreased neurite length, whereas KLF7 and KLF6 increased it [61]. Overexpression of KLF4 in neural stem cells led to the development of hydrocephalus and astrocytosis in mice and suppressed the renewal of these cells [62]. It is important to note that in the studied SE region (within the spacer chr10:119394453–119394936 and the enhancer chr10:119394156–119394453), a significant number of transcription factor binding sites are predicted. As a result, unequivocally assessing the contribution of the appearance or disappearance of one or several motifs presents a non-trivial challenge, which requires further in-depth investigation.
Among the mutations leading to the formation or disappearance of these motifs, a single nucleotide polymorphism, a short insertion, and three long deletions were identified. As mentioned earlier, these mutations were previously unknown; however, they overlap with regions exhibiting altered copy number variants (CNVs). The CNVs in the region of the studied super-enhancer were classified as pathogenic based on findings from a project investigating the associations between rare CNVs and developmental disorders [63]. Analysis of the impact of these mutations on the functions of nearby genes revealed that all the studied unknown mutations are located within the intronic region of the GRK5 gene. RGS10 is the nearest active gene to the investigated SE and is considered its potential target. Functional annotation of these genes using DAVID demonstrated that both genes are involved in signaling pathways such as the G protein-coupled receptor (GPCR) signaling pathway and GPCR downstream signaling [64].
To further evaluate the clinical significance of the mutations identified within SE-Z-DNA loci, their positions were compared with clinically annotated variants from public databases, including the GWAS Catalog and ClinVar. Several notable overlaps were identified (Table S3), particularly involving loci associated with neurodevelopmental and neurodegenerative disorders. For instance, mutations detected in the super-enhancer region on chromosome 10 (positions 119394275, 119394519, 119394520, 119394546, and 119394789) overlapped with known or likely pathogenic variants associated with conditions such as intellectual disability, autism spectrum disorders, macrocephaly, and various cancers.

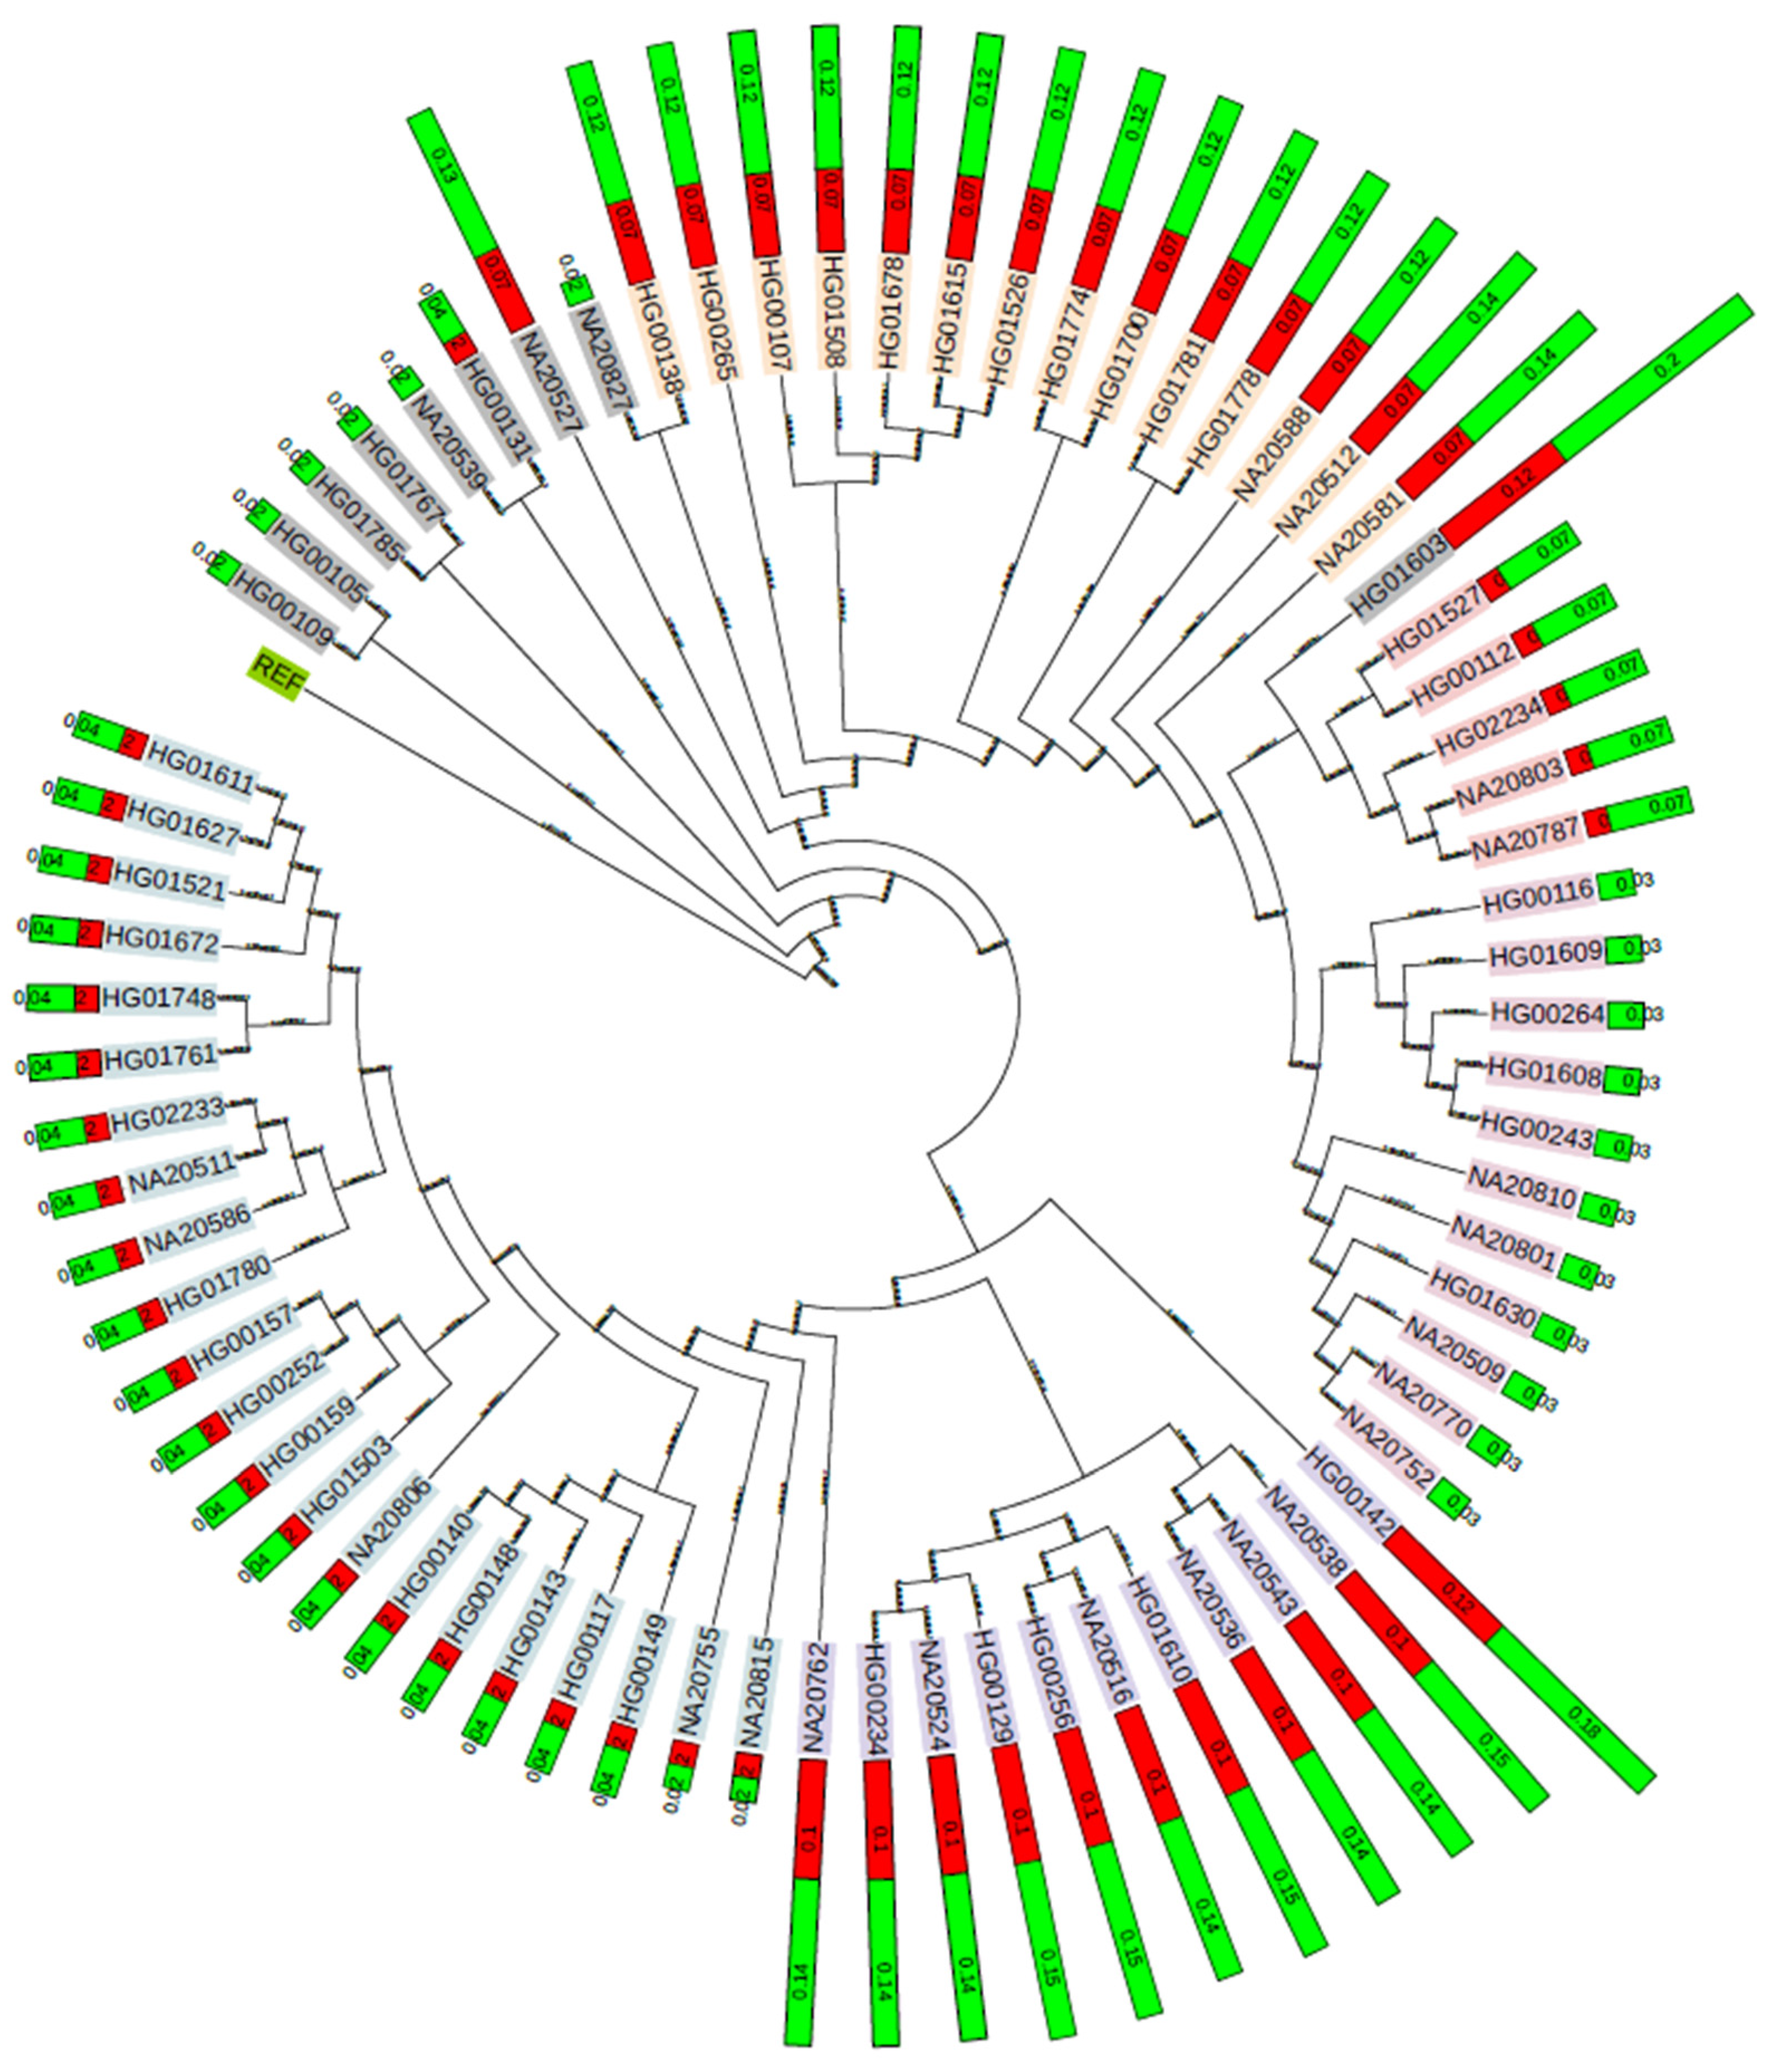
3.5. Phylogenetic Clustering and Population-Level Analysis of Novel Mutations in SE-Z-DNA Loci

To assess the representativeness of our mutation set, we compared the frequencies of similar mutations in population-scale datasets and performed phylogenetic clustering of individuals with novel mutations in Z-DNA-associated super-enhancer loci (see details in Section 2.6 of Materials and Methods).
As individuals possess mutations at various sites, and mutation scores for each position are calculated independently (see Table S4 in the Supplementary Materials for detailed per-individual information, including mutation status, reference and alternative alleles, affected motifs, transcription factor binding changes, and intersections with pathogenic variants), the use of the Cumulative Allele Frequency Score (CAFS) is proposed. CAFS is a derived metric that represents the average allele frequency across multiple unrelated mutations for a given individual. This score is calculated by averaging the values for allele frequency in both the population’s and the cohort of 100 individuals’ variant frequency data. The purpose of this approach is to provide a cumulative evaluation of allele frequencies across individuals in order to reflect the landscape of selected genetic variations within the studied cohort in comparison with populational data. Taking into account that mutations considered for each individual are unrelated, meaning they occur at different genomic positions and may have distinct biological implications averaging of frequencies gives a generalized measure of overall allele frequency profile which allows for comparisons across individuals.
For each individual, the CAFS is calculated as follows:
C A F S P = i = 1 n F r e q u e n c y i n ,
where CAFSP is the cohort allele frequency score for individual P, n is the number of mutations for individual P, and Frequencyi is either the populational or cohort of 100 allele frequency value for mutation i.
The obtained tree revealed distinct groups separated by deep clades, reflecting divergent trajectories within analyzed sequences (Figure 5). The CAFSs of novel mutations, as well as those intersecting with known pathogenic variants, revealed a consistent distribution pattern across all individuals, suggesting a shared evolutionary mechanism for the studied loci. The Spearman correlation coefficient of 0.95 between the CAFSs across clades reflects a strong similarity in mutation rates and suggests that the mutation frequencies are consistent and predictable within the European population. Revealed consistency enables the approximation of mutation frequencies of cohort and their potential functional significance in the European population. The showed branching patterns were significantly influenced by specific mutations, which served as key markers for cluster formation.
Overall, we successfully clustered over 90% of the analyzed fragments. Six clusters were identified, each comprising regions with specific and closely related mutation patterns. The majority of genomes were grouped into clusters 1, 3, and 5, which included 23, 11, and 14 genomes, respectively (Table 1). In these clusters, no more than 1 mutation out of the 5 studied positions was observed, with the exception of genomes NA20512 and NA20581, whose inclusion in cluster 5 remains debatable. Clusters 2, 4, and 6, comprising 11, 5, and 7 genome fragments, respectively, were characterized by the presence of 1–3 alternative alleles at the loci of interest. The genome fragment with ID HG01603 was the most distinct from the others, exhibiting alternative alleles at all studied positions except for chr10:119394546. Among all clusters, the most variable region was the locus chr10:119394275, where an alternative allele was observed in 38% of the genomes. In these genomes, a long deletion at this locus resulted in the formation of new transcription factor binding motifs: RGKGGGCGKGGC, GGGGGTGTGTCC, and DGGGYGKGGC. The most conserved locus was chr10:119394546, where an alternative allele was observed in only 15% of the genomes. A short insertion at this locus led to the formation of a new motif, GGGGGTGTGTCC. The clustering analysis allowed to suggest potential functional relevance of the novel mutations basing on co-segregation with known pathogenic variants retrieved from ClinVar database, suggesting potential roles in multiallelic neurodegenerative diseases or associated with neurodevelopmental diseases etiology or regulatory mechanisms. Further experimental validation is required to confirm the mechanistic impact of these variants on transcriptional regulation and disease pathogenesis.
Therefore, tree structure, combined with allele frequency and calculated CAFs for gnomAD, considers population-wide variations with corresponding functional impact. The clustering of individuals into distinct clades supports the idea of frequency-specific genetic architecture across the whole non-Finnish European population.
These findings highlight specific genomic loci enriched for Z-DNA and associated regulatory mutations that represent promising targets for future experimental studies. Specifically, these regions could be investigated using CRISPR-based functional assays or chromatin conformation capture techniques to elucidate how modulating Z-DNA formation affects transcription factor binding, chromatin accessibility, and downstream transcriptional networks implicated in disease pathology. While the mechanism of Z-DNA co-regulation within super-enhancers remains incompletely understood, its potential applications may primarily lie in the diagnosis of complex diseases, including cancer and autoimmune disorders. Z-DNA in super-enhancer regions could serve as a potential biomarker, indicating elevated expression levels of the target genes within these loci. However, further experimental validation is required to substantiate this hypothesis.
Although direct evidence remains limited, the ability of super-enhancers to adopt Z-DNA flipons may serve as a potential biomarker for identifying active regulatory regions, particularly in super-enhancers associated with genes governing cell cycle progression, apoptosis, or key signaling pathways (e.g., JAK/STAT, NF-κB, MAPK/ERK, PI3K/AKT/mTOR, Wnt/β-catenin). The stable formation of Z-DNA within such super-enhancers could be linked to the hyperactivation of oncogenic programs, promoting uncontrolled proliferation, suppression of apoptosis, therapy resistance, epithelial-to-mesenchymal transition (EMT), and ultimately, cancer progression.
While this study provides robust computational evidence supporting the enrichment and potential functional relevance of Z-DNA-forming sequences within enhancer and super-enhancer regions, it is acknowledged that the presented findings are primarily based on computational predictions. Experimental validation, such as targeted functional assays or CRISPR-based genome editing, would further elucidate the mechanistic roles of these predicted Z-DNA loci in transcriptional regulation, enhancer-promoter interactions, and chromatin dynamics. These experiments represent important next steps to build upon and extend the insights generated by our computational analyses.

4. Conclusions

In conclusion, an integrative computational and population-based bioinformatics approach was applied to systematically investigate the genome-wide distribution of Z-DNA-forming sequences within typical enhancers and super-enhancers. The findings highlight the significant non-random enrichment of Z-DNA-forming sequences within enhancer elements, particularly typical enhancers and super-enhancers, underscoring their potential functional roles in chromatin dynamics and transcription regulation. The identified mutations at these loci, notably concentrated within regions enriched for transcription factor binding motifs linked to the SP/KLF family, reveal possibly functional consequences relevant to gene regulation and human genetic variation. In particular, the clustering of novel variants in a single super-enhancer locus and their association with known pathogenic copy number variants emphasize the potential clinical relevance of these regions. Super-enhancers are known to regulate genes important during embryogenesis, ontogenesis, and disease development [3,65,66], likely via aforementioned mechanisms based on torsional stress–enhanced TF binding and phase separation. Revealed SP and KLF motifs, along with pathogenic variant overlaps, support the theory of narrow functional specialization of Z-DNA-enriched SE loci. In order to disclose this very intriguing question and fulfill scientific knowledge, future works should be conducted with the aim of dissecting these roles across various cell types using perturbation assays. These computational insights enhance our understanding of how Z-DNA might influence transcriptional regulation and genetic diversity, providing a robust foundation for subsequent experimental and clinical investigations. Future investigations could extend these analyses to larger population datasets, integrating CRISPR-based functional assays and high-resolution chromatin conformation techniques to confirm how non-B DNA conformations, such as Z-DNA, influence transcriptional output and contribute to disease etiologies.

Supplementary Materials

The following supporting information can be downloaded at: https://www.mdpi.com/article/10.3390/app15095113/s1. Table S1: Download Links for 100 individuals from the 1000 Genomes Project used in the study; Table S2: Fold-Change in Z-DNA Enrichment Across Enhancer Categories and Background Regions Across Cell Lines; Table S3: Disease-Associated Variants Identified Within Z-DNA-Forming Super-Enhancer Regions; Table S4: Per-individual information on mutation status, reference and alternative alleles, affected motifs, transcription factor binding changes, and intersections with pathogenic variants; Figure S1: Heat maps of Z-DNA distribution across enhancer elements in five cancer cell lines (HeLa, MDA-MB-231, MCF7, BT-549, LNCap).

Author Contributions

Conceptualization, Y.V.M., G.A.A., A.V.O. and N.N.O.; Data curation, Y.V.M., G.A.A., A.V.O., P.I.N., Z.G.Z. and N.N.O.; Formal analysis, Y.V.M., G.A.A., A.V.O., P.I.N., Z.G.Z. and N.N.O.; Funding acquisition, N.N.O.; Investigation, Y.V.M., G.A.A., A.V.O., P.I.N., Z.G.Z. and N.N.O.; Methodology, Y.V.M., G.A.A., A.V.O., P.I.N., Z.G.Z. and N.N.O.; Project administration, G.A.A., A.V.O. and N.N.O.; Resources, P.I.N. and N.N.O.; Supervision, G.A.A., A.V.O. and N.N.O.; Visualization, Y.V.M., G.A.A., A.V.O., P.I.N., Z.G.Z. and N.N.O.; Writing—original draft, Y.V.M., G.A.A., A.V.O., P.I.N., Z.G.Z. and N.N.O.; Writing—review and editing, Y.V.M., G.A.A., A.V.O., P.I.N., Z.G.Z. and N.N.O. All authors have read and agreed to the published version of the manuscript.

Funding

This research was funded by the Russian Science Foundation, grant number 22-74-10053, https://rscf.ru/en/project/22-74-10053/ (accessed on 25 March 2025).

Institutional Review Board Statement

Not applicable.

Informed Consent Statement

Not applicable.

Data Availability Statement

The original contributions presented in this study are included in the article/Supplementary Materials. Further inquiries can be directed to the corresponding authors.

Conflicts of Interest

The authors declare no conflicts of interest.

References

  1. Whyte, W.A.; Orlando, D.A.; Hnisz, D.; Abraham, B.J.; Lin, C.Y.; Kagey, M.H.; Rahl, P.B.; Lee, T.I.; Young, R.A. Master Transcription Factors and Mediator Establish Super-Enhancers at Key Cell Identity Genes. Cell 2013, 153, 307–319. [Google Scholar] [CrossRef] [PubMed]
  2. Lovén, J.; Hoke, H.A.; Lin, C.Y.; Lau, A.; Orlando, D.A.; Vakoc, C.R.; Bradner, J.E.; Lee, T.I.; Young, R.A. Selective Inhibition of Tumor Oncogenes by Disruption of Super-Enhancers. Cell 2013, 153, 320–334. [Google Scholar] [CrossRef] [PubMed]
  3. Hnisz, D.; Abraham, B.J.; Lee, T.I.; Lau, A.; Saint-André, V.; Sigova, A.A.; Hoke, H.A.; Young, R.A. Super-Enhancers in the Control of Cell Identity and Disease. Cell 2013, 155, 934–947. [Google Scholar] [CrossRef] [PubMed]
  4. Koutsi, M.A.; Pouliou, M.; Champezou, L.; Vatsellas, G.; Giannopoulou, A.-I.; Piperi, C.; Agelopoulos, M. Typical Enhancers, Super-Enhancers, and Cancers. Cancers 2022, 14, 4375. [Google Scholar] [CrossRef]
  5. Wang, X.; Cairns, M.J.; Yan, J. Super-Enhancers in Transcriptional Regulation and Genome Organization. Nucleic Acids Res. 2019, 47, 11481–11496. [Google Scholar] [CrossRef]
  6. Zheng, X.; Diktonaite, K.; Qiu, H. Epigenetic Reader Bromodomain-Containing Protein 4 in Aging-Related Vascular Pathologies and Diseases: Molecular Basis, Functional Relevance, and Clinical Potential. Biomolecules 2023, 13, 1135. [Google Scholar] [CrossRef]
  7. Lavaud, M.; Tesfaye, R.; Lassous, L.; Brounais, B.; Baud’huin, M.; Verrecchia, F.; Lamoureux, F.; Georges, S.; Ory, B. Super-Enhancers: Drivers of Cells’ Identities and Cells’ Debacles. Epigenomics 2024, 16, 681–700. [Google Scholar] [CrossRef]
  8. Qian, H.; Zhu, M.; Tan, X.; Zhang, Y.; Liu, X.; Yang, L. Super-Enhancers and the Super-Enhancer Reader BRD4: Tumorigenic Factors and Therapeutic Targets. Cell Death Discov. 2023, 9, 470. [Google Scholar] [CrossRef]
  9. Sabari, B.R.; Dall’Agnese, A.; Boija, A.; Klein, I.A.; Coffey, E.L.; Shrinivas, K.; Abraham, B.J.; Hannett, N.M.; Zamudio, A.V.; Manteiga, J.C.; et al. Coactivator Condensation at Super-Enhancers Links Phase Separation and Gene Control. Science 2018, 361, 6400. [Google Scholar] [CrossRef]
  10. Khan, A.; Zhang, X. Integrative Modeling Reveals Key Chromatin and Sequence Signatures Predicting Super-Enhancers. Sci. Rep. 2019, 9, 2877. [Google Scholar] [CrossRef]
  11. Vukovic Đerfi, K.; Vasiljevic, T.; Matijevic Glavan, T. Recent Advances in the Targeting of Head and Neck Cancer Stem Cells. Appl. Sci. 2023, 13, 13293. [Google Scholar] [CrossRef]
  12. Dębek, S.; Juszczyński, P. Super Enhancers as Master Gene Regulators in the Pathogenesis of Hematologic Malignancies. Biochim. Biophys. Acta (BBA)—Rev. Cancer 2022, 1877, 188697. [Google Scholar] [CrossRef]
  13. Hu, Y.; Xu, R.; Feng, J.; Zhang, Q.; Zhang, L.; Li, Y.; Sun, X.; Gao, J.; Chen, X.; Du, M.; et al. Identification of Potential Pathogenic Hepatic Super-Enhancers Regulatory Network in High-Fat Diet Induced Hyperlipidemia. J. Nutr. Biochem. 2024, 126, 109584. [Google Scholar] [CrossRef] [PubMed]
  14. Li, J.; Zhu, J.; Gray, O.; Sobreira, D.R.; Wu, D.; Huang, R.-T.; Miao, B.; Sakabe, N.J.; Krause, M.D.; Kaikkonen, M.U.; et al. Mechanosensitive Super-Enhancers Regulate Genes Linked to Atherosclerosis in Endothelial Cells. J. Cell Biol. 2024, 223, e202211125. [Google Scholar] [CrossRef] [PubMed]
  15. Anene-Nzelu, C.G.; Lee, M.C.J.; Tan, W.L.W.; Dashi, A.; Foo, R.S.Y. Genomic Enhancers in Cardiac Development and Disease. Nat. Rev. Cardiol. 2022, 19, 7–25. [Google Scholar] [CrossRef]
  16. Liu, S.; Dai, W.; Jin, B.; Jiang, F.; Huang, H.; Hou, W.; Lan, J.; Jin, Y.; Peng, W.; Pan, J. Effects of Super-Enhancers in Cancer Metastasis: Mechanisms and Therapeutic Targets. Mol. Cancer 2024, 23, 122. [Google Scholar] [CrossRef]
  17. Gu, W.; Jiang, X.; Wang, W.; Mujagond, P.; Liu, J.; Mai, Z.; Tang, H.; Li, S.; Xiao, H.; Zhao, J. Super-Enhancer-Associated Long Non-Coding RNA LINC01485 Promotes Osteogenic Differentiation of Human Bone Marrow Mesenchymal Stem Cells by Regulating MiR-619-5p/RUNX2 Axis. Front. Endocrinol. 2022, 13, 846154. [Google Scholar] [CrossRef]
  18. Chuang, T.-D.; Quintanilla, D.; Boos, D.; Khorram, O. Differential Expression of Super-Enhancer-Associated Long Non-Coding RNAs in Uterine Leiomyomas. Reprod. Sci. 2022, 29, 2960–2976. [Google Scholar] [CrossRef]
  19. Ropri, A.S.; DeVaux, R.S.; Eng, J.; Chittur, S.V.; Herschkowitz, J.I. Cis-Acting Super-Enhancer lncRNAs as Biomarkers to Early-Stage Breast Cancer. Breast Cancer Res. 2021, 23, 101. [Google Scholar] [CrossRef]
  20. Bal, E.; Kumar, R.; Hadigol, M.; Holmes, A.B.; Hilton, L.K.; Loh, J.W.; Dreval, K.; Wong, J.C.H.; Vlasevska, S.; Corinaldesi, C.; et al. Super-Enhancer Hypermutation Alters Oncogene Expression in B Cell Lymphoma. Nature 2022, 607, 808–815. [Google Scholar] [CrossRef]
  21. Bacabac, M.; Xu, W. Oncogenic Super-Enhancers in Cancer: Mechanisms and Therapeutic Targets. Cancer Metastasis Rev. 2023, 42, 471–480. [Google Scholar] [CrossRef]
  22. Kai, Y.; Li, B.E.; Zhu, M.; Li, G.Y.; Chen, F.; Han, Y.; Cha, H.J.; Orkin, S.H.; Cai, W.; Huang, J.; et al. Mapping the Evolving Landscape of Super-Enhancers during Cell Differentiation. Genome Biol. 2021, 22, 269. [Google Scholar] [CrossRef]
  23. Huang, J.; Li, K.; Cai, W.; Liu, X.; Zhang, Y.; Orkin, S.H.; Xu, J.; Yuan, G.-C. Dissecting Super-Enhancer Hierarchy Based on Chromatin Interactions. Nat. Commun. 2018, 9, 943. [Google Scholar] [CrossRef] [PubMed]
  24. Kravchuk, E.V.; Ashniev, G.A.; Gladkova, M.G.; Orlov, A.V.; Vasileva, A.V.; Boldyreva, A.V.; Burenin, A.G.; Skirda, A.M.; Nikitin, P.I.; Orlova, N.N. Experimental Validation and Prediction of Super-Enhancers: Advances and Challenges. Cells 2023, 12, 1191. [Google Scholar] [CrossRef] [PubMed]
  25. Zyner, K.G.; Simeone, A.; Flynn, S.M.; Doyle, C.; Marsico, G.; Adhikari, S.; Portella, G.; Tannahill, D.; Balasubramanian, S. G-Quadruplex DNA Structures in Human Stem Cells and Differentiation. Nat. Commun. 2022, 13, 142. [Google Scholar] [CrossRef] [PubMed]
  26. Duardo, R.C.; Guerra, F.; Pepe, S.; Capranico, G. Non-B DNA Structures as a Booster of Genome Instability. Biochimie 2023, 214, 176–192. [Google Scholar] [CrossRef]
  27. Kuznetsov, V.A.; Bondarenko, V.; Wongsurawat, T.; Yenamandra, S.P.; Jenjaroenpun, P. Toward Predictive R-Loop Computational Biology: Genome-Scale Prediction of R-Loops Reveals Their Association with Complex Promoter Structures, G-Quadruplexes and Transcriptionally Active Enhancers. Nucleic Acids Res. 2018, 46, 7566–7585. [Google Scholar] [CrossRef]
  28. Shin, S.-I.; Ham, S.; Park, J.; Seo, S.H.; Lim, C.H.; Jeon, H.; Huh, J.; Roh, T.-Y. Z-DNA-Forming Sites Identified by ChIP-Seq Are Associated with Actively Transcribed Regions in the Human Genome. DNA Res. 2016, 23, 477–486. [Google Scholar] [CrossRef]
  29. Herbert, A. Z-DNA and Z-RNA in Human Disease. Commun. Biol. 2019, 2, 7. [Google Scholar] [CrossRef]
  30. Krall, J.B.; Nichols, P.J.; Henen, M.A.; Vicens, Q.; Vögeli, B. Structure and Formation of Z-DNA and Z-RNA. Molecules 2023, 28, 843. [Google Scholar] [CrossRef]
  31. Beknazarov, N.; Konovalov, D.; Herbert, A.; Poptsova, M. Z-DNA Formation in Promoters Conserved between Human and Mouse Are Associated with Increased Transcription Reinitiation Rates. Sci. Rep. 2024, 14, 17786. [Google Scholar] [CrossRef] [PubMed]
  32. D’Ascenzo, L.; Leonarski, F.; Vicens, Q.; Auffinger, P. ‘Z-DNA like’ Fragments in RNA: A Recurring Structural Motif with Implications for Folding, RNA/Protein Recognition and Immune Response. Nucleic Acids Res. 2016, 44, 5944–5956. [Google Scholar] [CrossRef] [PubMed]
  33. Maloy, S.; Hughes, K. Brenner’s Encyclopedia of Genetics; Academic Press: Cambridge, MA, USA, 2013; ISBN 978-0-08-096156-9. [Google Scholar]
  34. Champ, P.C.; Maurice, S.; Vargason, J.M.; Camp, T.; Ho, P.S. Distributions of Z-DNA and Nuclear Factor I in Human Chromosome 22: A Model for Coupled Transcriptional Regulation. Nucleic Acids Res. 2004, 32, 6501–6510. [Google Scholar] [CrossRef]
  35. Wittig, B.; Wölfl, S.; Dorbic, T.; Vahrson, W.; Rich, A. Transcription of Human C-myc in Permeabilized Nuclei Is Associated with Formation of Z-DNA in Three Discrete Regions of the Gene. EMBO J. 1992, 11, 4653–4663. [Google Scholar] [CrossRef]
  36. Ray, B.K.; Dhar, S.; Shakya, A.; Ray, A. Z-DNA-Forming Silencer in the First Exon Regulates Human ADAM-12 Gene Expression. Proc. Natl. Acad. Sci. USA 2011, 108, 103–108. [Google Scholar] [CrossRef]
  37. Wang, G.; Christensen, L.A.; Vasquez, K.M. Z-DNA-Forming Sequences Generate Large-Scale Deletions in Mammalian Cells. Proc. Natl. Acad. Sci. USA 2006, 103, 2677–2682. [Google Scholar] [CrossRef] [PubMed]
  38. Vongsutilers, V.; Gannett, P.M. C8-Guanine Modifications: Effect on Z-DNA Formation and Its Role in Cancer. Org. Biomol. Chem. 2018, 16, 2198–2209. [Google Scholar] [CrossRef]
  39. Ravichandran, S.; Subramani, V.K.; Kim, K.K. Z-DNA in the Genome: From Structure to Disease. Biophys. Rev. 2019, 11, 383–387. [Google Scholar] [CrossRef]
  40. Umerenkov, D.; Herbert, A.; Konovalov, D.; Danilova, A.; Beknazarov, N.; Kokh, V.; Fedorov, A.; Poptsova, M. Z-Flipon Variants Reveal the Many Roles of Z-DNA and Z-RNA in Health and Disease. Life Sci. Alliance 2023, 6, 7. [Google Scholar] [CrossRef]
  41. 1000 Genomes Project Consortium. A Map of Human Genome Variation from Population Scale Sequencing. Nature 2010, 467, 1061–1073. [Google Scholar] [CrossRef]
  42. Jiang, Y.; Qian, F.; Bai, X.; Liu, Y.; Wang, Q.; Ai, B.; Han, X.; Shi, S.; Zhang, J.; Li, X.; et al. SEdb: A Comprehensive Human Super-Enhancer Database. Nucleic Acids Res. 2019, 47, D235–D243. [Google Scholar] [CrossRef] [PubMed]
  43. DNABERT-Z. Available online: https://github.com/mitiau/Z-DNABERT (accessed on 16 April 2025).
  44. Quinlan, A.R.; Hall, I.M. BEDTools: A Flexible Suite of Utilities for Comparing Genomic Features. Bioinformatics 2010, 26, 841–842. [Google Scholar] [CrossRef]
  45. Cingolani, P.; Platts, A.; Wang, L.L.; Coon, M.; Nguyen, T.; Wang, L.; Land, S.J.; Lu, X.; Ruden, D.M. A Program for Annotating and Predicting the Effects of Single Nucleotide Polymorphisms, SnpEff: SNPs in the Genome of Drosophila Melanogaster Strain W1118; Iso-2; Iso-3. Fly 2012, 6, 80–92. [Google Scholar] [CrossRef]
  46. Sherry, S.T.; Ward, M.H.; Kholodov, M.; Baker, J.; Phan, L.; Smigielski, E.M.; Sirotkin, K. dbSNP: The NCBI Database of Genetic Variation. Nucleic Acids Res. 2001, 29, 308–311. [Google Scholar] [CrossRef] [PubMed]
  47. Landrum, M.J.; Lee, J.M.; Riley, G.R.; Jang, W.; Rubinstein, W.S.; Church, D.M.; Maglott, D.R. ClinVar: Public Archive of Relationships among Sequence Variation and Human Phenotype. Nucleic Acids Res. 2014, 42, D980–D985. [Google Scholar] [CrossRef] [PubMed]
  48. Duttke, S.H.; Guzman, C.; Chang, M.; Delos Santos, N.P.; McDonald, B.R.; Xie, J.; Carlin, A.F.; Heinz, S.; Benner, C. Position-Dependent Function of Human Sequence-Specific Transcription Factors. Nature 2024, 631, 891–898. [Google Scholar] [CrossRef]
  49. Gupta, S.; Stamatoyannopoulos, J.A.; Bailey, T.L.; Noble, W.S. Quantifying Similarity between Motifs. Genome Biol. 2007, 8, R24. [Google Scholar] [CrossRef]
  50. Grant, C.E.; Bailey, T.L.; Noble, W.S. FIMO: Scanning for Occurrences of a given Motif. Bioinformatics 2011, 27, 1017–1018. [Google Scholar] [CrossRef]
  51. Guiblet, W.M.; Cremona, M.A.; Cechova, M.; Harris, R.S.; Kejnovská, I.; Kejnovsky, E.; Eckert, K.; Chiaromonte, F.; Makova, K.D. Long-Read Sequencing Technology Indicates Genome-Wide Effects of Non-B DNA on Polymerization Speed and Error Rate. Genome Res. 2018, 28, 1767–1778. [Google Scholar] [CrossRef]
  52. Fulco, C.P.; Munschauer, M.; Anyoha, R.; Munson, G.; Grossman, S.R.; Perez, E.M.; Kane, M.; Cleary, B.; Lander, E.S.; Engreitz, J.M. Systematic Mapping of Functional Enhancer–Promoter Connections with CRISPR Interference. Science 2016, 354, 769–773. [Google Scholar] [CrossRef]
  53. Zhao, J.; Bacolla, A.; Wang, G.; Vasquez, K.M. Non-B DNA Structure-Induced Genetic Instability and Evolution. Cell. Mol. Life Sci. 2009, 67, 43–62. [Google Scholar] [CrossRef] [PubMed]
  54. Wang, Y.-R.; Chang, S.-M.; Lin, J.-J.; Chen, H.-C.; Lee, L.-T.; Tsai, D.-Y.; Lee, S.-D.; Lan, C.-Y.; Chang, C.-R.; Chen, C.-F.; et al. A Comprehensive Study of Z-DNA Density and Its Evolutionary Implications in Birds. BMC Genom. 2024, 25, 1123. [Google Scholar] [CrossRef]
  55. Sahu, B.; Hartonen, T.; Pihlajamaa, P.; Wei, B.; Dave, K.; Zhu, F.; Kaasinen, E.; Lidschreiber, K.; Lidschreiber, M.; Daub, C.O.; et al. Sequence Determinants of Human Gene Regulatory Elements. Nat. Genet. 2022, 54, 283–294. [Google Scholar] [CrossRef] [PubMed]
  56. Perez, G.; Barber, G.P.; Benet-Pages, A.; Casper, J.; Clawson, H.; Diekhans, M.; Fischer, C.; Gonzalez, J.N.; Hinrichs, A.S.; Lee, C.M.; et al. The UCSC Genome Browser Database: 2025 Update. Nucleic Acids Res. 2025, 53, D1243–D1249. [Google Scholar] [CrossRef]
  57. Balzano, E.; Pelliccia, F.; Giunta, S. Genome (in)Stability at Tandem Repeats. Semin. Cell Dev. Biol. 2021, 113, 97–112. [Google Scholar] [CrossRef]
  58. Presnell, J.S.; Schnitzler, C.E.; Browne, W.E. KLF/SP Transcription Factor Family Evolution: Expansion, Diversification, and Innovation in Eukaryotes. Genome Biol. Evol. 2015, 7, 2289–2309. [Google Scholar] [CrossRef] [PubMed]
  59. Suske, G.; Bruford, E.; Philipsen, S. Mammalian SP/KLF Transcription Factors: Bring in the Family. Genomics 2005, 85, 551–556. [Google Scholar] [CrossRef]
  60. Scobie, K.N.; Hall, B.J.; Wilke, S.A.; Klemenhagen, K.C.; Fujii-Kuriyama, Y.; Ghosh, A.; Hen, R.; Sahay, A. Krüppel-Like Factor 9 Is Necessary for Late-Phase Neuronal Maturation in the Developing Dentate Gyrus and during Adult Hippocampal Neurogenesis. J. Neurosci. 2009, 29, 9875–9887. [Google Scholar] [CrossRef]
  61. Moore, D.L.; Blackmore, M.G.; Hu, Y.; Kaestner, K.H.; Bixby, J.L.; Lemmon, V.P.; Goldberg, J.L. KLF Family Members Regulate Intrinsic Axon Regeneration Ability. Science 2009, 326, 298–301. [Google Scholar] [CrossRef]
  62. Qin, S.; Liu, M.; Niu, W.; Zhang, C.-L. Dysregulation of Kruppel-like Factor 4 during Brain Development Leads to Hydrocephalus in Mice. Proc. Natl. Acad. Sci. USA 2011, 108, 21117–21121. [Google Scholar] [CrossRef]
  63. Kaminsky, E.B.; Kaul, V.; Paschall, J.; Church, D.M.; Bunke, B.; Kunig, D.; Moreno-De-Luca, D.; Moreno-De-Luca, A.; Mulle, J.G.; Warren, S.T.; et al. An Evidence-Based Approach to Establish the Functional and Clinical Significance of Copy Number Variants in Intellectual and Developmental Disabilities. Genet. Med. 2011, 13, 777–784. [Google Scholar] [CrossRef] [PubMed]
  64. Sherman, B.T.; Hao, M.; Qiu, J.; Jiao, X.; Baseler, M.W.; Lane, H.C.; Imamichi, T.; Chang, W. DAVID: A Web Server for Functional Enrichment Analysis and Functional Annotation of Gene Lists (2021 Update). Nucleic Acids Res. 2022, 50, W216–W221. [Google Scholar] [CrossRef] [PubMed]
  65. Agrawal, P.; Rao, S. Super-Enhancers and CTCF in Early Embryonic Cell Fate Decisions. Front. Cell Dev. Biol. 2021, 9, 653669. [Google Scholar] [CrossRef]
  66. Zhang, S.; Wang, C.; Qin, S.; Chen, C.; Bao, Y.; Zhang, Y.; Xu, L.; Liu, Q.; Zhao, Y.; Li, K.; et al. Analyzing Super-Enhancer Temporal Dynamics Reveals Potential Critical Enhancers and Their Gene Regulatory Networks Underlying Skeletal Muscle Development. Genome Res. 2024, 34, 2190–2202. [Google Scholar] [CrossRef] [PubMed]
Figure 1. Heat maps of Z-DNA distribution across enhancer elements in the HCT116 cell line: Comparison of original (Top Row) and Z-DNA-intersected (Bottom Row) datasets across typical enhancers, super-enhancer enhancers, super-enhancers, and background regions (BG) with chromosomal binning (25 bins per chromosome, hg38 assembly).
Applsci 15 05113 g001
Figure 2. Boxplots and scatter plots of—log10 (p-values) from permutation tests showing the distribution of predicted Z-DNA overlaps across background regions, super-enhancers, enhancers within super-enhancers, and typical enhancers in six cancer cell lines.
Applsci 15 05113 g002
Figure 3. Violin plots depicting mutation concentration distributions (mutations normalized by region length) within the top quartile (25% most variable regions) across background regions, super-enhancer spacers, enhancers within super-enhancers, and typical enhancers. Mutation data were derived from 100 individuals of European ancestry (1000 Genomes Project).
Applsci 15 05113 g003
Figure 4. Gain and loss of transcription factor binding motifs due to mutations in a Z-DNA-associated super-enhancer region, with motif logos and corresponding TF E-value distributions.
Applsci 15 05113 g004
Figure 5. Phylogenetic tree of individuals based on novel mutations in SE-Z-DNA loci. Red bars represent the Cumulative Allele Frequency Score (CAFS), while green bars indicate the allele frequencies in the cohort of 100 individuals.
Applsci 15 05113 g005
Table 1. Clustering of individuals based on novel mutations in SE-Z-DNA loci with reference and alternative allele distribution.
Cluster NumberPosition (Chr10)Number of GenomesNumber of Mutations
119394275119394519119394520119394546119394789
1REFALTREFREFREF231
REFREFALTREFREF
2ALTALTALTREFREF112–3
ALTREFALTREFREF
ALTREFALTALTREF
3REFREFREFREFALT111
4REFALTREFREFALT52
5ALTREFREFREFREF141–2
ALTREFREFREFALT
6REFREFREFALTREF71–2
ALTREFREFALTREF
n/aALTALTALTREFALT14
Disclaimer/Publisher’s Note: The statements, opinions and data contained in all publications are solely those of the individual author(s) and contributor(s) and not of MDPI and/or the editor(s). MDPI and/or the editor(s) disclaim responsibility for any injury to people or property resulting from any ideas, methods, instructions or products referred to in the content.

