
Wind-Induced Dynamic Performance Evaluation of Tall Buildings Considering Future Wind Climate


Abstract
1. Introduction
2. Basic Settings for the Simulations
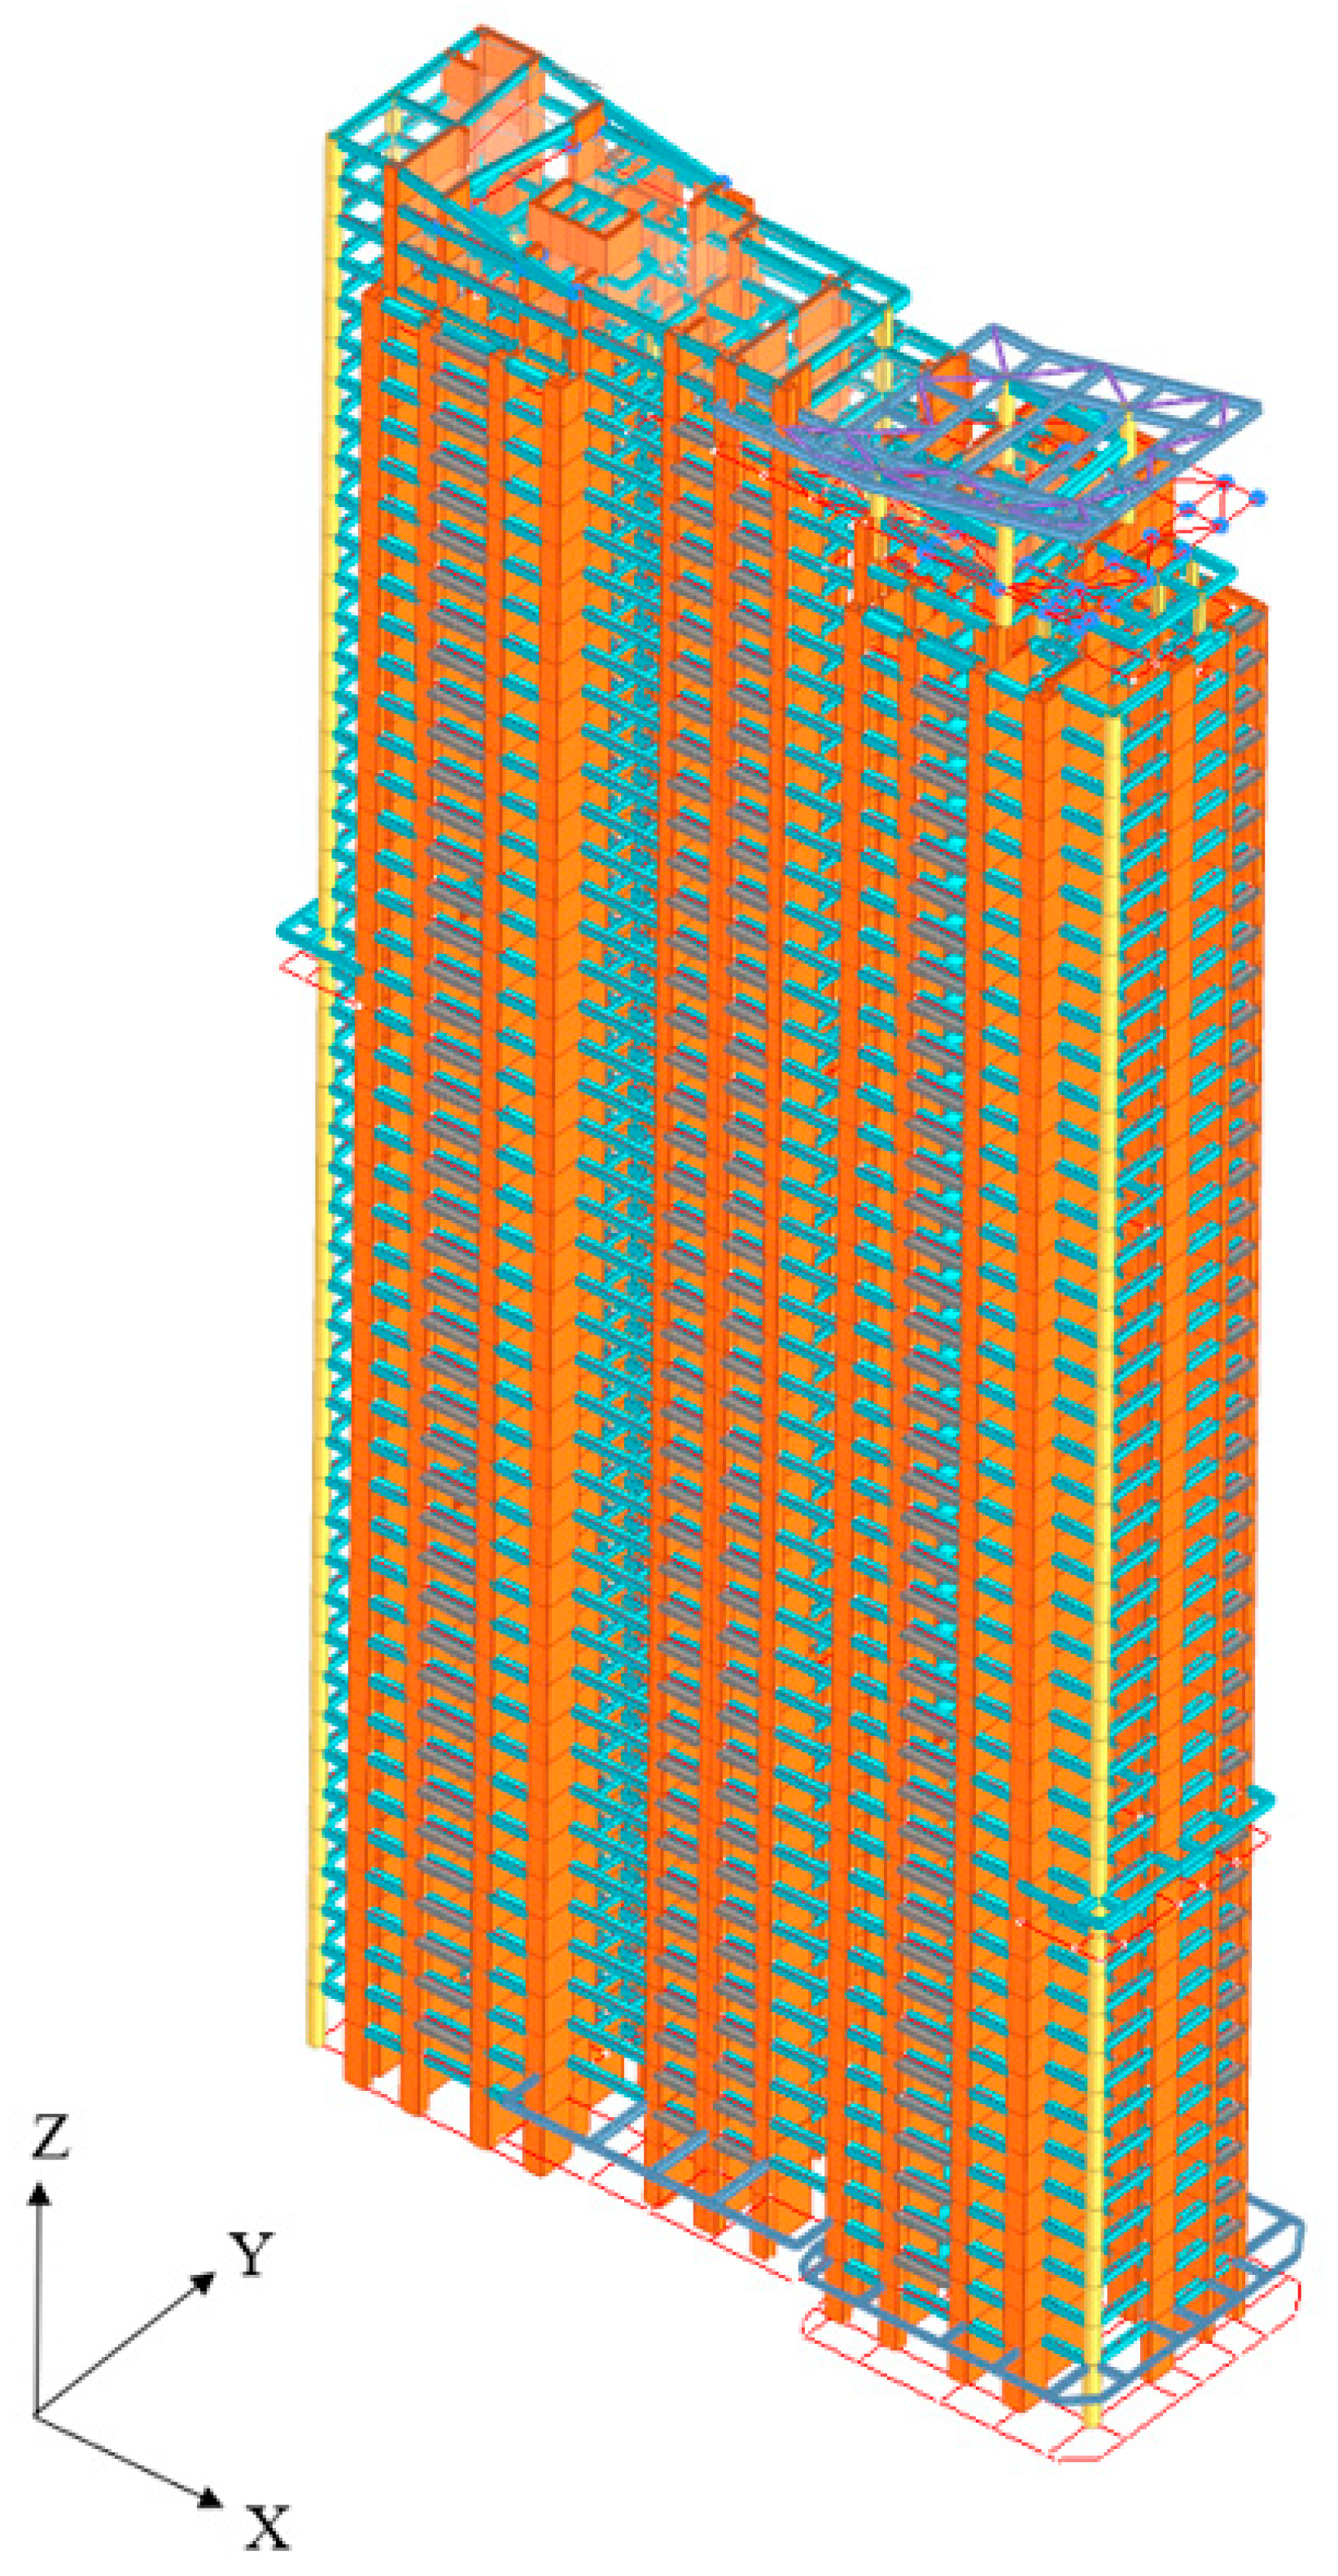
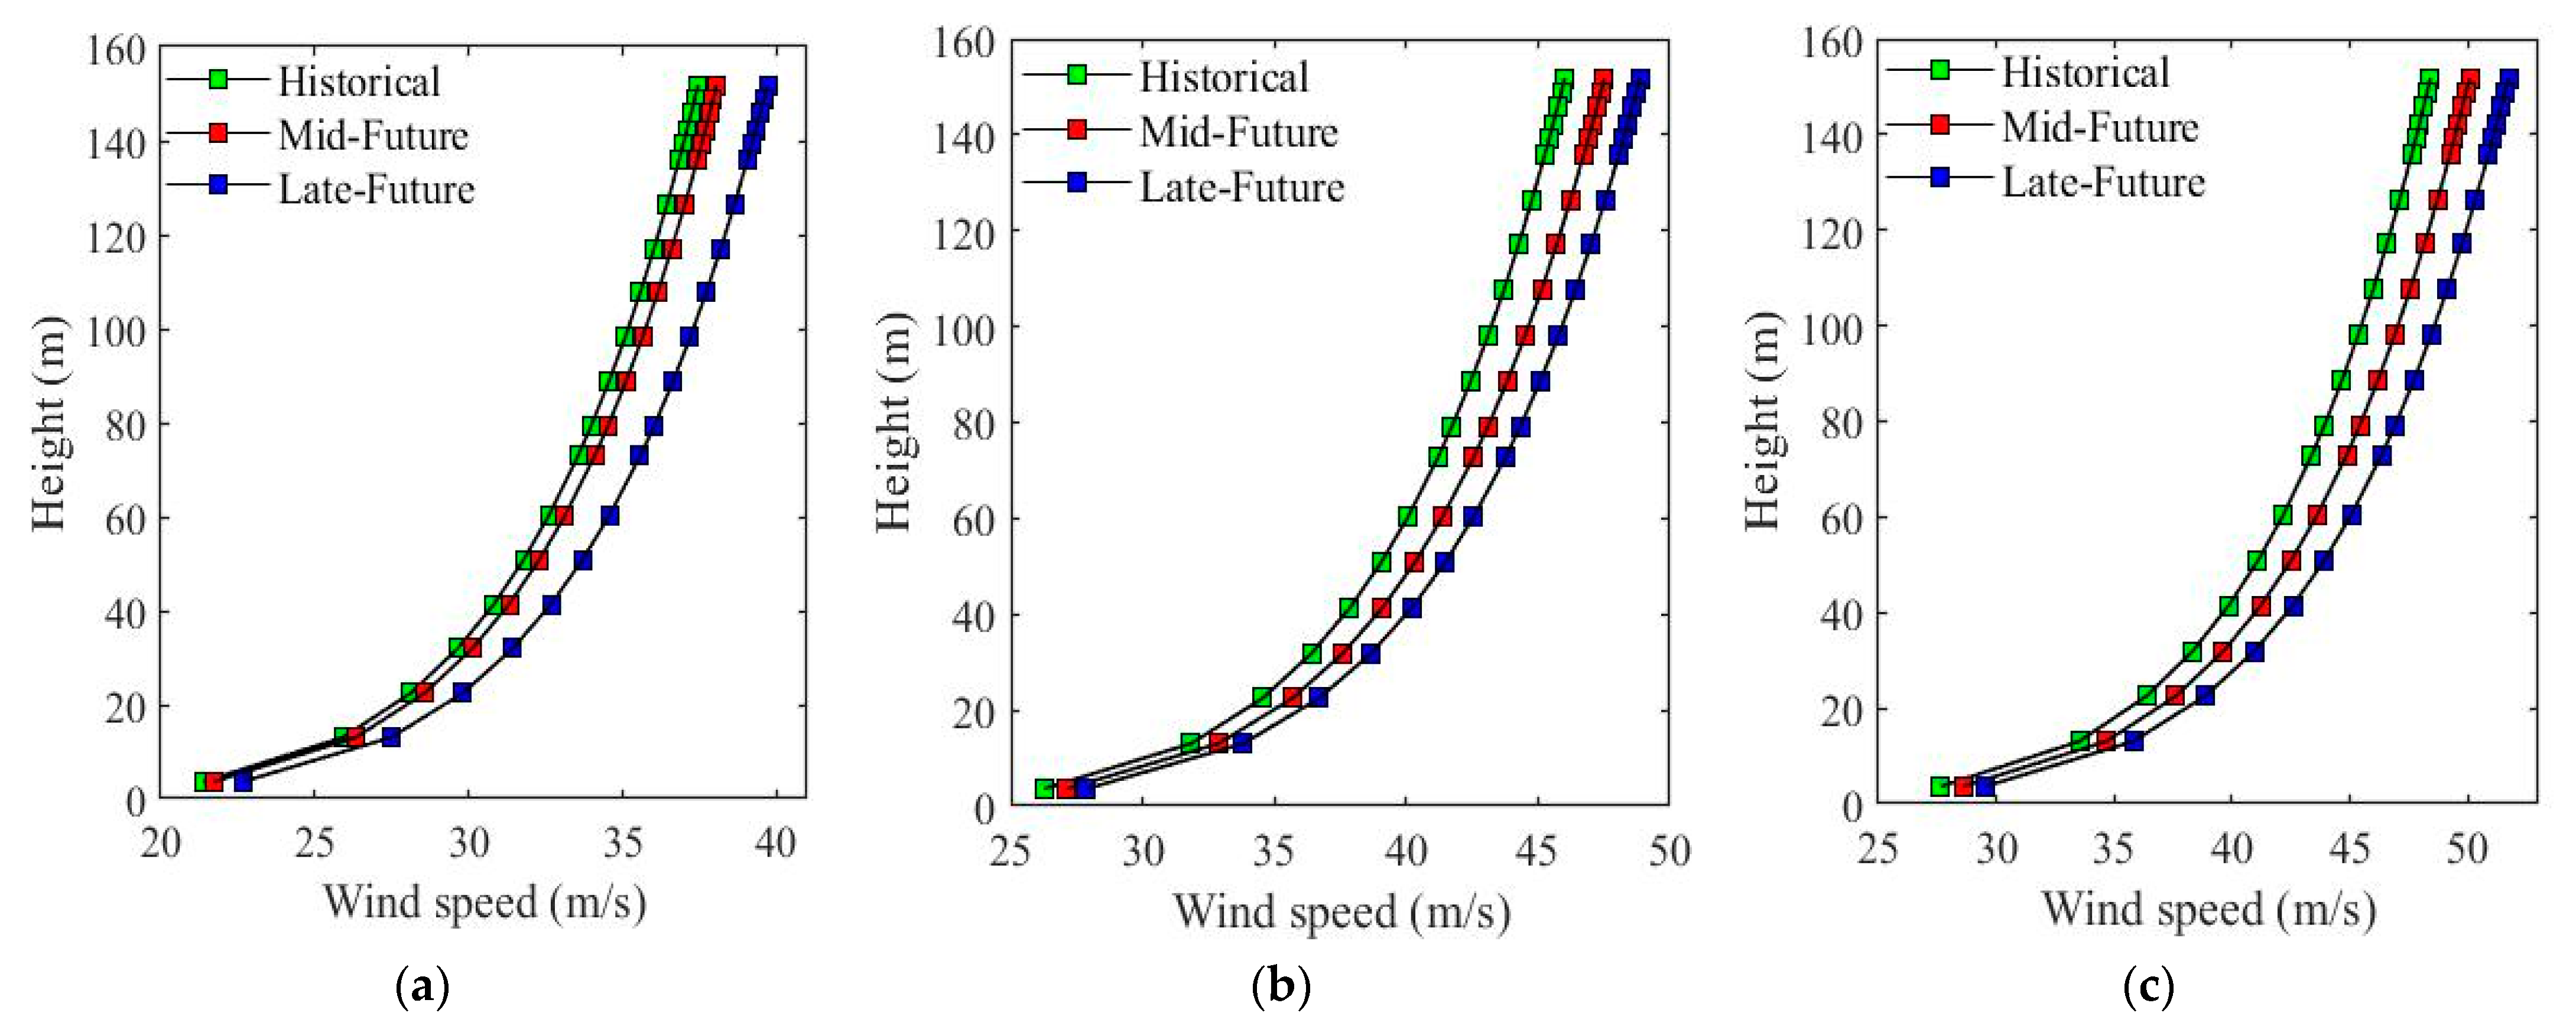
2.1. Building Information and Prevailing Wind Conditions
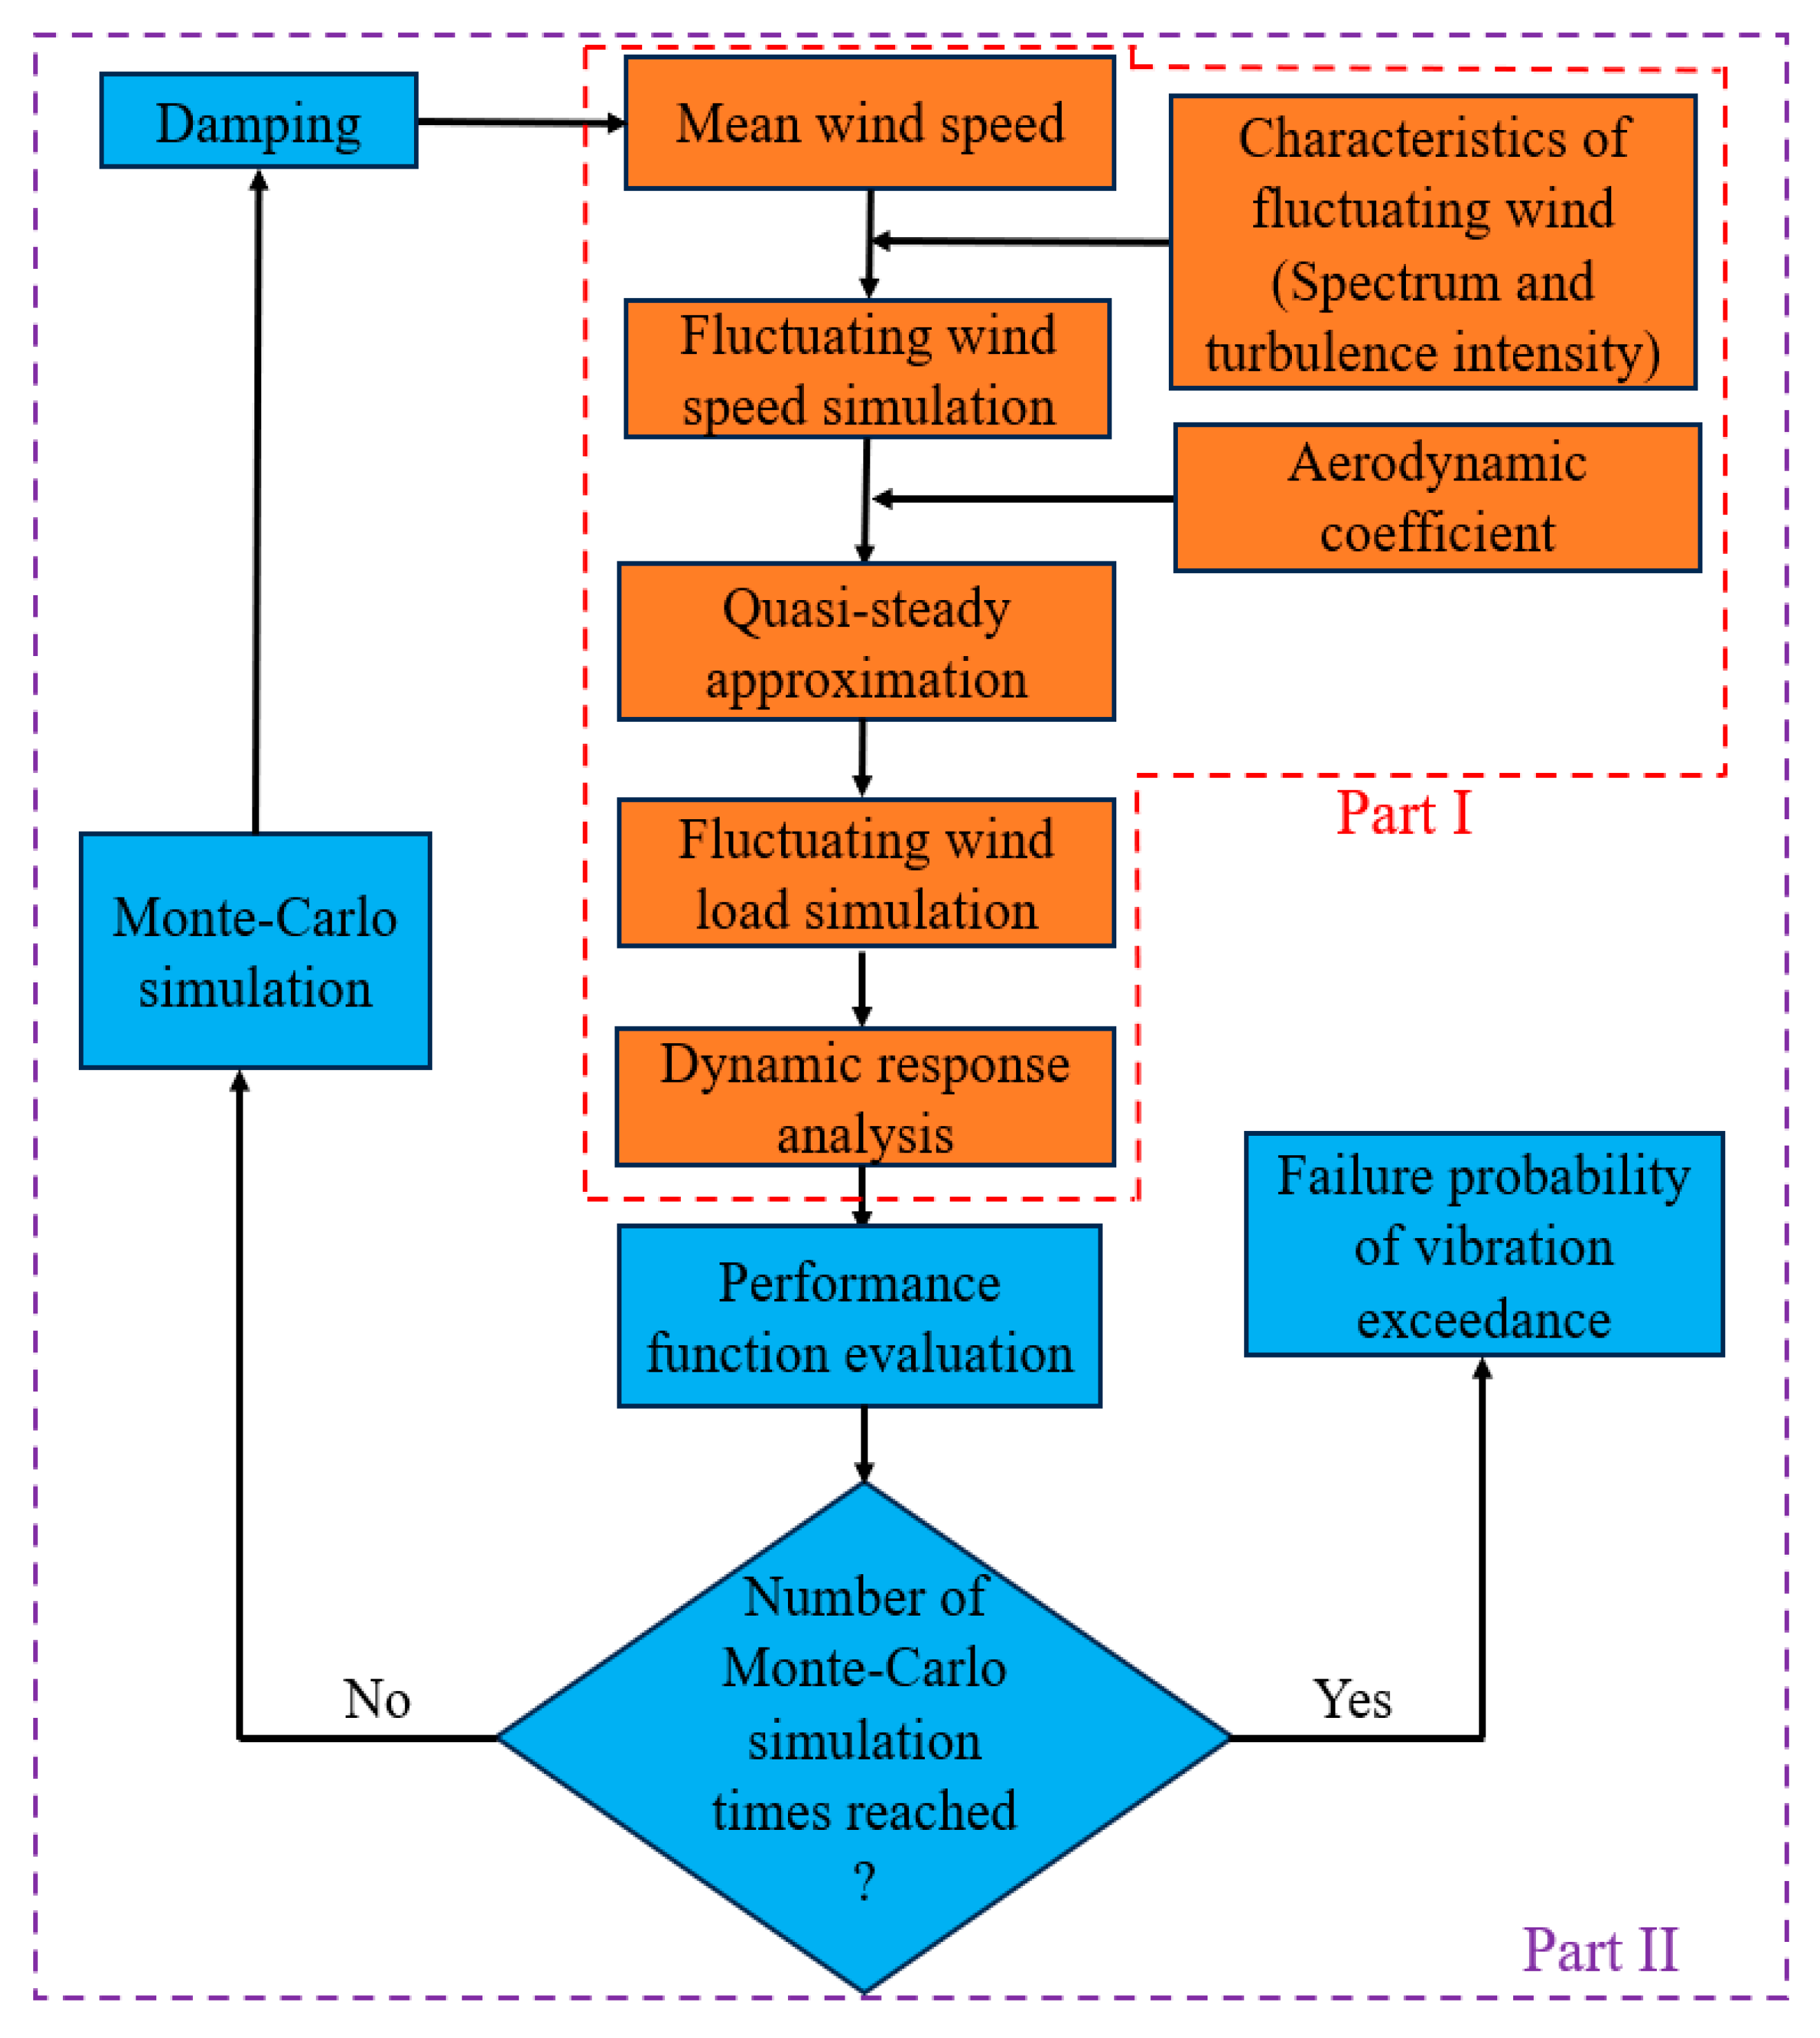
2.2. Performance Evaluation of the Building Under Wind Loads
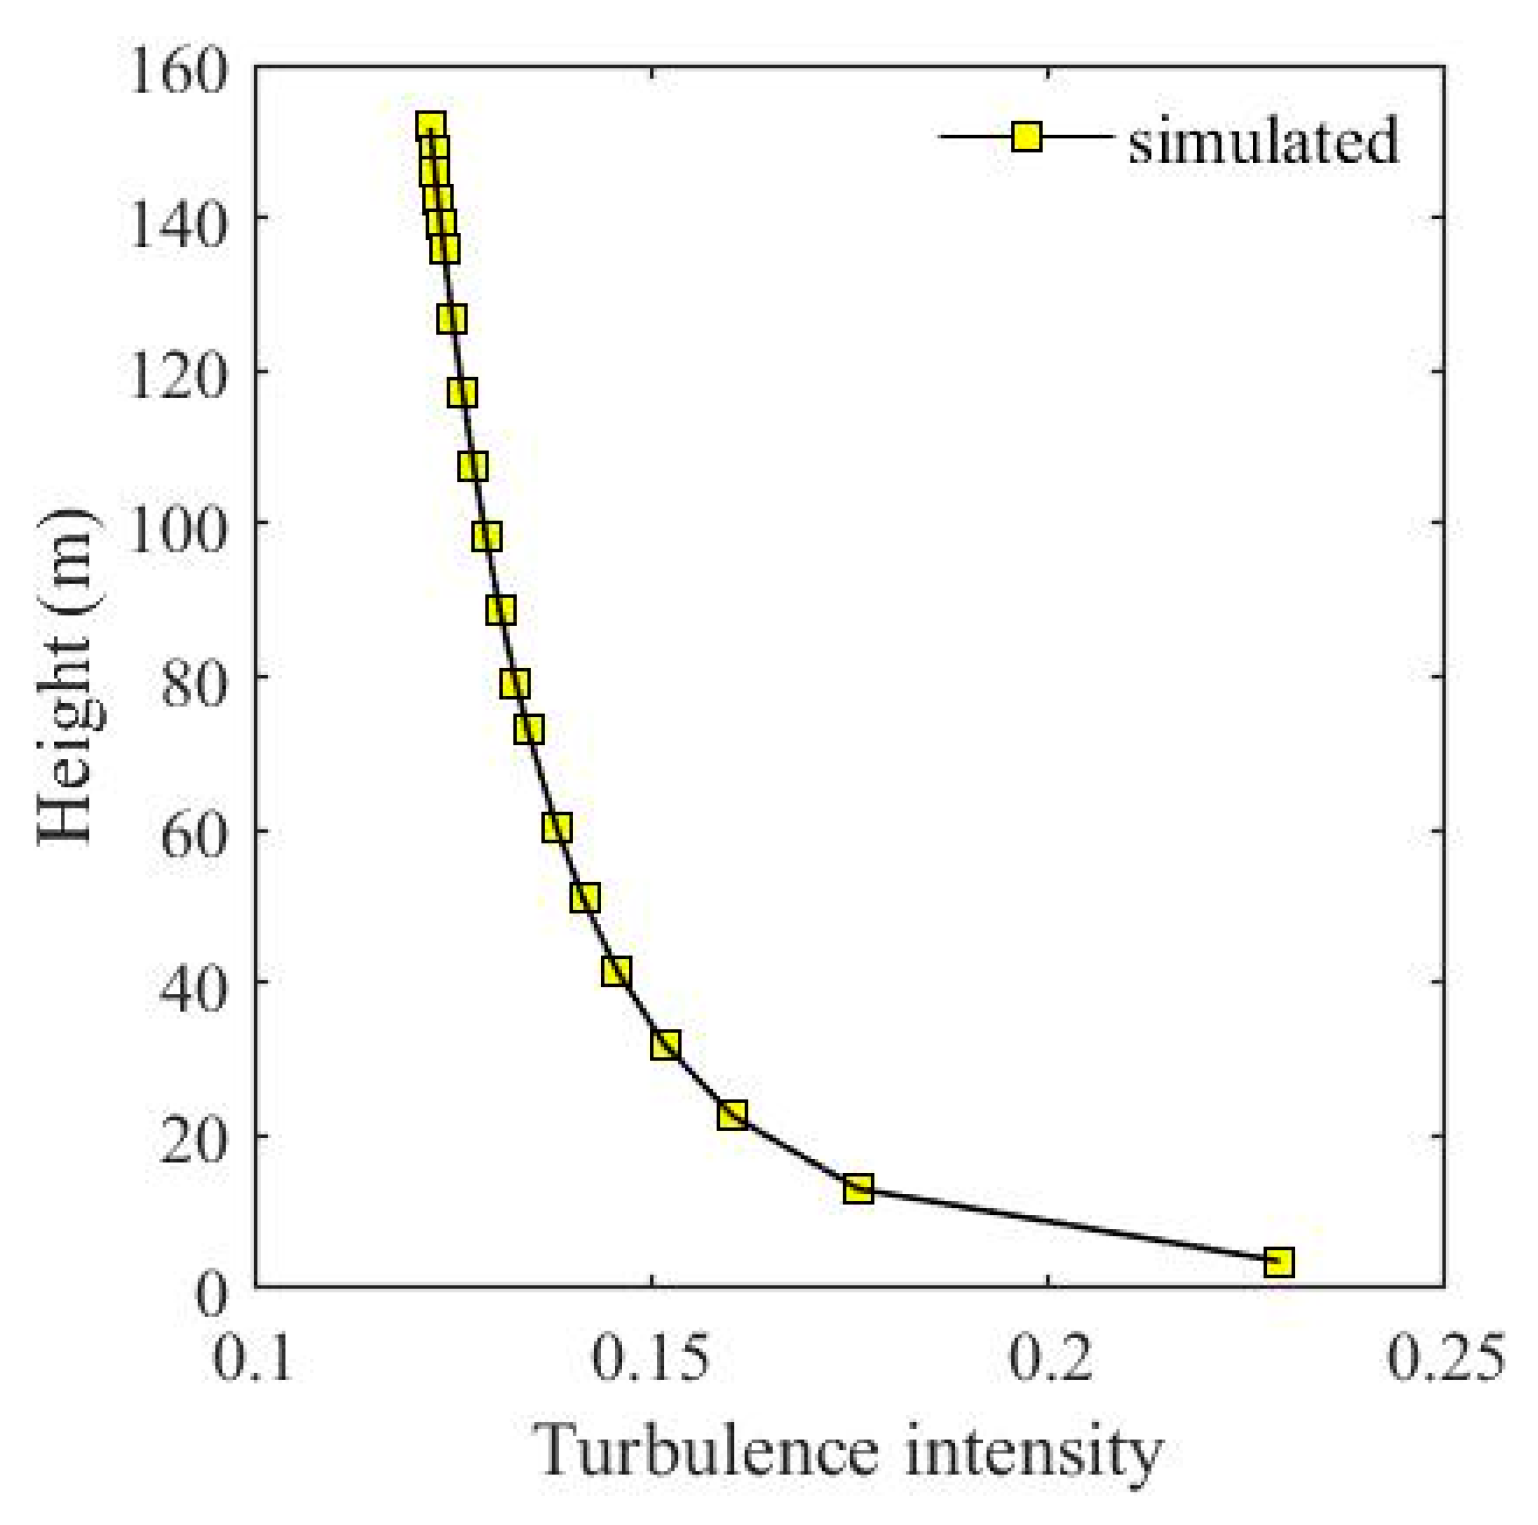
2.2.1. Generation of Wind Speed Time History
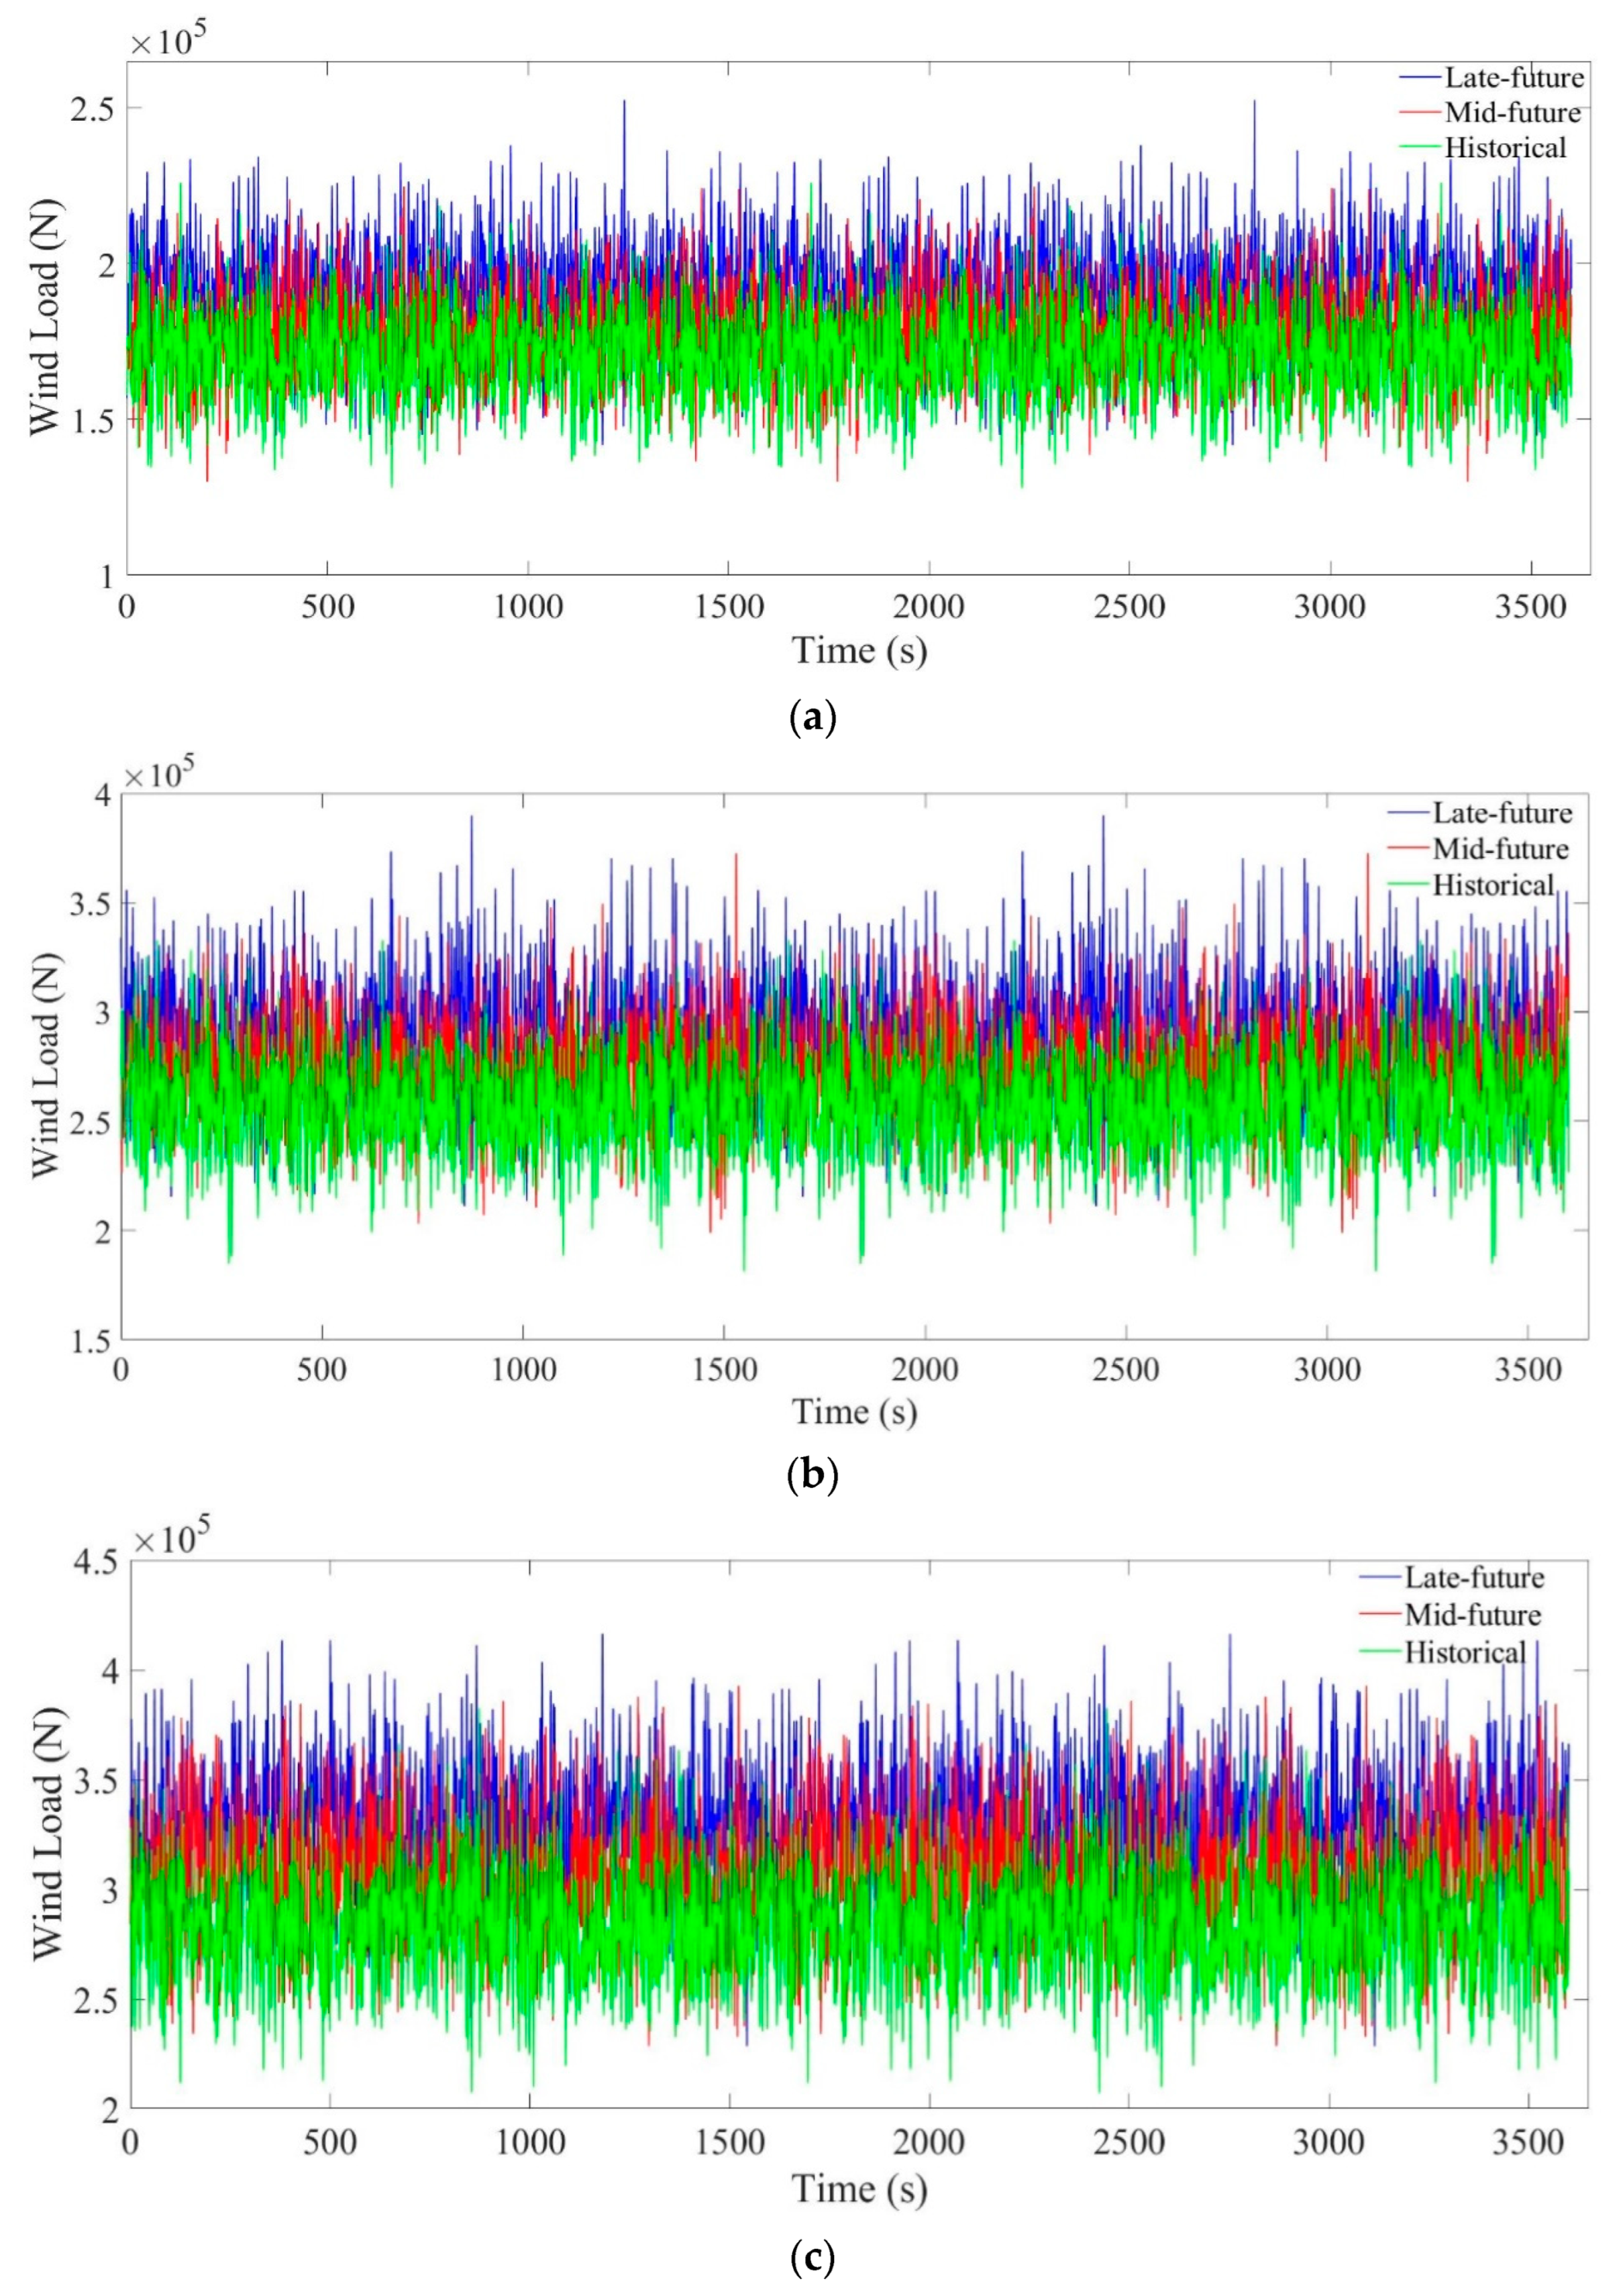
2.2.2. Wind Loads Simulation

| Parameters | Conditions | Equations |
|---|---|---|
| Windward wall, Cpe1 | — | |
| Leeward wall, Cpe2 | ||
| Pressure distribution coefficients for vertical profile, kz | ||
2.2.3. Wind-Induced Dynamic Response Analysis of Tall Building
2.3. Simulation Results and Discussions
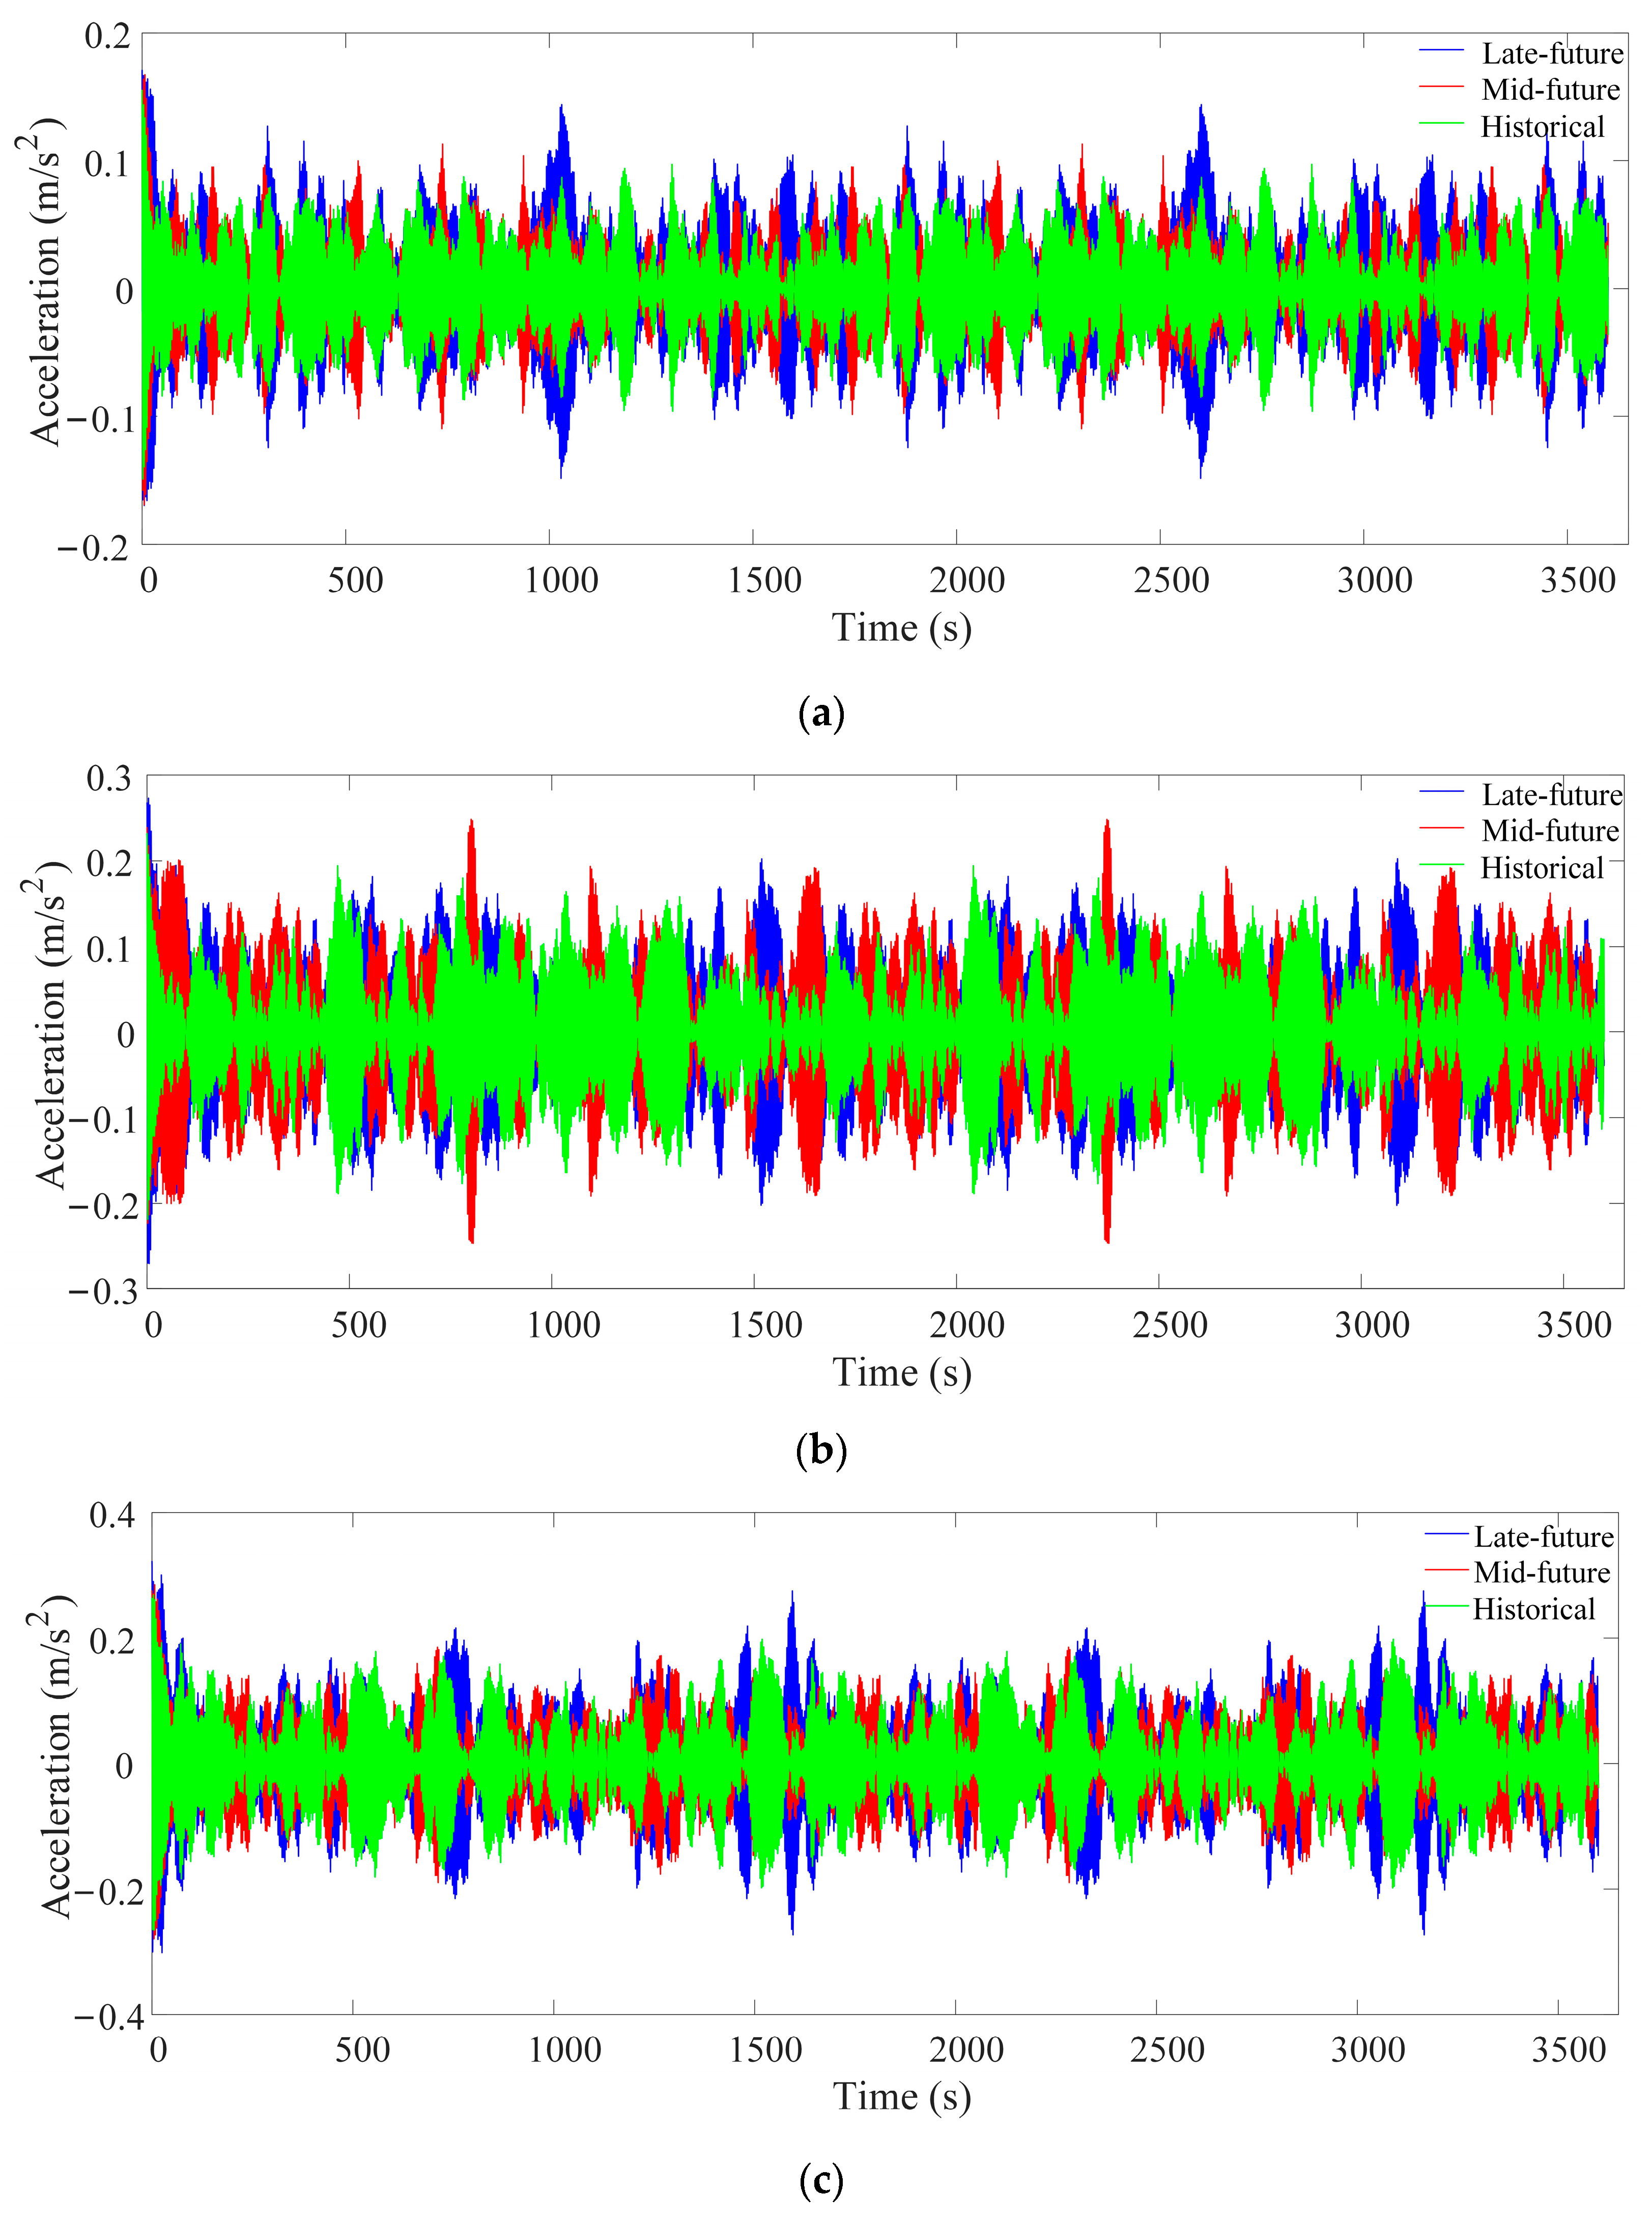
- For a 10-Year Return Period: The maximum acceleration for historical conditions was recorded at 0.1550 m/s2, which increases to 0.1674 m/s2 in mid-future conditions and further to 0.1708 m/s2 in late-future conditions. This trend indicates an approximate increase of 8.0% and 10.0% for mid-future and late-future conditions, respectively, compared to historical data.
- For a 50-Year Return Period: The historical maximum acceleration was 0.2319 m/s2, which rises to 0.2483 m/s2 in mid-future and 0.2732 m/s2 in late-future conditions. This represents increases of about 7.0% and 18.0%.
- For a 100-Year Return Period: The historical maximum acceleration of 0.2682 m/s2 increases to 0.2850 m/s2 and 0.3218 m/s2 in mid-future and late-future conditions, respectively, reflecting increases of 6.0% and 20.0%.
2.4. Validation of Simulation Results with Wind Tunnel Test
3. Fragility Analysis for Human Occupant Comfort
3.1. Occupant Comfort Criteria
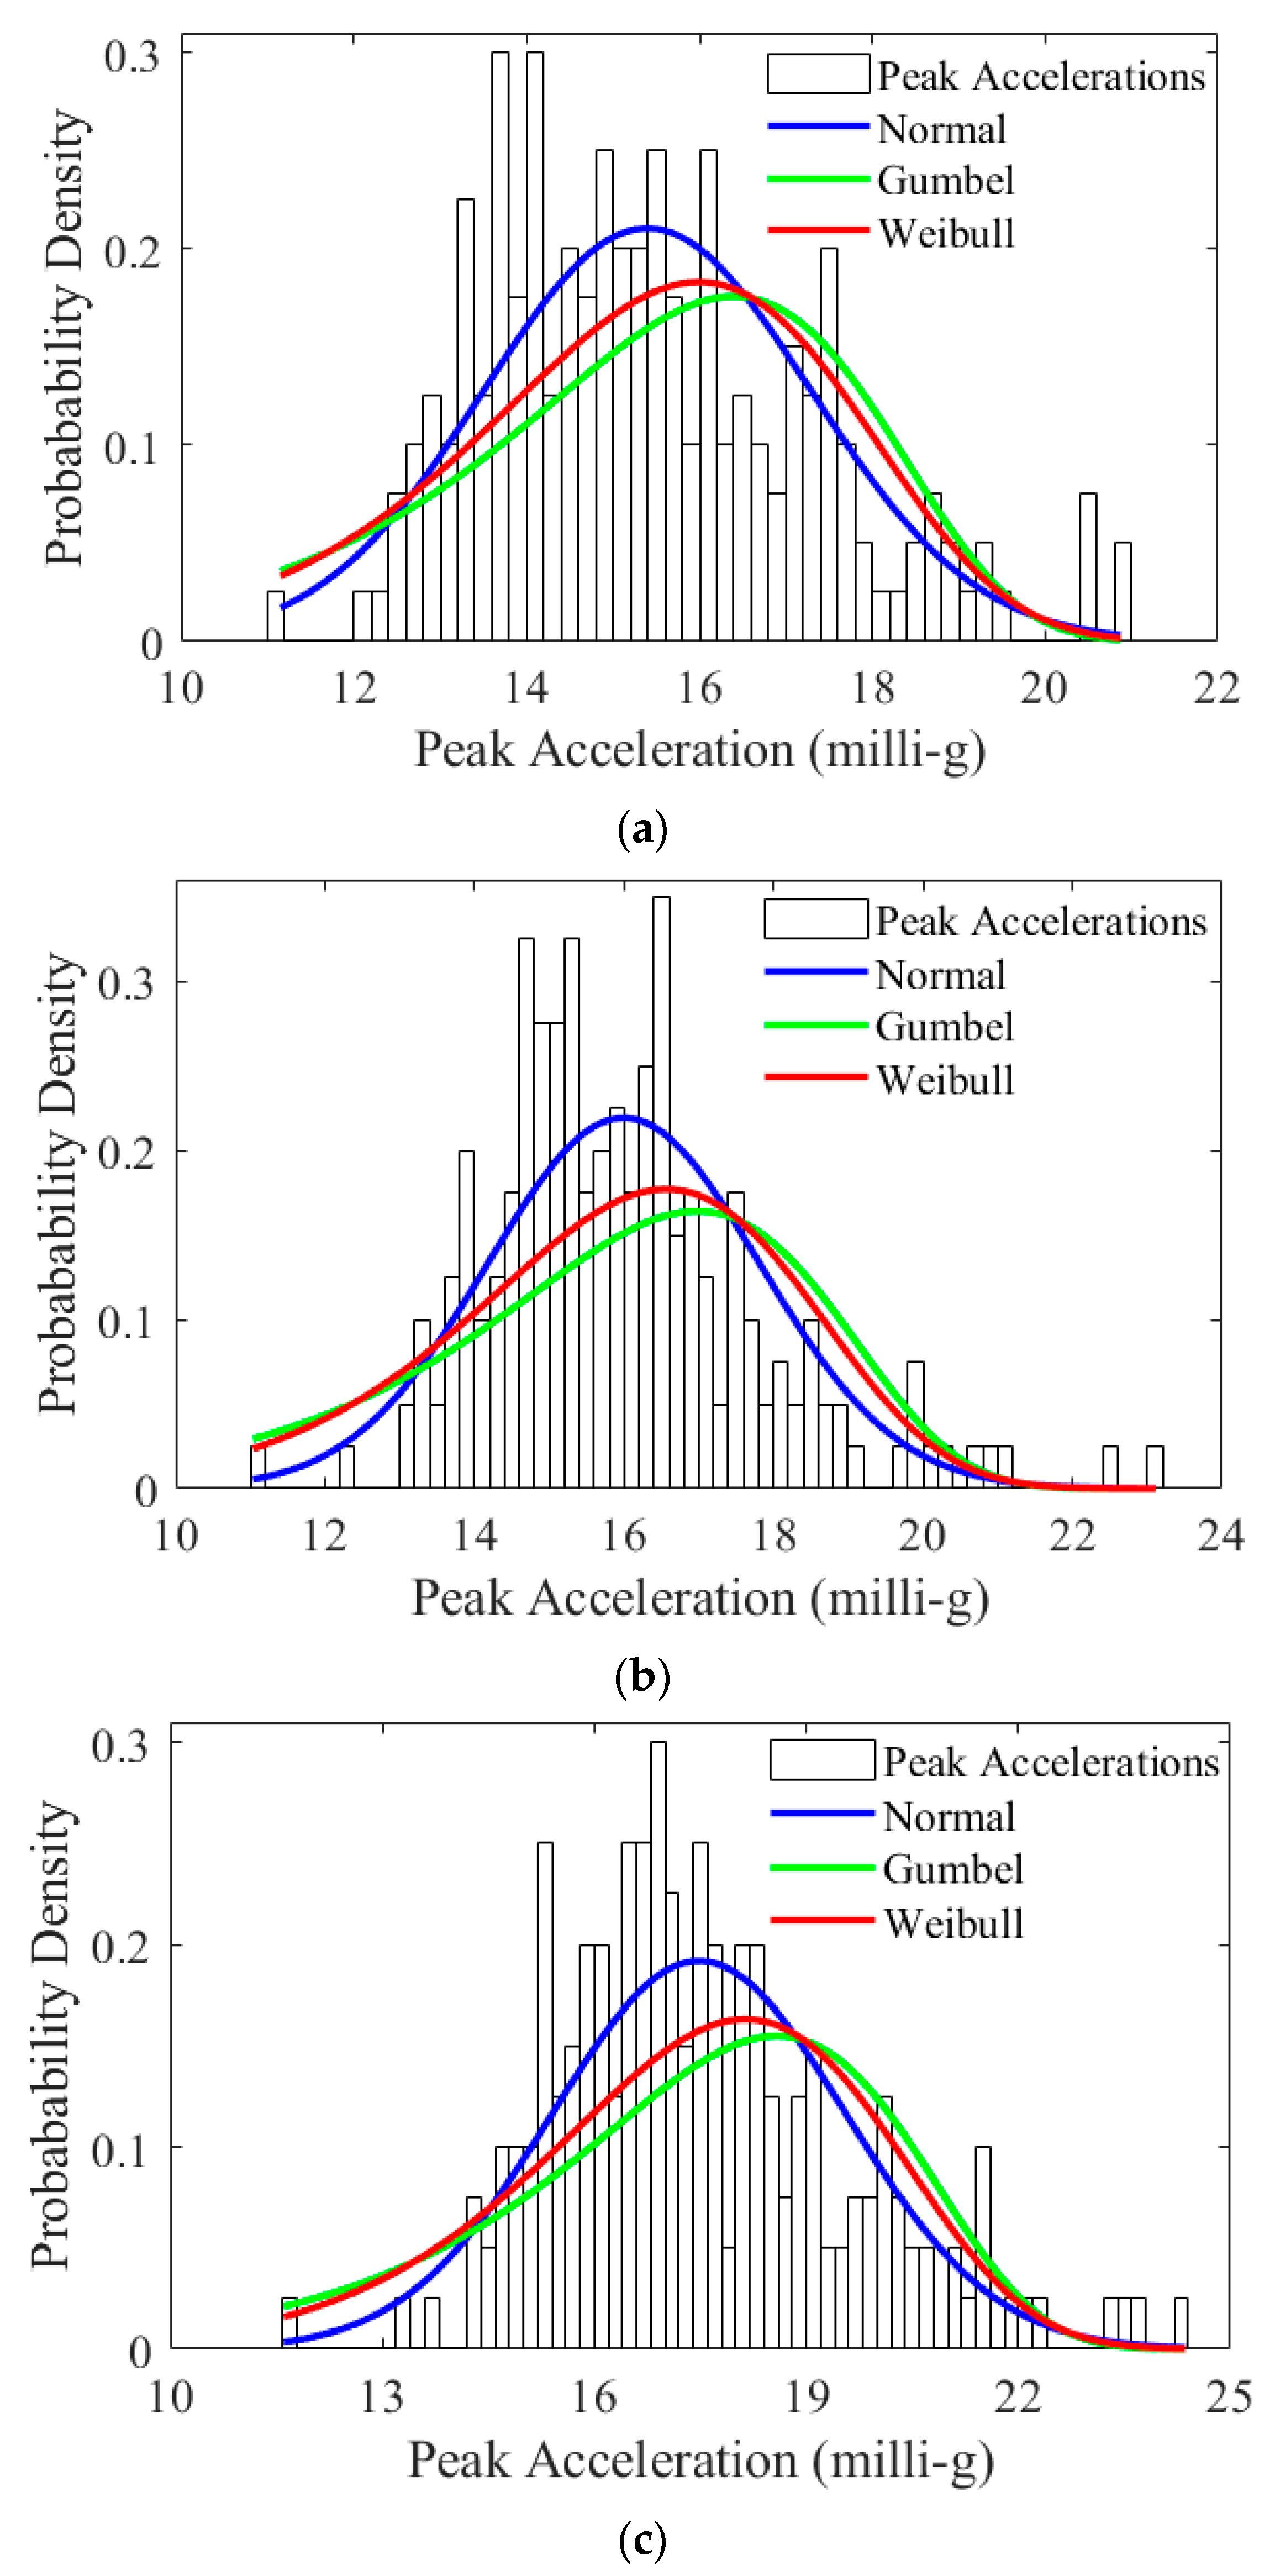
3.2. Probabilistic Assessment of Vibration Analysis
3.3. Uncertainties in Occupant Comfort Problems
3.4. Fragility Analysis Results and Discussions
4. Conclusions
Author Contributions
Funding
Institutional Review Board Statement
Informed Consent Statement
Data Availability Statement
Conflicts of Interest
References
- Sadh, A.; Pal, A. A Literature Study of Wind Analysis on High Rise Building. Int. J. Adv. Eng. Res. Sci. 2018, 5, 263–265. [Google Scholar] [CrossRef]
- Qin, L.; Zhu, L.; Liao, X.; Meng, C.; Han, Q.; Li, Z.; Shen, S.; Xu, W.; Chen, J. Recent Northward Shift of Tropical Cyclone Economic Risk in China. Nat. Hazards 2024, 1, 8. [Google Scholar] [CrossRef]
- Kim, G.; Cha, D.; Song, C.; Kim, H. Impacts of Anthropogenic Heat and Building Height on Urban Precipitation Over the Seoul Metropolitan Area in Regional Climate Modeling. JGR Atmos. 2021, 126, e2021JD035348. [Google Scholar] [CrossRef]
- Hill, K.A.; Lackmann, G.M. The Impact of Future Climate Change on TC Intensity and Structure: A Downscaling Approach. J. Clim. 2011, 24, 4644–4661. [Google Scholar] [CrossRef]
- Murakami, H.; Wang, Y.; Yoshimura, H.; Mizuta, R.; Sugi, M.; Shindo, E.; Adachi, Y.; Yukimoto, S.; Hosaka, M.; Kusunoki, S.; et al. Future Changes in Tropical Cyclone Activity Projected by the New High-Resolution MRI-AGCM. J. Clim. 2012, 25, 3237–3260. [Google Scholar] [CrossRef]
- Villarini, G.; Vecchi, G.A. Projected Increases in North Atlantic Tropical Cyclone Intensity from CMIP5 Models. J. Clim. 2013, 26, 3231–3240. [Google Scholar] [CrossRef]
- Webster, P.J.; Holland, G.J.; Curry, J.A.; Chang, H.-R. Changes in Tropical Cyclone Number, Duration, and Intensity in a Warming Environment. Science 2005, 309, 1844–1846. [Google Scholar] [CrossRef]
- Klotzbach, P.J. Trends in Global Tropical Cyclone Activity over the Past Twenty Years (1986–2005). Geophys. Res. Lett. 2006, 33, L10805. [Google Scholar] [CrossRef]
- Emanuel, K. Increasing destructiveness of tropical cyclones over the past 30 years. Nature 2005, 436, 686–688. [Google Scholar] [CrossRef]
- Holland, G.; Bruyère, C.L. Recent Intense Hurricane Response to Global Climate Change. Clim. Dyn. 2014, 42, 617–627. [Google Scholar] [CrossRef]
- Knutson, T.; Camargo, S.J.; Chan, J.C.L.; Emanuel, K.; Ho, C.-H.; Kossin, J.; Mohapatra, M.; Satoh, M.; Sugi, M.; Walsh, K.; et al. Tropical Cyclones and Climate Change Assessment: Part II: Projected Response to Anthropogenic Warming. Bull. Am. Meteorol. Soc. 2020, 101, E303–E322. [Google Scholar] [CrossRef]
- Intergovernmental Panel on Climate Change (IPCC). Summary for Policymakers. In Climate Change 2021—The Physical Science Basis: Working Group I Contribution to the Sixth Assessment Report of the Intergovernmental Panel on Climate Change; Cambridge University Press: Cambridge, UK; New York, NY, USA, 2023. [Google Scholar]
- Patricola, C.M.; Wehner, M.F. Anthropogenic Influences on Major Tropical Cyclone Events. Nature 2018, 563, 339–346. [Google Scholar] [CrossRef] [PubMed]
- Yamaguchi, M.; Chan, J.C.L.; Moon, I.-J.; Yoshida, K.; Mizuta, R. Global Warming Changes Tropical Cyclone Translation Speed. Nat. Commun. 2020, 11, 47. [Google Scholar] [CrossRef] [PubMed]
- Huang, M.; Wang, Q.; Jing, R.; Lou, W.; Hong, Y.; Wang, L. Tropical Cyclone Full Track Simulation in the Western North Pacific Based on Random Forests. J. Wind Eng. Indust. Aerodyn. 2022, 228, 105119. [Google Scholar] [CrossRef]
- Mei, W.; Xie, S.-P. Intensification of Landfalling Typhoons over the Northwest Pacific since the Late 1970s. Nat. Geosci. 2016, 9, 753–757. [Google Scholar] [CrossRef]
- Kang, N.-Y.; Elsner, J.B. Influence of Global Warming on the Rapid Intensification of Western North Pacific Tropical Cyclones. Environ. Res. Lett. 2019, 14, 044027. [Google Scholar] [CrossRef]
- Song, J.; Klotzbach, P.J.; Duan, Y. Increasing Lifetime Maximum Intensity of Rapidly Intensifying Tropical Cyclones over the Western North Pacific. Environ. Res. Lett. 2021, 16, 034002. [Google Scholar] [CrossRef]
- Architectural Institute of Japan Recommendations. Guidelines for the Evaluation of Habitability to Building Vibration; AIJ-GEH: Tokyo, Japan, 2004. [Google Scholar]
- ISO 10137; Serviceability of Buildings and Walkways Against Vibrations: Annex D. International Organization for Standardization: Geneva, Switzerland, 2007.
- Teran, A.S. A Computational Wind Engineering Framework for Studying Climate Change on High-Rise Buildings in Dense Urban Areas. Master’s Thesis, University of Toronto, Toronto, ON, Canada, 2020. [Google Scholar]
- Zhu, Y.-T.; Li, X.-Z.; Feng, D.-C. Wind-Induced Response Analysis for High-Rise Buildings Based on Time-Variant Speed Model Considering Climate Change. Multidiscip. J. Civ. Eng. 2025, 3, 04025004. [Google Scholar] [CrossRef]
- Zhu, H.; Yang, B.; Zhang, Q.; Pan, L.; Sun, S. Wind engineering for high-rise buildings: A review. Wind Struct. 2021, 32, 249–265. [Google Scholar]
- Sharma, A.; Mittal, H.; Gairola, A. Mitigation of Wind Load on Tall Buildings through Aerodynamic Modifications: Review. J. Build. Eng. 2018, 18, 180–194. [Google Scholar] [CrossRef]
- Hou, F.; Jafari, M. Investigation Approaches to Quantify Wind-Induced Load and Response of Tall Buildings: A Review. Sustain. Cities Soc. 2020, 62, 102376. [Google Scholar] [CrossRef]
- Toja-Silva, F.; Kono, T.; Peralta, C.; Lopez-Garcia, O.; Chen, J. A Review of Computational Fluid Dynamics (CFD) Simulations of the Wind Flow around Buildings for Urban Wind Energy Exploitation. J. Wind Eng. Indust. Aerodyn. 2018, 180, 66–87. [Google Scholar] [CrossRef]
- Fu, G.; Quan, Y.; Gu, M.; Huang, P. Experimental Investigation of Wind Effects on a 282-Meter-High Tower with Complex Aerodynamic Shapes Based on a Rigid Model and Multi-Degree-of-Freedom Aeroelastic Model. Structures 2023, 51, 25–41. [Google Scholar] [CrossRef]
- Ha, T.; Shin, S.-H.; Kim, H. Damping and Natural Period Evaluation of Tall RC Buildings Using Full-Scale Data in Korea. Appl. Sci. 2020, 10, 1568. [Google Scholar] [CrossRef]
- ASCE/SEI 7-22; Minimum Design Loads and Associated Criteria for Buildings and Other Structures. American Society of Civil Engineers: Reston, VA, USA, 2022.
- Chan, J.C.L. Frequency and Intensity of Landfalling Tropical Cyclones in East Asia: Past Variations and Future Projections. Meteorology 2023, 2, 171–190. [Google Scholar] [CrossRef]
- Chen, X.; Kareem, A. Coupled Dynamic Analysis and Equivalent Static Wind Loads on Buildings with Three-Dimensional Modes. J. Struct. Eng. 2005, 131, 1071–1082. [Google Scholar] [CrossRef]
- Yeo, D.; Simiu, E. High-Rise Reinforced Concrete Structures: Database-Assisted Design for Wind. J. Struct. Eng. 2011, 137, 1340–1349. [Google Scholar] [CrossRef]
- Huang, M.; Chan, C.-M.; Lou, W.; Bao, S. Time-Domain Dynamic Drift Optimisation of Tall Buildings Subject to Stochastic Wind Excitation. Struct. Infrastruct. Eng. 2015, 11, 97–111. [Google Scholar] [CrossRef]
- Huang, M.; Xu, Q.; Xu, H.; Ni, Y.; Kwok, K. Probabilistic Assessment of Vibration Exceedance for a Full-scale Tall Building under Typhoon Conditions. Struct. Des. Tall Build. 2018, 27, e1516. [Google Scholar] [CrossRef]
- Smith, M.A.; Caracoglia, L. A Monte Carlo Based Method for the Dynamic “Fragility Analysis” of Tall Buildings under Turbulent Wind Loading. Eng. Struct. 2011, 33, 410–420. [Google Scholar] [CrossRef]
- Hwang, J.; Hyun, L.S.; Cheol, H.Y. Time History Analysis of Building Structure Using Load Generation of Design Wind Load Spectrum. J. Wind Eng. 2015, 19, 43–49. [Google Scholar]
- Jeong, S.Y.; Alinejad, H.; Kang, T.H.-K. Performance-Based Wind Design of High-Rise Buildings Using Generated Time-History Wind Loads. J. Struct. Eng. 2021, 147, 04021134. [Google Scholar] [CrossRef]
- Micheli, L.; Hong, J.; Laflamme, S.; Alipour, A. Surrogate Models for High Performance Control Systems in Wind-Excited Tall Buildings. Appl. Soft Comput. 2020, 90, 106133. [Google Scholar] [CrossRef]
- GB50009-2012; Load Code for the Design of Building Structures. China Architecture and Building Press: Beijing, China, 2012.
- Shinozuka, M.; Deodatis, G. Simulation of Stochastic Processes by Spectral Representation. ASME Appl. Mech. Rev. 1991, 44, 191–204. [Google Scholar] [CrossRef]
- Deodatis, G. Simulation of Ergodic Multivariate Stochastic Processes. J. Eng. Mech. 1996, 122, 778–787. [Google Scholar] [CrossRef]
- Gu, M.; Quan, Y. Across-Wind Loads and Effects of Super-Tall Buildings and Structures. Sci. China Technol. Sci. 2011, 54, 2531–2541. [Google Scholar] [CrossRef]
- Huang, M.F.; Chan, C.M.; Kwok, K.C.; Hitchcock, P.A. Cross Correlations of Modal Responses of Tall Buildings in Wind-Induced Lateral-Torsional Motion. J. Eng. Mech. 2009, 135, 802–812. [Google Scholar] [CrossRef]
- Bashor, R.; Kareem, A. Probabilistic Performance Evaluation of Buildings: An Occupant Comfort Perspective. In Proceedings of the 12th International Conference of Wind Engineering, Cairns, Australia, 1–6 July 2007. [Google Scholar]
- Cimellaro, G.P.; Reinhorn, A.M. Multidimensional Performance Limit State for Hazard Fragility Functions. J. Eng. Mech. 2011, 137, 47–60. [Google Scholar] [CrossRef]
- Pozzuoli, C.; Bartoli, G.; Peil, U.; Clobes, M. Serviceability wind risk assessment of tall buildings including aeroelastic effects. J. Wind Eng. Indust. Aerodyn. 2013, 123, 325–338. [Google Scholar] [CrossRef]
- Kwok, K.C.S.; Hitchcock, P.A.; Burton, M.D. Perception of vibration and occupant comfort in wind-excited tall buildings. J. Wind Eng. Indust. Aerodyn. 2009, 97, 368–380. [Google Scholar] [CrossRef]
- Code of Practice on Wind Effects in Hong Kong 2019; Buildings Department: Kowloon, Hong Kong, 2019; Available online: https://studylib.net/doc/27271287/cop-wind-effects-in-hk-2019 (accessed on 27 March 2025).
- ISO 6897; Guidelines for the Evaluation of the Response of Occupants of Fixed Structures, Especially Buildings and Offshore Structures, to Low-Frequency Horizontal Motion (0.063 Hz to 1 Hz). International Organization for Standardization: Geneva, Switzerland, 1984.
- Wang, D.Y.; Zhang, Y.S.; Zhou, Y. Study on Occupant Comfort Evaluation Mode of Tall Buildings in Wind Excitation Based on Fuzzy Probability Method. Struct. Design Tall Spec. Build. 2017, 26, e1365. [Google Scholar] [CrossRef]
- Huang, M.F.; Chan, C.M.; Lou, W.J. Optimal performance-based design of wind sensitive tall buildings considering uncertainties. Comput. Struct. 2012, 98–99, 7–16. [Google Scholar] [CrossRef]


| Element Type | Section Type | Classification | Concrete Strength | Section Size | Quantity |
|---|---|---|---|---|---|
| Beams | Rectangular | 96 types | 30–60 Mpa | Various section sizes Width: 100 mm to 1350 mm Depth: 100 mm to 750 mm | 6715 |
| Columns | Rectangular | 3 types | 30 Mpa | 500 mm × 500 mm | 7 |
| 600 mm × 500 mm | 3 | ||||
| 600 mm × 600 mm | 3 | ||||
| Circular | 9 types | 30–60 Mpa | Diameter 800 mm | 43 | |
| Diameter 850 mm | 67 | ||||
| Walls | Thickness | 79 types | 30–60 Mpa | Various thickness: from 400 mm to 1000 mm | 5862 |
| Mode | Time Period (s) | Frequency (Hz) | Direction | Damping Ratio |
|---|---|---|---|---|
| 1 | 3.3841 | 0.2955 | Translation in the Y-direction | 2% |
| 2 | 3.2268 | 0.3099 | Translation in the X-direction | |
| 3 | 2.7755 | 0.3603 | Rz Torsion |
| Case | Return Period | 10-Year | 50-Year | 100-Year |
|---|---|---|---|---|
| Historical climate | Historical (1979–2015) | 24.9 | 30.6 | 32.2 |
| Future climate | Mid-future (2019–2055) | 25.3 | 31.6 | 33.3 |
| Late-future (2064–2100) | 26.4 | 32.5 | 34.4 |
| Location | Floor | Height (m) | Drag Coefficients, Cd |
|---|---|---|---|
| 1 | 48 | 151.8 | 1.2572 |
| 2 | 47 | 148.8 | 1.2572 |
| 3 | 46 | 145.8 | 1.2572 |
| 4 | 45 | 142.3 | 1.2572 |
| 5 | 44 | 139.15 | 1.2572 |
| 6 | 43 | 136 | 1.2572 |
| 7 | 40 | 126.55 | 1.2572 |
| 8 | 37 | 117.1 | 1.2491 |
| 9 | 34 | 107.65 | 1.2307 |
| 10 | 31 | 98.2 | 1.211 |
| 11 | 28 | 88.7 | 1.1899 |
| 12 | 25 | 79.25 | 1.1673 |
| 13 | 23 | 72.95 | 1.1511 |
| 14 | 19 | 60.35 | 1.1156 |
| 15 | 16 | 50.9 | 1.0854 |
| 16 | 13 | 41.4 | 1.0508 |
| 17 | 10 | 31.95 | 1.0103 |
| 18 | 7 | 22.5 | 0.9602 |
| 19 | 4 | 13.05 | 0.8922 |
| 20 | 1 | 3.6 | 0.8628 |
| Return Period | Wind Cases | Accelerations (m/s2) | |||
|---|---|---|---|---|---|
| amax,y | amin,y | amax,x | amin,x | ||
| 10-year | Historical | 0.1550 | −0.1486 | 0.0072 | −0.0071 |
| Mid-future | 0.1674 | −0.1690 | 0.0087 | −0.0086 | |
| Late-future | 0.1708 | −0.1695 | 0.0094 | −0.0093 | |
| 50-year | Historical | 0.2319 | −0.2188 | 0.0118 | −0.0119 |
| Mid-future | 0.2483 | −0.2466 | 0.0137 | −0.0137 | |
| Late-future | 0.2732 | −0.2705 | 0.0153 | −0.0151 | |
| 100-year | Historical | 0.2682 | −0.2655 | 0.0150 | −0.0148 |
| Mid-future | 0.2850 | −0.2792 | 0.0170 | −0.0171 | |
| Late-future | 0.3218 | −0.3016 | 0.0186 | −0.0184 | |
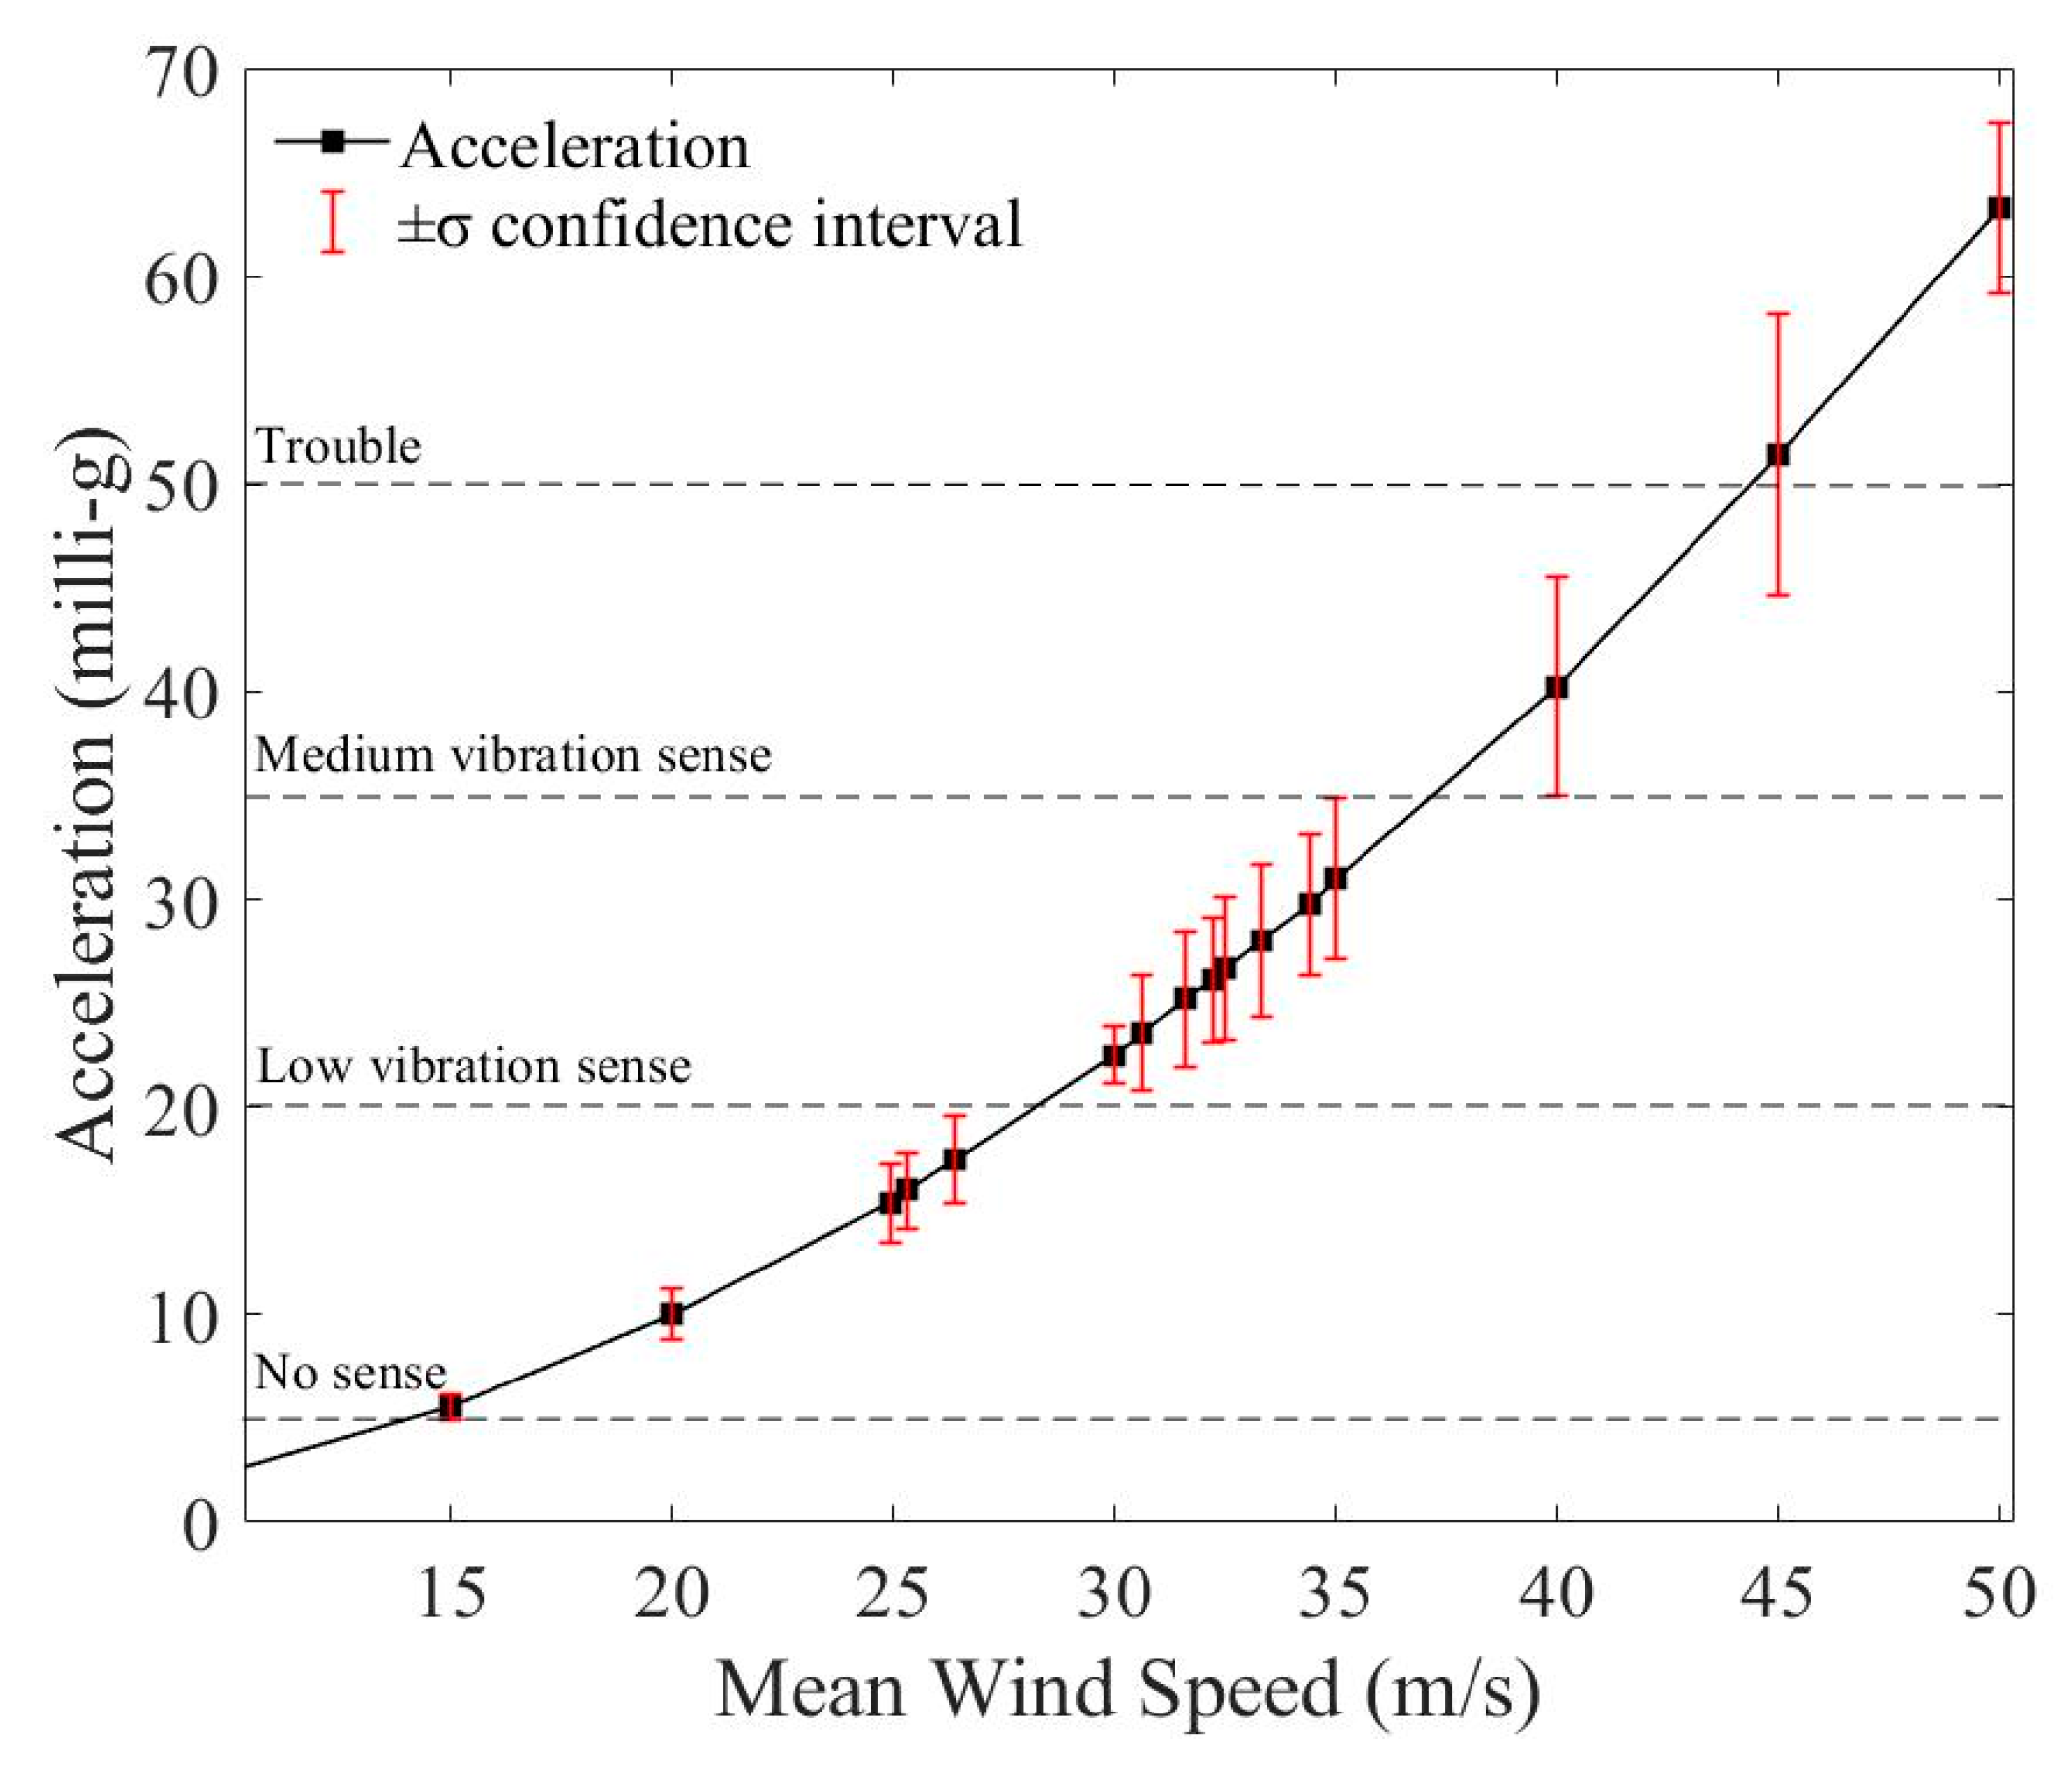
| Level | Human Subjective Response | Peak Acceleration Limit (milli-g) |
|---|---|---|
| I | No sense | ≤5 |
| II | Low vibration sense | 5–20 |
| III | Medium vibration sense | 20–35 |
| IV | Trouble | 35–50 |
| V | Very Trouble | 50–150 |
| VI | Intolerable | ≥150 |
| Random Variables | Distribution Type | Wind Cases | Mean | Standard Deviation | COV |
|---|---|---|---|---|---|
| Wind speed (m/s) | Gumbel distribution | Historical 10-year | 24.9 | 1.245 | 0.05 |
| Mid-future 10-year | 25.3 | 1.265 | 0.05 | ||
| Late-future 10-year | 26.4 | 1.320 | 0.05 | ||
| Historical 50-year | 30.6 | 1.530 | 0.05 | ||
| Mid-future 50-year | 31.6 | 1.580 | 0.05 | ||
| Late-future 50-year | 32.5 | 1.625 | 0.05 | ||
| Historical 100-year | 32.2 | 1.610 | 0.05 | ||
| Mid-future 100-year | 33.3 | 1.665 | 0.05 | ||
| Late-future 100-year | 34.4 | 1.720 | 0.05 | ||
| Damping ratio | Lognormal distribution | All wind scenarios | 0.02 | 0.003 | 0.15 |
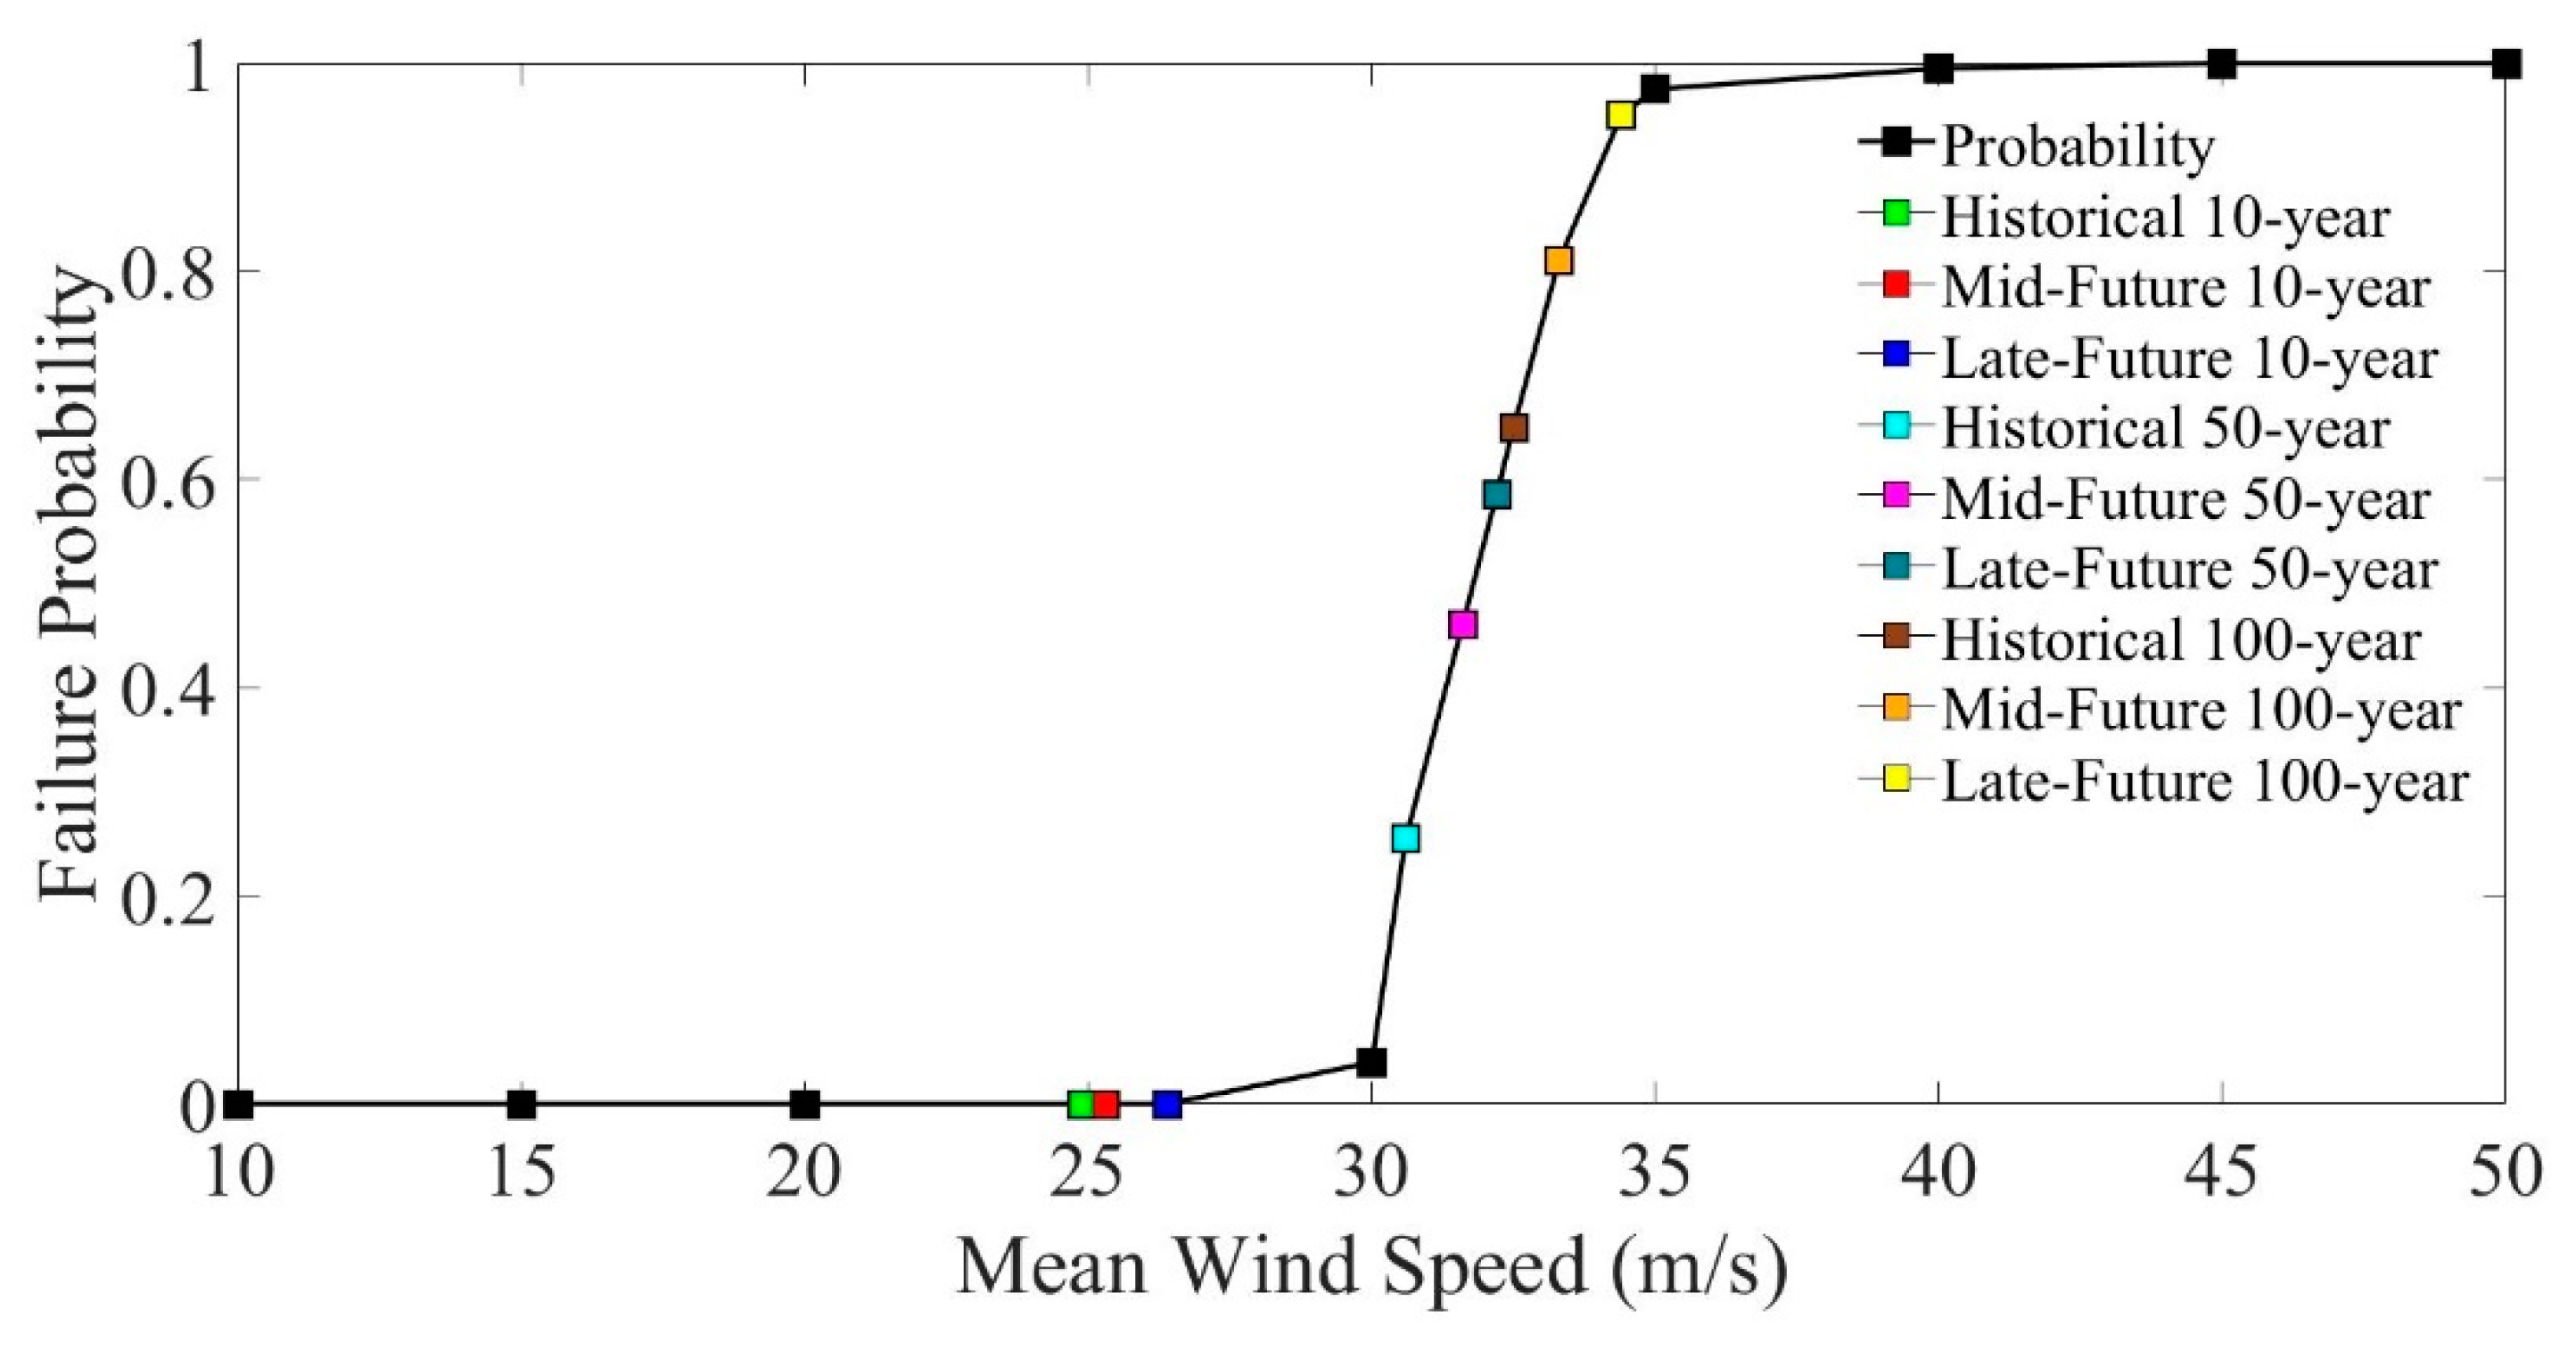
| Return Period | Wind Cases | Normal Distribution | Failure Probability (%) | ||
|---|---|---|---|---|---|
| Mean (mlli-g) | Standard Deviation (mlli-g) | COV (%) | |||
| 10-year | Historical | 15.3973 | 1.8958 | 12.3125 | 0 |
| Mid-future | 15.9956 | 1.8201 | 11.3787 | 0 | |
| Late-future | 17.4820 | 2.0793 | 11.8939 | 0 | |
| 50-year | Historical | 23.5594 | 2.7594 | 11.7125 | 25.50 |
| Mid-future | 25.2051 | 3.2753 | 12.9945 | 46.00 | |
| Late-future | 26.6818 | 3.3870 | 12.6940 | 65.00 | |
| 100-year | Historical | 26.1526 | 3.0134 | 11.5223 | 58.50 |
| Mid-future | 28.0376 | 3.6689 | 13.0856 | 81.00 | |
| Late-future | 29.7324 | 3.3611 | 11.3045 | 95.00 | |
Disclaimer/Publisher’s Note: The statements, opinions and data contained in all publications are solely those of the individual author(s) and contributor(s) and not of MDPI and/or the editor(s). MDPI and/or the editor(s) disclaim responsibility for any injury to people or property resulting from any ideas, methods, instructions or products referred to in the content. |
© 2025 by the authors. Licensee MDPI, Basel, Switzerland. This article is an open access article distributed under the terms and conditions of the Creative Commons Attribution (CC BY) license (https://creativecommons.org/licenses/by/4.0/).
Share and Cite
Gora, A.; Huang, M.; Wang, C.; Zhang, R. Wind-Induced Dynamic Performance Evaluation of Tall Buildings Considering Future Wind Climate. Appl. Sci. 2025, 15, 5073. https://doi.org/10.3390/app15095073
Gora A, Huang M, Wang C, Zhang R. Wind-Induced Dynamic Performance Evaluation of Tall Buildings Considering Future Wind Climate. Applied Sciences. 2025; 15(9):5073. https://doi.org/10.3390/app15095073
Chicago/Turabian StyleGora, Anita, Mingfeng Huang, Chunhe Wang, and Ruoyu Zhang. 2025. "Wind-Induced Dynamic Performance Evaluation of Tall Buildings Considering Future Wind Climate" Applied Sciences 15, no. 9: 5073. https://doi.org/10.3390/app15095073
APA StyleGora, A., Huang, M., Wang, C., & Zhang, R. (2025). Wind-Induced Dynamic Performance Evaluation of Tall Buildings Considering Future Wind Climate. Applied Sciences, 15(9), 5073. https://doi.org/10.3390/app15095073