Article

Causal Inference-Based Self-Supervised Cross-Domain Fundus Image Segmentation

by
Qiang Li
1,
Qiyi Zhang
1,
Zheqi Zhang
2,
Hengxin Liu
1,* and
Weizhi Nie
2
1
School of Microelectronics, Tianjin University, Tianjin 300072, China
2
School of Electrical and Information Engineering, Tianjin University, Tianjin 300072, China
*
Author to whom correspondence should be addressed.
Appl. Sci. 2025, 15(9), 5074; https://doi.org/10.3390/app15095074
Submission received: 27 March 2025 / Revised: 27 April 2025 / Accepted: 30 April 2025 / Published: 2 May 2025

Abstract

:
Accurate glaucoma diagnosis relies on precise segmentation of the optic disc (OD) and optic cup (OC) in retinal images. However, despite the development of numerous automatic segmentation models, the lack of annotations in the target domain and domain shift among datasets continue to limit their segmentation performance. To address these issues, we propose a Causal Self-Supervised Network (CSSN) that leverages self-supervised learning to enhance model performance. First, we construct a Structural Causal Model (SCM) and employ backdoor adjustment to convert the conventional conditional distribution into an interventional distribution, effectively severing the influence of style information on feature extraction and pseudo-label generation. Subsequently, the low-frequency components of source and target domain images are exchanged via Fourier transform to simulate cross-domain style transfer. The original target images and their style-transferred counterparts are then processed by a dual-path segmentation network to extract their respective features, and a confidence-based pseudo-label fusion strategy is employed to generate more reliable pseudo-labels for self-supervised learning. In addition, we employ adversarial training and cross-domain contrastive learning to further reduce style discrepancies between domains. The former aligns feature distributions across domains using a feature discriminator, effectively mitigating the adverse effects of style inconsistency, while the latter minimizes the feature distance between original and style-transferred images, thereby ensuring structural consistency. Experimental results demonstrate that our method achieves more accurate OD and OC segmentation in the target domain during testing, thereby confirming its efficacy in cross-domain adaptation tasks.

1. Introduction

Glaucoma is the world’s second leading cause of blindness [1], with its primary pathologic mechanism attributed to the degeneration of retinal ganglion cells. Without timely intervention, the progressive damage to the optic nerve can result in irreversible vision loss. However, early screening and prompt treatment can significantly reduce these risks. The cup-to-disc ratio (CDR)—defined as the ratio of the vertical cup diameter (VCD) to the vertical disc diameter (VDD)—is a widely used diagnostic indicator for glaucoma, as a higher CDR often signals an increased risk of the disease. Given that manually delineating the optic disc (OD) and optic cup (OC) and computing the CDR is both time-consuming and labor-intensive, there is an urgent need for research into automated segmentation methods to improve the efficiency and accuracy of glaucoma diagnosis.
In traditional methods for automatic segmentation of the OD and OC, a variety of approaches have been proposed, including active contour models [2,3], Hough-transform-based detection [2,4,5], morphological operations [6,7], weakly supervised techniques [8], among others. For example, Mary et al. [2] proposed a cascaded pipeline in which the red channel is first enhanced by adaptive histogram equalization and subjected to morphological vessel removal and binarization; a circular Hough transform then generates initial disc contours, which are iteratively evolved under the gradient vector flow (GVF) energy functional to accurately delineate the disc boundary. Zhu et al. [5] described a similar pipeline that converts fundus images to a luminance representation for artifact removal, extracts edges via Sobel or Canny operators, detects circular candidates via the Hough transform, and refines them by intensity thresholding to precisely locate the disc. Welfer et al. [6] designed a two-stage adaptive morphological framework: in Stage 1, vessel skeletonization—using reconstruction, top-hat filtering and skeletonization—localizes the disc region; in Stage 2, a marker-controlled watershed transform adaptively segments the exact boundary. Choukikar et al. [9] converted color retina images to grayscale with histogram equalization, performed multilevel thresholding followed by morphological erosion and dilation to extract boundary candidates, and then fitted a circle to the resulting points to determine the disc center and radius.
However, these traditional approaches typically depend on handcrafted feature extraction, heuristic processing pipelines, and domain-specific parameter tuning, which render them sensitive to image artifacts, inter-patient variability, and inconsistent acquisition conditions. With the advent of deep learning, convolutional neural networks and related architectures have been widely adopted for OD and OC segmentation, learning hierarchical feature representations directly from data and demonstrating superior robustness and accuracy.
Although numerous deep learning–based automated segmentation models have achieved excellent performance in segmenting OD and OC, most rely on training with labeled source-domain images. In practical applications, target-domain images are typically unlabeled, and variations in imaging equipment and acquisition conditions introduce a significant distribution discrepancy between source and target domains, resulting in a marked decline in conventional models’ target-domain performance. While assembling a fundus-image dataset that encompasses all domain styles could enable the model to adapt to diverse styles and thereby mitigate the effects of domain shift, such an undertaking is extremely time-consuming, labor-intensive, and demands substantial additional computational resources. Consequently, recent studies have explored domain adaptation techniques to enhance the generalization ability of cross-domain segmentation. However, existing methods [10,11,12,13,14] suffer from two major limitations: first, they predominantly utilize labeled source-domain data for supervision, lacking effective constraints on unlabeled images; second, the use of a shared network for processing images from different domains makes it challenging to completely eliminate interference caused by domain style differences.
To tackle the issue of domain style interference in cross-domain segmentation, we propose a self-supervised cross-domain segmentation method based on causal inference. First, to generate more reliable pseudo-labels, we introduce a causal inference strategy. By constructing a structural causal model (SCM), we explicitly delineate the causal relationships among target images, feature maps, domain style interference, and prediction outcomes, and employ a back-door adjustment strategy to sever the confounding pathways introduced by domain style. This converts the conditional distribution of pseudo-label generation into an interventional distribution, thereby enhancing the reliability of the generated pseudo-labels and providing robust support for subsequent model training. In this process, we utilize the Fourier transform to achieve style transformation between source and target domain images, simulating the stratification operation in back-door adjustment so that the model can fully account for interference under different domain styles. Moreover, we design a dual-path segmentation network that processes source and target domain style images separately, ensuring that each network exclusively extracts features corresponding to a single domain style, thus further mitigating the adverse effects of domain style interference. In addition, we incorporate adversarial learning and cross-domain contrastive learning strategies. Through adversarial training, the model can align the feature representations of original and style-transferred images, thereby effectively narrowing the visual gap between domains and mitigating the adverse effects of style discrepancies on segmentation performance. Meanwhile, cross-domain contrastive learning minimizes the distance between positive sample pairs, thereby reinforcing the structural consistency between images of different styles. These strategies not only help to further reduce domain style interference but also enhance the model’s generalization capability on cross-domain data.
Our main contributions can be summarized as follows:
  • We propose a causal inference-based pseudo-label fusion module for self-supervised learning that effectively reduces domain style bias and imposes constraints on target domain images.
  • We introduce adversarial learning [15,16] and cross-domain contrastive learning mechanisms, which reduce the distribution discrepancy between source and target domains.
  • We conduct extensive experiments on three publicly available datasets, and the results fully demonstrate the effectiveness of the proposed modules as well as a significant improvement in overall performance.

2. Related Works

Currently, deep learning models have been widely applied in the medical field [17,18,19,20], which has led to the development of numerous automatic segmentation networks for the OD and OC. Fu et al. [21] designed an end-to-end multi-label deep network (M-Net) that jointly segments the OD and OC through a multi-scale U-Net architecture with side-output layers, while incorporating a polar transformation to enhance spatial constraints and balance the data, thereby improving the accuracy of the cup-to-disc ratio for glaucoma screening.
However, due to domain shift phenomena that may degrade model performance, researchers have begun to incorporate domain adaptation methods to alleviate the interference caused by distribution discrepancies across different domains. For instance, Wang et al. [10] designed a patch-based output space adversarial learning (pOSAL) framework, which addresses the domain adaptation problem by combining morphology-aware segmentation loss with patch-level adversarial learning. Liu et al. [22] designed the CFEA network that simultaneously applies adversarial losses at multiple levels in both the encoder and decoder to extract domain-invariant features; it further incorporates a self-ensembling mechanism by building a teacher network based on historical predictions to guide the training of the student network, thereby achieving temporal smoothing. Chen et al. [12] designed an IOSUDA framework that, in the input space, employs image translation to decompose images into shared content features and domain-specific style features, and in the output space, utilizes adversarial learning to enforce consistency in segmentation results. Xu et al. [14] proposed a domain adaptation network named MeFDA, which enhances prediction confidence in the target domain via both direct and adversarial entropy minimization and improves semantic consistency between the source and target domains by exchanging low-frequency information through Fourier transform. He et al. [23] designed a self-ensembling-based model that jointly extracts mask and boundary information, enforcing their consistency with a mask-boundary segmentation loss; simultaneously, they adopted an output-level adversarial domain adaptation technique to align the prediction results of the source and target domains.
Recently, some studies have begun to explore the use of causal inference methods to address the challenges posed by domain shift. Chen et al. [24] designed the CIADA method, which constructs a causal graph for the source and target domain data using a constraint-based PC algorithm and performs feature classification and mapping based on causal influences; subsequently, graph structure and temporal sequence features are extracted via a two-dimensional processing approach, and finally, an adversarial domain adaptation and fine-tuning strategy is employed to build the detection model.

3. Methods

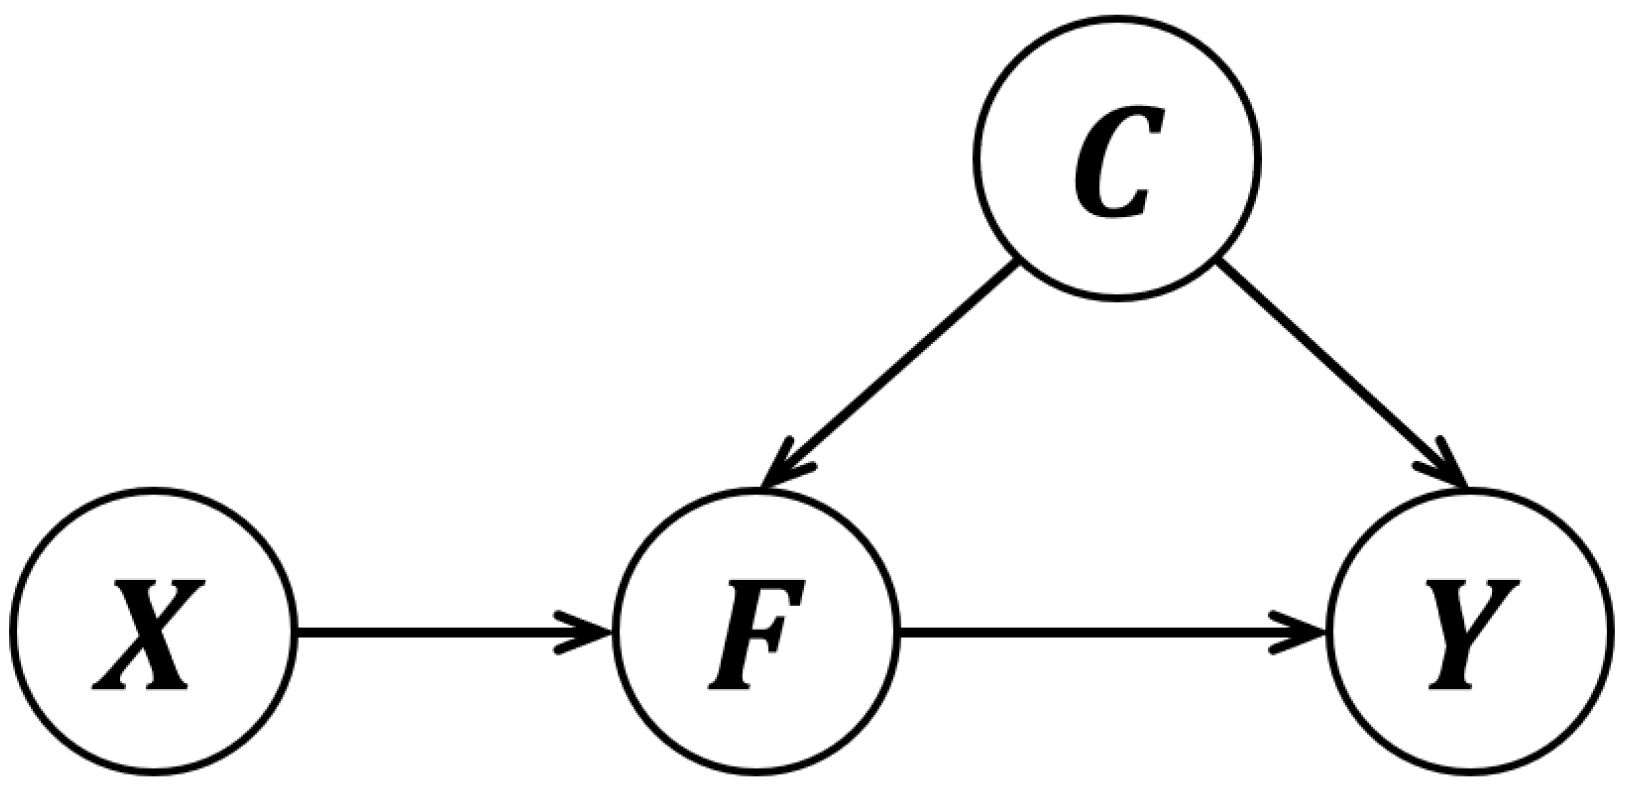
3.1. Causal Inference

In the self-supervised cross-domain fundus image segmentation task, the model is primarily supervised by source-domain images and their corresponding labels. However, as illustrated in Figure 1, the same sample can exhibit substantial visual differences under different domain styles, and this style-induced variation inevitably perturbs the training process, introducing systematic biases into pseudo-label generation. Specifically, during feature extraction, the model may capture intrinsic style noise from images in a particular domain, leading to biased pseudo-labels and ultimately degrading segmentation performance.
To mitigate this confounding effect, we conducted a causal analysis of the task and constructed a corresponding SCM, as illustrated in Figure 2. This model comprises four variables: the target domain image X, the feature map F extracted from the target domain image, the interference information C induced by domain style, and the segmentation result Y. In this causal graph, the arrow X F indicates that the feature map F is extracted from the target domain image X, while the arrow F Y signifies that the pseudo-label Y is generated based on the feature F. Moreover, C { F , Y } shows that the domain style shift interferes with both the feature extraction process and the pseudo-label generation, thereby acting as a confounding factor.
Due to the existence of a backdoor path, directly generating pseudo-labels using the conditional probability P ( Y F ) leads to bias. Therefore, we adopt a causal intervention approach to cut off the backdoor path and eliminate the confounding effect, replacing the conditional distribution with the interventional distribution P ( Y d o ( F ) ) for pseudo-label generation. To accurately compute P ( Y d o ( F ) ) , we intervene on F so as to sever its causal connections with all non-descendant nodes, thereby ensuring that the remaining causal pathways faithfully reflect the relationship P ( Y d o ( F ) ) .
In this process, we assume that the confounder C can be observed and stratified; in our context, the set C represents the domain style information from both the source and target domains. To this end, we introduce the Fourier transform to simulate such stratification—by exchanging the low-frequency components between the source and target domain images, we effectively strip away the confounding domain style components. Subsequently, both the intrinsic feature map extracted from the target domain image and the feature map obtained after applying a source-domain style transformation are concurrently fed into the pseudo-label generation module to produce pseudo-labels based on causal inference.
Based on the above analysis, the backdoor adjustment can be expressed as:
P ( Y d o ( F ) ) = c C P ( Y F , c ) P ( c F ) = c C P ( Y F , c ) P ( c )
where P ( Y F , c ) denotes the conditional probability of generating the pseudo-label Y given the feature F and the confounding factor c, and P ( c ) represents the marginal distribution of the confounder.

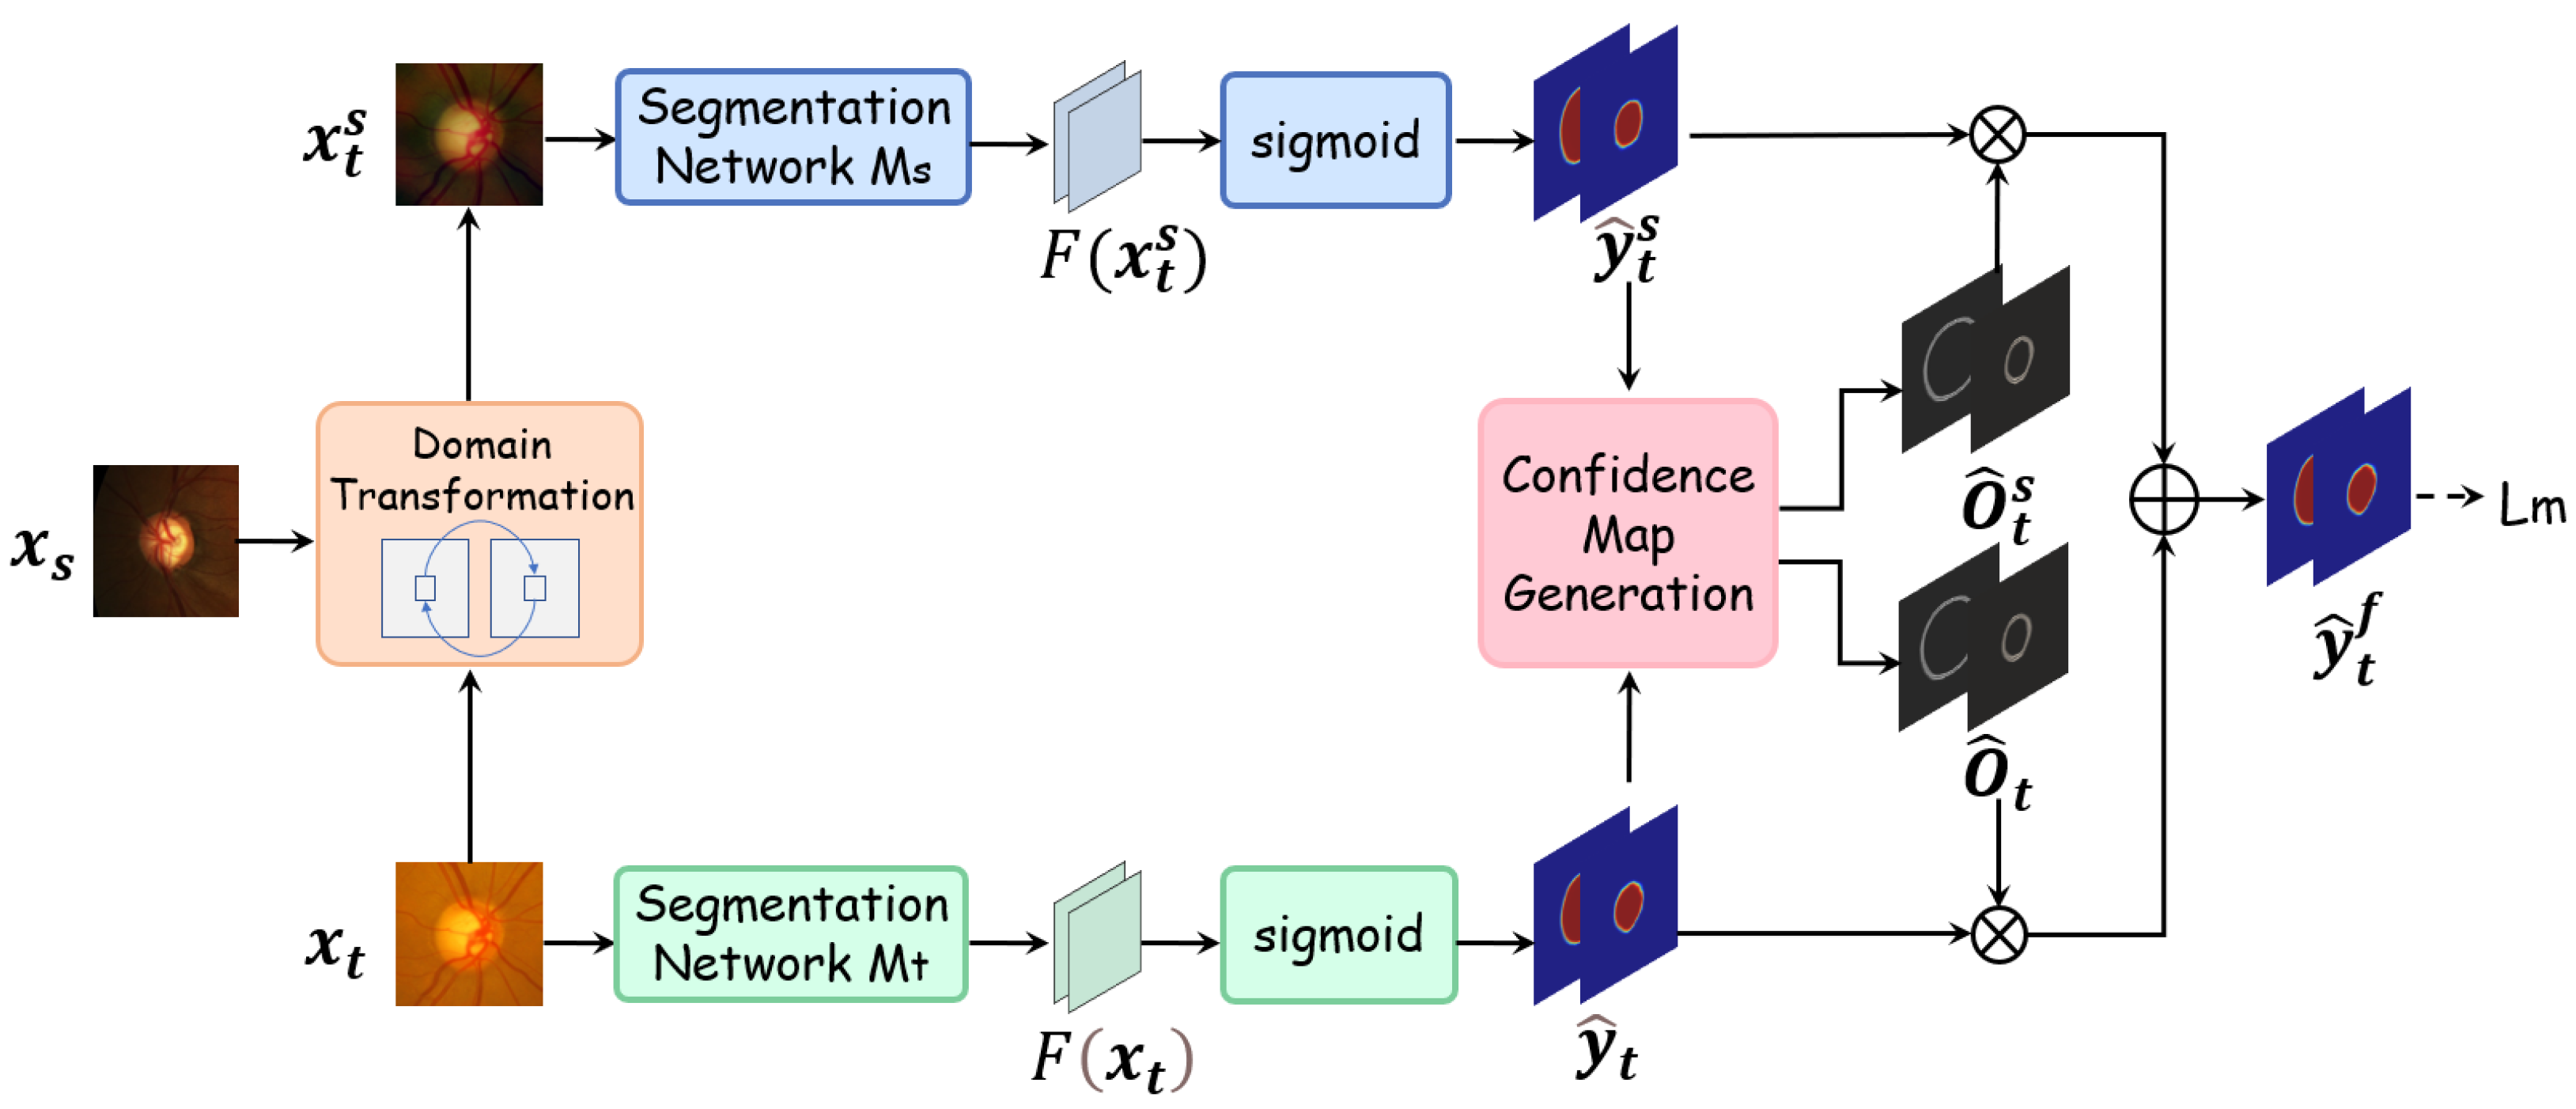
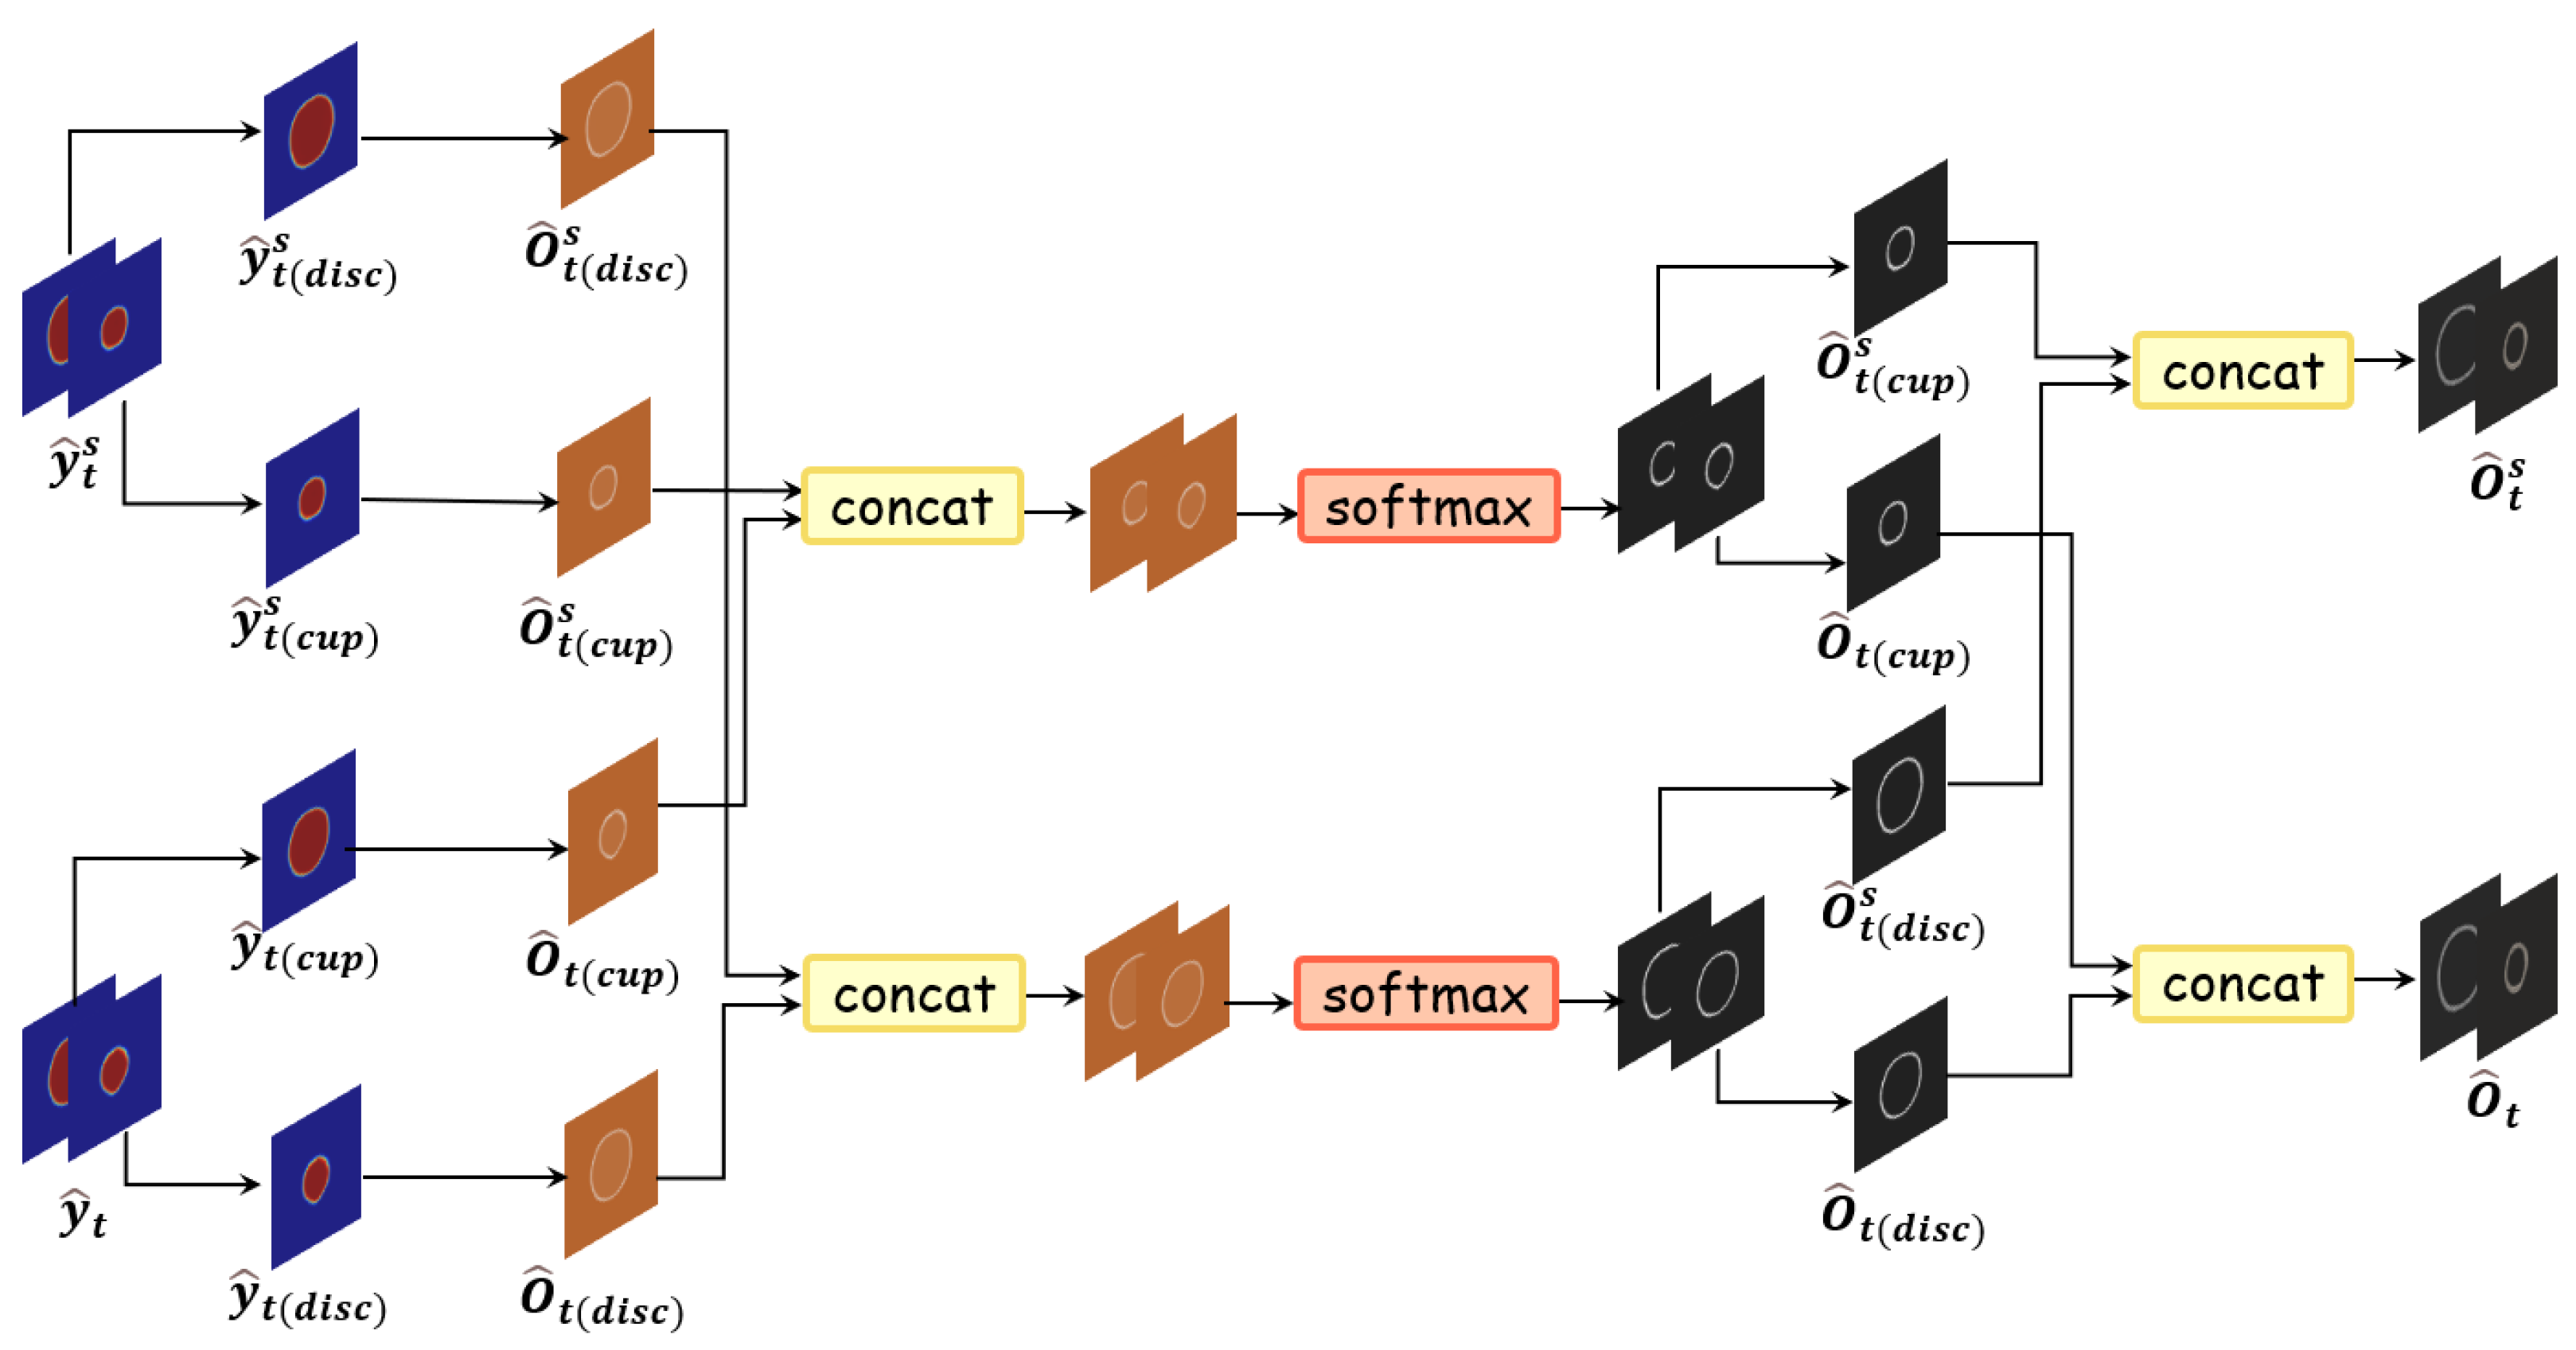
3.2. Causal Inference-Based Pseudo-Label Fusion Module

Based on the above causal inference strategy, we apply Fourier transform to the target-domain images for style transfer. As noted in [14], the low-frequency components of an image generally capture properties such as background, illumination, and other style-related attributes. Therefore, by replacing the low-frequency components of the original image with those obtained via Fourier transform, we can achieve an approximate image-domain transformation.
First, we denote the Fast Fourier Transform (FFT) [25] by F ou ( · ) , and its inverse by F ou 1 ( · ) . In our algorithm, we apply FFT to each image to obtain its spectra (amplitude spectrum f am ( x ) and phase spectrum f ph ( x ) ):
f am ( x s ) , f ph ( x s ) = F ou x s , f am ( x t ) , f ph ( x t ) = F ou x t
During training, we randomly select a source-domain image x s and a target-domain image x t , and replace the low-frequency part of f am ( x t ) with that of f am ( x s ) to obtain the style-transferred image x t s . Specifically, we treat the center of the amplitude spectrum as the zero-frequency point, and construct a square window α of side length a centered at this point. We then remove the contents of f am ( x t ) within α and fill them with the corresponding contents of f am ( x s ) , resulting in the modified amplitude spectrum f am ( x t s ) . Finally, by combining f am ( x t s ) with the original phase spectrum f ph ( x t ) and applying the inverse FFT, we obtain the style-transferred image:
x t s = F ou 1 f am ( x t s ) , f ph ( x t )
The resulting image x t s retains the ground-truth segmentation mask of the original target-domain image x t , while its domain gap relative to the source-domain image x s is significantly reduced, making it effectively aligned with the source domain.
This operation is analogous to the stratification process in backdoor adjustment, where different domain styles are considered separately. Next, we feed the source-style transformed image x t s and the original target domain image x t into two segmentation networks that share the same backbone architecture (DeepLabV3+ [26]) but do not share weights, thereby obtaining their corresponding feature maps. This design effectively decouples the feature extraction process under different domain styles, which better implements the stratification and more accurately reflects the relationship of P ( Y d o ( F ) ) .
In terms of backbone architecture, we adopt MobileNetV2 [27]—pretrained on ImageNet—as the encoder within DeepLabV3+. MobileNetV2’s core building block is the inverted residual: a 1 × 1 convolution first expands the low-dimensional input features to a higher dimension, followed by a 3 × 3 depthwise separable convolution for spatial filtering, and finally a 1 × 1 projection back to the original channel dimensionality. When the input and output channels match, a residual connection is applied, which mitigates gradient vanishing and feature degradation while dramatically reducing both parameter count and computational cost. This lightweight feature extractor therefore strikes an effective balance between representational capacity and inference speed, particularly well suited to medical imaging tasks with limited data and constrained hardware resources.
Built upon this encoder, DeepLabV3+ incorporates an Atrous Spatial Pyramid Pooling (ASPP) module that applies parallel atrous convolutions at multiple dilation rates to capture contextual information from local to global scales without sacrificing feature-map resolution. Its lightweight decoder then fuses shallow, high-resolution feature maps with the ASPP outputs and employs depthwise separable transposed convolutions for upsampling, thereby refining boundary details. This backbone design achieves a harmonious trade-off between multi-scale adaptability, high-fidelity edge recovery, and computational efficiency, effectively addressing the large scale variations and fine boundary requirements inherent to OD/OC segmentation.
After obtaining the feature maps from both the target domain image and its source-style transformed counterpart, we proceed to generate pseudo-labels using these features. The structure of the pseudo-label generation module is shown in Figure 3. In this figure, the dashed arrow denotes that the maximum-square loss L m is applied to the fused pseudo-label y ^ t f during training.
In this process, we also introduce a confidence-based mechanism to enhance the reliability of the pseudo-labels. First, for the prediction outputs of the segmentation network M s (or M t ), we compute the confidence for each pixel; then, we fuse the resulting confidence maps obtained from the same image (e.g., x t and x t s ) and perform pixel-level normalization.
It is important to note that y ^ t comprises the OD prediction probability map y ^ t ( disc ) and the OC prediction probability map y ^ t ( cup ) , whereas y ^ t s consists of y ^ t ( disc ) s and y ^ t ( cup ) s . Accordingly, we compute the confidence maps for these four probability maps—denoted as O ^ t ( disc ) , O ^ t ( disc ) s , O ^ t ( cup ) , and O ^ t ( cup ) s —and then concatenate O ^ t ( disc ) with O ^ t ( disc ) s and feed the result into a softmax layer for normalization. The computation process is illustrated in Figure 4. An analogous operation is performed for O ^ t ( cup ) and O ^ t ( cup ) s . The resulting normalized confidence maps O ^ t and O ^ t s are then used to weight the corresponding probability maps and produce the pixel-wise pseudo-label y ^ t f , which serves as the self-supervision target in the target-domain segmentation loss.
Moreover, because there is an imbalance in the prediction probabilities among different classes (in fundus images, the OD region typically surrounds the OC region and the boundary of the OD is more distinct), the OD class tends to exhibit higher prediction confidence, which may lead to bias during training. To mitigate this bias and further enhance the reliability of the fused pseudo-label y ^ t f , we incorporate the Max-square loss [28]. This loss function is capable of attenuating the dominant influence of high-confidence classes during training. The Max-square loss L m is defined as follows:
L m = i = 1 H × W c = 1 C y ^ t f ( i , c ) 2 + 1 y ^ t f ( i , c ) 2
Finally, we supervise the model training with the fused pseudo-labels. The pixel-level cross-entropy loss is adopted as the segmentation loss, defined as:
L s e g x , y = i = 1 H × W c = 1 C y ( i , c ) · log σ ( F ( x ) ( i , c ) )
where H and W represent the height and width of the image, i represents the i-th pixel, c represents the category label (OD or OC), σ ( · ) is the sigmoid function. y ( i , c ) represents whether the i-th pixel in the segmentation map belongs to the category c (0 or 1). σ ( F ( x ) ) (i.e., y ^ )denotes the predicted segmentation of x . The target segmentation loss corresponding to the pseudo-labels is defined as:
L s e g t = L s e g x t , y ^ t f + L s e g x t s , y ^ t f

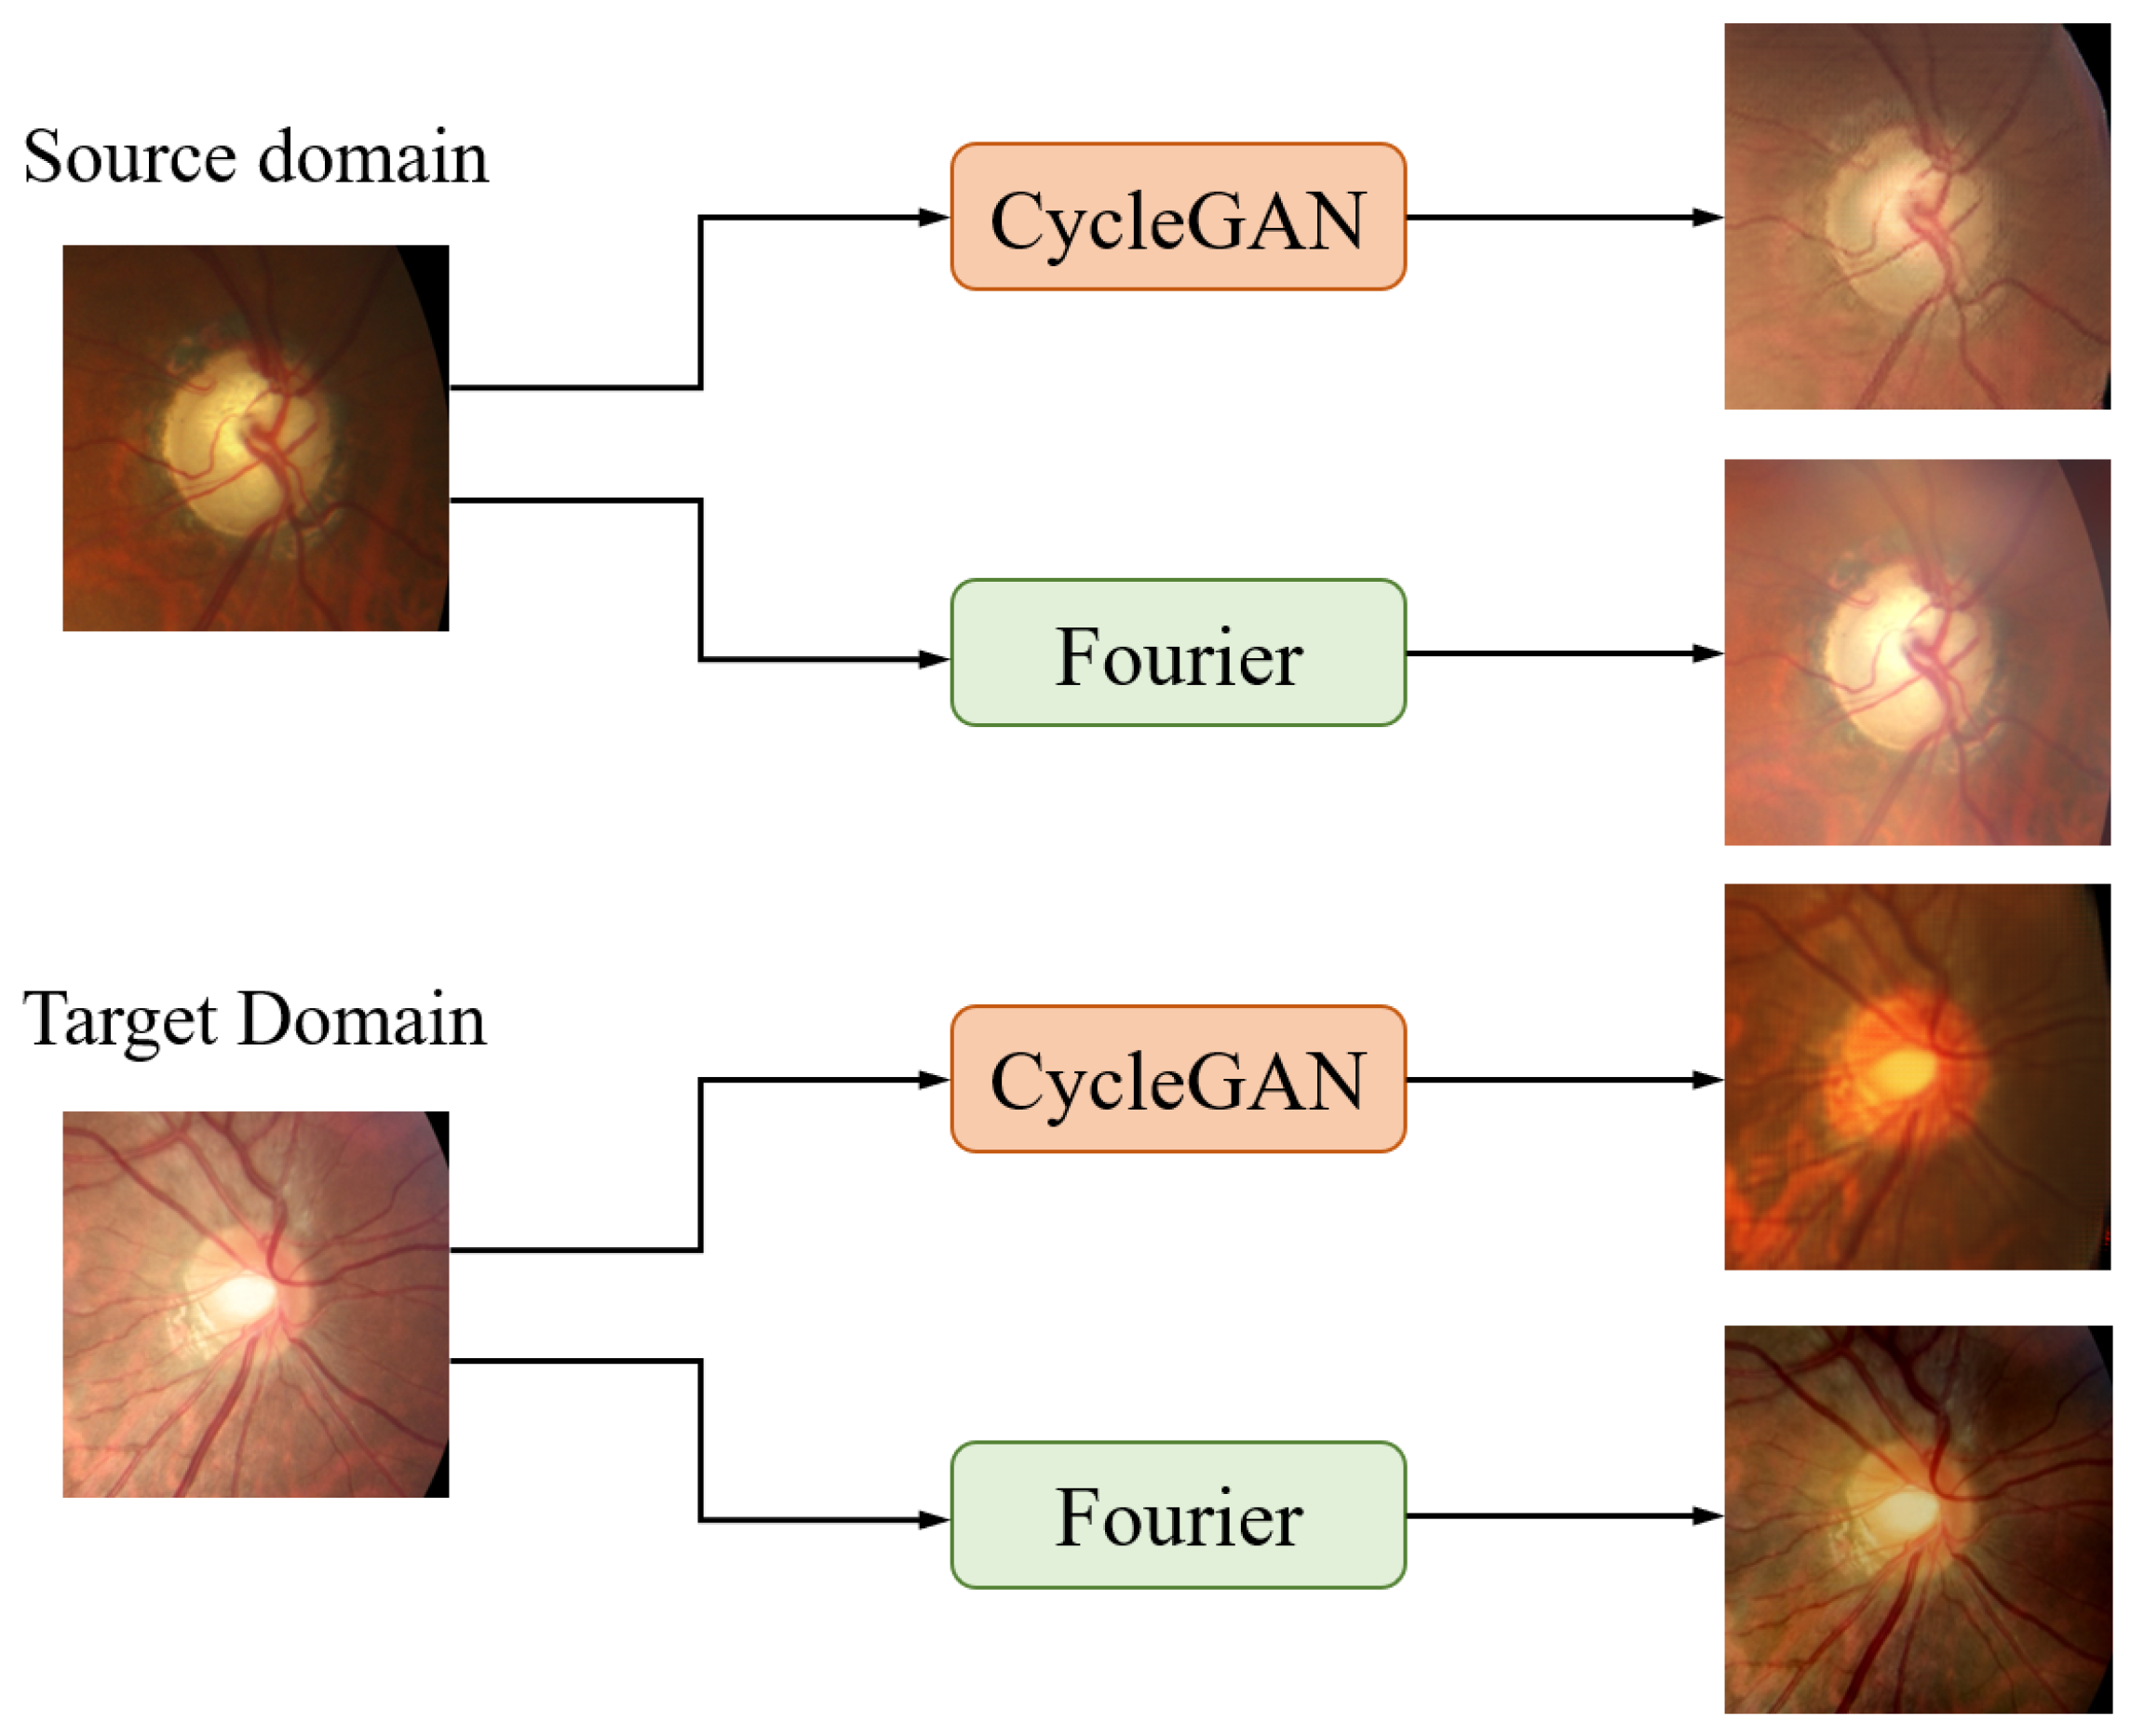
3.3. Source Domain Image Style Transfer and Adversarial Training Mechanism

To fully leverage labeled source domain images for domain adaptation, we also apply a Fourier transform to the source domain images to generate a target-style counterpart, denoted as x s t . Subsequently, the original source domain images x s and their style-transferred counterparts x s t are fed into the source segmentation network M s and the target segmentation network M t , respectively. This design ensures that each network processes images with a single style, thereby further reducing the interference introduced by mixed domain styles and yielding purer feature extraction. The overall model architecture is illustrated in Figure 5.
For the labeled source domain images, we supervise the segmentation results using a pixel-wise cross-entropy loss. Specifically, let y s denote the ground-truth segmentation labels for x s . Based on the same segmentation loss function as in Equation (5), the supervised segmentation loss for the source images is defined as:
L s e g s = L s e g x s , y s + L s e g x s t , y s
Furthermore, to further reduce the visual discrepancy between the original and the style-transferred images, we introduce an adversarial training mechanism. Specifically, we employ a feature discriminator to compare the features extracted from the original source domain images and those from the style-transferred images. Within our dual-path network architecture, the adversarial loss can be expressed as:
L a d v = L a d v x s , x t s + L a d v x t , x s t
Through this adversarial training, the model can further mitigate the adverse effects of inter-domain style discrepancies on segmentation performance.

3.4. Cross-Domain Contrastive Learning

The underlying idea is that features extracted from images before and after domain transformation should preserve structural consistency. To achieve this, we design a cross-domain contrastive loss [29].
Specifically, let x p and x q denote a pair of positive samples. The contrastive loss is computed as:
L c o n ( x p , x q ) = log exp d ( F ( x p ) , F ( x q ) ) / 2 τ 2 j = 1 N 1 p j exp d ( F ( x p ) , F ( x j ) ) / 2 τ 2 ,
where e x p ( d ( · ) ) / 2 τ 2 denotes the Gaussian kernel function used to measure similarity, 1 p j { 0 , 1 } is an indicator function that equals 1 if p j , d(·) represents the Euclidean distance between feature maps, and N is the total number of images in a batch [30].
In our framework, there are two types of positive pairs: one consisting of a target image x t and its source-style transformed version x t s , and another comprising a source image x s and its target-style transformed version x s t . The overall cross-domain contrastive loss is then defined as:
L c = L c o n x s , x s t + L c o n x t , x t s
By reducing the distance between the feature maps of these positive pairs—extracted by M s and M t —the network better preserves structural similarity and enhances prediction consistency. This improved consistency further bolsters the reliability of the fused pseudo-labels used in subsequent training stages.

3.5. Loss Function

The two separate paths M s and M t are trained simultaneously under a total loss:
L total = L seg s + L a d v + λ s e g t L seg t + λ m L m + λ c L c
where λ s e g t , λ m and λ c are the weights for their respective loss functions.
During testing phase where only target data is given, the trained target path network M t is straightforwardly used for testing the segmentation performance of the model.

4. Experiments

4.1. Datasets and Implementation Details

We validated the proposed method on three cross-domain datasets, with detailed information provided in Table 1. The REFUGE dataset [31] is divided into Train and Validation/Test subsets. The Train set, serving as the source domain, comprises 400 images with OD and OC segmentation annotations acquired using a Zeiss Bisucam 500. In contrast, the Validation/Test set, serving as the target domain, contains 400 training images and 400 testing images captured using a Canon CR-2. Additionally, the Drishti-GS dataset [32] from India includes 101 images with segmentation annotations provided by multiple ophthalmologists. Lastly, the RIM-ONE-r3 dataset [33] from Spain, collected with a Canon EOS 5D, comprises 99 training images and 60 testing images. Because our framework uses self-supervised learning, the target-domain training images are treated as unlabeled data solely for adaptation and pseudo-label generation; their ground-truth masks are not used during training, and only the target-domain test images are employed for final evaluation.
We construct a dual-path image segmentation network, M s and M t , using the DeepLabV3+ [26] framework. The network employs MobileNetV2 [27] as its feature extractor. The training is conducted on a server with an Nvidia 1080ti GPU, over 200 epochs with a batch size of 4. The Adam optimizer [34] is employed with a starting learning rate of 1 × 10 3 , which is reduced by 0.2 every 100 epochs. To augment the training dataset, we apply a range of random transformations, including random cropping and scaling, random rotation and flipping, elastic deformation, salt–pepper noise, and random region erasing. All augmentation operations are performed online via internal random sampling mechanisms, so that each image receives different augmentation effects in different epochs or iterations.
We use Dice coefficients ( D I ) as a metric to evaluate the segmentation performance of the model. The metric is calculated as:
D I = 2 N t p 2 N t p + N f p + N f n ,
where N t p , N f p , and N f n correspond to the pixel counts for true positives, false positives, and false negatives, respectively.
In addition, we adopted the absolute value δ to evaluate the error between the predicted C D R ( C D R p ) and the ground truth C D R ( C D R g ). The calculation of δ is illustrated as follows:
δ = | C D R p C D R g |
where C D R = V C D / C D D . V C D and V D D are the vertical cup diameter and vertical disc diameter, respectively.

4.2. Performance Comparison with Prior Methods

We compare our model with other domain adaptation works on three datasets. Among them, refs. [35,36,37] were originally designed for other tasks, and refs. [10,11,12,13,14,23] were the existing OD and OC segmentation frameworks based on domain adaptation.

4.2.1. Quantitative Analysis

Table 2 shows that our method outperforms existing domain adaptation approaches in terms of D I c u p , D I d i s c , and δ . Specifically, our approach yields higher D I d i s c and D I c u p scores on the Drishti-GS dataset while achieving the lowest δ value among all compared methods. Although the RIM-ONE-r3 dataset exhibits a more pronounced domain shift relative to REFUGE—thus complicating the adaptation process—our method still attains D I d i s c scores of 0.922 and 0.958 on RIM-ONE-r3 and REFUGE Validation/Test, respectively. This improvement is primarily attributable to the incorporation of causal inference-based pseudo-label supervision, which effectively reduces the adverse impact of mixed domain styles on model predictions.

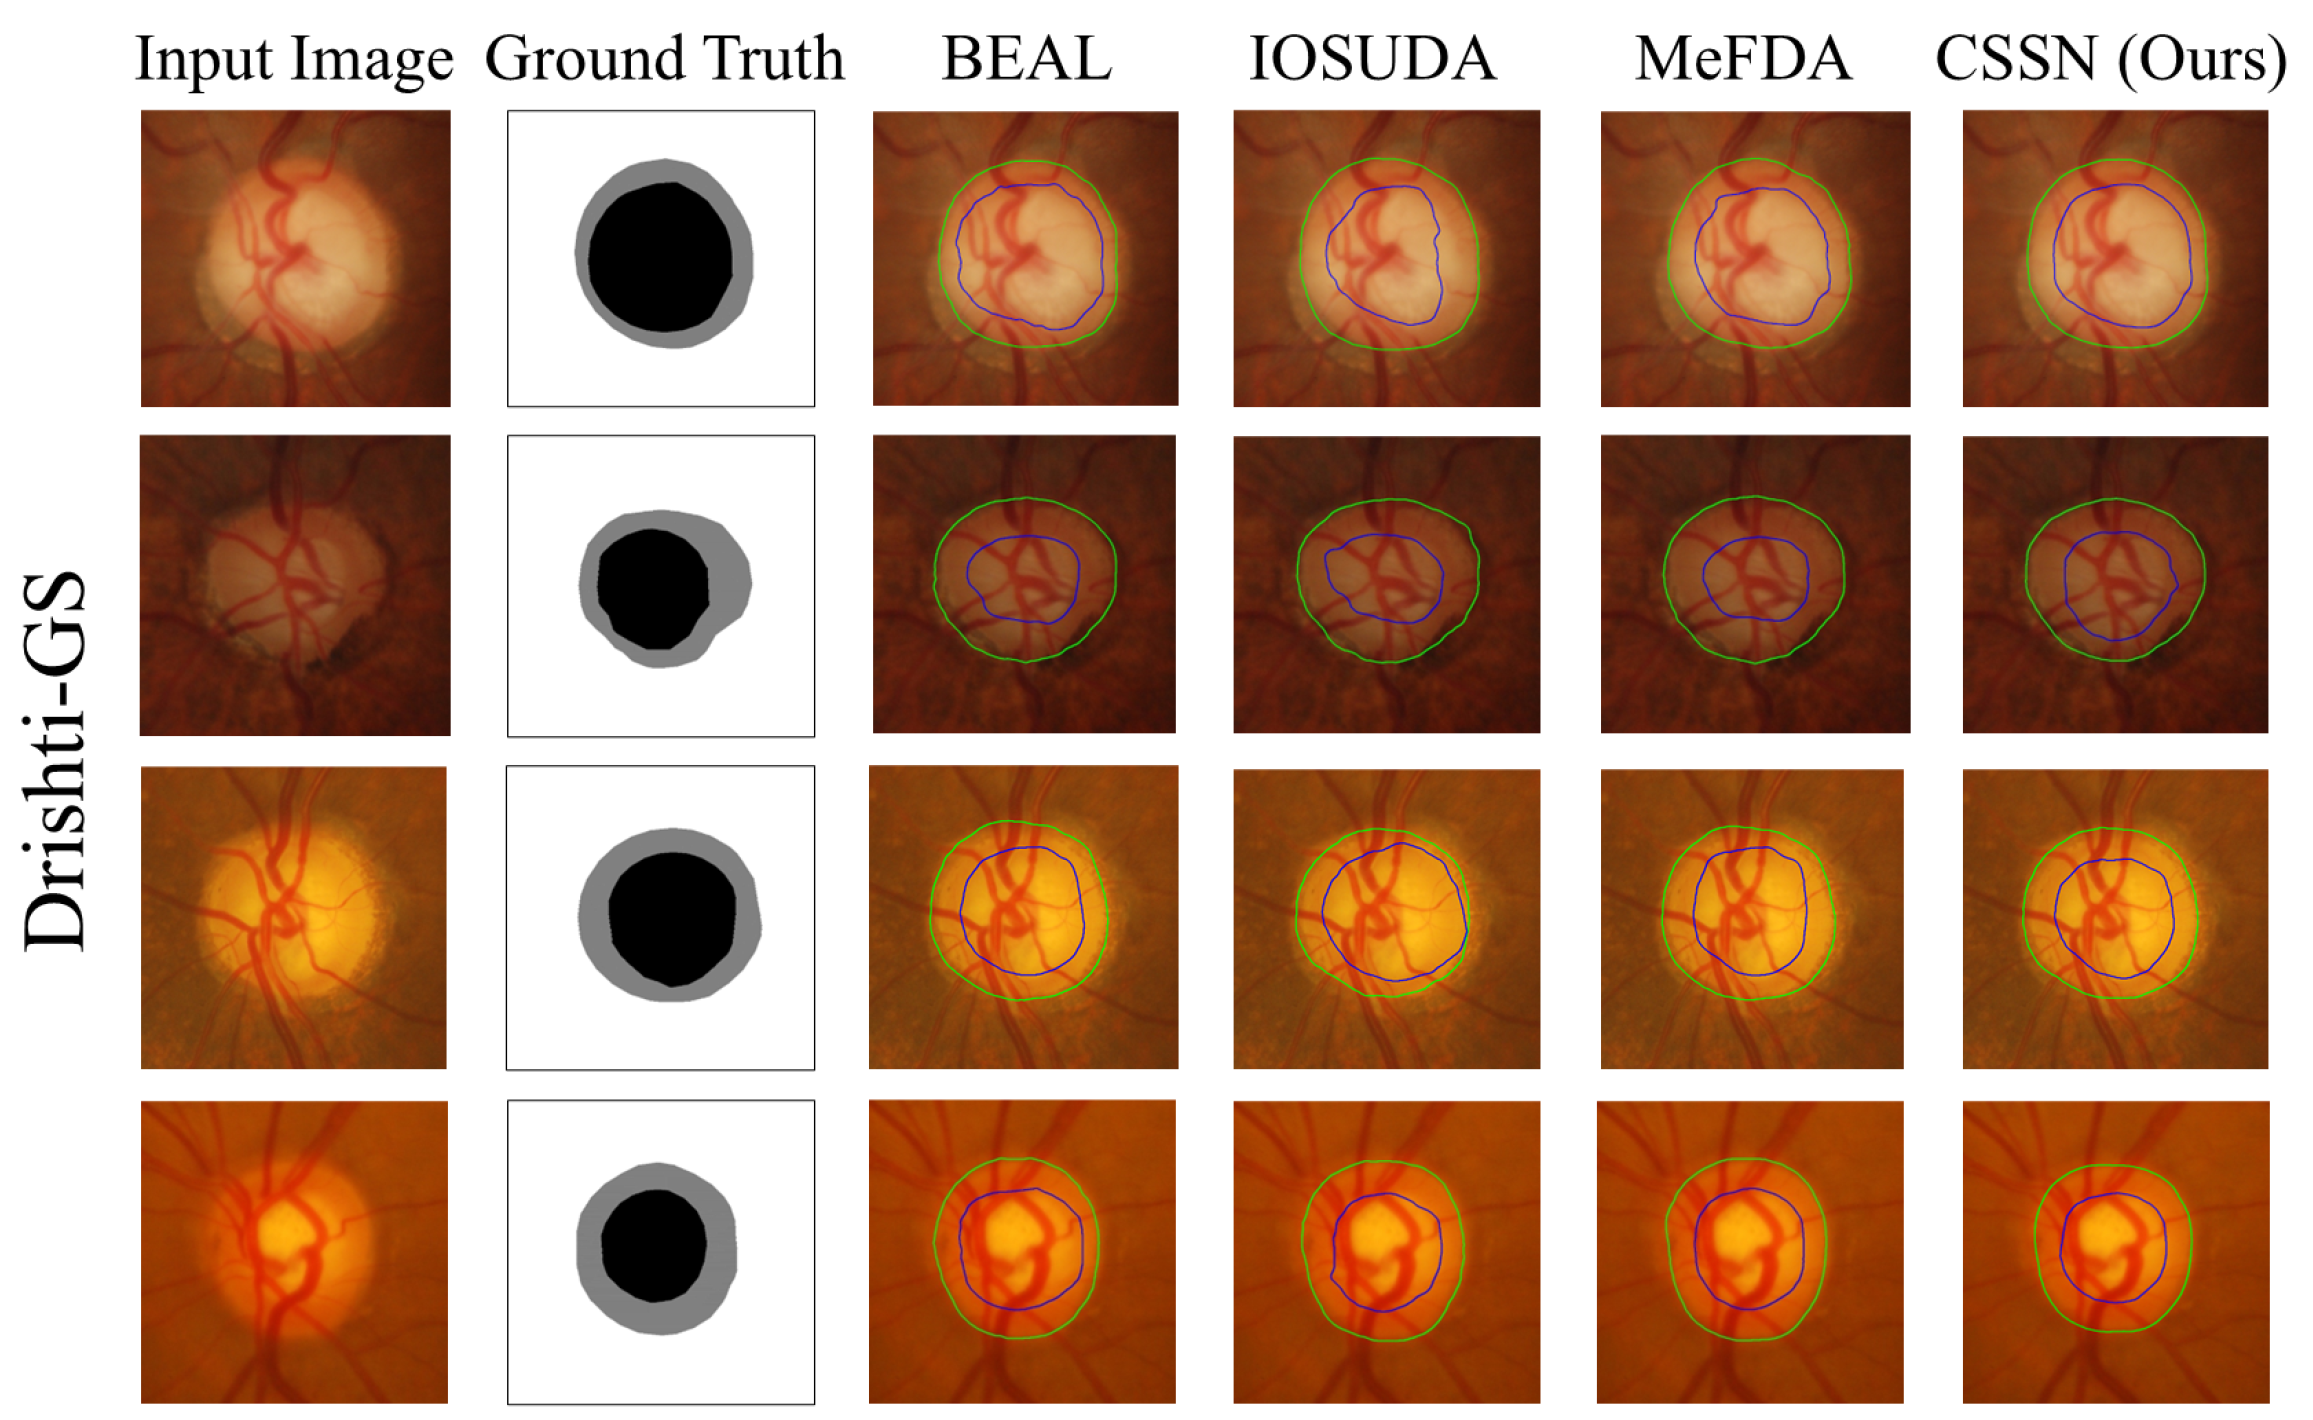
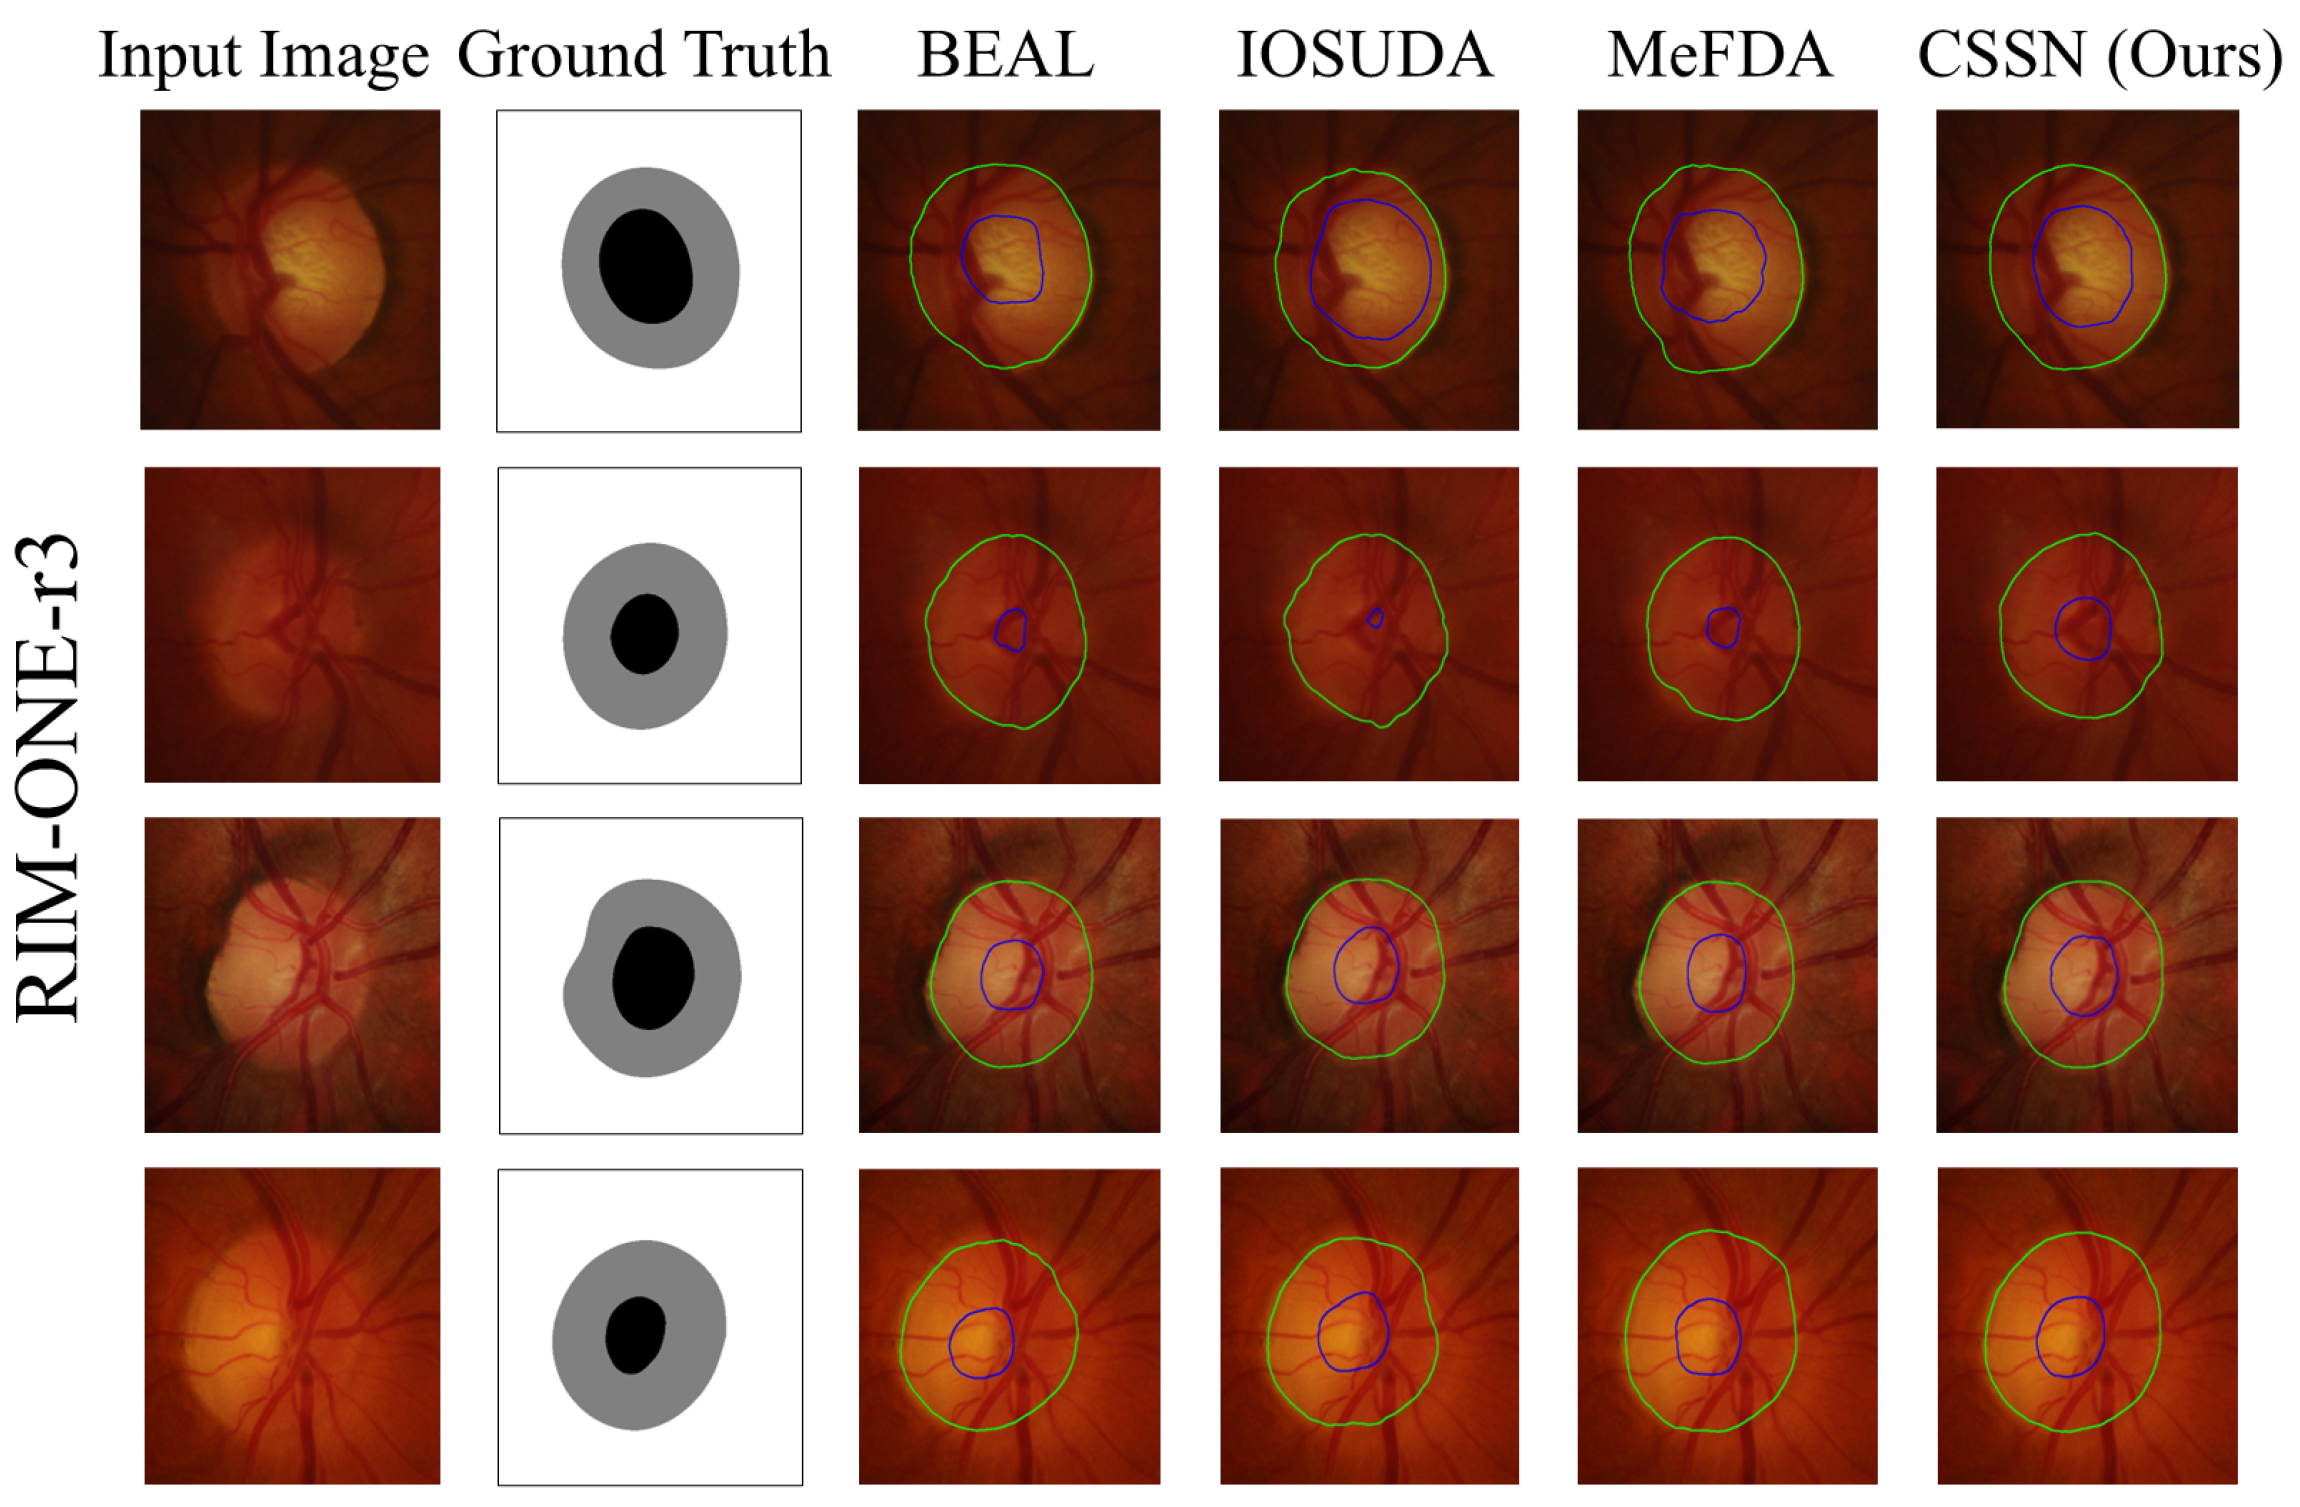
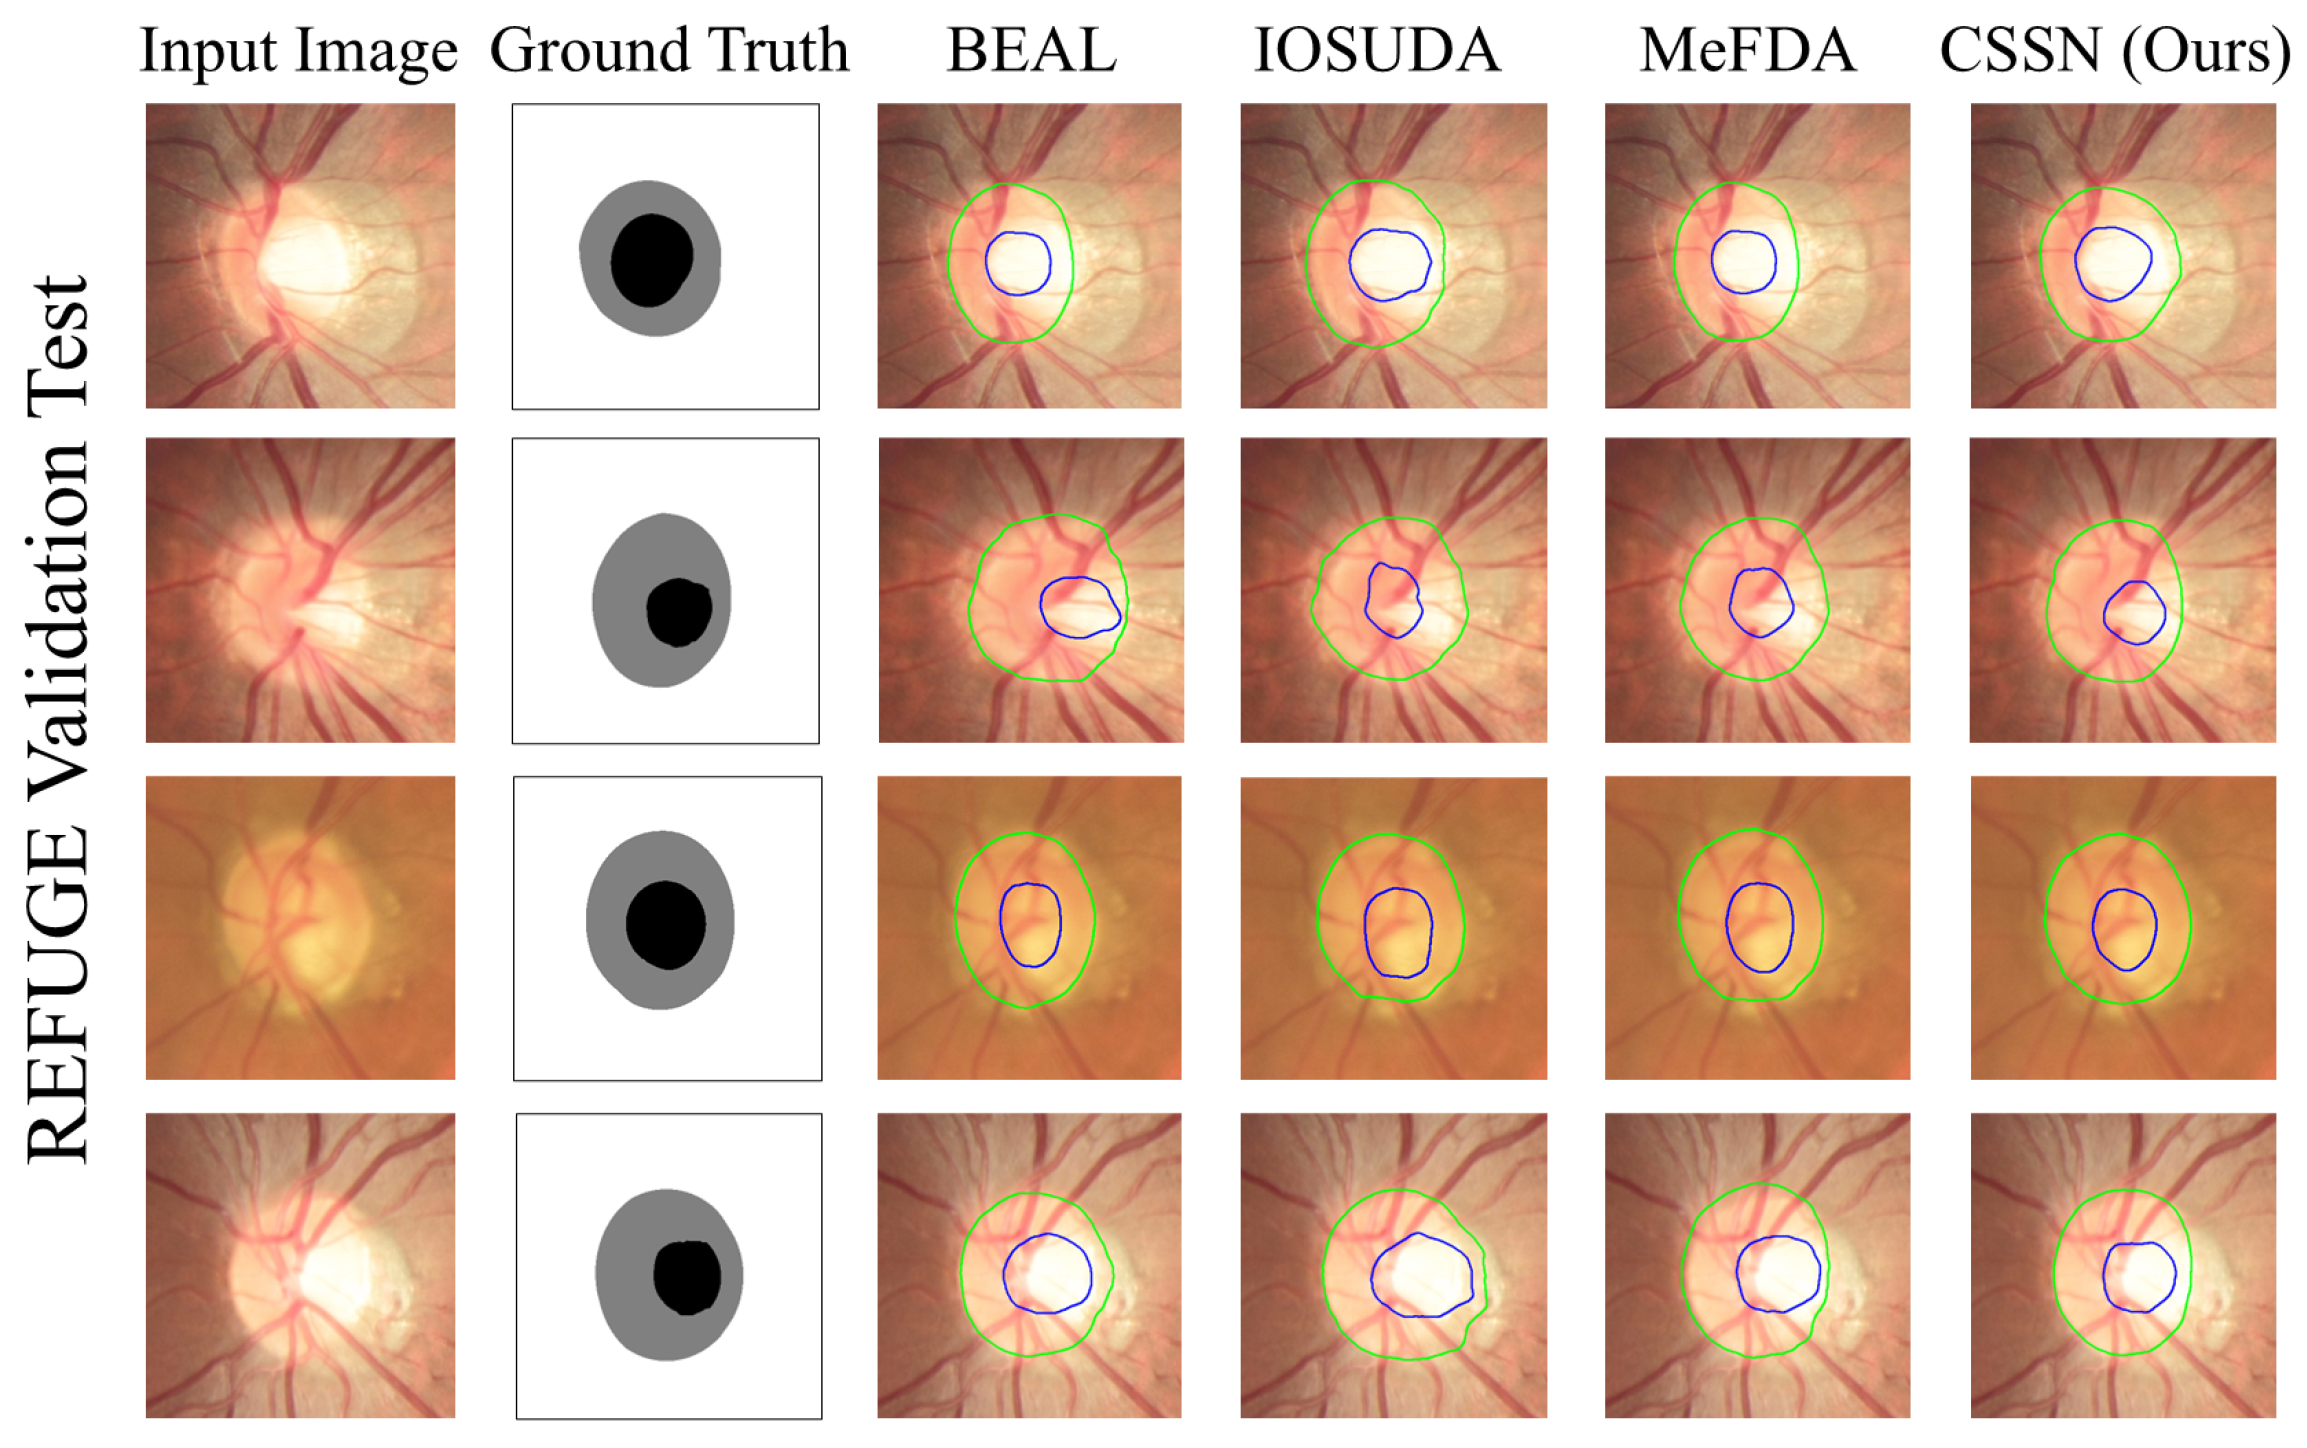
4.2.2. Qualitative Analysis

Figure 6, Figure 7 and Figure 8 show the visual segmentation results of the proposed method and several open-source methods, i.e., BEAL [11], IOSUDA [12] and MeFDA [14]. As can be seen, while all methods achieve satisfactory OD segmentation due to its clear boundary, our method produces smoother contours. For OC segmentation, the other methods often fail to generate accurate boundaries. For instance, in the second row of the RIM-ONE-r3 results, the predicted segmentation is much smaller than the ground truth, whereas in the fourth row of the REFUGE Validation/Test results, their predictions include regions that do not belong to the OC. In contrast, our method outperforms these approaches in OC segmentation, as demonstrated in the second row of the Drishti-GS results, where the outline and shape of the segmented results are closer to the ground truth.

4.3. Discussion on Causal Inference-Based Pseudo-Label Fusion Module

To evaluate the effectiveness of our proposed causal inference–based pseudo-label fusion module, we designed a series of ablation experiments to comprehensively assess the impact of different pseudo-label generation strategies on model performance. In our framework, the fused pixel-wise pseudo-label y ^ t f serves as the self-supervision target for unlabeled target-domain images—substituting the unavailable ground-truth masks and being directly incorporated into the target-domain segmentation loss L seg t —thereby guiding the network to learn accurate OD/OC delineations under domain shift.

4.3.1. Effectiveness of Pseudo-Label Fusion

To demonstrate the effectiveness of the causal inference-based pseudo-label fusion, we compared the segmentation results of three schemes: one that does not employ pseudo-labels for self-supervision, one that generates pseudo-labels using a single-path approach solely based on target domain images, and the final method that incorporates causal inference. The corresponding results are presented in Table 3. The experimental findings indicate that the use of the pseudo-label module enables the model to exploit the information from target domain images, thereby significantly enhancing segmentation performance and validating the effectiveness of self-supervised learning. Moreover, incorporating the causal inference strategy further optimizes pseudo-label generation by effectively mitigating the interference caused by mixed domain styles, resulting in more accurate and reliable pseudo-labels for supervising the model. This strategy not only enhances the generalization ability of the model but also provides a robust theoretical foundation for cross-domain adaptation.

4.3.2. Effectiveness of Confidence-Based Dynamic Fusion

During the pseudo-label generation process, we also introduced a confidence map generation mechanism. To validate the effectiveness of this strategy, we compared it with a simple averaging fusion method, which combines the dual-path prediction results using equal weights (i.e., multiplying each segmentation output by 1 2 ) to obtain the fused pseudo-labels; the relevant results are presented in Table 4. The results show that the confidence-based dynamic fusion strategy is capable of adaptively adjusting the weight of each pixel based on its prediction certainty during the fusion process, thereby generating more refined and accurate pseudo-labels that provide a more reliable supervisory signal for model training.

4.4. Discussion on Domain Transformation Methods

In our causal inference-based pseudo-label generation module, we employ the Fourier transform as the tool for domain style transformation, generating images with varying domain styles to simulate the stratification operation in backdoor adjustment. The primary rationale for choosing the Fourier transform is that, due to the large size of the original images and memory limitations, CycleGAN can only process compressed images, leading to a degradation in image quality; in contrast, the Fourier transform can directly handle the original images, thereby achieving a more effective style conversion. Moreover, as a deep learning model, CycleGAN’s performance is constrained by the scale of the training dataset, and given the limited number of fundus images available, the Fourier transform can generate the required transferred images without additional training.
To validate these points, we conducted comparative experiments using CycleGAN [38] as the domain transformation tool, comparing the results of the CycleGAN-based method with those of the Fourier transform-based method. As shown in Figure 9, although CycleGAN produces transferred images that are satisfactory in terms of domain style, noticeable differences in detail and contour exist compared to the original images. When converting target domain images to the source domain, the size of the OD is significantly enlarged. Further quantitative analysis supports this conclusion; as presented in Table 5, the overall model’s segmentation performance on three datasets indicates that the Fourier transform achieves superior domain style transformation.

4.5. Loss Ablation Study

To further validate the effectiveness of our approach, we conducted an ablation study on the loss functions. We progressively incorporated the loss components used in the overall loss function and recorded the corresponding performance on three datasets, as shown in Table 6. The contributions of each loss term are analyzed as follows:
  • Baseline Segmentation Loss ( L s e g s ): The results obtained using only L s e g s , which relies solely on the labeled source data, establish the baseline segmentation performance.
  • Adversarial Loss ( L a d v ): By incorporating L a d v , we observed significant performance gains—especially on the RIM-one-R3 dataset, which exhibits a larger domain shift.
  • Target Segmentation Loss ( L s e g t ): Next, we incorporated the target segmentation loss L s e g t , which is based on the pseudo-labels generated by our causal inference-based pseudo-label fusion module. The addition of L s e g t resulted in substantial improvements across all three datasets, thereby demonstrating the reliability of the predicted pseudo-labels.
  • Maximum Square Loss ( L m ): Incorporating the maximum square loss L m further improved segmentation performance by regularizing pseudo-label predictions and balancing high-confidence outputs.
  • Cross-domain Contrastive Loss ( L c ): Finally, the cross-domain contrastive loss L c was introduced to constrain the features extracted from the original images and their style-transferred counterparts, ensuring consistency between the dual-path outputs.

5. Conclusions

In this paper, we propose a novel cross-domain fundus image segmentation framework, Causal Self-Supervised Network (CSSN). Our approach constructs a structural causal model and introduces a causal intervention mechanism to effectively eliminate the interference of domain style information in pseudo-label generation, thereby enabling efficient self-supervised learning. Specifically, we employ a Fourier transform to convert the image style, simulating the stratification process inherent in backdoor adjustment. Subsequently, a dual-path segmentation network is used to separately extract features from the original and style-transformed images, and a confidence fusion strategy is leveraged to generate more reliable pseudo-labels. Furthermore, we incorporate adversarial training and cross-domain contrastive learning to effectively narrow the feature discrepancy between different domains, significantly enhancing the model’s generalization ability and segmentation performance.

Author Contributions

Q.L.: Conceptualization, Methodology, and Writing—review & editing; Q.Z.: Software and Writing—original draft; Z.Z.: Investigation; H.L.: Validation, Supervision, and Writing— review & editing; W.N.: Funding acquisition. All authors have read and agreed to the published version of the manuscript.

Funding

This work was supported in part by the National Natural Science Foundation of China (62272337), the Natural Science Foundation of Tianjin (16JCZDJC31100) and Tianjin Natural Science Foundation (No. 23JCQNJC01520).

Institutional Review Board Statement

Not applicable.

Informed Consent Statement

Not applicable.

Data Availability Statement

The code supporting the findings of this study is publicly available at the following GitHub repository: https://github.com/SingularZh/SSCN-for-OD-and-OC-segmentation.git. The REFUGE dataset analyzed in this work can be accessed via its DOI: https://dx.doi.org/10.21227/tz6e-r977. The RIM-ONE-r3 dataset used herein is available for download at: https://medimrg.webs.ull.es/RIM-ONE-r3.zip.

Conflicts of Interest

The authors declare no conflicts of interest.

References

  1. Tham, Y.-C.; Li, X.; Wong, T.Y.; Quigley, H.A.; Aung, T.; Cheng, C.-Y. Global Prevalence of Glaucoma and Projections of Glaucoma Burden Through 2040: A Systematic Review and Meta-Analysis. Ophthalmology 2014, 121, 2081–2090. [Google Scholar] [CrossRef]
  2. Mary, M.C.V.S.; Rajsingh, E.B.; Jacob, J.K.K.; Anandhi, D.; Amato, U.; Selvan, S.E. An Empirical Study on Optic Disc Segmentation Using an Active Contour Model. Biomed. Signal Process. Control 2015, 18, 19–29. [Google Scholar] [CrossRef]
  3. Gagan, J.H.; Shirsat, H.S.; Kamath, Y.S.; Kuzhuppilly, N.I.R.; Kumar, J.R.H. Automated Optic Disc Segmentation Using Basis Splines-Based Active Contour. IEEE Access 2022, 10, 88152–88163. [Google Scholar] [CrossRef]
  4. Gopalakrishnan, A.; Almazroa, A.; Raahemifar, K.; Lakshminarayanan, V. Optic Disc Segmentation Using Circular Hough Transform and Curve Fitting. In Proceedings of the 2015 2nd International Conference on Opto-Electronics and Applied Optics (IEM OPTRONIX), Vancouver, BC, Canada, 5–17 October 2015; IEEE: Piscataway, NJ, USA, 2015; pp. 1–4. [Google Scholar]
  5. Zhu, X.; Rangayyan, R.M. Detection of the Optic Disc in Images of the Retina Using the Hough Transform. In Proceedings of the 2008 30th Annual International Conference of the IEEE Engineering in Medicine and Biology Society, Vancouver, BC, Canada, 20–25 August 2008; IEEE: Piscataway, NJ, USA, 2008; pp. 3546–3549. [Google Scholar]
  6. Welfer, D.; Scharcanski, J.; Kitamura, C.M.; Dal Pizzol, M.M.; Ludwig, L.W.B.; Marinho, D.R. Segmentation of the Optic Disk in Color Eye Fundus Images Using an Adaptive Morphological Approach. Comput. Biol. Med. 2010, 40, 124–137. [Google Scholar] [CrossRef]
  7. Morales, S.; Naranjo, V.; Angulo, J.; Alcañiz, M. Automatic Detection of Optic Disc Based on PCA and Mathematical Morphology. IEEE Trans. Med. Imaging 2013, 32, 786–796. [Google Scholar] [CrossRef]
  8. Lu, Z.; Chen, D. Weakly Supervised and Semi-Supervised Semantic Segmentation for Optic Disc of Fundus Image. Symmetry 2020, 12, 145. [Google Scholar] [CrossRef]
  9. Choukikar, P.; Patel, A.K.; Mishra, R.S. Segmenting the Optic Disc in Retinal Images Using Thresholding. Int. J. Comput. Appl. 2014, 94, 6–10. [Google Scholar] [CrossRef]
  10. Wang, S.; Yu, L.; Yang, X.; Fu, C.-W.; Heng, P.-A. Patch-based output space adversarial learning for joint optic disc and cup segmentation. IEEE Trans. Med. Imaging 2019, 38, 2485–2495. [Google Scholar] [CrossRef]
  11. Wang, S.; Yu, L.; Li, K.; Yang, X.; Fu, C.-W.; Heng, P.-A. Boundary and entropy-driven adversarial learning for fundus image segmentation. Int. J. Med. Image Comput. Comput.-Assist. Interv. 2019, 2019, 102–110. [Google Scholar]
  12. Chen, C.; Wang, G. IOSUDA: An Unsupervised Domain Adaptation with Input and Output Space Alignment for Joint Optic Disc and Cup Segmentation. Appl. Intell. 2021, 51, 3880–3898. [Google Scholar] [CrossRef]
  13. Kadambi, S.; Wang, Z.; Xing, E. WGAN Domain Adaptation for the Joint Optic Disc-and-Cup Segmentation in Fundus Images. Int. J. Comput. Assist. Radiol. Surg. 2020, 15, 1205–1213. [Google Scholar] [CrossRef]
  14. Xu, S.-P.; Li, T.-B.; Zhang, Z.-Q.; Song, D. Minimizing-Entropy and Fourier Consistency Network for Domain Adaptation on Optic Disc and Cup Segmentation. IEEE Access 2021, 9, 153985–153994. [Google Scholar] [CrossRef]
  15. Goodfellow, I.J.; Pouget-Abadie, J.; Mirza, M.; Xu, B.; Warde-Farley, D.; Ozair, S.; Courville, A.; Bengio, Y. Generative Adversarial Nets. Adv. Neural Inf. Process. Syst. 2014, 27. Available online: https://proceedings.neurips.cc/paper_files/paper/2014/file/f033ed80deb0234979a61f95710dbe25-Paper.pdf (accessed on 25 January 2025).
  16. Ganin, Y.; Ustinova, E.; Ajakan, H.; Germain, P.; Larochelle, H.; Laviolette, F.; March, M.; Lempitsky, V. Domain-Adversarial Training of Neural Networks. J. Mach. Learn. Res. 2016, 17, 1–35. [Google Scholar]
  17. Guan, Y.; Zhang, L.; Li, J.; Xu, X.; Yan, Y.; Zhang, L. A Lightweight Entropy–Curvature-Based Attention Mechanism for Meningioma Segmentation in MRI Images. Appl. Sci. 2025, 15, 3401. [Google Scholar] [CrossRef]
  18. Guo, B.; Cao, N.; Zhang, R.; Yang, P. SCENet: Small Kernel Convolution with Effective Receptive Field Network for Brain Tumor Segmentation. Appl. Sci. 2024, 14, 11365. [Google Scholar] [CrossRef]
  19. Zou, C.; Jeon, W.-S.; Ju, H.-R.; Rhee, S.-Y. A Dual-Headed Teacher–Student Framework with an Uncertainty-Guided Mechanism for Semi-Supervised Skin Lesion Segmentation. Electronics 2025, 14, 984. [Google Scholar] [CrossRef]
  20. Tang, Y.; Guo, Y.; Wang, H.; Song, T.; Lu, Y. Uncertainty-Aware Semi-Supervised Method for Pectoral Muscle Segmentation. Bioengineering 2025, 12, 36. [Google Scholar] [CrossRef]
  21. Fu, H.; Cheng, J.; Xu, Y.; Wong, D.W.K.; Liu, J.; Cao, X. Joint Optic Disc and Cup Segmentation Based on Multi-Label Deep Network and Polar Transformation. IEEE Trans. Med. Imaging 2018, 37, 1597–1605. [Google Scholar] [CrossRef]
  22. Liu, P.; Kong, B.; Li, Z.; Zhang, S.; Fang, R. CFEA: Collaborative Feature Ensembling Adaptation for Domain Adaptation in Unsupervised Optic Disc and Cup Segmentation. Int. J. Med. Image Comput. Comput.-Assist. Interv. 2019, 2019, 521–529. [Google Scholar]
  23. He, Y.; Kong, J.; Liu, D.; Li, J.; Zheng, C. Self-ensembling with mask-boundary domain adaptation for optic disc and cup segmentation. Eng. Appl. Artif. Intell. 2024, 129, 107635. [Google Scholar] [CrossRef]
  24. Chen, Y.; Ji, Y.; Wang, H.; Hao, X.; Yang, Y.; Ma, Y.; Yu, D. Causal Inference-Based Adversarial Domain Adaptation for Cross-Domain Industrial Intrusion Detection. IEEE Trans. Ind. Inform. 2024, 21, 970–979. [Google Scholar] [CrossRef]
  25. Schneider, M. A Review of Nonlinear FFT-Based Computational Homogenization Methods. Acta Mech. 2021, 232, 2051–2100. [Google Scholar] [CrossRef]
  26. Chen, L.-C.; Zhu, Y.; Papandreou, G.; Schroff, F.; Adam, H. Encoder-Decoder with Atrous Separable Convolution for Semantic Image Segmentation. In Proceedings of the European Conference on Computer Vision (ECCV), Munich, Germany, 8–14 September 2018; Springer: Cham, Switzerland, 2018; pp. 801–818. [Google Scholar]
  27. Sandler, M.; Howard, A.; Zhu, M.; Zhmoginov, A.; Chen, L.-C. Mobilenetv2: Inverted Residuals and Linear Bottlenecks. In Proceedings of the IEEE Conference on Computer Vision and Pattern Recognition, Salt Lake City, UT, USA, 18–22 June 2018; IEEE: Piscataway, NJ, USA, 2018; pp. 4510–4520. [Google Scholar]
  28. Chen, M.; Xue, H.; Cai, D. Domain Adaptation for Semantic Segmentation with Maximum Squares Loss. In Proceedings of the IEEE/CVF International Conference on Computer Vision, Seoul, Republic of Korea, 27 October–2 November 2019; IEEE: Piscataway, NJ, USA, 2019; pp. 2090–2099. [Google Scholar]
  29. Peng, L.; Mo, Y.; Xu, J.; Shen, J.; Shi, X.; Li, X.; Shen, H.T.; Zhu, X. GRLC: Graph Representation Learning with Constraints. IEEE Trans. Neural Netw. Learn. Syst. 2023, 35, 8609–8622. [Google Scholar] [CrossRef]
  30. Chen, T.; Kornblith, S.; Norouzi, M.; Hinton, G. A Simple Framework for Contrastive Learning of Visual Representations. In Proceedings of the International Conference on Machine Learning, Virtual, 13–18 July 2020; PMLR: New York, NY, USA, 2020; pp. 1597–1607. [Google Scholar]
  31. Orlando, J.I.; Fu, H.; Breda, J.B.; van Keer, K.; Bathula, D.R.; Diaz-Pinto, A.; Fang, R.; Heng, P.-A.; Kim, J.; Lee, J.; et al. REFUGE Challenge: A Unified Framework for Evaluating Automated Methods for Glaucoma Assessment from Fundus Photographs. Med. Image Anal. 2020, 59, 101570. [Google Scholar] [CrossRef]
  32. Sivaswamy, J.; Krishnadas, S.; Chakravarty, A.; Joshi, G.; Tabish, A.S. A Comprehensive Retinal Image Dataset for the Assessment of Glaucoma from the Optic Nerve Head Analysis. JSM Biomed. Imaging Data Pap. 2015, 2, 1004. [Google Scholar]
  33. Fumero, F.; Alayón, S.; Sanchez, J.L.; Sigut, J.; Gonzalez-Hernandez, M. RIM-ONE: An Open Retinal Image Database for Optic Nerve Evaluation. Int. J.-Comput.-Based Med. Syst. 2011, 2011, 1–6. [Google Scholar]
  34. Kingma, D.P.; Ba, J. Adam: A Method for Stochastic Optimization. arXiv 2014, arXiv:1412.6980. [Google Scholar]
  35. Zhang, Y.; Miao, S.; Mansi, T.; Liao, R. Task Driven Generative Modeling for Unsupervised Domain Adaptation: Application to X-Ray Image Segmentation. In Proceedings of the International Conference on Medical Image Computing and Computer-Assisted Intervention, Granada, Spain, 16–20 September 2018; Springer: Cham, Switzerland, 2018; pp. 599–607. [Google Scholar]
  36. Hoffman, J.; Wang, D.; Yu, F.; Darrell, T. FCNs in the Wild: Pixel-Level Adversarial and Constraint-Based Adaptation. arXiv 2016, arXiv:1612.02649. [Google Scholar]
  37. Javanmardi, M.; Tasdizen, T. Domain Adaptation for Biomedical Image Segmentation Using Adversarial Training. In Proceedings of the IEEE International Symposium on Biomedical Imaging (ISBI), Washington, DC, USA, 4–7 April 2018; IEEE: Piscataway, NJ, USA, 2018; pp. 554–558. [Google Scholar]
  38. Zhu, J.-Y.; Park, T.; Isola, P.; Efros, A.A. Unpaired Image-to-Image Translation Using Cycle-Consistent Adversarial Networks. In Proceedings of the IEEE International Conference on Computer Vision, Venice, Italy, 22–29 October 2017; IEEE: Piscataway, NJ, USA, 2017; pp. 2223–2232. [Google Scholar]
Figure 1. Comparison of the same sample under different domain styles.
Applsci 15 05074 g001
Figure 2. Structural Causal Model for mitigating domain style interference. In this model, target domain images (X) undergo feature extraction to generate feature maps (F), from which pseudo labels (Y) are derived. Meanwhile, the domain style confounder C introduces confounding style effects in both feature extraction and pseudo label generation, inducing bias in Y via backdoor paths.
Applsci 15 05074 g002
Figure 3. Workflow of the Causal Inference-based Pseudo-Label Generation Module. First, a Fourier transform is applied to the target domain images to convert them into the source domain style, thereby achieving style separation; subsequently, dual segmentation networks extract features from both the original and transformed images, and a confidence map generation mechanism integrates these features to ultimately generate reliable pseudo-labels.
Applsci 15 05074 g003
Figure 4. Schematic diagram of the generation process of confidence weight masks.The confidence of the OD and OC prediction probability maps is computed separately, with the resulting maps for each class concatenated and normalized via softmax to produce the final confidence map.
Applsci 15 05074 g004
Figure 5. The overall architecture of CSSN is depicted. Images with different domain styles are generated using the Fourier transform. Features are then extracted from both the original target images and the style-transferred images, and a causal inference-based pseudo-label fusion module is employed to generate reliable pseudo-labels for self-supervised training. Meanwhile, adversarial training and cross-domain contrastive learning further reduce the feature discrepancy, ensuring structural consistency.
Applsci 15 05074 g005
Figure 6. Visual comparison on Drishti-GS dataset. Compared with BEAL [11], IOSUDA [12] and MeFDA [14]. The green contours represent the segmented optic disc, while the blue contours represent the segmented optic cup.
Applsci 15 05074 g006
Figure 7. Visual comparison on RIM-ONE-r3 dataset. Compared with BEAL [11], IOSUDA [12] and MeFDA [14]. The green contours represent the segmented optic disc, while the blue contours represent the segmented optic cup.
Applsci 15 05074 g007
Figure 8. Visual comparison on REFUGE Validation/Test dataset. Compared with BEAL [11], IOSUDA [12] and MeFDA [14]. The green contours represent the segmented optic disc, while the blue contours represent the segmented optic cup.
Applsci 15 05074 g008
Figure 9. Visualization results of domain transformation using CycleGAN and Fourier transform.
Applsci 15 05074 g009
Table 1. The datasets used in the proposed method.
DomainDatasetNumber (Train/Test)Image Size
SourceREFUGE Train400/0 2124 × 2056
TargetDrishti-GS50/51 2047 × 1759
TargetRIM-ONE-r399/60 2144 × 1424
TargetREFUGE
Validation/Test
400/400 1634 × 1634
Table 2. Quantitative segmentation results for OD and OC on three public datasets. The best results are highlighted in bold.
MethodDrishti-GSRIM-ONE-r3REFUGE Val
D I c u p D I d i s c δ D I c u p D I d i s c δ D I c u p D I d i s c δ
TD-GAN [35]0.7470.9240.1170.7280.8530.118---
Hoffman et al. [36]0.8510.9590.0930.7550.8520.109---
WGAN [13]0.8400.9540.106------
Javanmardi et al. [37]0.8490.9610.0910.7790.8530.103---
OSAL-pixel [10]0.8510.9620.0890.7780.8540.0970.8690.9320.059
pOSAL [10]0.8580.9650.0820.7870.8650.0890.8750.9460.051
BEAL [11]0.8620.9610.0840.8100.8980.0900.8520.9480.055
IOSUDA [12]0.7750.9400.0910.7230.9070.0950.8290.9540.057
CFEA [22]------0.8630.9420.052
MeFDA [14]0.8660.9590.0820.8210.9090.0870.8800.9560.049
OADA [23]0.8730.9650.0850.8160.9040.0940.8850.9520.044
CSSN (Ours)0.8760.9710.0810.8180.9220.0830.8850.9580.049
Table 3. Performance of different pseudo-label generation strategies. The best results are highlighted in bold.
DatasetMethod D I c u p D I d i s c δ
Drishti-GSw/o pseudo-labels0.8220.9410.097
Single-path pseudo-labels0.8470.9520.085
Causal Inference-based0.8760.9710.081
RIM-ONE-r3w/o pseudo-labels0.7570.8730.103
Single-path pseudo-labels0.7980.8960.093
Causal Inference-based0.8180.9220.083
REFUGE Valw/o pseudo-labels0.8310.9410.056
Single-path pseudo-labels0.8400.9520.052
Causal Inference-based0.8850.9580.049
Table 4. Comparison of experimental results using different pseudo-label fusion methods. The best results are highlighted in bold.
DatasetMethod D I c u p D I d i s c δ
Drishti-GSAvg-pooling0.8710.9660.087
Ours0.8760.9710.081
RIM-ONE-r3Avg-pooling0.8160.9180.087
Ours0.8180.9220.083
REFUGE ValAvg-pooling0.8610.9470.053
Ours0.8850.9580.049
Table 5. Performance of different domain transformation methods. The best results are highlighted in bold.
DatasetMethod D I c u p D I d i s c δ
Drishti-GSCycleGAN0.8530.9420.089
Fourier0.8760.9710.081
RIM-ONE-r3CycleGAN0.7930.9110.094
Fourier0.8180.9220.083
REFUGE ValCycleGAN0.8610.9230.056
Fourier0.8850.9580.049
Table 6. Ablation study of various loss functions. The best results are highlighted in bold.
DatasetMethod D I c u p D I d i s c δ
Drishti-GS L s e g s 0.8220.9410.097
L s e g s + L a d v 0.8290.9390.093
L s e g s + L a d v + L s e g t 0.8670.9580.084
L s e g s + L a d v + L s e g t + L m 0.8690.9610.084
L s e g s + L a d v + L s e g t + L m + L c 0.8760.9710.081
RIM-ONE-r3 L s e g s 0.7570.8730.103
L s e g s + L a d v 0.7810.8830.097
L s e g s + L a d v + L s e g t 0.8050.8970.090
L s e g s + L a d v + L s e g t + L m 0.8140.9130.085
L s e g s + L a d v + L s e g t + L m + L c 0.8180.9220.083
REFUGE Val L s e g s 0.8310.9410.056
L s e g s + L a d v 0.8490.9510.055
L s e g s + L a d v + L s e g t 0.8710.9530.054
L s e g s + L a d v + L s e g t + L m 0.8730.9590.049
L s e g s + L a d v + L s e g t + L m + L c 0.8850.9580.049
Disclaimer/Publisher’s Note: The statements, opinions and data contained in all publications are solely those of the individual author(s) and contributor(s) and not of MDPI and/or the editor(s). MDPI and/or the editor(s) disclaim responsibility for any injury to people or property resulting from any ideas, methods, instructions or products referred to in the content.

