Article

A Convolutional Neural Network as a Potential Tool for Camouflage Assessment

1
Section Clinical Developmental Psychology, Vrije Universiteit Amsterdam, 1081BT Amsterdam, The Netherlands
2
TNO, Human Factors, 3769DE Soesterberg, The Netherlands
*
Author to whom correspondence should be addressed.
Appl. Sci. 2025, 15(9), 5066; https://doi.org/10.3390/app15095066
Submission received: 10 March 2025 / Revised: 26 April 2025 / Accepted: 30 April 2025 / Published: 2 May 2025
(This article belongs to the Special Issue Application of Artificial Intelligence in Image Processing)

Abstract

:
Camouflage evaluation is traditionally evaluated through human visual search and detection experiments, which are time-consuming and resource intensive. To address this, we explored whether a pre-trained convolutional neural network (YOLOv4-tiny) can provide an automated, image-based measure of camouflage effectiveness that aligns with human perception. We conducted behavioral experiments to obtain human detection performance metrics—such as search time and target conspicuity—and compared these to the classification probabilities output by the YOLO model when detecting camouflaged individuals in rural and urban scenes. YOLO’s classification probability was adopted as a proxy for detectability, allowing direct comparison with human observer performance. We found a strong overall correspondence between YOLO-predicted camouflage effectiveness and human detection results. However, discrepancies emerged at close distances, where YOLO’s performance was particularly sensitive to high-contrast, shape-breaking elements of the camouflage pattern. CNNs such as YOLO have significant potential for assessing camouflage effectiveness for a wide range of applications, such as evaluating or optimizing one’s signature and predicting optimal hiding locations in each environment. Still, further research is required to fully establish YOLO’s limitations and applicability for this purpose in real time.

1. Introduction

Camouflage involves the strategic use of materials, colors, or lighting to diminish the visibility of an object against its immediate surroundings. Employed both in the natural world and military practices, the primary aim of camouflage is to enhance survival prospects by lowering the likelihood of detection. Within a military setting, various camouflage techniques, including nets, paints with low emission, and specific patterns, are used to merge crucial assets seamlessly with their environment. Understanding the effectiveness of these camouflage strategies in reducing an object’s visibility and discerning the conditions under which they are most effective is crucial. This evaluation necessitates a standard for measuring detectability.
Over time, various methods for assessing the detectability of visual objects have been established [1,2,3,4,5]. These methods include experiments with human participants as well as objective, computational (image-based) analyses. Studies involving human observers, which aim to evaluate the effectiveness of camouflage, usually require visual search and detection tasks. However, these behavioral experiments tend to be costly and time-intensive, necessitating a significant number of participants and repeated trials. Additionally, the inherent complexity of natural scenes, with their high degree of variability, complicates the evaluation of camouflage for moving objects, as their visibility can change depending on their immediate location. Therefore, there is a growing demand for computational models capable of determining camouflage effectiveness using digital images.
This study investigates the use of a pre-trained convolutional neural network (YOLOv4-tiny) to evaluate camouflage effectiveness from digital imagery, offering a faster and less resource-intensive alternative to traditional human visual search experiments. We find that the detection probability output by YOLO strongly correlates with human search performance and object identification conspicuity, validating its use as a proxy for human detection.
In the rest of this section, we first discuss the pros and cons of observer and computational object visibility metrics. Then we suggest adopting the YOLO predicted certainty (confidence level) of an object’s identity as a measure of camouflage efficiency. In contrast to standard camouflage evaluation methods based on human visual search and detection experiments, which are time-consuming and expensive, a YOLO-based digital camouflage metric aligned with human perception offers a faster and more cost-effective alternative. Figure 1 represents the flowchart of the present study.
The main contribution of this paper is the finding that CNNs like YOLO can be valuable tools for the automated assessment of camouflage in military and surveillance applications.

1.1. Observer Camouflage Metrics

Considering that camouflage aims to reduce detection likelihood, evaluating human visual search effectiveness in field experiments under strictly managed setups is typically seen as the benchmark for assessing camouflage effectiveness. Nonetheless, conducting field experiments is expensive, time-intensive, demands significant manpower, and poses logistical challenges. Additionally, the range of conditions under which camouflage’s effectiveness can be evaluated is restricted. Therefore, field trials are frequently substituted with lab-based studies that employ photos and videos from field experiments. These lab tests allow for complete control over influencing factors. However, there can be significant discrepancies between human performance in these artificial lab settings and real-world environments. Such differences might stem from the simulated conditions not accurately reflecting real-world factors like resolution [6], brightness, color fidelity [7], and dynamic range, among others, the impact of which remains largely unexplored.
An effective and practical alternative to extensive search and detection studies is the concept of visual object conspicuity. This approach measures how much an object’s visual characteristics stand out against its immediate environment, based on differences in aspects such as size, shape, brightness, color, texture, depth perception, movement, and the amount of surrounding clutter. An object is more readily spotted if it contrasts sharply with its background, with detection speed increasing as this contrast becomes more pronounced [8,9,10]. Consequently, visual conspicuity is a key factor in determining the outcome of human visual search tasks. This concept can be defined by the maximum distance in the visual field at which an object in peripheral vision remains distinguishable from its surroundings. In other words, if an object is well camouflaged, then one needs to fixate close to the object to identify it, while an easy-to-distinguish object can be viewed far in the periphery. We have previously established and tested an efficient psychophysical method to measure this principle, requiring only a minimal number of participants to achieve statistical relevance [11]. This approach is quick, works on-site, assumes complete knowledge of the object and its location, and has proven to effectively predict human visual search behavior in both simple and complex scenarios [11,12], including for both stationary [12] and moving objects [13], in laboratory settings [12] and real-world environments [12,14]. Moreover, visual conspicuity can assess the detectability of camouflaged objects across standard visual, near infrared, and thermal spectra [14,15,16]. Depending on the specific criteria applied, it is possible to evaluate the conspicuity either for detection, which relates to an observer’s subjective judgment of the object’s visual distinction from its background, or for identification, which involves recognizing specific details at the object’s location. Since identification conspicuity incorporates elements of cognitive recognition, it offers a more accurate prediction of average search times compared to detection conspicuity [11].

1.2. Computational Camouflage Metrics

Image-based camouflage effectiveness assessment algorithms compute object saliency using digital object–background contrast metrics [1,17,18]. These metrics frequently have little or no relation to human visual perception. Furthermore, to compute overall object saliency, an object’s position or area should be known in advance. In addition, there is no unique definition of object saliency (e.g., one can arbitrarily adopt the average or maximum saliency over the object support area [1]).
Another approach to the image-based assessment of camouflage effectiveness is visual saliency models [1]. These models typically use human vision models to compute local contrast maps (local saliency) from multiple multiresolution feature maps. Similar to simple contrast metrics, the overall object saliency metric is ill-defined, while the object position and outlines are required for its computation [1].
A promising avenue is presented by artificial neural networks. Even though neural networks have been designed with engineering goals and not to model brain computations, they show a large resemblance to the primate visual hierarchy [19]. The fact that these models can perform many visual tasks up to a level similar to that of humans shows that the models do resemble human visual processing to some extent. However, it is also clear that such models can be deceived in ways humans are unaffected by [20]. Also, models can pick up coincidental correlations with no general validity [20,21]. The question, therefore, remains to what extent these models resemble human visual processing (and in what way they deviate from it), and whether they can be used to model human performance. Talas et al. [22] have used a generative adversarial network framework to evolve camouflage pattern design for tree bark textures with patterns that show improved performance with an evolution cycle, as validated by humans and the model evaluator, indicating that their evaluator resembles the human perception of camouflage. Fennell et al. [23] used deep learning techniques together with genetic algorithms to design and evaluate camouflage patterns of (virtual) spheres against a more complex (less texture-like) background (plants, occlusion, etc.) and showed that their algorithm was capable of generating patterns well suited for the environment and predicting human search performance of the best and worst pattern types.
Here, we investigate the resemblance of the performance of a pre-trained algorithm (YOLO: You Only Look Once [24]) with the human perception of camouflaged soldiers/persons. This type of algorithm is widely used (e.g., in video surveillance) and shown to perform well for detecting persons in urban scenes. It remains to be tested as to whether it can cope with a more military scenario, i.e., camouflaged persons in both urban and woodland settings.

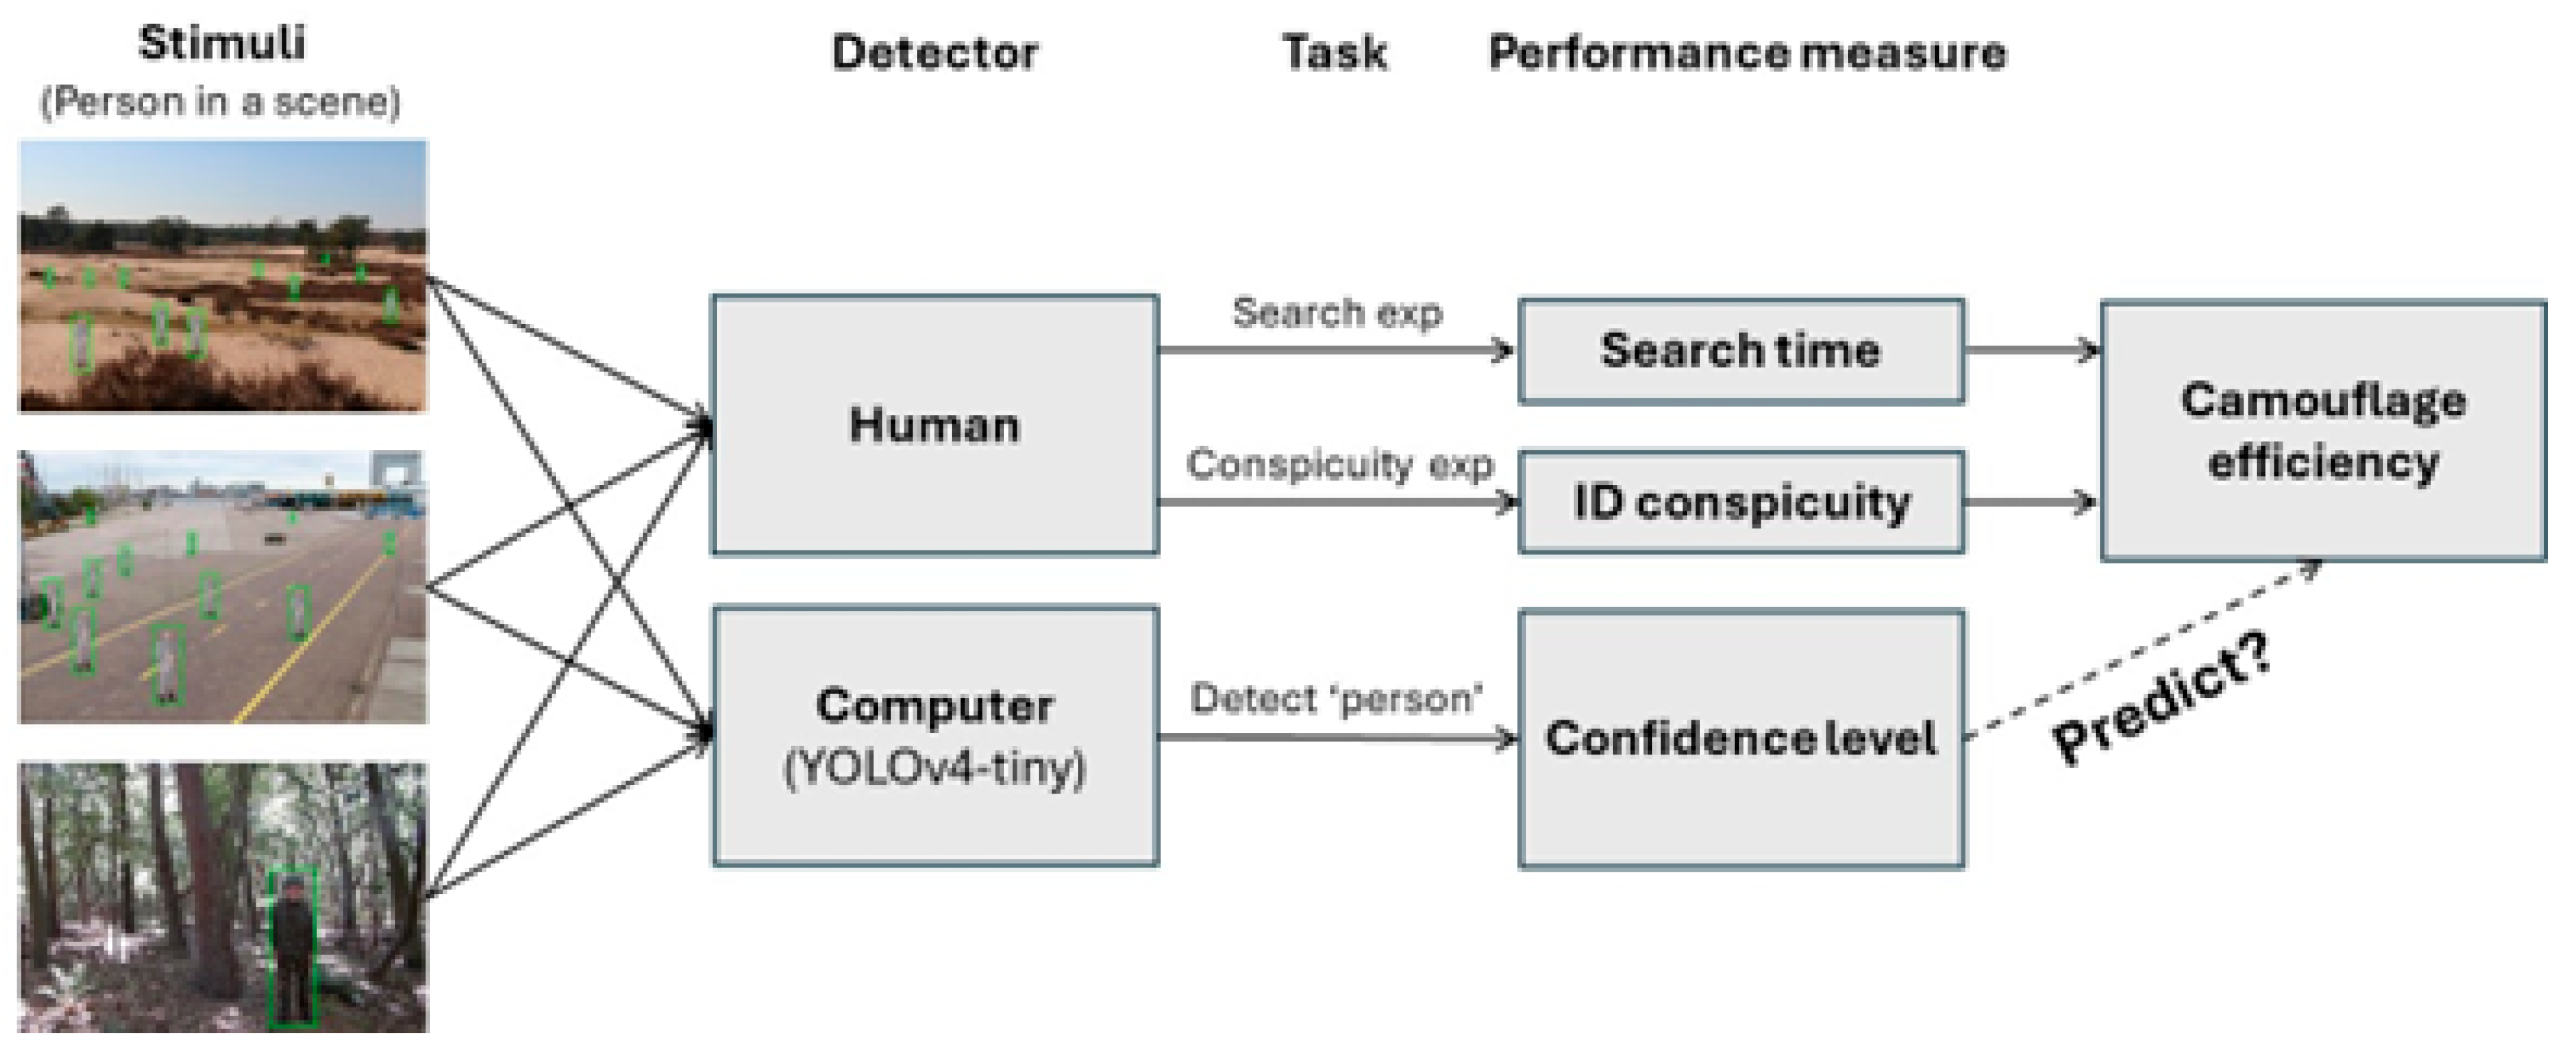
1.3. YOLO Camouflage Metric

State-of-the-art neural networks can detect and classify objects in digital imagery and provide a degree of certainty, or confidence, in their classification. Since this confidence level reflects an object’s visual distinctness, we propose to adopt it as a measure of camouflage effectiveness. The benefit of this approach is that it requires no a priori knowledge of the nature, size, and position of the object of interest.
Today, some of the best object detection results are achieved by models based on convolutional neural networks (CNNs). YOLO [24] is currently one of the fastest and most accurate object detection algorithms available. YOLO uses features learned by a deep convolutional neural network to detect specific objects in videos, live feeds, or images. It looks at the whole image at test time, so its predictions are informed by the global context in the image. The YOLO algorithm first divides the image into a grid. For each grid cell, it predicts a number of object bounding boxes (see the green squares in Figure 2a) with their associated class probabilities or confidence scores using a single feed-forward convolutional neural network. The confidence scores represent the degree of similarity of the detected object to each of the predefined object classes (such as person, train, cat, etc.) and reflect the accuracy of the model prediction. In this study, we validate the YOLO model for the assessment of the effectiveness of camouflaged persons by relating its output to human observer data (identification conspicuity and search performance) obtained in the lab.
In the next sections, we first investigate whether the level of confidence predicted by YOLO can serve as a measure of camouflage effectiveness. To investigate whether the predicted certainty (confidence level) of an object’s identity correlates with its degree of camouflage (i.e., whether it decreases with decreasing visual object distinctness), we apply YOLO to images of a single person situated in different environments and wearing clothing that provides different levels of camouflage. Then, we investigate whether the level of confidence predicted by YOLO also predicts human ratings of object identification conspicuity and human visual search performance. Since identification conspicuity and the level of confidence predicted by YOLO both increase with the visible amount of characteristic object details, we expect that both object distinctness measures will be correlated. A part of this work was previously published as a conference paper [25].
In this study, we focus primarily on static images to evaluate camouflage effectiveness. Previous research has shown that motion significantly undermines the benefits of camouflage—when an object begins to move, it becomes much more conspicuous, even if its appearance is otherwise perfectly matched to the background (as in the classic example of a well-camouflaged tiger revealing itself through movement; see [26,27,28]). That a moving object is easy to detect holds true both for human observers and for artificial vision systems. Given that motion inherently increases detectability (even under ideal camouflage circumstances), our current investigation is limited to static scenarios in which camouflage is most likely to succeed. By isolating this condition, we aim to assess the extent to which YOLO’s predicted confidence scores correlate with human assessments of object conspicuity and visual search performance under optimal camouflage conditions.

2. Experiment 1: YOLO Detection Performance for Camouflaged Persons

Using a photosimulation approach, we examined whether YOLO is able to detect a person wearing camouflage clothing in two different (bush/desert and urban) environments and whether the associated confidence levels of the detections can serve as a measure of camouflage effectiveness. Thereto, an image of a person in camouflage clothing was digitally inserted at multiple locations in photographs of both environments, and YOLO determined the probability that a person was present.

2.1. Methods

The background images used in this study were color photographs of a bush/desert background (Soesterduinen, The Netherlands, see Figure 2a, left panel) and an urban background (Amsterdam, The Netherlands, see Figure 2a, right panel). The original images (recorded with a CANON EOS 80D; resolution width × height: 6000 × 4000 pixels) were resized to a resolution of 1000 × 666 pixels (width × height) to increase the processing speed. These images were also used in a previous study [29]. The images are available online: https://osf.io/pjf4y/?view_only=c8dd075101ab469b8abd42562c33df88 (accessed on 29 April 2025).
Test scenes were generated by inserting the image of a single person (i.e., the target) wearing a grey camouflage suit at various locations in both the bush/desert and urban background scenes. Figure 2a shows the image of the person that was used, superimposed on different locations in the two backgrounds. Each test scene contained a single person at a location (in x, y coordinates) that was both naturalistic (the person was never presented in the air, in a tree, or in a river, etc., although no shadows were added to the ground plane) and systematically manipulated within a certain range. For the bush/desert environment, the x (horizontal) position varied between 66 and 900 pixels (at intervals of half the person width), and the y (vertical; position) varied between 275 and 417 pixels (intervals of half the person height), such that the person was positioned at most locations in the background image. For the urban environment, x varied between 66 and 900 pixels (at intervals of half the person width), and y varied between 150 and 417 pixels (at intervals of half the person height). The size (i.e., height and width) of the person was scaled with distance in the scene. As a result, only a few persons were presented nearby, while most were presented at larger distances.
We used the YOLOv4-tiny pre-trained neural network to detect persons (Learning rate: 0.00261; Momentum: 0.9; Weight decay: 0.0005; Batch size: 64; Max batches: 2000200) [30]. The Python code is available online: https://data-flair.training/blogs/pedestrian-detection-python-opencv/ (accessed on 29 April 2025). For more detailed information regarding the hyperparameters used, see the yolov4-tiny.cfg file (originally from the official Darknet repository: https://github.com/AlexeyAB/darknet (accessed on 29 April 2025)). Note that compared to other YOLO versions, the processing speed of the YOLOv4-tiny algorithm is very fast (up to 200-2550 FSP, see [31,32]), making it one of the faster detectors at the moment; therefore, it is ideal for real-time purposes. The detection was set to classify persons only, and the input images used were small (1000 × 666 pixels) to speed up the process. The threshold for overlapping predictions was low (0.03) since we are only interested in a single class (‘person’). Furthermore, the minimum confidence was set to 0.0001 (to increase the probability that the person was found). The minimum confidence reflects the threshold for the confidence score returned by the model, above which a classification (in our case a ‘person’) is considered correct.
For each person detected by YOLO (i.e., a hit), we determined the detection probability (i.e., the associated confidence score generated by YOLO, indicating the probability that the detected object belongs to the class ‘person’). The probability was set to zero if the person was not detected by YOLO (i.e., a miss). Note that there were no correct rejections since the person was always present. Neither were there any false alarms, indicating that no aspects of the environment were classified as persons. Subsequently, for each background environment separately, we created a detection probability heatmap by summing the YOLO confidence scores for the persons over the image area covered by their body. Then, finally, we determined the average detection probability for each pixel in the image.

2.2. Results

The green squares (bounding boxes) in Figure 2a represent persons found by YOLO. It is clear from the few random examples shown in Figure 2a that YOLO succeeds in finding most persons in both scenes. Only a few were not found (as illustrated by red arrows in Figure 2a). In general, YOLO is able to detect the persons, at least when they are presented nearby, and the detection probability (i.e., the confidence score) decreases with increasing distance (since the person scales with distance, resulting in a decreasing amount of detail).
The detection probability heatmaps are illustrated in Figure 2b for the bush/desert and the urban environment (left and right panels, respectively). Figure 2c illustrates the mean detection probability (collapsed over the horizontal plane) as a function of the person height (i.e., distance of the person, since the person size is scaled with distance). It is clear from this illustration that the detection probability decreases with increasing distance (i.e., with decreasing object resolution or distinctness). YOLO did an excellent job in detecting the persons, even though they were rather tiny (see the green squares in Figure 2a). More specifically, a probability of 80% corresponds to an object size of about ~60 and ~40 pixels in the bush/desert and the urban environment, respectively (see Figure 2c). Therefore, in Experiment 1, we conclude that the person’s camouflage suit was slightly better camouflaged in the urban environment than in the bush environment. This is probably due to the higher homogeneity of the bush background or the color pattern of the camouflage suit, which was visually closer to the colors in the urban environment than the colors in the bush/desert environment.

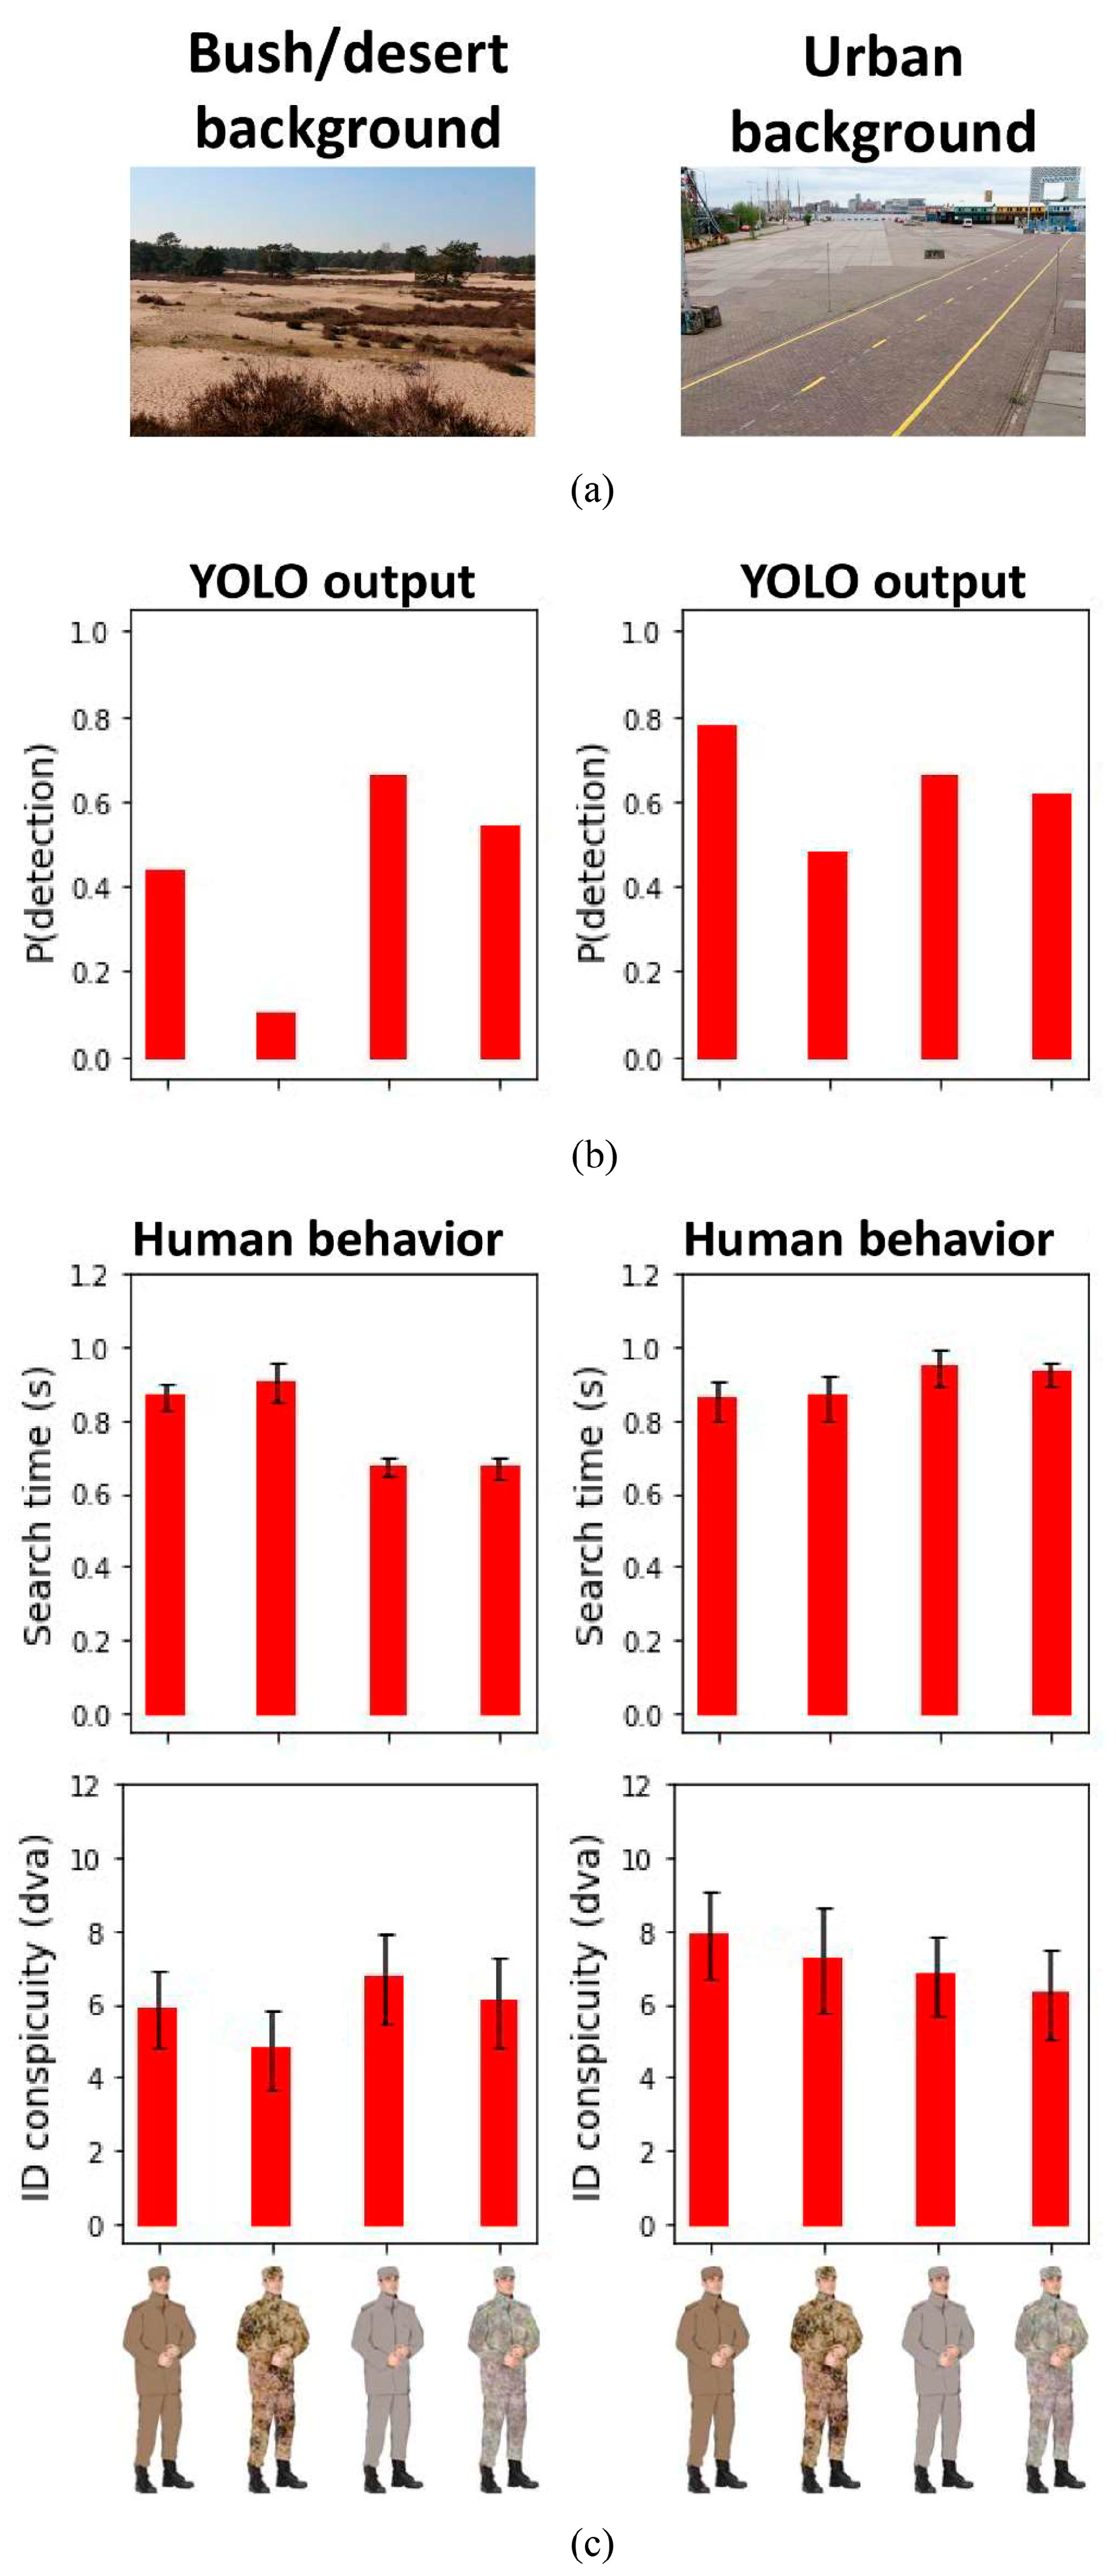
3. Experiment 2: YOLO vs. Human Camouflaged Person Detection on Photosimulations

It is known from the literature that a visual object captures attention when a specific feature, such as its color, shape, or orientation, deviates from its immediate background [33]. Similar results were reported in a military context, indicating that camouflage efficiency is best if a camouflage suit shares properties (such as colors and orientations) with its local background [29,34].
In Experiment 2a, we examine whether YOLO is able to distinguish between good- and bad-performing camouflage patterns based on a comparison of their spatio-chromatic features with those of their local surroundings. Therefore, we manipulated both the pattern and the colors of the camouflage suit and presented the person in either an urban or bush/desert environment (like Experiment 1). The pattern was either an average color or consisted of a 1/f fractal pattern (see Figure 3). The colors used for the camouflage suits were either drawn from the bush/desert environment or from the urban environment. Therefore, we specified a region of interest (ROI) from which the colors were drawn for each environment separately (see Figure 3a). Throughout the experiment, we kept the person’s pose fixed to prevent it from influencing YOLO’s performance. Moreover, we included another condition by adding shading to the person’s camouflage suit since it is known that shading can affect YOLO’s performance (for example, for the detection of fruit; see [35,36]). We manipulated the shade presence to examine whether shades influence YOLO’s performance, as they make it feasible to distinguish human body parts. Figure 3 illustrates the eight camouflage suits used in Experiment 2 (2 ROI’s × 2 camouflage patterns × shade presence). We expect that YOLO has more difficulty in detecting the person when the camouflage suit consists of colors selected from the same background (e.g., a bush/desert camouflage suit in a bush/desert environment) than when it consists of colors selected from a different background (e.g., a bush/desert camouflage suit in an urban environment). Moreover, we expect that YOLO finds it more difficult to detect a person wearing a 1/f fractal pattern than one wearing an average-colored uniform, given that natural images also consist of similar 1/f structures [37,38,39,40,41,42]. Furthermore, we expect that it is easier for YOLO to detect a person with shading than without shading, as the former is more realistic (and YOLO is trained to identify realistic persons). Finally, we expect the detection rate to decrease with distance and that the effect of shading ceases to exist with distance (as the articulation of details decreases with distance).
In Experiment 2b, we examine whether the detection probability provided by YOLO in Experiment 2a generalizes to human observers using a visual search and an object identification conspicuity paradigm. Thereto, we randomly selected a set of 64 images that were also used in Experiment 2a. Each image was shown four times (randomly mirrored) to obtain a better estimate of camouflage performance for each image, and participants performed two tasks. First, an image appeared on the screen, and participants were instructed to press the spacebar as soon as they found the person in the scene (i.e., search task). Subsequently, a mask replaced the image, and participants were asked to indicate the location of the person in the scene using their mouse to verify whether the participant correctly detected the person. Second, we measured the object identification conspicuity [11]. Thereto, the image reappeared on the screen, and participants were asked to fixate on a location on either the left or right in the scene, far away from the person’s location so that they were no longer able to resolve (identify) the person. Next, participants slowly fixated on locations in the scene that were progressively closer to the person until they were able to identify the object in their peripheral vision as a ‘person’. Finally, participants used the mouse to indicate this location. The identification conspicuity reflects the distance between the indicated location and the object’s location (i.e., the eccentricity). If the detection probability derived by YOLO is a realistic measure for detecting persons, then we expect that the detection probability increases with increasing identification conspicuity (i.e., a positive correlation). Moreover, we expect that the detection probability increases with decreasing search times (i.e., a negative correlation) and that the search time increases with decreasing object conspicuity (i.e., a negative correlation).

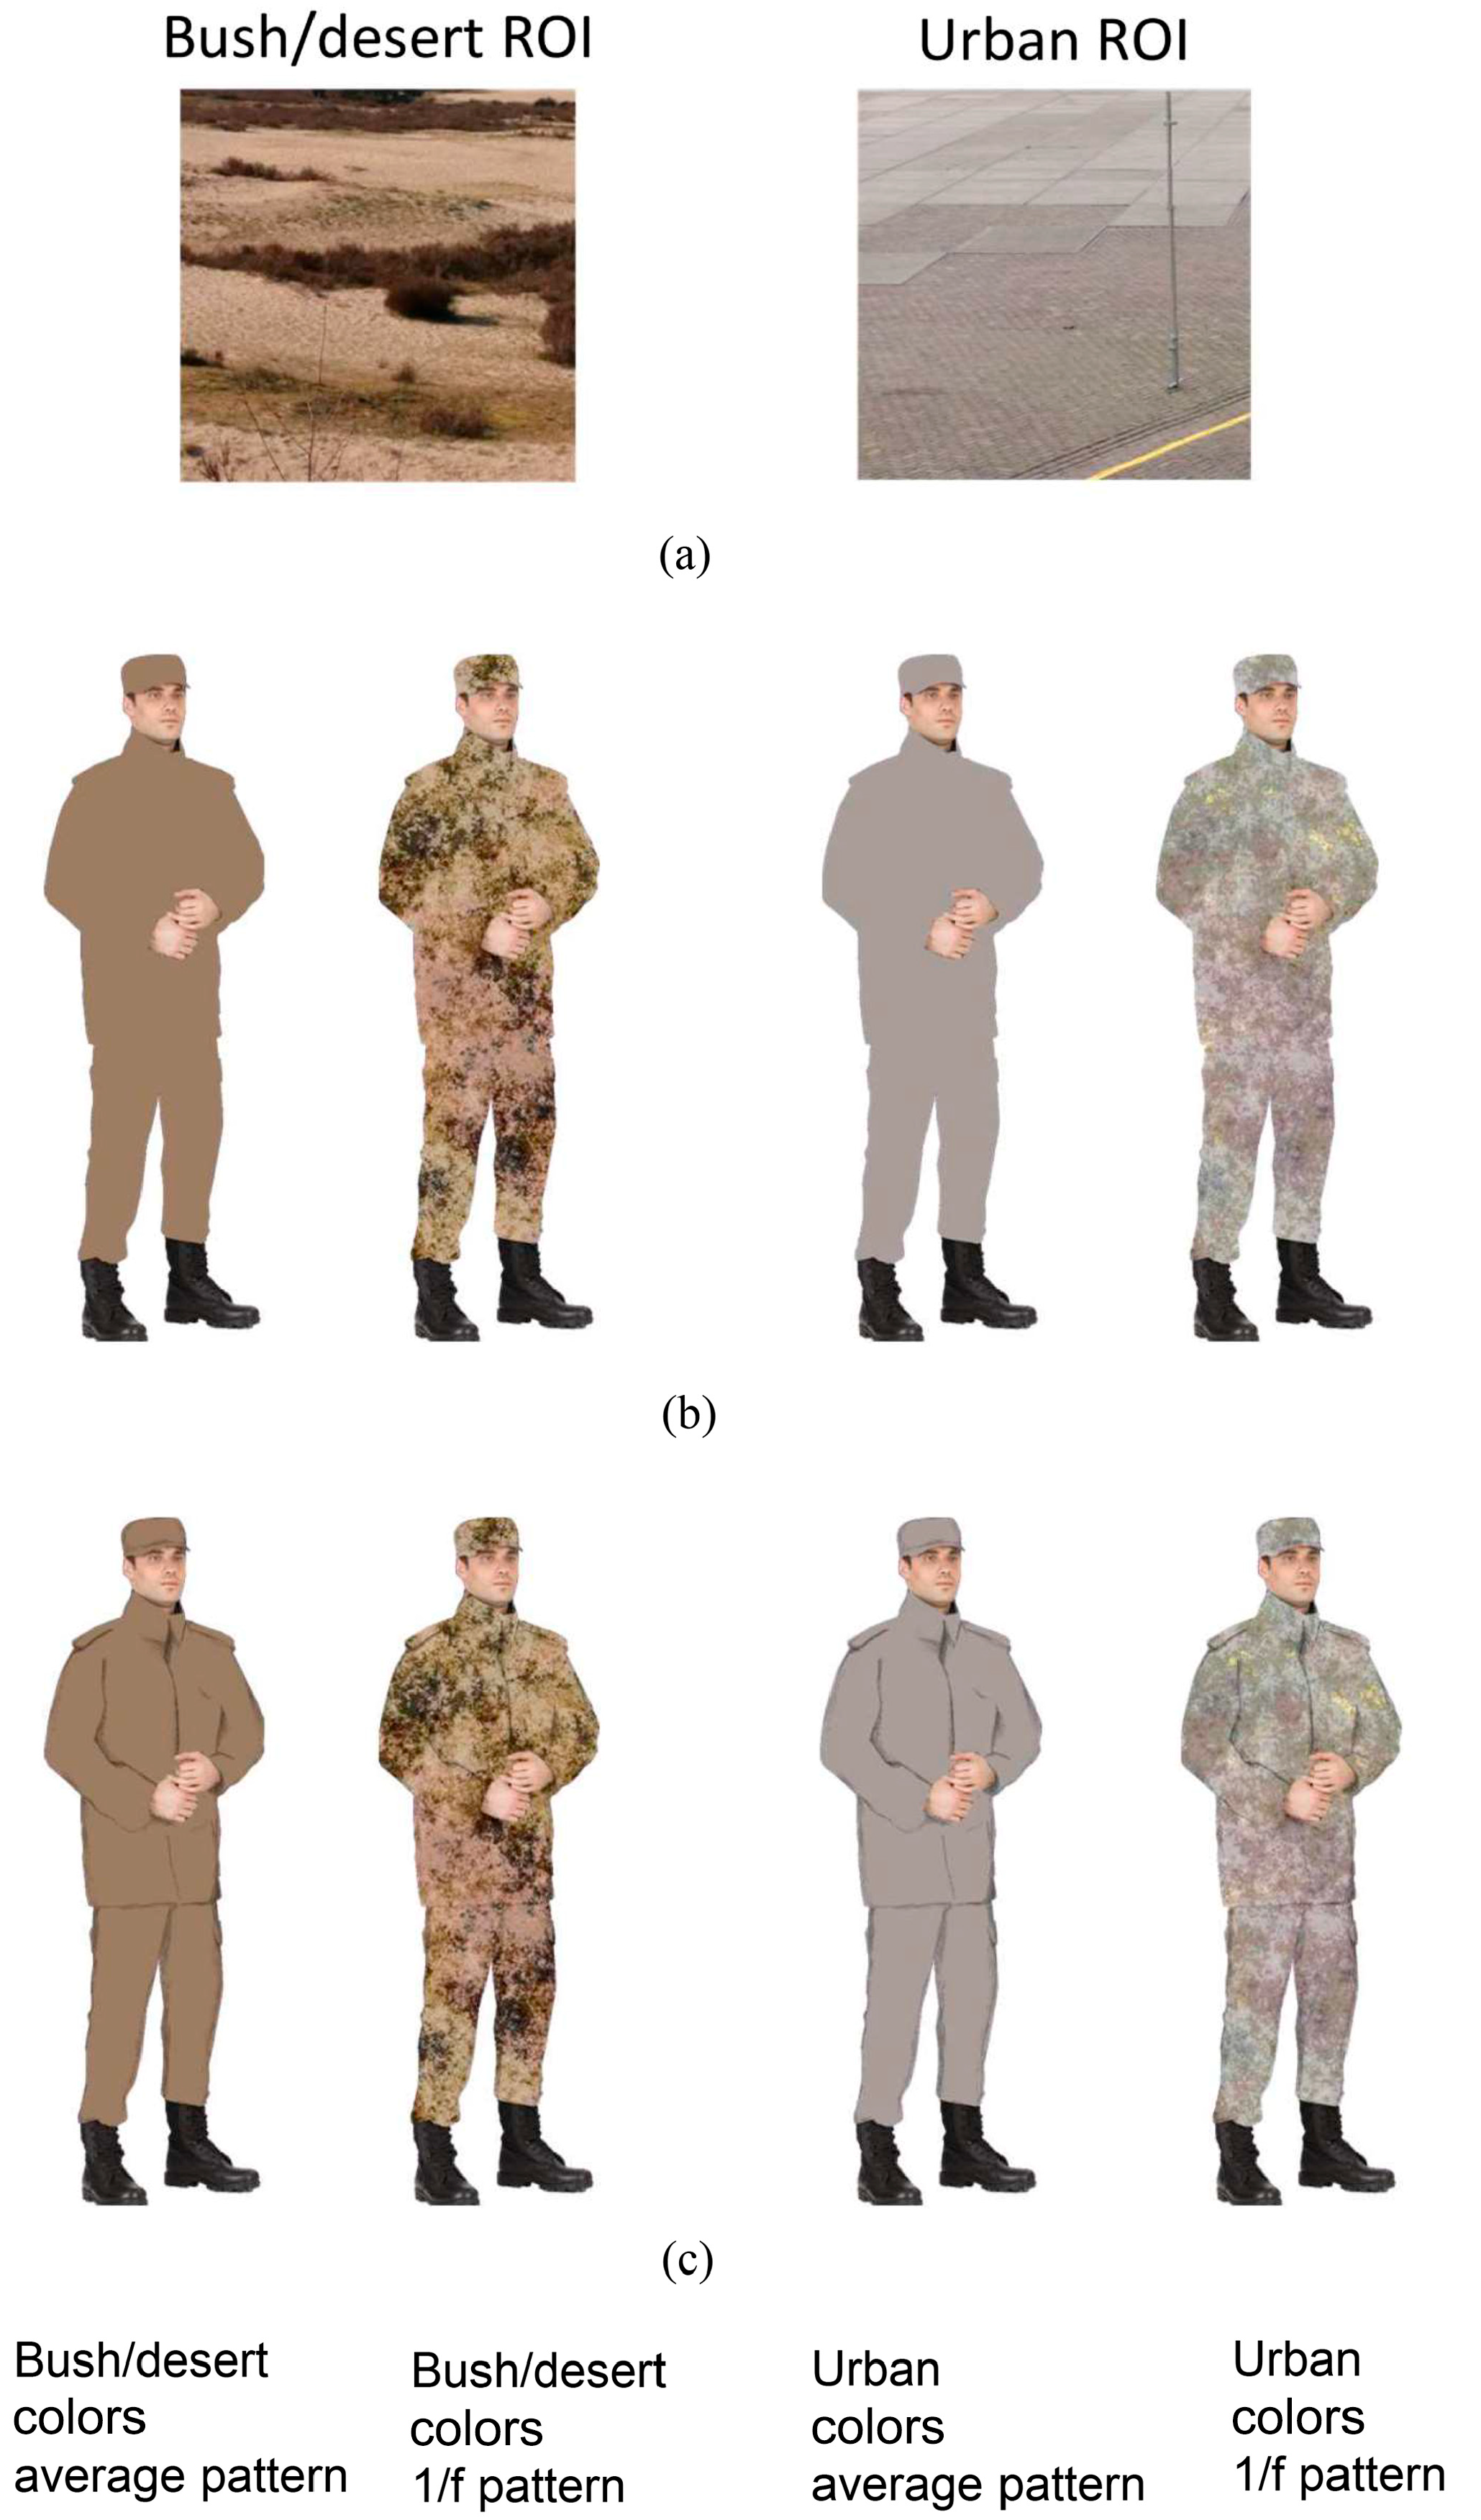
3.1. Methods Experiment 2a

The method was identical to the previous experiment, except for the following changes. In the present experiment, we used the images of the same person but manipulated the pattern on his camouflage suit. Therefore, we first defined an ROI (the area in which persons could reasonably be expected to appear in the scene) for each background environment (see Figure 3a). Based on the ROI of the background (bush/desert or urban environment), a fractal (1/f) camouflage pattern was created with colors (statistically) matching the background, given that fractal structures are known to match the statistics of natural images [41]. The pattern was created as follows [43]: First, a 1/f pattern (pink-noise) pattern in RGB was created. Then, a texture is created for each of the layers of a multiband image (R, G, B) using a random sample of this pink noise pattern. Finally, the color distribution of the background sample (ROI) was applied to the texture using 3D histogram equalization [44]. A second camouflage pattern that was used was the average color over the ROI. Furthermore, we added shading to the camouflage suit to make the persons more realistic. Thereto, half of the camouflage suits included shading (see Figure 3c), whereas the other half of the camouflage suits were without shading (Figure 3b).

3.2. Methods Experiment 2b

3.2.1. Participants

Six participants (2 females, 4 males, mean age 31 years, ranging from 23 to 48 years) participated in both Experiment 2b and Experiment 3b. Two participants were the authors (PP, EVDB), while the others participated voluntarily and were naïve as to the purpose of the experiment. None of the participants had a military background. All participants had normal or corrected vision. None of them reported color deficiencies. The experimental protocol was reviewed and approved by the TNO Internal Review Board (TNO, The Netherlands: reference 2019-024), and it was in agreement with the Helsinki Declaration of 1975, as revised in 2013 [45].

3.2.2. Stimuli and Apparatus

The experiment was programmed and run in Python using the Psychopy module [46,47]. For the validation of Experiment 2a, we selected 64 different images from Experiment 2a (only persons with shading added). More specifically, for each background condition (bush/desert and urban), we randomly selected eight different object locations. For each object location, we manipulated the ROI (bush/desert and urban) and pattern (average and 1/f) of the camouflage suit (see Section 3.1). It is important to note that we fixed the object location within each background condition since this makes it feasible to compare the behavioral performance across the different camouflage suits (i.e., ROI and pattern combination). The images (1000 × 562 pixels; visual angle: 54.7° × 30.7°) were shown four times, either presented normally or mirrored horizontally. The images were presented four times to obtain a better estimate of camouflage performance for each image shown. Participants were seated approximately 100 cm from a 4k Samsung Monitor (UE65MU6100; size: 140 × 80 cm; resolution: 1280 × 720 pixels; Refresh: 60 Hz) and used a standard mouse and QWERTY keyboard to make responses.

3.2.3. Design and Procedure
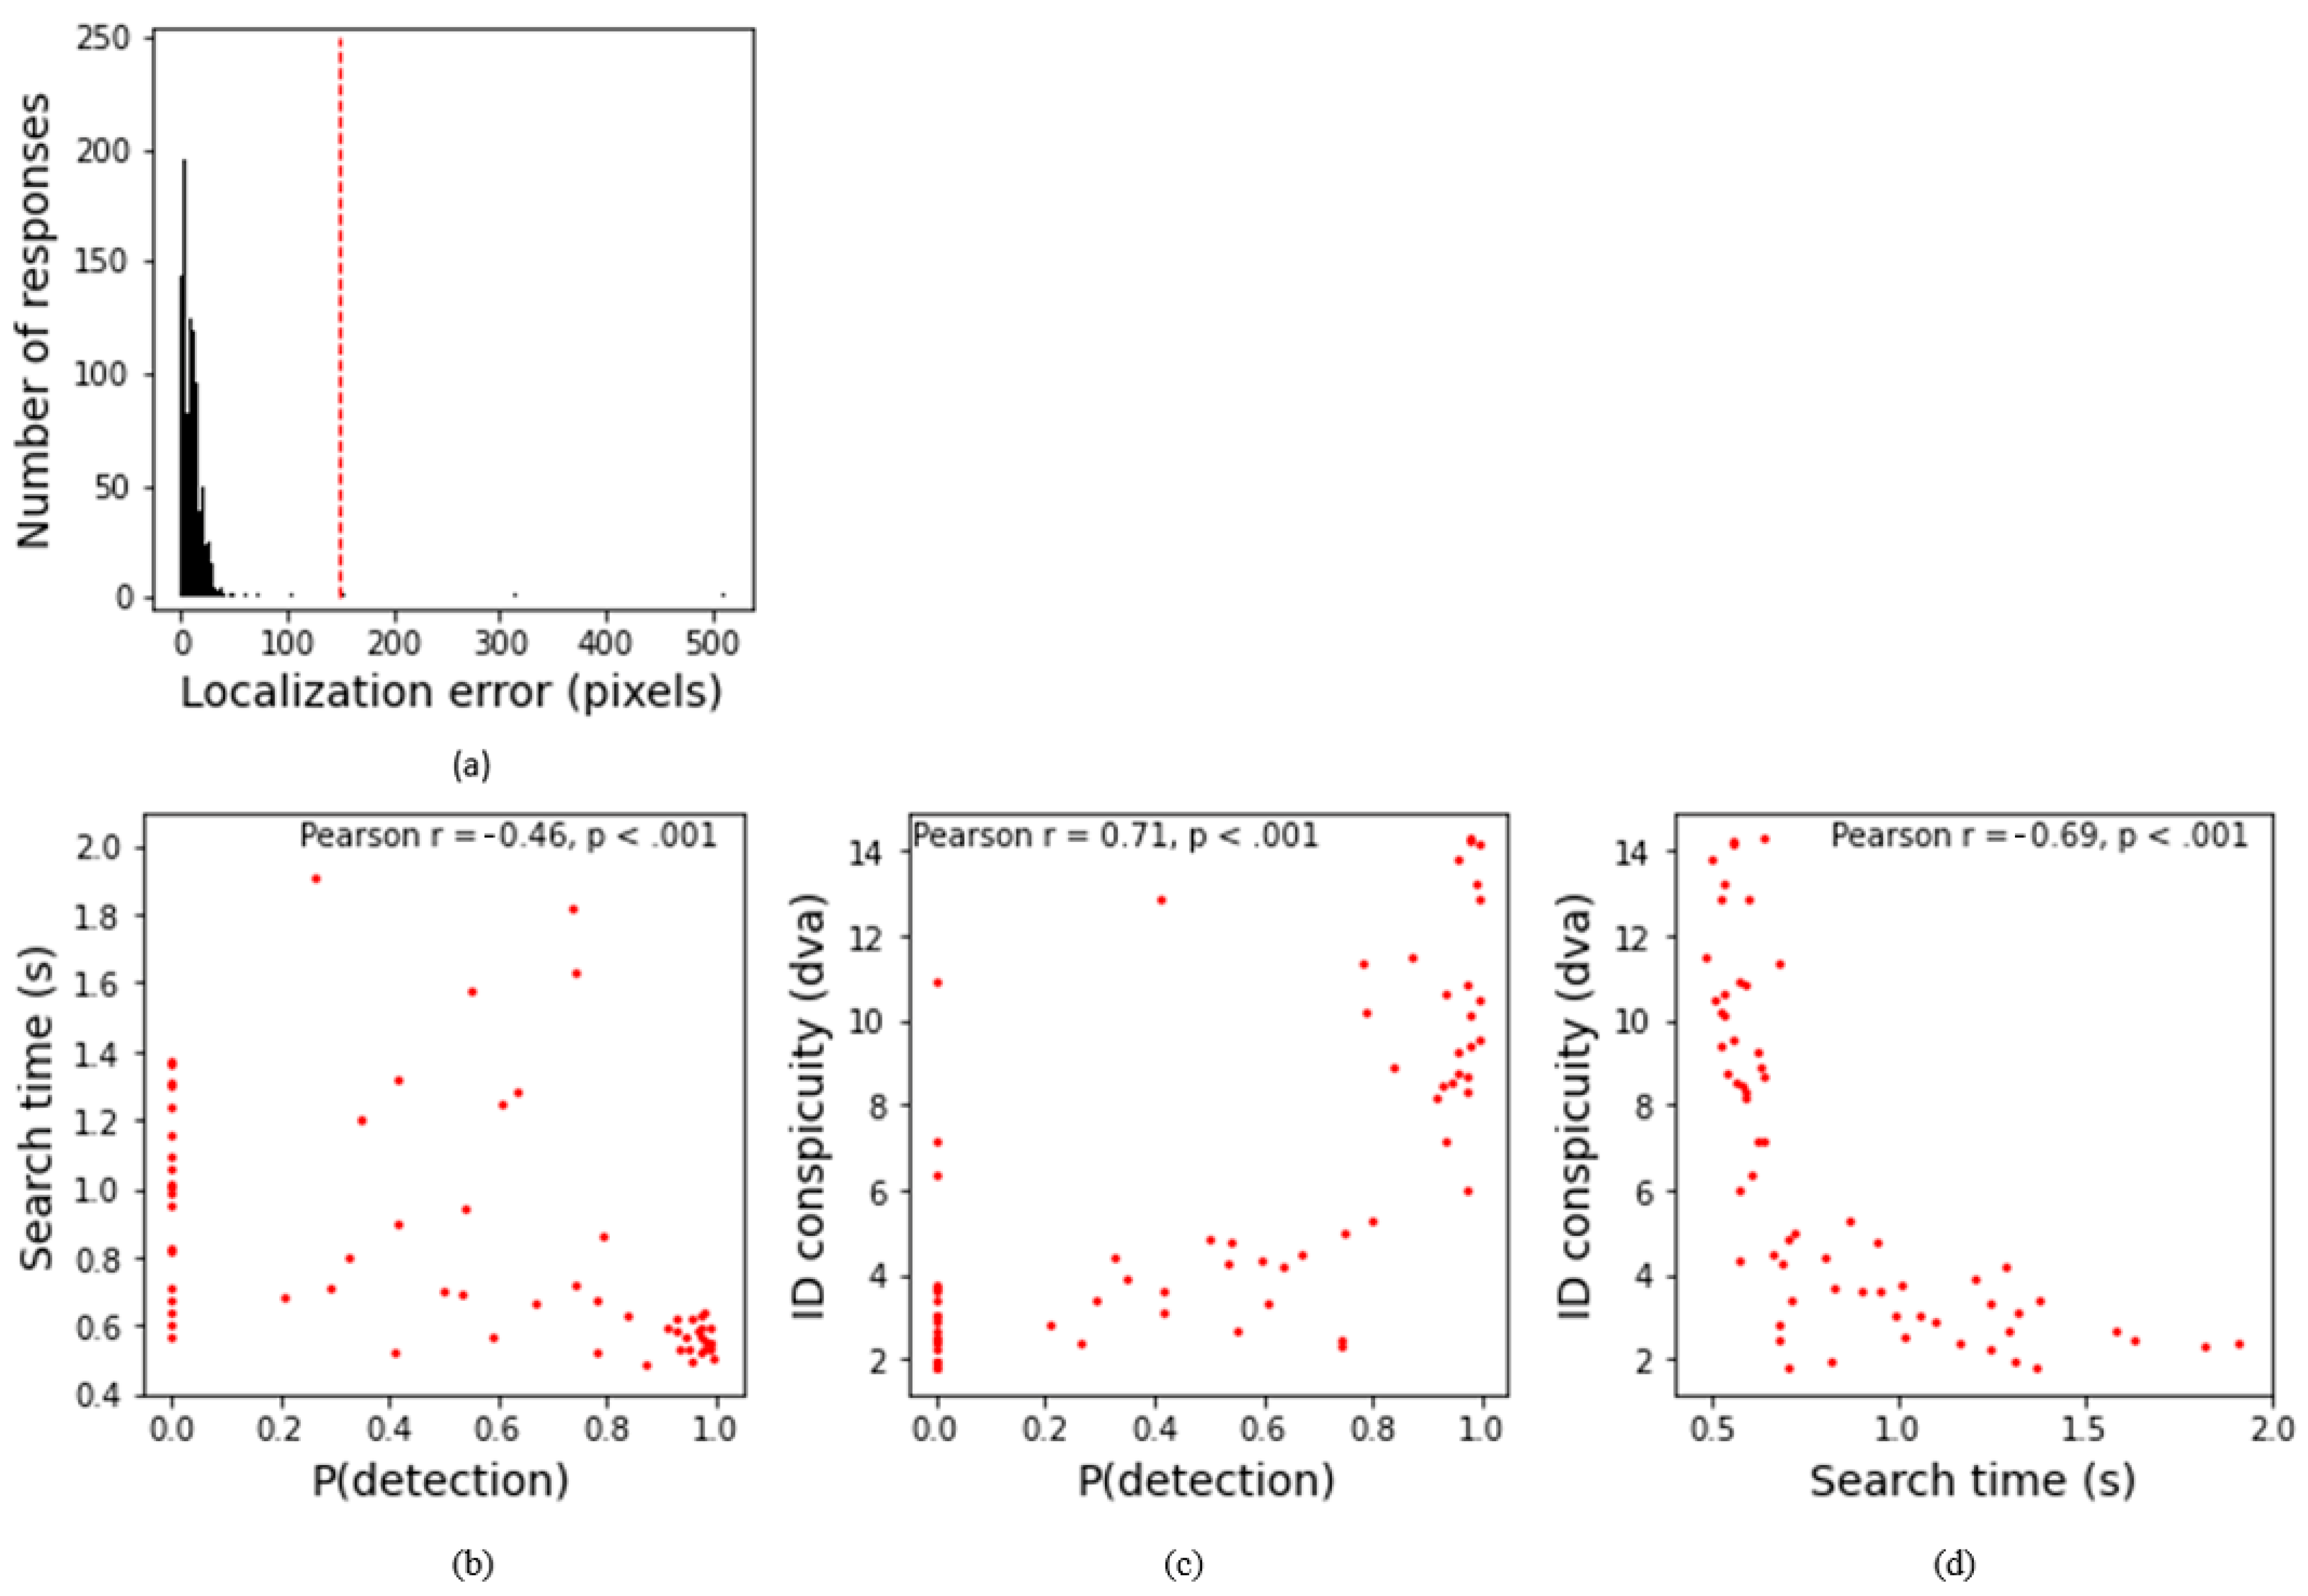
A trial started with the presentation of a white fixation cross on a grey background for a duration of 800 ms. Subsequently, one of the 64 images was shown, and participants were instructed to press the spacebar as quickly as possible when they found the target object (the person). The time between the image onset and the response reflects the search time. A white noise mask replaced the image as soon as the participants pressed the space bar, and participants were instructed to indicate the person’s location using the mouse. Then, the identification conspicuity for the person was measured. Participants used the mouse to indicate the maximum distance from the detected object to identify it as being indeed a person (on either the left or right side of the person). The next trial was initiated when participants made the unspeeded mouse response. Participants performed 256 experimental trials (64 images × 4 repetitions) divided over four blocks. Participants were allowed to take a break between each block and received verbal instructions prior to the experiment. Participants were already familiar with the task since they first performed Experiment 3b, followed by Experiment 2b.

3.3. Results

Figure 4 and Figure 5 illustrate the results of Experiment 2a for the bush/desert and urban background environment, respectively. Here, the detection probability heatmap is shown for each of the eight camouflage suits used.
Figure 6a,b illustrate the detection probability as a function of object height (i.e., distance) for each camouflage suit used in the bush/desert and urban environment (collapsed over the horizontal plane), respectively. Even though for each panel the camouflage suit was always the same, the error bars represent a variance of detection probability over the horizontal plane. This variance is most likely a result of the heterogeneity of the environments. Indeed, the object–background similarity varied over the locations, making the same person highly visible at certain locations and invisible at other locations. This is consistent with the human visual search literature, showing that it is more difficult to find an object that is similar to its background than one that is dissimilar to its background. Furthermore, it is clear from these figures that, in general, the proportion of detected objects decreased with distance. This is in line with the results of our previous behavioral study using the same background images [29]. However, the 1/f camouflage suit with bush/desert colors revealed a somewhat different pattern of results for both backgrounds used. It is clear here that the detection probability did not decrease with distance but instead increased with distance for the urban background and was rather low for the bush/desert environment in general. A feasible explanation for these deviating results is that the 1/f camouflage suit was generated as a whole, without taking important properties of a human being (like having arms, legs, etc.) into account. As a result, YOLO did not classify a large person as a ‘person’. It is interesting to see that for more distant persons, the performance of the 1/f pattern was rather similar to that of the average uniform. Furthermore, it is also interesting that the detection probability increased when shading was added to the camouflage suits (compare the red lines with the black lines in each panel). This makes perfect sense, as adding shading results in more realistic ‘persons’ by emphasizing the shape characteristics of a human being. That the effect of shading disappeared over distance also makes perfect sense, as environmental details (such as a trunk of a tree or a person’s hand) that are clearly visible when observed nearby can no longer be resolved at larger distances.
The persons were located at naturalistic locations for both background environments (so that they were not presented in the air, tree, etc.). Due to this restriction, the persons were smaller for the bush/desert background (ranging between 14.82 and 201.28 pixels) than for the urban background (ranging between 24.37 and 214.20 pixels). Figure 6c,d illustrate the overall mean detection probability for each camouflage suit for both backgrounds. However, unlike the data presented in Figure 6a,b, we collapsed the results over all locations with the constraint that the height of the person was between 24.37 and 201.28 pixels for both background environments, thus enabling a comparison of the camouflage suits across the two different background conditions.
In general, the camouflage efficiency was better (i.e., lower detection probability) for the 1/f pattern (0.55) compared to the average-colored suit (0.85). Interestingly, when focusing on the average-colored suit in the bush/desert background, the camouflage efficiency was better when the colors were drawn from the bush/desert environment (0.46) than from the urban environment (0.88). The opposite effect was observed for the urban background, but only for the average-colored suit. That is, the camouflage efficiency was worse when the colors were drawn from the bush/desert environment (0.93) than from the urban environment (0.84). This opposing effect was not observed for the 1/f fractal pattern, which is most likely due to the deviating results for the 1/f pattern with colors drawn from the bush/desert environment (which is expected to be due to the high contrast pattern breaking the human form rather than to the colors). As expected, the detection probability was lower when the camouflage suit’s color matched the environment (0.63; e.g., urban ROI in an urban environment) than when it did not match the environment (0.77; e.g., urban ROI in a bush/desert environment). This was the case for all four camouflage suits used. This is consistent with the literature—it is easier to find an object when the color is dissimilar to the background than when it is similar to the background [33].
Figure 7 illustrates the results from the behavioral tasks in Experiment 2b. Here, Figure 7a depicts the number of responses as a function of the localization error. Trials were excluded from further analyses if the participants were not able to localize the person accurately (i.e., the localization error was >150 pixels) or when the search time was greater than 10 s. As a result, four trials were excluded where participants were not able to localize the person correctly (0.3%), and one trial was excluded because of the long search time (0.07%).
Figure 7b illustrates the search performance as a function of detection probability for each image used in Experiment 3b. There was a significant negative correlation between the search time (human performance) and detection probability (YOLO performance), Spearman r = −0.65, p < 0.001, indicating that the search time increased with decreasing detection probability. Note that here and elsewhere in the manuscript, alpha was set to 0.05. Figure 7c illustrates the identification conspicuity as a function of the detection probability for each frame tested. As is clear from this figure, identification conspicuity correlated positively with the detection probability, Spearman r = 0.76, p < 0.001, indicating that YOLO predicted the conspicuity performance quite well. The search performance also correlates with the identification conspicuity performance, Spearman r = −0.84, p < 0.001 (see Figure 7d), indicating that search times increased with decreasing object identification conspicuity. What is interesting is that these three correlations were significant for each participant (see Table 1).
Figure 8 illustrates the mean search time and mean object identification conspicuity as a function of ROI (bush/desert versus urban) and pattern (average versus 1/f) for each background condition. Although our overall aim was not to examine which camouflage suit performed better according to the behavioral measure, for each background condition separately, we conducted a post hoc repeated measures ANOVA on the mean search time and mean object identification conspicuity, with ROI (bush/desert versus urban) and pattern (average versus 1/f) as within subject variables.
For the bush/desert background environment (Figure 8, left panels), the ANOVA on the identification conspicuity yielded a significant ROI effect, F(1, 5) = 7.877, p = 0.038, as the mean conspicuity was smaller when the camouflage suit contained colors from the bush/desert background (5.3 dva) than from the urban background (6.4 dva). The mean conspicuity was smaller when the camouflage pattern was 1/f (5.4 dva) than when it was the average color (6.3 dva), as revealed by a significant pattern effect, F(1, 5) = 71.376, p < 0.001. The two-way interaction failed to reach significance: F(1, 5) = 5.014, p = 0.075. The ANOVA on the mean search time yielded a significant ROI effect, F(1, 5) = 50.369, p < 0.001, as the search times were significantly larger when the suit’s color matched the background color (ROI: bush/desert, 883 ms) than when it did not match the background color (ROI: urban, 671 ms). The main effect of pattern and the two-way interaction failed to reach significance: F-values ≤ 3.490, p-values ≥ 0.12.
For the urban background environment (Figure 8, right panels), the ANOVA on the identification conspicuity yielded a significant ROI effect, F(1, 5) = 11.375, p = 0.020, as the mean conspicuity was larger when the camouflage suit contained colors taken from the bush/desert background (7.6 dva) than from the urban background (6.5 dva). There was a trend towards a significant pattern effect, F(1, 5) = 6.192, p < 0.055, as the mean conspicuity was smaller when the camouflage pattern was 1/f (6.8 dva) than when the uniform had an average color (7.3 dva). The two-way interaction failed to reach significance: F(1, 5) = 0.609, p = 0.471. The ANOVA on the mean search time yielded a significant ROI effect, F(1, 5) = 10.030, p < 0.025, as the search times were significantly larger when the suit’s color matched the background color (ROI: urban, 935 ms) than when it did not match the background color (ROI: bush/desert, 860 ms). The main effect of pattern and the two-way interaction failed to reach significance: F-values ≤ 0.117, p-values ≥ 0.746.
The results are clear. As expected from the literature, camouflage efficiency was better when the color of the camouflage suit matched the colors of the background than when it did not [29,43]. This was revealed by both the mean search times as well as the mean object identification conspicuity. Furthermore, the identification conspicuity was smaller for the 1/f pattern than for the average color pattern. However, this effect was only significant for the object identification conspicuity measure but failed to reach significance for the search time, probably due to the low number of observations in this study (given the large inherent variation that is typical for search times, reliable estimates of mean search time require many observers and a large number of repetitions [48]).
To summarize, the results of Experiment 2 show that YOLO predicted the human detection of a camouflaged person quite well, with detection probability correlating negatively with mean search time and positively with mean identification conspicuity. An exception is the high 1/f (bush) pattern that was found to be difficult to detect by YOLO in both environments, whereas human camouflage effectiveness was found to be higher for the patterns matched to the urban environment when measured in that environment.

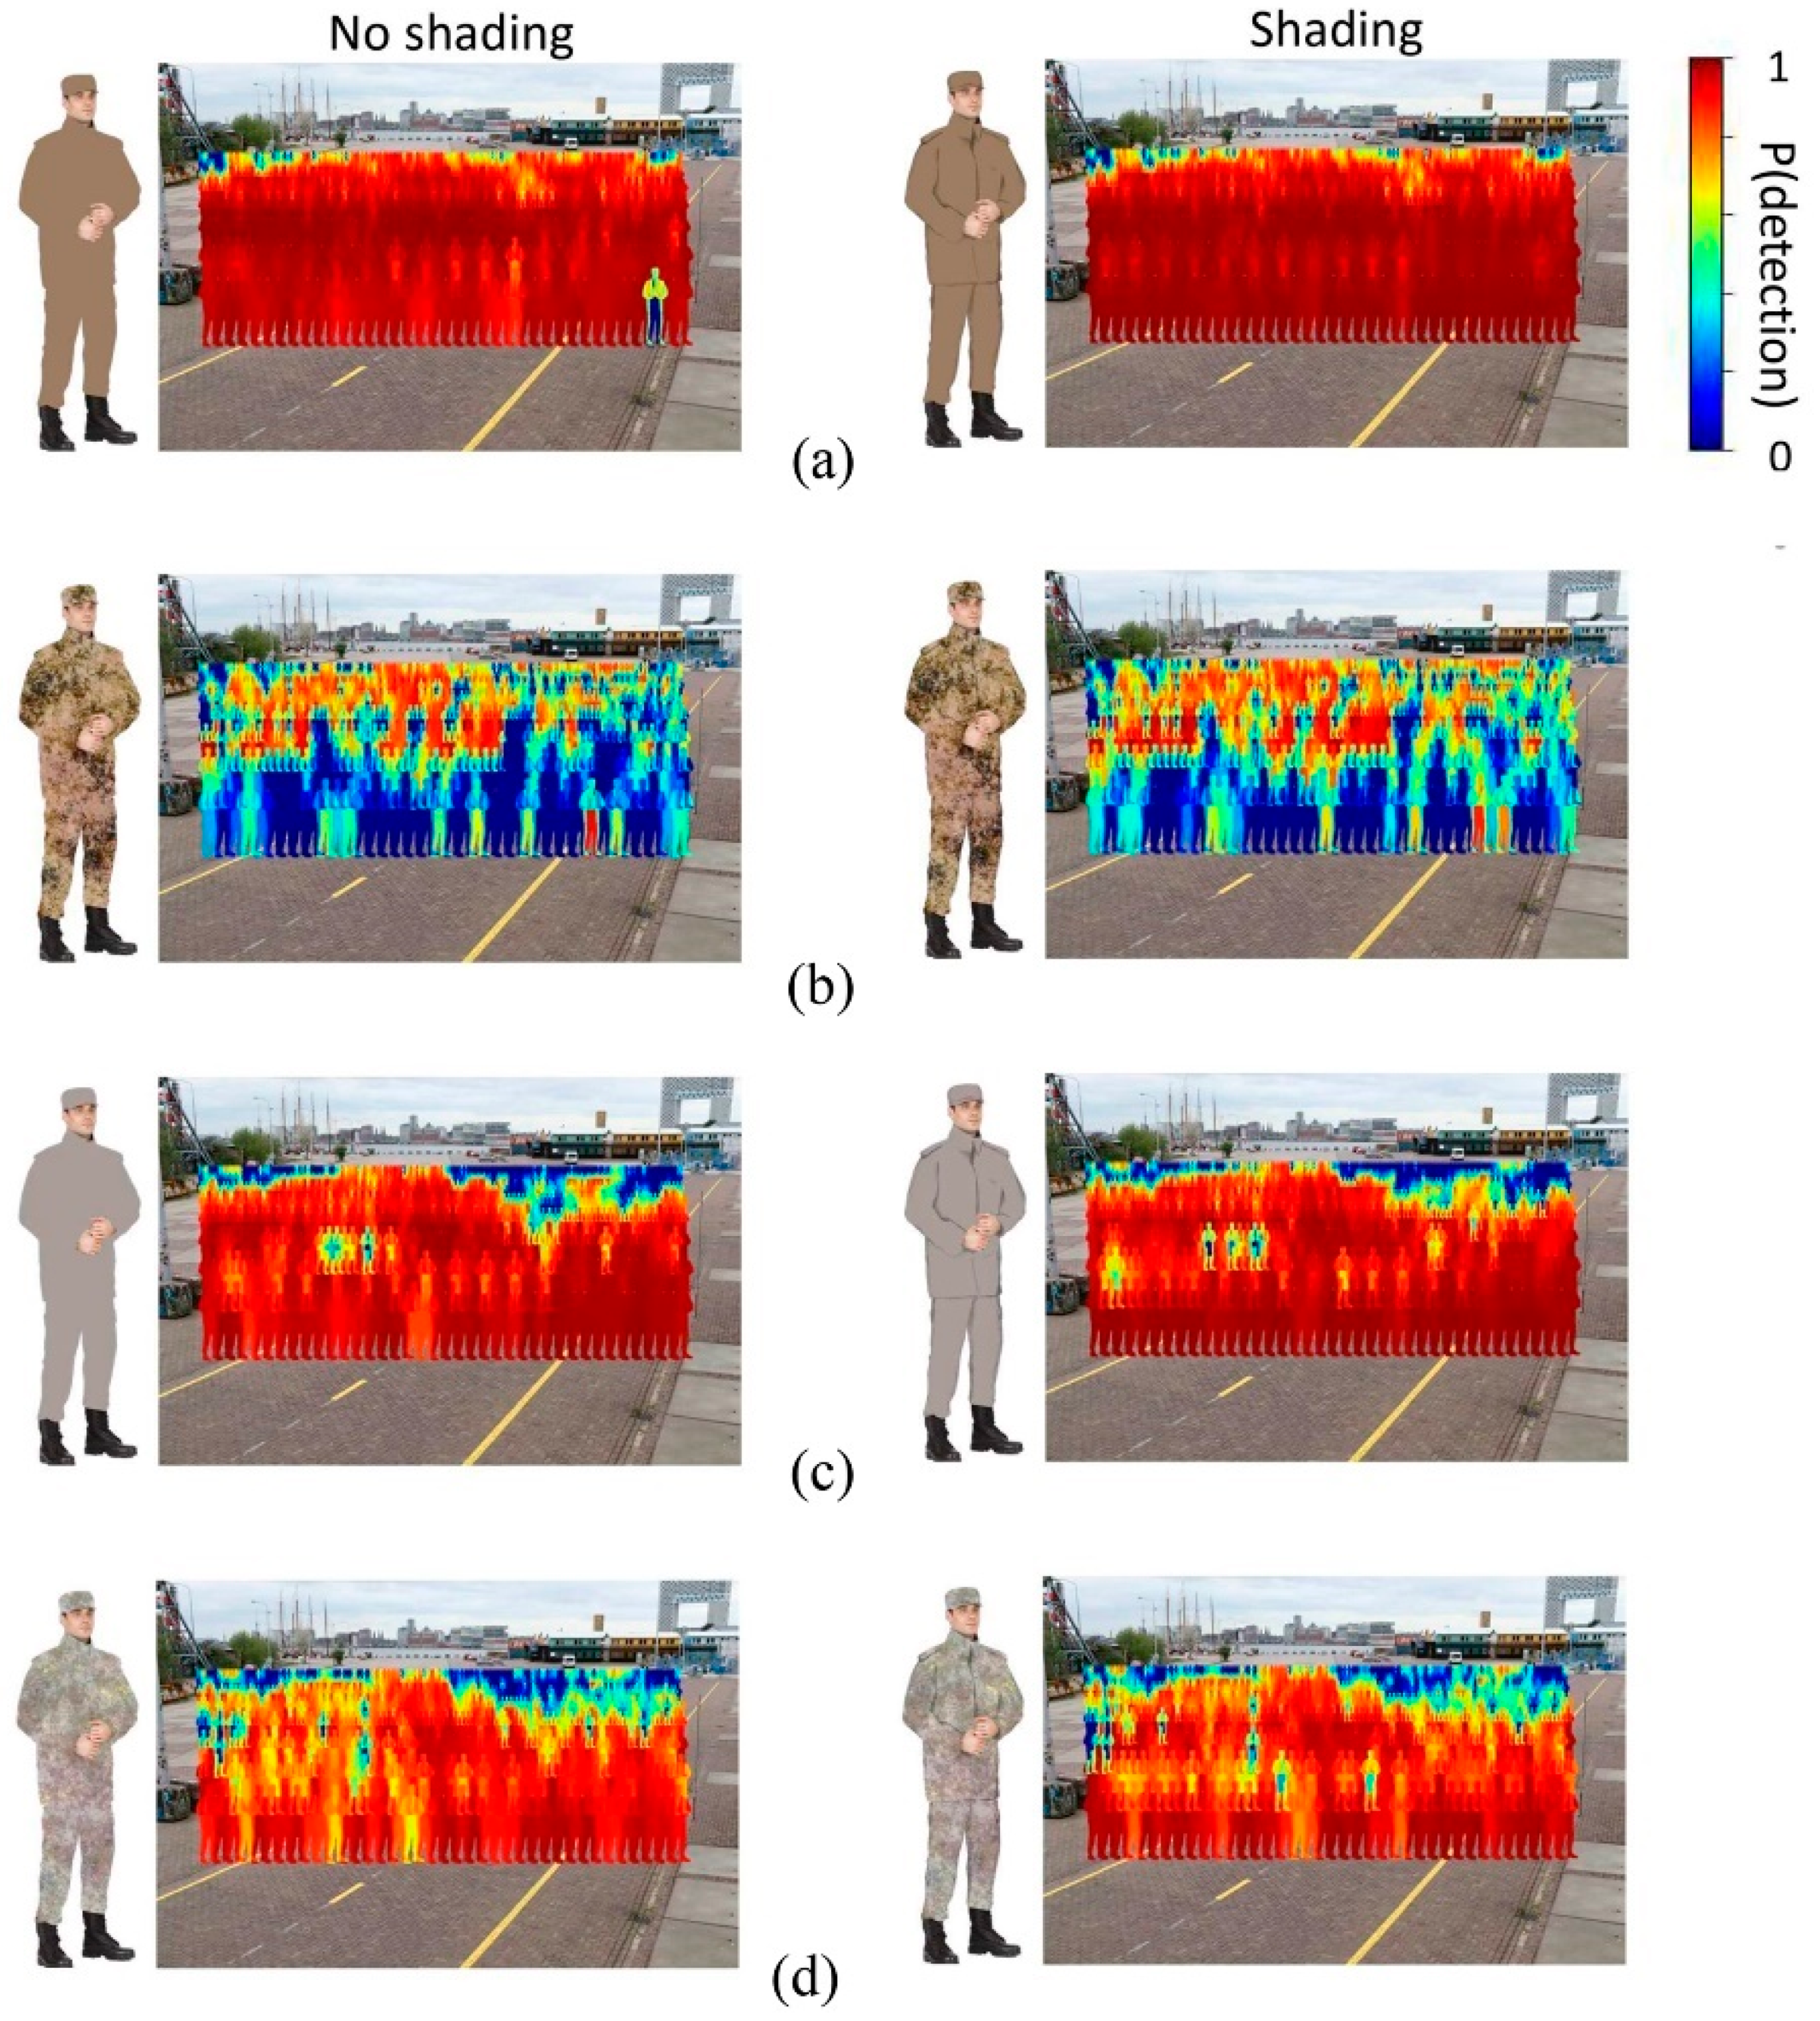
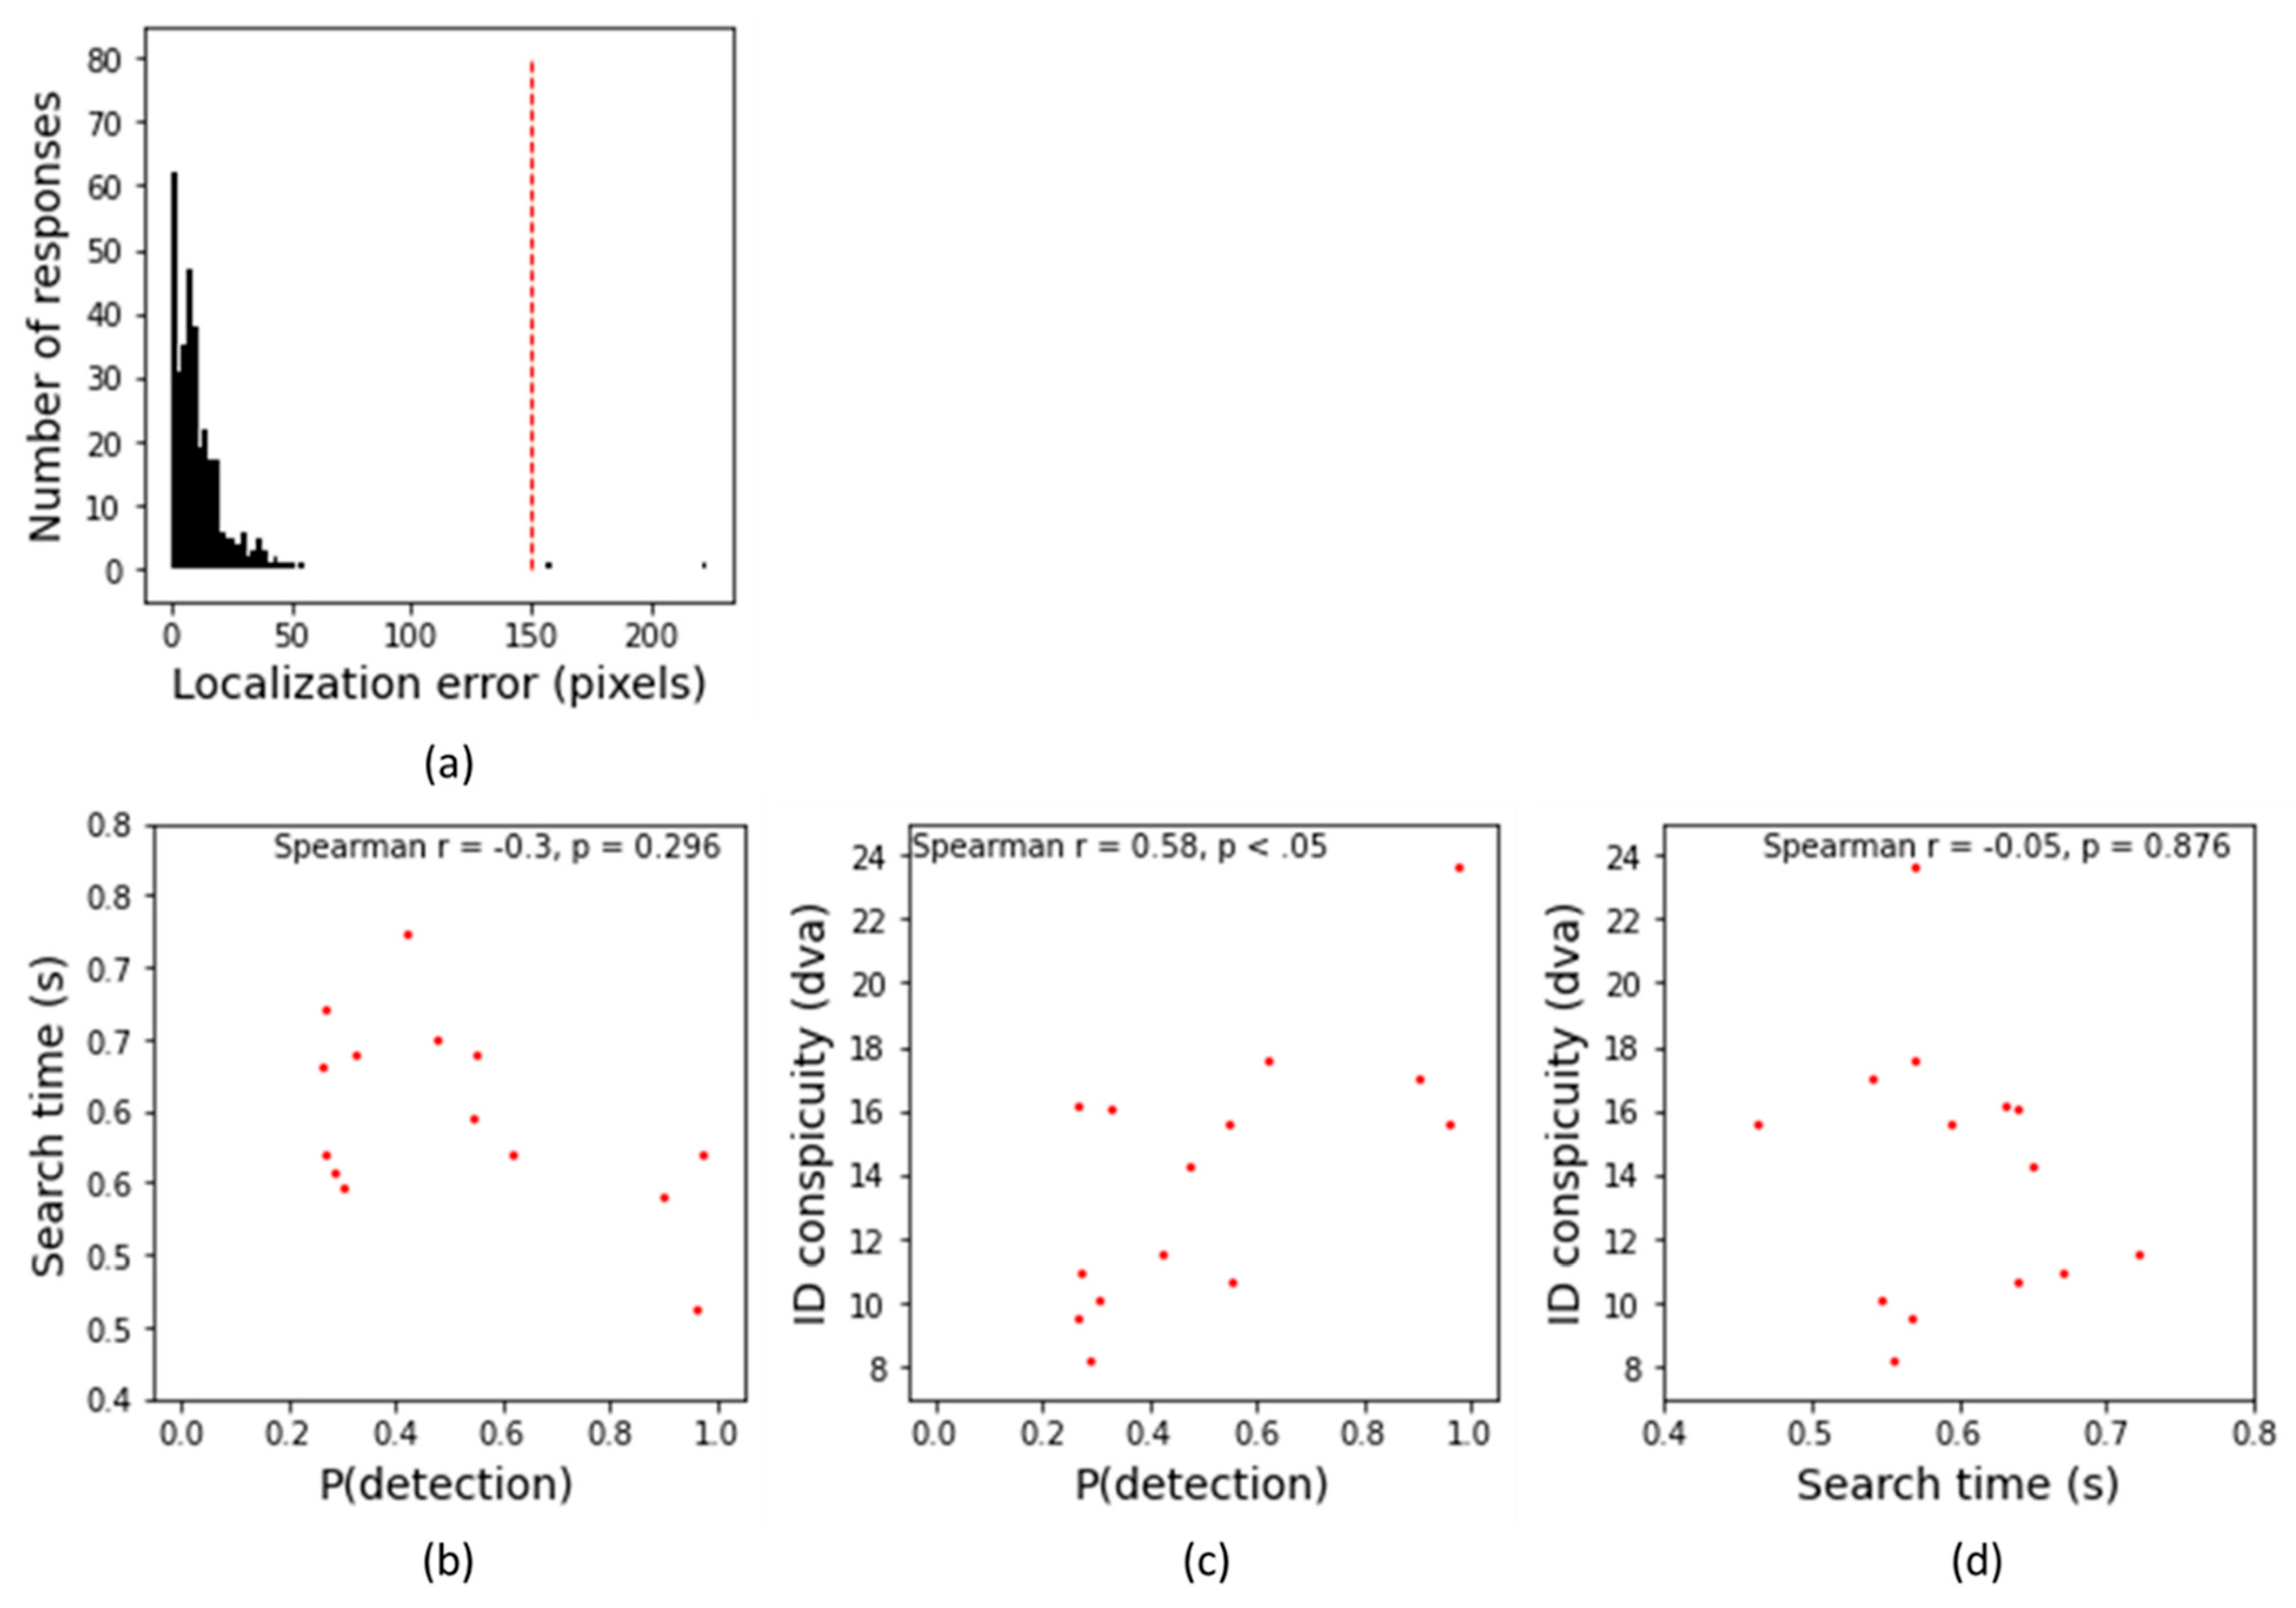
4. Experiment 3: YOLO vs. Human Camouflaged Person Detection on Naturalistic Images

In the photosimulation experiments described in the previous sections, scenes containing a camouflaged soldier were created by embedding a soldier into the scene. Under these conditions, we showed that YOLO is able to detect persons wearing camouflage clothing and that its detection performance correlates with human detection performance. Although the results are convincing, it is not clear to what extent this result holds for settings with naturalistic lighting (shadows) and contrast. Here, we test whether YOLO is capable of detecting persons wearing a camouflage suit and a helmet in a natural environment. To investigate this issue, we performed two more experiments.
First, in Experiment 3a, we examine whether YOLO is able to detect persons wearing camouflage clothing in naturalistic conditions. Therefore, we recorded a movie of a person walking through the forest while wearing a standard Netherlands woodland camouflage suit and a helmet. We expect that YOLO can also detect persons wearing camouflage clothing in naturalistic conditions with a given probability.
Next, in Experiment 3b, we examine whether the detection probability provided by YOLO for persons wearing camouflage clothing in naturalistic conditions correlates with human performance. Thereto, we selected 14 different samples from the movie shown in Experiment 3a and replicated the tasks from Experiment 2b (i.e., a visual search task followed by an object conspicuity task). If YOLO detects the person in the naturalistic environment, then we expect to replicate the results from Experiment 2b.

4.1. Methods Experiment 3a

The movie was recorded in Soesterberg, The Netherlands (9 August 2022). The person was wearing a Netherlands woodland camouflage suit and a green helmet. The short movie (950 samples; 59 s) was resized (1000 × 562 pixels), and YOLO predicted the camouflage efficiency for each sample (as determined by the detection probability).

4.2. Methods Experiment 3b

The experiment was identical to Experiment 2b, except for the following changes: We selected 14 different samples from the movie shown in Experiment 3a. The samples were randomly selected such that the detection probability varied from trial to trial (detection probability for the 14 different samples ranged from 0.26 to 0.97). Each sample was presented four times to obtain a better estimate of camouflage performance for each sample, leading to a total of 54 experimental trials (14 movie samples × 4 repetitions). Participants received verbal instructions prior to the experiment and practiced 6 trials to get familiar with both tasks. Figure 9 illustrates a couple of samples from the movie for illustrative purposes.

4.3. Results

The results of Experiment 3a are illustrated in Figure 9. Here, five random samples from the movie are shown (the person is always present). If YOLO detected the person, the green square signifies its location with a given detection probability as shown in the graph. The graph illustrates the detection probability for each movie frame. The movie can be downloaded online from https://osf.io/vpcer/files/osfstorage/62fd376b7b16410c0c12f3b1 (accessed on 29 April 2025).
Figure 9 illustrates that YOLO did a good job of finding the person. Even though motion detection is not incorporated (i.e., our version of YOLO considers each image as a static individual image), the person was detected in the vast majority of samples. Interestingly, poses such as kneeling down and (partly) hiding behind a tree affected performance significantly.
Figure 10 illustrates the results from Experiment 3b. Figure 10a illustrates the number of responses as a function of the localization error. Trials were excluded from further analyses if the participants were not able to localize the person accurately (i.e., the localization error was >150 pixels) and responded too slowly (RTs > 10 s). As a result, we excluded 0.6% of the trials (only localization errors).
Figure 10b illustrates the search performance as a function of detection probability for each frame used in Experiment 3b. The negative correlation between the search time (human performance) and detection probability (YOLO performance) was not significant: Spearman r = −0.30, p = 0.296. Figure 10c illustrates the identification conspicuity as a function of the detection probability for each frame tested. As is clear from this figure, like in Experiment 2b, the identification conspicuity performance correlated positively with the detection probability, Spearman r = 0.58, p < 0.05, indicating that YOLO predicted the conspicuity performance quite well. Table 2 illustrates the correlations for each participant separately. Interestingly, even though we had only a few trials for each participant, the identification conspicuity correlated positively with the detection probability for four out of six participants. The search performance did not correlate with the identification conspicuity performance: Spearman r = −0.05, p = 0.880 (see Figure 10d). This is most likely due to the low number of search trials in this study [48].
To summarize, the results of Experiment 3 are in line with those from Experiment 2, indicating that the detection probability correlated positively with mean identification conspicuity.

5. Discussion

In general, YOLO was able to detect the persons both in photosimulations (Experiments 1 and 2) and in naturalistic stimuli (Experiment 3). The present study is not the first study illustrating that convolutional neural networks (YOLO) are capable of detecting camouflaged target objects in different environments [49,50,51]. Whereas the vast majority focused primarily on the detection algorithm performance, in the present study, we investigated whether YOLO is capable of assessing camouflage efficiency by comparing its performance with human observer data. Here, we found evidence that camouflage efficiency (as determined by YOLO’s confidence rating: detection probability) correlated with human performance. More specifically, camouflage efficiency correlated positively with the object identification conspicuity and negatively with mean search time. However, the latter correlation was only significant for the photosimulation experiments (Experiment 2b) but failed to reach significance for the naturalistic setting (Experiment 3b). The absence of a significant correlation in the naturalistic setting may be attributed to the combination of a low number of trials (i.e., four) per image and, probably more important, the person being always highly salient. Indeed, the person was always easy to find, with mean search times between 500 and 750 ms, indicating that the person did pop out from their environment on every trial (regardless of their location) [8,9,52,53]. In contrast, in the photosimulation experiment, the mean search time across the different images varied between 500 and 2000 ms, indicating that the search was more difficult for at least some of the images shown. As a result, fewer trials are required to find significant differences across the different images used for the photosimulation than in the naturalistic setting. However, in the visual search literature, a frequently used rule of thumb is that at least 20 trials are required to estimate search performance for a particular condition in a lab setting [54,55] and at least 60 trials in a more applied setting [48]. Nevertheless, the strong positive correlation between the object conspicuity measure and YOLO’s performance is a good indicator that YOLO is suitable for estimating camouflage efficiency.
It is interesting that the detection of persons by YOLO was influenced by whether we superimposed shading on the person or not. It was easier to detect a person with shading than without. This suggests that not only is the outline or silhouette of the person an important factor, but also the articulation of other body parts, such as arms, which became visible when adding shading (see Figure 3). From the perception literature, it is well known that humans are particularly sensitive to the typical configuration of body parts. For instance, studies using point-light displays have shown that observers can reliably detect human figures based solely on the motion of a few key points (most of the time joints), even in cluttered scenes (see, e.g., [56]). This implies that the brain uses information about body part location and movement to detect people. Even without motion cues, the human visual system can detect objects (including people) based on small, diagnostic image fragments—even without seeing the whole object [57]. As expected, detection by YOLO (and humans) decreases with decreasing target size. This can be viewed as a decrease in the signal-to-noise in the system [58], in which the evidence (features) for the presence of the target diminishes with size, with the evidence especially presented by the combination of features and less by the low-level features themselves (that may occasionally resemble elements in the background). The effect of shading disappeared with distance as well. That the effect of shading disappeared with distance makes perfect sense, as for the human eye, details such as the trunk of a tree, the arms of a person, or the letters on billboards typically can no longer be resolved at larger distances. Although the distance effect was rather consistent and present for the vast majority of conditions, it was interesting to observe that YOLO had more difficulties in finding a person wearing a 1/f fractal camouflage suit derived from the bush ROI when the person was nearby than when he was further away. A feasible explanation for this counterintuitive finding is that the textual structures (pattern elements) of the camouflage suit gave the percept that some diagnostic body parts, such as an arm, were missing when the person was nearby but not when he was far away. This occurred even in the condition where we superimposed a shading on the person. A feasible explanation is that the shading had little effect when using a 1/f fractal pattern with colors derived from the bush/desert ROI and not from the urban ROI. In the former condition, the shading effect was minimized due to the dark textures in the camouflage suit (see the shading for both 1/f fractal patterns in Figure 3c). That YOLO has difficulties with detecting persons nearby is intriguing, as this suggests that the whole or at least a large part of the body needs to be clearly visible to detect the person. Simply camouflaging a part of the body (by using a high-contrast pattern like in the present study) seems to be enough to trick YOLO but not the human observer (who is capable of detecting persons based on smaller parts of a body). To enable the evaluation of camouflage in a realistic setting, it would be good to realistically model shading and the different parts of the camouflage suit such that the arms (and other body parts) become more articulated (and thus easier to detect for YOLO).
The present study also replicates earlier findings. For instance, the camouflage efficiency significantly improved when the colors of the camouflage suit (e.g., bush/desert) consisted of colors taken from its immediate background (bush/desert environment) than when it consisted of colors taken from another background urban environment. This color effect was observed for both human behavior and for YOLO’s behavior. Furthermore, again, human performance and YOLO’s performance both indicated that the 1/f fractal pattern is a more efficient camouflage pattern compared to a uniform average color. Interestingly, as is clear from the detection probability heatmaps, even though the camouflage suit and the person’s pose were kept constant for each condition, the camouflage efficiency not only depended on the distance but also on where the person was presented on the horizontal plane. This variance not only illustrates that the camouflage efficiency for a particular camouflage suit depends on the local contrast with its immediate environment, but it also illustrates the value of using YOLO as a tool to measure camouflage efficiency. Indeed, estimating camouflage efficiency for each location using behavioral experiments is simply too time-consuming, if not practically impossible.
To summarize, the finding that YOLO’s confidence score associated with the detection of a camouflaged object correlates with human detection performance suggests that it may be developed into a valid measure of camouflage effectiveness.

5.1. Limitations

In this study, we compared the performance of both humans and the pretrained YOLOv4-tiny model for the detection of camouflaged persons. Since YOLOv4 was introduced, several newer versions have appeared that either prioritize balancing the tradeoff between speed and accuracy rather than focusing on accuracy [59,60], improve the accuracy of person detection in conditions with occlusion [49,61,62,63,64,65,66,67,68] or camouflage [51,69], or enhance the detection of camouflaged objects in general [70]. In contrast, the study reported here was performed to investigate whether YOLO can predict human detection performance for camouflaged targets. If so, it can be used to evaluate the effectiveness of measures and materials designed to hinder the human visual detection of objects and persons. Given its relatively high accuracy, YOLOv4 still appears to be a valid tool for this purpose [64,71]. Hence, it was not the aim of this study to compare the performance of YOLOv4 with other existing (camouflaged) person detection algorithms (that may well outperform human performance). Future research should investigate to what extent different types of convolutional neural networks can predict human detection performance.
In its present form, YOLO’s classification performance appeared especially sensitive to high-contrast, human shape-breaking camouflage (e.g., the 1/f fractal bush/desert camouflage pattern at short distances). The camouflage effectiveness of this pattern (when viewed close by) was overrated when compared to human camouflage measures (e.g., compared to that of the urban patterns in the urban environment). This shows that YOLO (in this form) deviates from human perception in some cases. Similarly, the squatting soldier in the movie was not detected by YOLO. These limitations of YOLOv4-tiny (e.g., sensitivity to body part articulation pose and high-contrast elements) suggest incorporating motion-based detection and custom training based on human data.
Other cases have also been found in which CNNs are shown to deviate from human perception, e.g., CNNs can be fooled by adversarial patches to which humans are not susceptible [20,72,73]. This shows that it remains important to be aware of the differences between these algorithms and human perception, and these differences should be canceled as much as possible (e.g., by training a CNN not solely on detecting the whole body but also on parts of a human body) in order not to draw the wrong conclusions. An ablation study (in which components of the AI network are systematically removed [74]) may be performed to gain insight into the way the network processes the image and the elements it attends to. Another way to get insight into the attended elements is by using deconvolution [75,76]. Such studies may reveal the ways in which the network algorithm deviates from human perception. A complication is that good camouflage should protect against different algorithms as well as humans [77], and what is optimally deceiving for one algorithm may not work for another algorithm [72]. However, more effort might be put towards deceiving those algorithms that may present an actual threat in military context, i.e., those that are more easily accessible and implementable (such as YOLOv4-tiny).
In this study, we did not investigate the effects of environmental factors such as fog, rain, or low lighting on camouflage effectiveness. Each of these factors can significantly alter both the appearance of camouflage and the performance of object detection systems. Future work should, therefore, also study the impact of degraded image quality under inclement weather conditions. In some cases, camouflage that is otherwise ineffective—such as white clothing in a desert or urban setting—may become more effective under specific weather conditions (e.g., snowy or foggy environments). Promising solutions to address visibility issues in degraded imagery are, for instance, image dehazing methods. Applying real-time enhancement methods could not only improve detection performance but could also support the on-the-fly assessment of camouflage effectiveness. Such real-time feedback could inform users in the field about how well they are visually blending with their surroundings and could guide dynamic adjustments in adaptive camouflage systems.

5.2. Future Directions

In this exploratory study, we used only two background scenes and the image of a person as the target object, always with the same pose and viewed from the front in Experiments 1 and 2, and multiple poses (e.g., kneeling or a part of the body) in a naturalist environment in Experiment 3. Future studies should investigate whether YOLO can be applied to assess camouflage performance across a wider range of different backgrounds (such as arctic, and different weather conditions), target objects (different poses, camouflage patterns), viewpoints (from the front, observed from above), and combinations thereof.
In this study, we applied YOLOv4-tiny to detect persons in the individual frames from a video sequence. It would be interesting to replicate the present study using a version of YOLO that incorporates motion detection. Motion is a special case in the visual search literature, as a minimal motion change is known to capture attention immediately [10,78,79,80]. In the military context, it is also known that motion breaks camouflage [26], even if a person wears an optimal camouflage suit [29].
Although we show that YOLOv4-tiny can assess the camouflage efficiency of static images, in the future, it would be an excellent idea to replicate the current study using different representative neural network models (such as Faster R-CNN, Mask R-CNN, etc.) to examine whether other models can do a better job in approaching human camouflage assessment (i.e., providing a better correlation between the model output and human performance). Additionally, a promising direction would be to train models directly on data from behavioral experiments like the present one, enabling them to more closely mimic human camouflage evaluation.

5.3. Conclusions

Our findings show that YOLOv4-tiny can provide a meaningful measure of camouflage effectiveness that aligns with human perception, particularly in terms of detection probability and conspicuity. While the algorithm generally correlates well with human performance, deviations occur at close distances, likely due to YOLO’s sensitivity to high-contrast camouflage elements. These results highlight the potential of convolutional neural networks for evaluating and optimizing camouflage in diverse environments. However, further research is needed to clarify their limitations and refine their application in this domain.

Author Contributions

Conceptualization, A.T., M.A.H. and E.V.d.B.; methodology, A.T., M.A.H. and E.V.d.B.; software, E.V.d.B. and M.A.H.; validation, A.T., M.A.H. and E.V.d.B.; formal analysis, E.V.d.B.; investigation, A.T., M.A.H. and E.V.d.B.; testing participants, P.P.; writing—original draft preparation, A.T., M.A.H. and E.V.d.B.; writing—review and editing, P.P., A.T., M.A.H. and E.V.d.B.; visualization, E.V.d.B.; project administration, M.A.H.; All authors have read and agreed to the published version of the manuscript.

Funding

This research received no external funding.

Institutional Review Board Statement

The study was conducted in accordance with the Declaration of Helsinki and approved by the Institutional Review Board of TNO Internal Review Board (protocol code: 2019-024 and date: 2021-01-06).

Informed Consent Statement

Informed consent was obtained from all subjects involved in the study.

Data Availability Statement

Please see the links in the main text.

Conflicts of Interest

The authors declare no conflict of interest.

References

  1. Toet, A. Computational versus psychophysical image saliency: A comparative evaluation study. IEEE Trans. Pattern Anal. Mach. Intell. 2011, 33, 2131–2146. [Google Scholar] [CrossRef] [PubMed]
  2. Toet, A.; Hogervorst, M. Review of camouflage assessment techniques. In Proceedings of the Target and Background Signatures VI, Orlando, FL, USA, 20 September 2020; pp. 1–29. [Google Scholar] [CrossRef]
  3. Mondal, A. Camouflage design, assessment and breaking techniques: A survey. Multimed. Syst. 2022, 28, 141–160. [Google Scholar] [CrossRef]
  4. Li, N.; Li, L.; Jiao, J.; Xu, W.; Qi, W.; Yan, X. Research status and development trend of image camouflage effect evaluation. Multimed. Tools Appl. 2022, 81, 29939–29953. [Google Scholar] [CrossRef]
  5. Li, Y.; Liao, N.; Deng, C.; Li, Y.; Fan, Q. Assessment method for camouflage performance based on visual perception. Opt. Lasers Eng. 2022, 158, 107152. [Google Scholar] [CrossRef]
  6. Ramsey, S.; Mayo, T.; Howells, C.; Shabaev, A.; Lambrakos, S.G. Modeling apparent camouflage patterns for visual evaluation. In Proceedings of the Algorithms and Technologies for Multispectral, Hyperspectral, and Ultraspectral Imagery XXIV, Orlando, FL, USA, 8 May 2018; p. 1064428. [Google Scholar] [CrossRef]
  7. Ramsey, S.; Mayo, T.; Shabaev, A.; Lambrakos, S. Modeling apparent color for visual evaluation of camouflage fabrics. In Proceedings of the Optics and Photonics for Information Processing XI, San Diego, CA, USA, 7–8 August 2017; p. 103950. [Google Scholar] [CrossRef]
  8. Cass, J.; Van der Burg, E.; Alais, D. Finding flicker: Critical differences in temporal frequency capture attention. Front. Psychol. 2011, 2, 1–7. [Google Scholar] [CrossRef]
  9. Van der Burg, E.; Cass, J.; Olivers, C.N.L.; Theeuwes, J.; Alais, D. Efficient visual search from synchronized auditory signals requires transient audiovisual events. PLoS ONE 2010, 5, e10664. [Google Scholar] [CrossRef]
  10. Van der Burg, E.; Cass, J.; Theeuwes, J. Changes (but not differences) in motion direction fail to capture attention. Vis. Res. 2019, 165, 54–63. [Google Scholar] [CrossRef]
  11. Toet, A.; Bijl, P. Visual conspicuity. In Encyclopedia of Optical Engineering; Driggers, R.G., Ed.; Marcel Dekker Inc.: New York, NY, USA, 2003; pp. 2929–2935. [Google Scholar]
  12. Toet, A.; Kooi, F.L.; Bijl, P.; Valeton, J.M. Visual conspicuity determines human target acquisition performance. Opt. Eng. 1998, 37, 1969–1975. [Google Scholar] [CrossRef]
  13. van der Burg, E.; Ju, J.; Hogervorst, M.A.; Lee, B.; Culpepper, J.; Toet, A. The relation between visual search and visual conspicuity for moving targets. In Proceedings of the Target and Background Signatures VII, Online, 12 September 2021; pp. 92–101. [Google Scholar] [CrossRef]
  14. Beintema, J.A.; Toet, A. Conspicuity of moving soldiers. In Proceedings of the Infrared Imaging Systems: Design, Analysis, Modeling, and Testing XXII, Orlando, FL, USA, 26–28 April 2011; pp. 1–12. [Google Scholar] [CrossRef]
  15. Toet, A. Visual conspicuity of targets in synthetic IR imagery. In Camouflage, Concealment and Deception Evaluation Techniques; Toet, A., Ed.; North Atlantic Treaty Organization: Neuilly-sur-Seine Cedex, France, 2001; Volume RTO-TM-017 AC/323(SCI-012)TP/32, pp. 137–152. [Google Scholar]
  16. Toet, A.; Kooi, F.L.; Kuijper, F.; Smeenk, R.J.M. Objective assessment of simulated daytime and NVG image fidelity. In Proceedings of the Enhanced and Synthetic Vision 2005, Orlando, FL, USA, 28 March–1 April 2005; pp. 1–10. [Google Scholar] [CrossRef]
  17. Bai, X.; Liao, N.; Wu, W. Assessment of camouflage effectiveness based on perceived color difference and gradient magnitude. Sensors 2020, 20, 4672. [Google Scholar] [CrossRef]
  18. Yang, X.; Xu, W.-d.; Jia, Q.; Liu, J. MF-CFI: A fused evaluation index for camouflage patterns based on human visual perception. Def. Technol. 2021, 17, 1602–1608. [Google Scholar] [CrossRef]
  19. Kriegeskorte, N. Deep Neural Networks: A new framework for modeling biological vision and brain information processing. Annu. Rev. Vis. Sci. 2015, 1, 417–446. [Google Scholar] [CrossRef]
  20. den Hollander, R.; Adhikari, A.; Tolios, I.; van Bekkum, M.; Bal, A.; Hendriks, S.; Kruithof, M.; Gross, D.; Jansen, N.; Perez, G.; et al. Adversarial patch camouflage against aerial detection. In Proceedings of the Artificial Intelligence and Machine Learning in Defense Applications II, Orlando, FL, USA, 21–25 September 2020. [Google Scholar] [CrossRef]
  21. Lapuschkin, S.; Wäldchen, S.; Binder, A.; Montavon, G.; Samek, W.; Müller, K.-R. Unmasking Clever Hans predictors and assessing what machines really learn. Nat. Commun. 2019, 10, 1096. [Google Scholar] [CrossRef] [PubMed]
  22. Talas, L.; Fennell, J.G.; Kjernsmo, K.; Cuthill, I.C.; Scott-Samuel, N.E.; Baddeley, R.J. CamoGAN: Evolving optimum camouflage with Generative Adversarial Networks. Methods Ecol. Evol. 2020, 11, 240–247. [Google Scholar] [CrossRef]
  23. Fennell, J.G.; Talas, L.; Baddeley, R.J.; Cuthill, I.C.; Scott-Samuel, N.E. The Camouflage Machine: Optimizing protective coloration using deep learning with genetic algorithms. Evolution 2021, 75, 614–624. [Google Scholar] [CrossRef] [PubMed]
  24. Redmon, J.; Farhadi, A. Yolov3: An incremental improvement. arXiv 2018, arXiv:1804.02767. [Google Scholar]
  25. Van der Burg, E.; Hogervorst, M.A.; Toet, A. Measuring the dynamics of camouflage in natural scenes using convolutional neural networks. In Proceedings of the Target and Background Signatures VIII, Berlin, Germany, 5 December 2022. [Google Scholar] [CrossRef]
  26. Hall, J.R.; Cuthill, I.C.; Baddeley, R.B.; Shohet, A.J.; Scott-Samuel, N.E. Camouflage, detection and identification of moving targets. Proc. R. Soc. B Biol. Sci. 2013, 280, 20130064. [Google Scholar] [CrossRef]
  27. Troscianko, T.; Benton, C.P.; Lovell, P.G.; Tolhurst, D.J.; Pizlo, Z. Camouflage and visual perception. Philos. Trans. R. Soc. B Biol. Sci. 2009, 364, 449–461. [Google Scholar] [CrossRef]
  28. Safaldin, M.; Zaghden, N.; Mejdoub, M. An Improved YOLOv8 to Detect Moving Objects. IEEE Access 2024, 12, 59782–59806. [Google Scholar] [CrossRef]
  29. Van der Burg, E.; Hogervorst, M.A.; Toet, A. Adaptive camouflage for moving objects. J. Percept. Imaging 2021, 4, 020502-1–020502-15. [Google Scholar] [CrossRef]
  30. Wang, C.-Y.; Bochkovskiy, A.; Liao, H.-Y.M. Scaled-yolov4: Scaling cross stage partial network. In Proceedings of the IEEE/cvf conference on computer vision and pattern recognition, Nashville, TN, USA, 20–25 June 2021; pp. 13029–13038. [Google Scholar]
  31. Bochkovskiy, A.; Wang, C.-Y.; Liao, H.-Y.M. Yolov4: Optimal speed and accuracy of object detection. arXiv 2020, arXiv:2004.10934. [Google Scholar]
  32. Tambunan, I.H.; Silaen, D.; Michael, F.; Sihotang, B.A.; Sitanggang, K.G. Performance comparison of YOLOv4 and YOLOv4-Tiny algorithm for object detection on wheeled soccer robot. In Proceedings of the 2022 IEEE International Conference of Computer Science and Information Technology (ICOSNIKOM), Laguboti, Indonesia, 19–21 October 2022; pp. 1–6. [Google Scholar] [CrossRef]
  33. Duncan, J.; Humphreys, G.W. Visual search and stimulus similarity. Psychol. Rev. 1989, 96, 433–458. [Google Scholar] [CrossRef]
  34. Selj, G.K.; Heinrich, D.H. Disruptive coloration in woodland camouflage: Evaluation of camouflage effectiveness due to minor disruptive patches. In Proceedings of the Target and Background Signatures II, Edinburgh, UK, 26–27 September 2016; pp. 83–97. [Google Scholar] [CrossRef]
  35. Zhang, Y.; Zhang, W.; Yu, J.; He, L.; Chen, J.; He, Y. Complete and accurate holly fruits counting using YOLOX object detection. Comput. Electron. Agric. 2022, 198, 107062. [Google Scholar] [CrossRef]
  36. Sun, H.; Wang, B.; Xue, J. YOLO-P: An efficient method for pear fast detection in complex orchard picking environment. Front. Plant Sci. 2023, 13, 1089454. [Google Scholar] [CrossRef] [PubMed]
  37. Billock, V.A. Neural acclimation to 1/f spatial frequency spectra in natural images transduced by the human visual system. Phys. D Nonlinear Phenom. 2000, 137, 379–391. [Google Scholar] [CrossRef]
  38. Chapeau-Blondeau, F.; Chauveau, J.; Rousseau, D.; Richard, P. Fractal structure in the color distribution of natural images. Chaos Solitons Fractals 2009, 42, 472–482. [Google Scholar] [CrossRef]
  39. Chauveau, J.; Rousseau, D.; Chapeau-Blondeau, F. Fractal capacity dimension of three-dimensional histogram from color images. Multidimens. Syst. Signal Process. 2010, 21, 197–211. [Google Scholar] [CrossRef]
  40. Chauveau, J.; Rousseau, D.; Richard, P.; Chapeau-Blondeau, F. Multifractal analysis of three-dimensional histogram from color images. Chaos Solitons Fractals 2010, 43, 57–67. [Google Scholar] [CrossRef]
  41. Field, D.J. Relations between the statistics of natural images and the response properties of cortical cells. J. Opt. Soc. Am. A 1987, 4, 2379–2394. [Google Scholar] [CrossRef]
  42. Torralba, A.; Oliva, A. Statistics of natural images categories. Netw. Comput. Neural Syst. 2003, 14, 391–412. [Google Scholar] [CrossRef]
  43. Toet, A.; Hogervorst, M.A. Urban camouflage assessment through visual search and computational saliency. Opt. Eng. 2013, 52, 1–8. [Google Scholar] [CrossRef]
  44. Pitié, F.; Kokaram, A.C.; Dahyot, R. Automated colour grading using colour distribution transfer. Comput. Vis. Image Underst. 2007, 107, 123–137. [Google Scholar] [CrossRef]
  45. World Medical Association. World Medical Association declaration of Helsinki: Ethical principles for medical research involving human subjects. J. Am. Med. Assoc. 2013, 310, 2191–2194. [Google Scholar] [CrossRef] [PubMed]
  46. Peirce, J.W. PsychoPy—Psychophysics software in Python. J. Neurosci. Methods 2007, 162, 8–13. [Google Scholar] [CrossRef] [PubMed]
  47. Peirce, J.W. Generating stimuli for neuroscience using PsychoPy. Front. Neuroinformatics 2009, 2, 10–18. [Google Scholar] [CrossRef]
  48. Toet, A.; Bijl, P. Visual search. In Encyclopedia of Optical Engineering; Driggers, R.G., Ed.; Marcel Dekker Inc.: New York, USA, 2003; pp. 2949–2954. [Google Scholar]
  49. Li, M.-L.; Sun, G.-B.; Yu, J.-X. A Pedestrian Detection Network Model Based on Improved YOLOv5. Entropy 2023, 25, 381. [Google Scholar] [CrossRef]
  50. Ramdas, K.V.; Gumaste, S. Detection of Camouflaged Objects Using Convolutional Neural Network. Int. J. Intell. Syst. Appl. Eng. 2023, 11, 798–810. [Google Scholar]
  51. Zhang, W.; Zhou, Q.; Li, R.; Niu, F. Research on camouflaged human target detection based on deep learning. Comput. Intell. Neurosci. 2022, 2022. [Google Scholar] [CrossRef]
  52. Wolfe, J.M.; Horowitz, T.S. Five factors that guide attention in visual search. Nat. Hum. Behav. 2017, 1, 58. [Google Scholar] [CrossRef]
  53. Wolfe, J.M.; Horowitz, T.S. What attributes guide the deployment of visual attention and how do they do it? Nat. Rev. Neurosci. 2004, 5, 495–501. [Google Scholar] [CrossRef]
  54. Van der Burg, E.; Olivers, C.N.; Bronkhorst, A.W.; Theeuwes, J. Pip and pop: Nonspatial auditory signals improve spatial visual search. J. Exp. Psychol. Hum. Percept. Perform. 2008, 34, 1053–1065. [Google Scholar] [CrossRef]
  55. Van der Burg, E.; Olivers, C.N.; Bronkhorst, A.W.; Theeuwes, J. Poke and pop: Tactile-visual synchrony increases visual saliency. Neurosci. Lett. 2009, 450, 60–64. [Google Scholar] [CrossRef] [PubMed]
  56. Johansson, G. Visual perception of biological motion and a model for its analysis. Percept. Psychophys. 1973, 14, 201–211. [Google Scholar] [CrossRef]
  57. Ullman, S.; Vidal-Naquet, M.; Sali, E. Visual features of intermediate complexity and their use in classification. Nat. Neurosci. 2002, 5, 682–687. [Google Scholar] [CrossRef]
  58. Merilaita, S.; Scott-Samuel, N.E.; Cuthill, I.C. How camouflage works. Philos. Trans. R. Soc. B Biol. Sci. 2017, 372, 20160341. [Google Scholar] [CrossRef]
  59. Terven, J.; Cordova-Esparza, D. A comprehensive review of YOLO: From YOLOv1 to YOLOv8 and beyond. arXiv 2023, arXiv:2304.00501. [Google Scholar] [CrossRef]
  60. Diwan, T.; Anirudh, G.; Tembhurne, J.V. Object detection using YOLO: Challenges, architectural successors, datasets and applications. Multimed. Tools Appl. 2023, 82, 9243–9275. [Google Scholar] [CrossRef] [PubMed]
  61. Chen, C.; Zhu, H.; Ren, Q.; Luo, R.; Lan, H. Improved YOLO-based Pedestrian Detection Algorithm. In Proceedings of the 2023 6th International Conference on Image and Graphics Processing, Chongqing, China, 6–8 January 2023; pp. 135–141. [Google Scholar] [CrossRef]
  62. Li, M.; Chen, S.; Sun, C.; Fang, S.; Han, J.; Wang, X.; Yun, H. An Improved Lightweight Dense Pedestrian Detection Algorithm. Appl. Sci. 2023, 13, 8757. [Google Scholar] [CrossRef]
  63. Maya-Martínez, S.-U.; Argüelles-Cruz, A.-J.; Guzmán-Zavaleta, Z.-J.; Ramírez-Cadena, M.-d.-J. Pedestrian detection model based on Tiny-Yolov3 architecture for wearable devices to visually impaired assistance. Front. Robot. AI 2023, 10, 1052509. [Google Scholar] [CrossRef]
  64. Mishra, S.; Jabin, S. Real-Time Pedestrian Detection using YOLO. In Proceedings of the 2023 International Conference on Recent Advances in Electrical, Electronics & Digital Healthcare Technologies (REEDCON), New Delhi, India, 1–3 May 2023; pp. 84–88. [Google Scholar] [CrossRef]
  65. Razzok, M.; Badri, A.; El Mourabit, I.; Ruichek, Y.; Sahel, A. Pedestrian Detection and Tracking System Based on Deep-SORT, YOLOv5, and New Data Association Metrics. Information 2023, 14, 218. [Google Scholar] [CrossRef]
  66. Tang, F.; Yang, F.; Tian, X. Long-Distance Person Detection Based on YOLOv7. Electronics 2023, 12, 1502. [Google Scholar] [CrossRef]
  67. Xiang, N.; Wang, L.; Jia, C.; Jian, Y.; Ma, X. Simulation of Occluded Pedestrian Detection Based on Improved YOLO. J. Syst. Simul. 2023, 35, 286–299. [Google Scholar] [CrossRef]
  68. Zou, G.; Zhang, Z. Pedestrian target detection algorithm based on improved YOLO v5. In Proceedings of the International Conference on Internet of Things and Machine Learning (IoTML 2023), Singapore, 15–17 September 2023; p. 1293719. [Google Scholar] [CrossRef]
  69. Liu, Y.; Wang, X.; Hu, E.; Wang, A.; Shiri, B.; Lin, W. VNDHR: Variational Single Nighttime Image Dehazing for Enhancing Visibility in Intelligent Transportation Systems via Hybrid Regularization. IEEE Trans. Intell. Transp. Syst. 2025, 1–15. [Google Scholar] [CrossRef]
  70. Kong, L.; Wang, J.; Zhao, P. YOLO-G: A Lightweight Network Model for Improving the Performance of Military Targets Detection. IEEE Access 2022, 10, 55546–55564. [Google Scholar] [CrossRef]
  71. Jiang, P.; Ergu, D.; Liu, F.; Cai, Y.; Ma, B. A Review of Yolo Algorithm Developments. Procedia Comput. Sci. 2022, 199, 1066–1073. [Google Scholar] [CrossRef]
  72. Schwegmann, A. Evaluation of dual attribute adversarial camouflage and counter-AI reconnaissance methods in terms of more realistic spatial alignment. In Proceedings of the Target and Background Signatures IX, Amsterdam, The Netherlands, 3–7 September 2023. [Google Scholar] [CrossRef]
  73. Schwegmann, A. Camouflage methods to counter artificial intelligence recognition (Conference Presentation). In Proceedings of the Target and Background Signatures VIII, Berlin, Germany, 5 September 2022; p. 1227005. [Google Scholar]
  74. Meyes, R.; Lu, M.; de Puiseau, C.W.; Meisen, T. Ablation studies in artificial neural networks. arXiv 2019, arXiv:1901.08644. [Google Scholar] [CrossRef]
  75. Noh, H.; Hong, S.; Han, B. Learning deconvolution network for semantic segmentation. In Proceedings of the IEEE International Conference on Computer Vision, Santiago, Chile, 7–13 December 2015; pp. 1520–1528. [Google Scholar]
  76. Ribeiro, M.T.; Singh, S.; Guestrin, C. “Why Should I Trust You?”: Explaining the Predictions of Any Classifier. In Proceedings of the Proceedings of the 22nd ACM SIGKDD International Conference on Knowledge Discovery and Data Mining, San Francisco, CA, USA, 13–17 August 2016; pp. 1135–1144. [Google Scholar] [CrossRef]
  77. Wang, Y.; Fang, Z.; Zheng, Y.-f.; Yang, Z.; Tong, W.; Cao, T.-y. Dual Attribute Adversarial Camouflage toward camouflaged object detection. Def. Technol. 2023, 22, 166–175. [Google Scholar] [CrossRef]
  78. Abrams, R.A.; Christ, S.E. Motion onset captures attention. Psychol. Sci. 2003, 14, 427–432. [Google Scholar] [CrossRef]
  79. Abrams, R.A.; Christ, S.E. The onset of receding motion captures attention: Comment on Franconeri and Simons (2003). Percept. Psychophys. 2005, 67, 219–223. [Google Scholar] [CrossRef]
  80. Howard, C.J.; Holcombe, A.O. Unexpected changes in direction of motion attract attention. Atten Percept Psychophys 2010, 72, 2087–2095. [Google Scholar] [CrossRef]
Figure 1. Flowchart of the present study. For each experiment, we either generated (Experiments 1 and 2) or recorded stimuli (Experiment 3)—each consisting of a single person (at multiple locations and sometimes poses) in a camouflage suit against a specific background. Human participants completed two tasks: a visual search task, yielding search times (i.e., time required to locate the person), and a visual conspicuity task, measuring identification conspicuity (i.e., the maximum angle at which the person remains distinguishable from the background). Both metrics are established indicators of camouflage effectiveness. In parallel, we used YOLOv4-tiny to detect the person in each scene, extracting confidence levels for classification as a ‘person.’ The study examines whether YOLO’s confidence scores predict camouflage efficiency as determined by human performance.
Applsci 15 05066 g001
Figure 2. Results of experiment 1. (a) Example of the bush/desert background (location: Soesterduinen) and urban background (location: Amsterdam) conditions. For illustrative purposes, multiple targets are shown. In the actual experiment, there was always one single target, and YOLO provided information about the detectability. In both panels, green squares signify that YOLO detected persons (with a given detection probability). Red arrows indicate the persons that YOLO was unable to detect. Note that the persons are scaled with distance. (b) Mean detection probability (i.e., the confidence score generated by YOLO) in the bush/desert environment (left panel) and urban environment (right panel). (c) Mean detection probability (collapsed over the horizontal plane) as a function of the target height (image width and height were 1000 and 666 pixels, respectively). The shading signifies the standard error (due to variation over the horizontal plane). Note that the target height also reflects the distance since the target’s size is scaled with distance.
Applsci 15 05066 g002
Figure 3. (a) Region of interest (ROI) in the bush/desert (left panel) and the urban environment (right panel). (b) Camouflage patterns used in Experiment 2 without shading. (c) Camouflage patterns with shading.
Applsci 15 05066 g003
Figure 4. Detection probability heatmaps in the bush/desert background. (a) Mean detection probability (i.e., the confidence score generated by YOLO) when the person was wearing a uniform in an average color derived from a bush/desert ROI. The panels on the left indicate the detection probability when no shading was added, whereas shading was added for the right panels. (b) Mean detection probability when the person was wearing a 1/f fractal camouflage pattern derived from a bush/desert ROI. (c,d) Same as panels (a,b) but for an urban ROI.
Applsci 15 05066 g004
Figure 5. Detection probability heatmaps in the urban background. (a) Mean detection probability (i.e., the confidence score generated by YOLO) when the person was wearing a uniform in an average color derived from a bush/desert ROI. The panels on the left indicate the detection probability when no shading was added, whereas shading was added for the right panels. (b) Mean detection probability when the person was wearing a 1/f fractal camouflage pattern using a bush/desert ROI. (c,d) Same as panels (a,b) but for an urban ROI.
Applsci 15 05066 g005
Figure 6. (a,b) Mean detection probability (i.e., the confidence score generated by YOLO) as a function of object height (i.e., target distance) for each camouflage suit used in the bush desert and urban environment (collapsed over the horizontal plane), respectively. Error bars represent the standard deviation. (c) Overall mean detection probability for each camouflage suit used for bush/desert (left panel) and (d) for the urban backgrounds (right panel). Unlike the data in panels (a,b), we collapsed the results over all locations with the constraint that the height of the person was between 24.37 and 201.28 pixels for both background environments (making it feasible to compare the suits across the two different background conditions).
Applsci 15 05066 g006
Figure 7. Results of Experiment 2b. (a) Number of responses as a function of the localization error. Trials were excluded from further analyses if the participants were not able to localize the person accurately (i.e., localization error > 150 pixels; see the red dotted line). (b) Mean search time as a function of the mean detection probability for stimulus. (c) Mean identification conspicuity (in degrees visual angle: dva) as a function of the mean detection probability for stimulus. (d) Mean identification conspicuity as a function of the mean search time for stimulus. Note that each datapoint reflects an image used in the experiment.
Applsci 15 05066 g007
Figure 8. (a) Bush/desert (left) and urban (right) backgrounds. (b) Detection probability (according to YOLO) for each background condition. (c) Human performance. Mean search time and mean object identification conspicuity as a function of ROI (bush/desert versus urban) and pattern (average versus 1/f) for each background condition. Error bars represent the standard error of the mean.
Applsci 15 05066 g008
Figure 9. Five random samples from the movie. The yellow line identifies the sample in the movie (with corresponding detection probability). If YOLO detected the person, the green square signifies its location with a given probability as shown in the graph. The graph illustrates the detection probability for each movie frame. Note that the pose of the person varied during the movie and that sometimes a part of the body was not visible.
Applsci 15 05066 g009
Figure 10. Results of Experiment 3b. (a) Number of responses as a function of the localization error. Trials were excluded from further analyses if the participants were not able to localize the person accurately (i.e., localization error > 150 pixels; see the red dotted line). (b) Mean search time as a function of the detection probability for each stimulus. (c) Mean identification conspicuity (in degrees visual angle: dva) as a function of the detection probability for each stimulus. (d) Mean identification conspicuity as a function of the mean search time for each stimulus. Note that each datapoint reflects an image used in the experiment.
Applsci 15 05066 g010
Table 1. Spearman correlations between the detection probability (i.e., performance YOLO), search performance, and identification conspicuity performance for each participant and the group mean. p-values were not Bonferroni-corrected.
p(Detection) × Searchp(Detection) × ConspicuitySearch × Conspicuity
SubjectSpearman rpSpearman rpSpearman rp
1−0.61<0.010.75<0.001−0.77<0.001
2−0.55<0.0010.77<0.001−0.75<0.001
3−0.56<0.0010.75<0.001−0.80<0.001
4−0.59<0.0010.72<0.001−0.73<0.001
5−0.47<0.0010.67<0.001−0.48<0.001
6−0.67<0.0010.72<0.001−0.84<0.001
mean−0.65<0.0010.76<0.001−0.84<0.001
Table 2. Spearman correlations between the detection probability (i.e., YOLO performance), search performance, and the identification conspicuity performance for each participant separately. p-values were not Bonferroni-corrected.
Search × p(Detection)Conspicuity × p(Detection)Conspicuity × Search
SubjectSpearman rpSpearman rpSpearman rp
1−0.110.700.71<0.01−0.200.49
2−0.100.730.480.08−0.420.13
3−0.420.130.55<0.050.090.75
4−0.240.420.66<0.01−0.020.95
5−0.240.420.100.740.160.59
6−0.170.560.55<0.05−0.200.50
mean−0.300.300.58<0.05−0.050.88
Disclaimer/Publisher’s Note: The statements, opinions and data contained in all publications are solely those of the individual author(s) and contributor(s) and not of MDPI and/or the editor(s). MDPI and/or the editor(s) disclaim responsibility for any injury to people or property resulting from any ideas, methods, instructions or products referred to in the content.

