Article

Achieving Optimal Injection Molding Parameters to Minimize Both Shrinkage and Surface Roughness Through a Multi-Objective Optimization Approach

Department of Mechanical Engineering, College of Engineering, Qassim University, Buraydah 52571, Saudi Arabia
*
Author to whom correspondence should be addressed.
Appl. Sci. 2025, 15(9), 5063; https://doi.org/10.3390/app15095063
Submission received: 2 February 2025 / Revised: 16 April 2025 / Accepted: 28 April 2025 / Published: 2 May 2025
(This article belongs to the Section Surface Sciences and Technology)

Abstract

:

Featured Application

This study’s optimization procedure can be applied in the plastic manufacturing industry to enhance the quality of injection-molded products by minimizing surface roughness and volumetric shrinkage. This approach helps engineers fine-tune process parameters, leading to improved product esthetics and dimensional accuracy, making it ideal for industries such as automotives, consumer electronics, and medical devices where precision and surface quality are critical.

Abstract

This study developed a multi-objective optimization procedure aimed at minimizing surface roughness and volumetric shrinkage in injection-molded products. Surrogate models for both outputs were constructed using the Kriging technique, based on experimental data and seven input parameters: packing pressure, mold temperature, cooling time, injection speed, injection pressure, melt temperature, and packing time. A multi-objective optimization problem was formulated and solved using the pattern search algorithm, generating a Pareto front that highlights the trade-off between the two objectives. This Pareto front was further analyzed to determine three optimal parameter sets. The first point minimizes volumetric shrinkage at 1.9314 mm3 but results in the highest surface roughness of 0.55956 µm. In contrast, the second point yields the lowest surface roughness of 0.20557 µm but the highest volumetric shrinkage of 3.9286 mm3. The third point offers the best compromise between the two objectives, with a volumetric shrinkage of 2.2348 mm3 and surface roughness of 0.28246 µm. The proposed approach provides an experimentally validated tool for plastic engineers, enabling informed parameter adjustments to achieve optimal trade-offs in surface quality and dimensional stability within practical manufacturing constraints.

1. Introduction

The injection molding process is one of the most widely used polymer processing techniques for the mass production of polymer products [1]. The process has previously been estimated to consume approximately 33% [2] of all processed plastics. Its popularity is, perhaps, due to its reliability and precision in producing intricate geometries with excellent tolerance in a single-step process.
The injection molding process is used to produce plastic products by forcing a molten polymer into a mold and allowing it to cool. This process involves several steps, each of which can introduce defects to the final product if not properly controlled. Common defects include the following:
  • Warpage: Deformation of the product due to uneven cooling or internal stress.
  • Volumetric Shrinkage: Reduction in volume as the molten plastic cools and solidifies in the mold.
  • Sink Marks: Depressions on the product’s surface caused by uneven cooling or insufficient packing pressure.
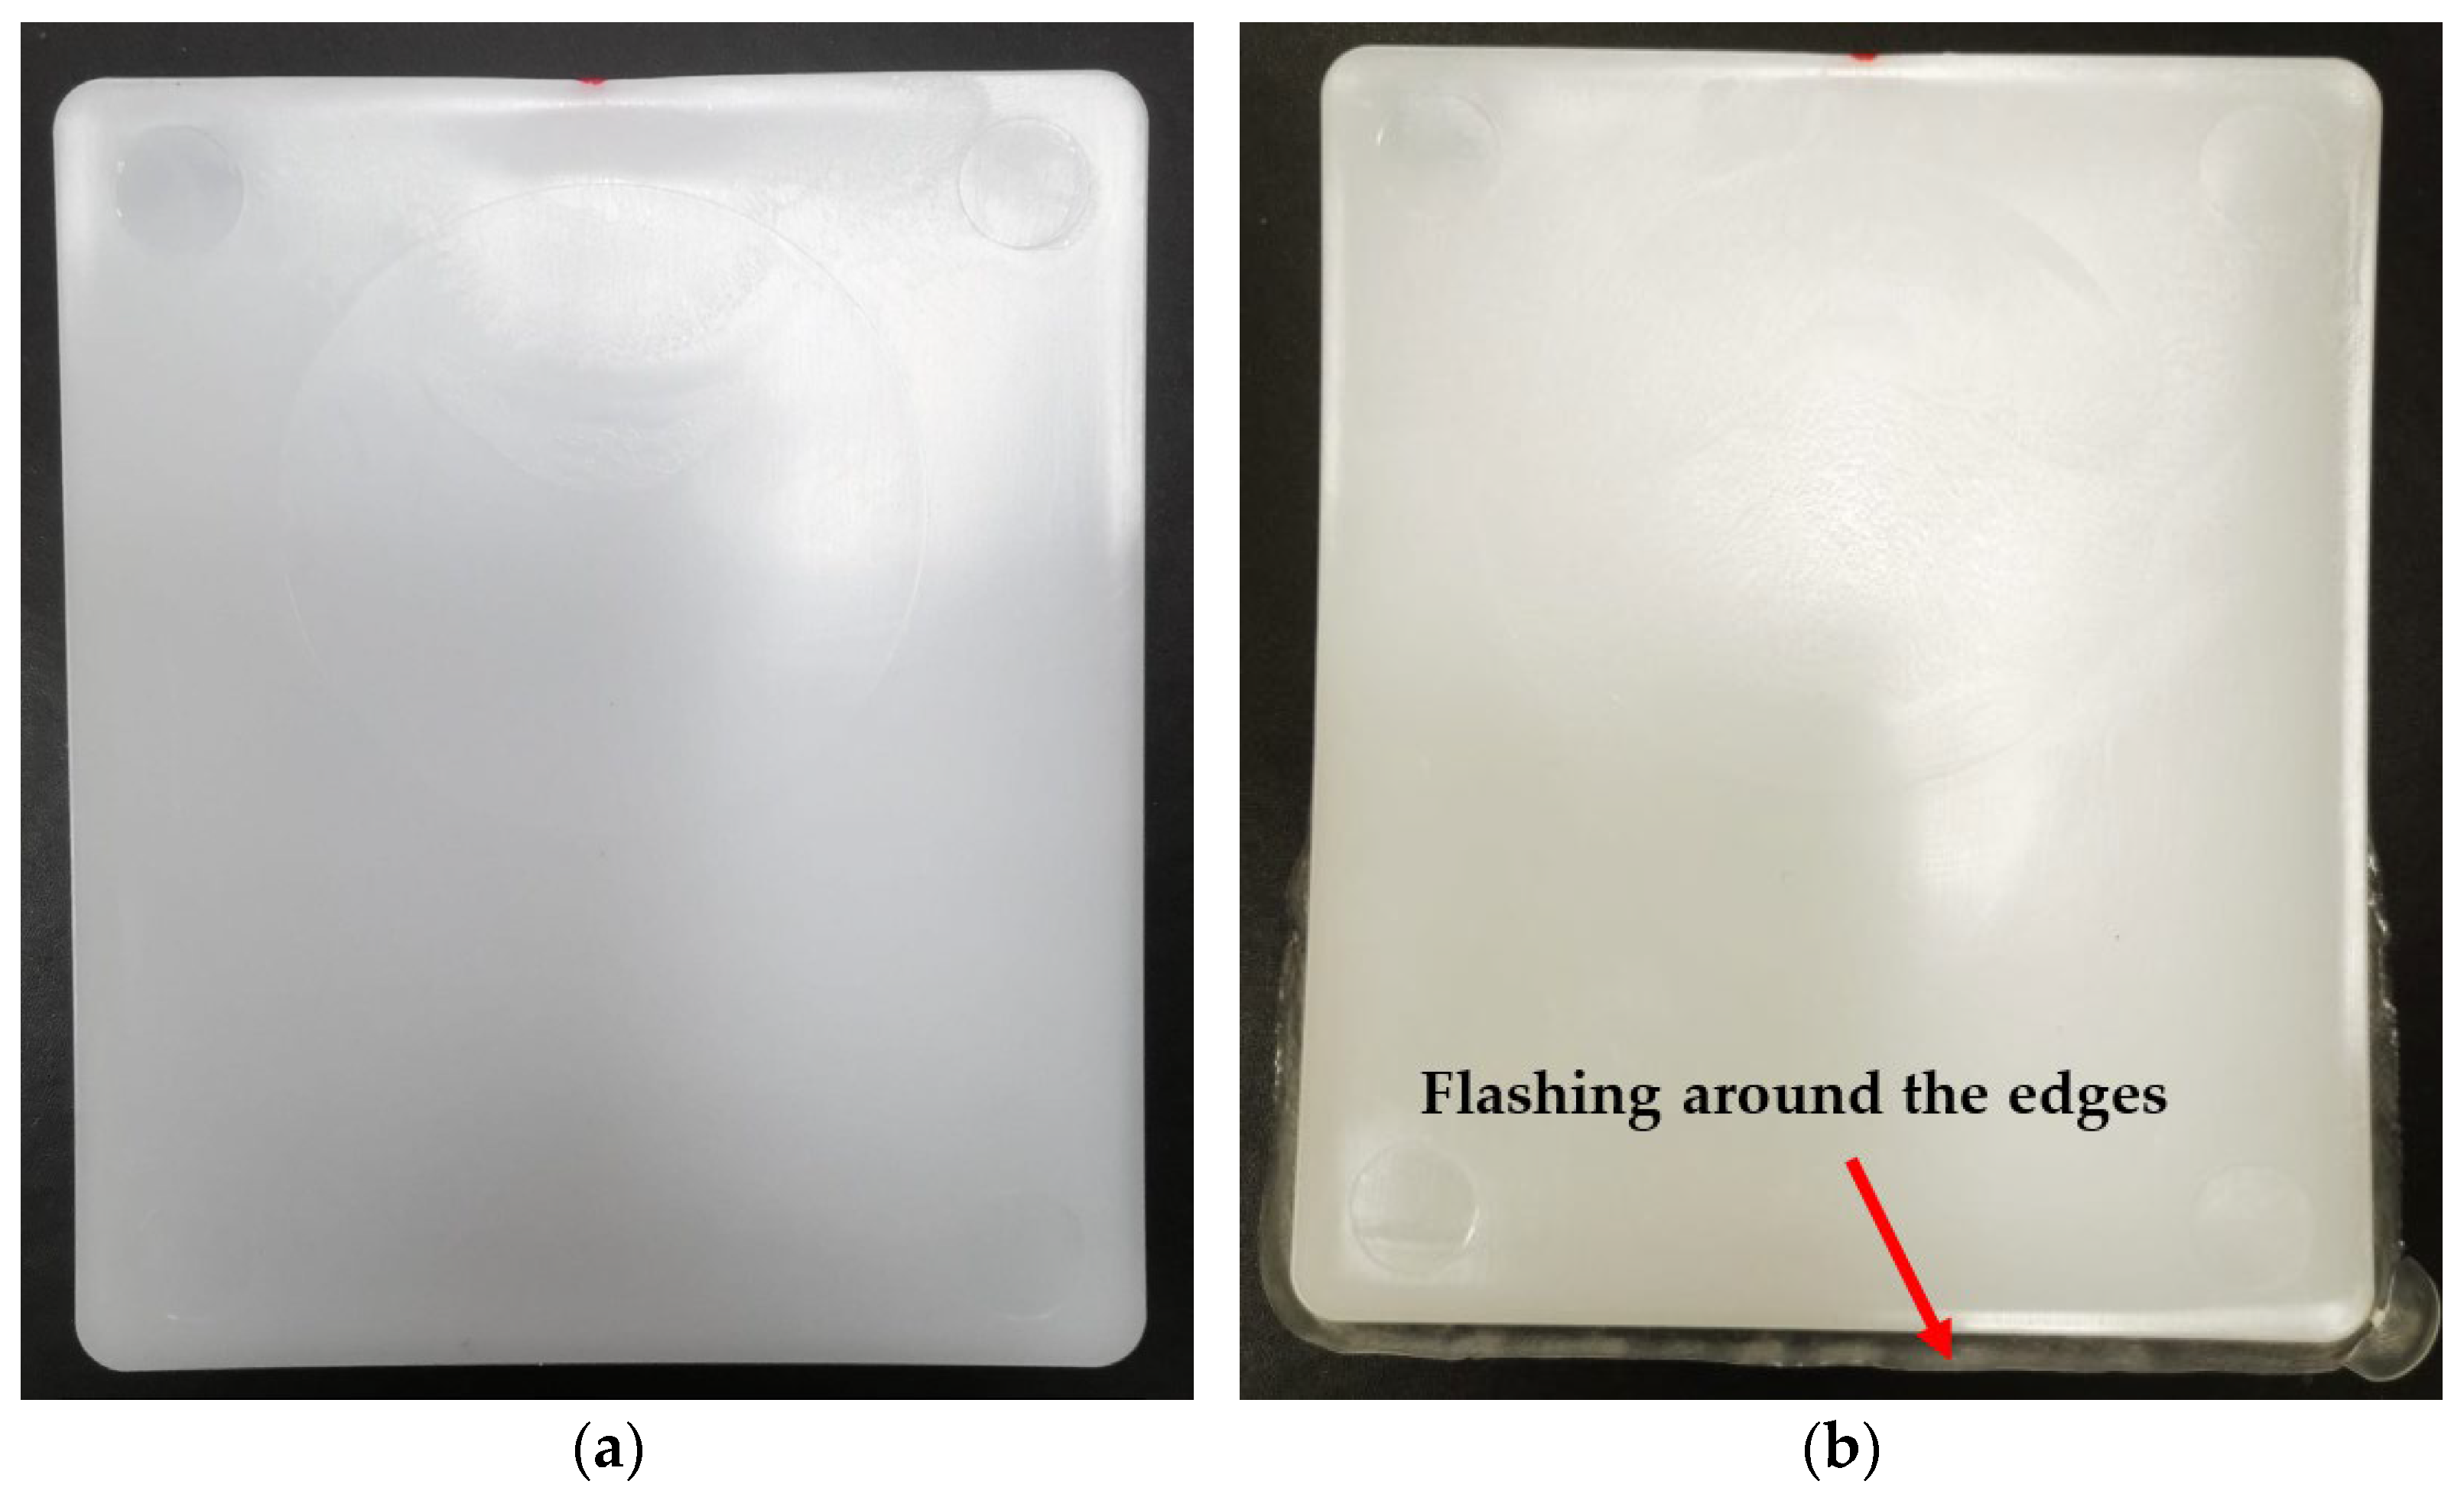
  • Flash: Excess material that flows out of the mold cavity and forms thin protrusions along the parting line.
  • Short Shots: Incomplete filling of the mold, resulting in parts that are not fully formed.
The extent of these defects directly affects the quality of the injection-molded product, which highly depends on the injection molding process parameters. Therefore, these parameters must be carefully selected to ensure optimal product quality. For a long time, the industry has relied on handbooks with trial-and-error adjustments [3] or the expertise of seasoned polymer processing engineers [4,5] to determine these parameters, often involving further adjustments. While this approach can yield reasonably good results, it is time-consuming, expensive, and heavily dependent on the engineer’s experience, without guaranteeing optimal parameters. Consequently, numerous studies have been conducted to fine-tune injection molding parameters, all aimed at enhancing the quality of molded products and attaining the most optimum results. Table 1 presents a summary of studies on the optimization of injection molding process parameters for various quality measures (i.e., objectives).
From Table 1, it can be inferred that the parameters with the most impact on the quality of a product are packing time, cooling time, packing or holding pressure, the temperature of the mold, the temperature of the melt, injection pressure, and injection speed. Furthermore, it is clear (from Table 1) that these process parameters were mostly optimized in terms of two product qualities, namely, volumetric shrinkage and warpage.
Another important quality measure for injection molding parts is surface roughness. The roughness of a product affects the appearance of the product, including its color, texture, and gloss. It also affects the functional requirements of the product, such as its paint ability, wear ability, coefficient of friction, and adhesive properties. Surface roughness considerations are thus important to consumers and consequently to polymer process engineers.
It is understood that mold cavity surface roughness directly affects the roughness of injection-molded products [27,28]. Mold cavities with rough surfaces are expected to produce products with rough surfaces. Moreover, there is documentation indicating that the molding process parameters influence the surface roughness of molded products. However, only a handful of studies in the literature appear to have addressed this matter. Oliveira et al. reported in [29] that injection molding parameters, including the temperature of the mold and the melt and packing or holding temperatures, influenced the surface characteristics of the molded product. Their conclusion indicated that elevated values of these parameters typically led to a reduction in surface roughness. The authors of [30] investigated the replication of the surface microstructure during the molding process, particularly in cases where the intricate surface pattern of the mold was transferred onto the molded product through a complex mechanism. Their findings highlighted that molding parameters, particularly the mold temperature, affected the replication of the desired topology of the product surface. The mold cavity surface temperature significantly affects the roughness of the injection-molded part, as noted by Wang et al. in reference [31]. Their conclusion was that with increasing mold temperature, there is a decrease in the roughness of the product. Chen et al. improved the surface quality of a molded product by utilizing induction heating to regulate mold temperature. Lee et al. demonstrated their success in reducing the roughness of injection-molded products by incorporating an insulation layer of polytetrafluoroethylene (PTFE) between the mold and the plastic melt [32]. This PTFE layer maintained the melt temperature above the plastic crystallization temperature. Guo carried out a study examining how the surface roughness of injection-molded polypropylene (PP) components is influenced by factors such as holding pressure, holding duration, injection rate, and cooling duration [33]. In this study, it was reported that the mold surface played the most prominent role in determining the roughness of the part, followed by injection speed. Jan and his team conducted a study focused on optimizing injection molding process parameters to minimize surface roughness in molded products [34]. Their findings indicate that both injection temperature and pressure play significant roles in affecting part surface roughness.
This literature review clearly indicates that the parameters of the injection molding process have a direct impact on the surface roughness of molded products. More studies are, however, still required to provide further insight into this topic. Specifically, research should focus on establishing a correlation between injection molding parameters and surface roughness, as well as examining the association between surface roughness and other defects like warpage and volumetric shrinkage. Additionally, research has been conducted to explore methods for optimizing process parameters with the goal of attaining minimal surface roughness.
The objective of this work was to create a method for optimizing injection molding process parameters to achieve both minimal surface roughness and volumetric shrinkage. This involved creating surrogate models that represent surface roughness and volumetric shrinkage as functions of process parameters. These models were then optimized using a multi-objective optimization approach, with the goal of simultaneously minimizing surface roughness and volumetric shrinkage. A solution to the optimization problem was found using the pattern search algorithm, which generated a Pareto front. This Pareto front highlighted the trade-off between the two objectives—minimizing surface roughness and volumetric shrinkage—providing plastic engineers with a valuable tool to make informed decisions on adjusting parameters to achieve the optimal balance between surface roughness and volumetric shrinkage within defined limits.
What is unique about this methodology is that the surrogate models were built using data from actual injection molding experiments rather than simulations. This approach allowed for the inclusion of all machine-specific conditions relevant to the injection molding process, resulting in more accurate surrogate models and optimization results.
This paper follows the following structure: Section 2 details the injection molding experiments, including the results and quantification of surface roughness and volumetric shrinkage. Section 3 covers the surrogate modeling of surface roughness and volumetric shrinkage, as well as a discussion on multi-objective optimization for these objectives. Finally, Section 4 offers concluding remarks.

2. Experiments

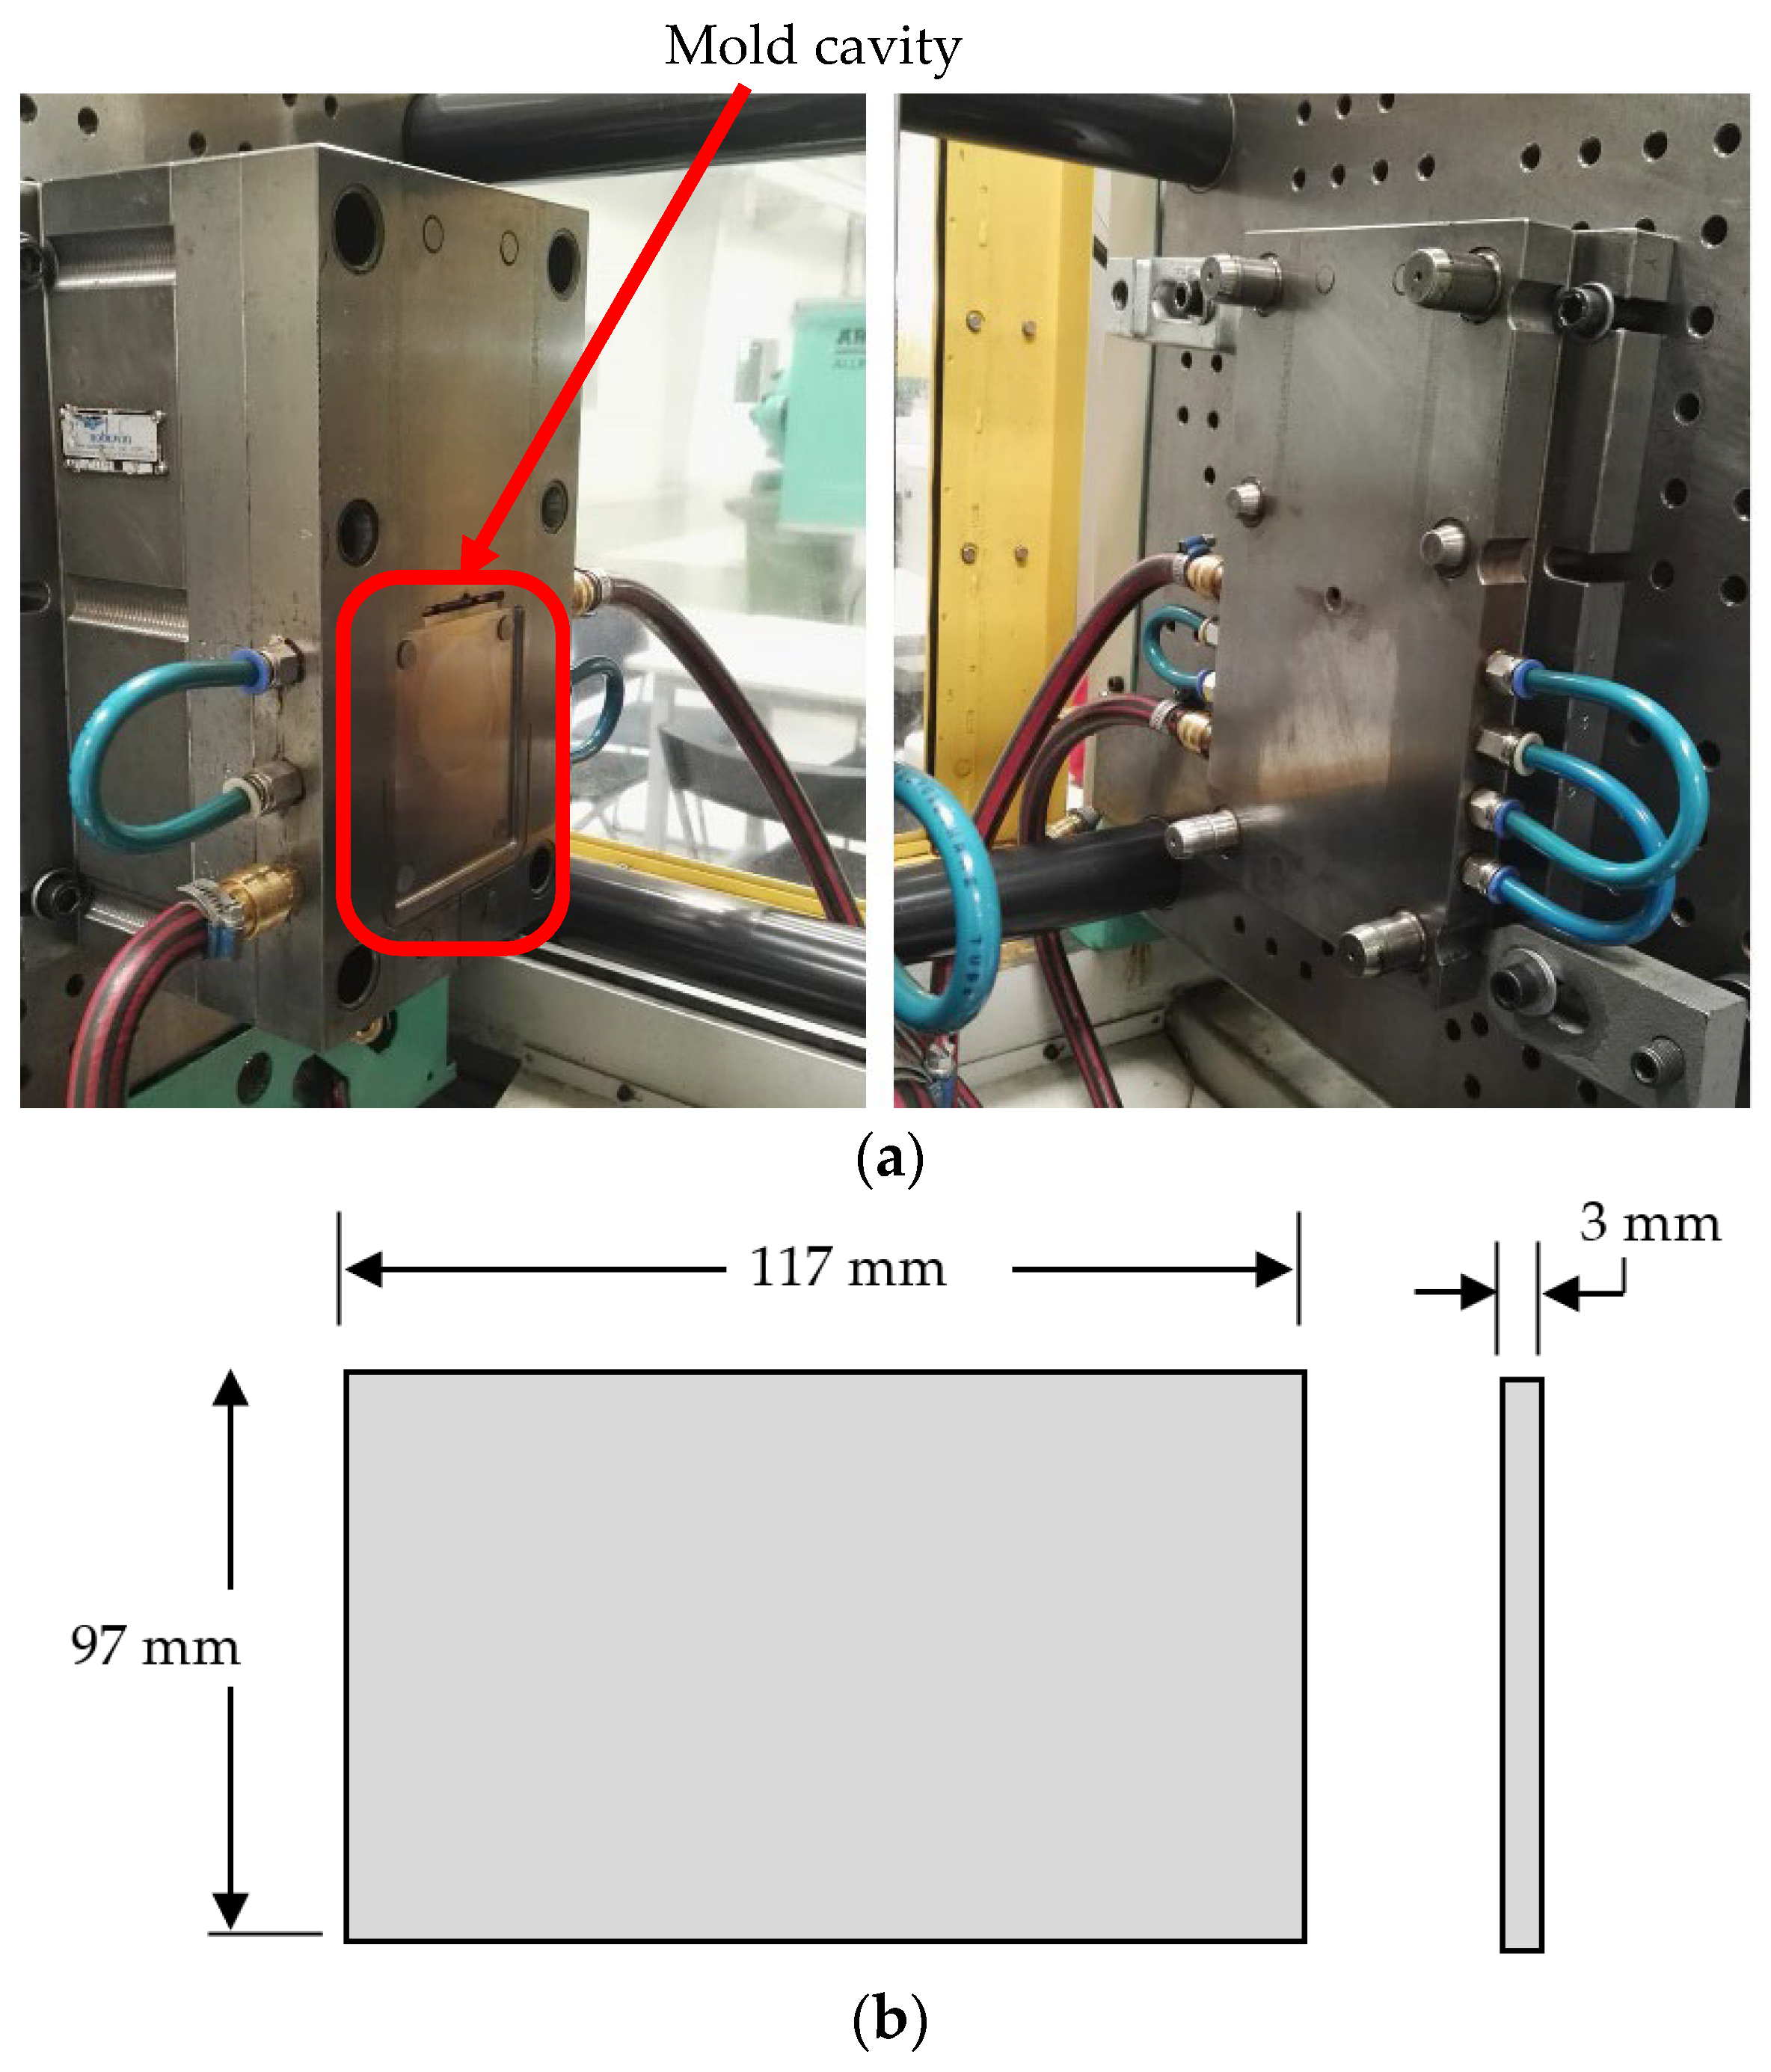
2.1. Injection Molding Experiments

In the injection molding process, plastic in granular form is fed to the injection unit through a hopper. The plastic passes through a chamber where it is simultaneously mixed and heated until it melts. The plastic melt is then injected into a mold cavity and subjected to packing pressure for a set duration followed by cooling and is eventually ejected as a finished solid product. The entire process requires specifying appropriate values for the process parameters to ensure acceptable product quality with minimal defects (such as jetting, surface delamination, warpage, volumetric shrinkage, etc.).
The aim of this study was to conduct injection molding experiments aimed at determining the ideal values for process parameters to minimize both volumetric shrinkage and surface roughness. Seven critical process parameters were examined: injection pressure, packing pressure, mold temperature, packing duration, cooling duration, melt temperature, and injection speed.
The experimental phase of this study was conducted using an Arburg Allrounder 420 C Gold Edition injection molding machine, produced by ARBURG GmbH + Co KG, based in Lossburg, Germany, as shown in Figure 1 [35]. The mold cavity used in this study was cuboid in shape, resulting in a product with dimensions of 3 mm in thickness, 117 mm in length, and 97 mm in width. Figure 2a illustrates the two halves of the mold, while Figure 2b provides the dimensions of the resulting product. Although a rectangular-shaped mold cavity was used in this study, this method can be adapted for other shapes as well.
High-density polyethylene (HDPE), specifically the M80064 grade produced by the Saudi Basic Industries Corporation (SABIC), a global chemical company headquartered in Riyadh, Saudi Arabia, was selected as the injection molding material. It should be noted, however, that the procedure outlined in this study can also be applied to other types of plastics. Table 2 presents a few fundamental properties of this polymer. A detailed list of its properties can be found in [36].

2.2. Process Parameter Testing Points

To optimize parameters to attain the minimum surface roughness, it is essential to establish an association between surface roughness and the process parameters. Additionally, the optimization process is constrained by the considerations of volumetric shrinkage, which represents another metric of product quality. Hence, it is crucial to establish an additional relationship between volumetric shrinkage and the process parameters. The relationships between surface roughness, volumetric shrinkage, and the injection molding process parameters are established based on experimental data collected from experiments carried out with predetermined combinations of process parameters. The preselected points are generated using the central composite design for a fractional factorial design (refer to [37] for a detailed discussion on this subject).
The lower and upper limits of the process parameters determine the entire design space for the optimization. These limits are listed in Table 3. Recommendations from the producers of the plastic used (HDPE M80064 Series) [36] were the basis of the lower and upper limits for the melt temperature, mold temperature, and injection pressure. Conversely, the choice of boundaries for the packing time, packing pressure, cooling time, and injection speed was advised by experienced polymer engineers. Using the specified boundaries, a face-centered central composite design was employed to generate the test points, totaling 79 points [37].

2.3. Quantification of Volumetric Shrinkage and Surface Roughness

As previously indicated, two correlations were established. The first pertains to the relationship between volumetric shrinkage and the parameters of the injection molding process, while the second concerns the connection between surface roughness and these process parameters. This requires quantifying both the volumetric shrinkage and surface roughness of the resulting test specimens from the injection molding experiments. What follows is the quantification approach adopted in this work for both volumetric shrinkage and surface roughness.

2.3.1. Quantification of Volumetric Shrinkage

Volumetric shrinkage (Vs) refers to the reduction in the volume of the injection-molded product caused by differences in the melt and ambient temperatures. It can be estimated by comparing the “expected” volume (Ve) with the actual volume of the experimental product. The “expected” product volume is determined based on the volume of the mold cavity, which can be calculated using the dimensions provided in Figure 2b. The actual volume of the product is calculated by dividing its mass (m) by material density (ρ). The expression for volumetric shrinkage is presented in Equation (1).
V s = V e m ρ .

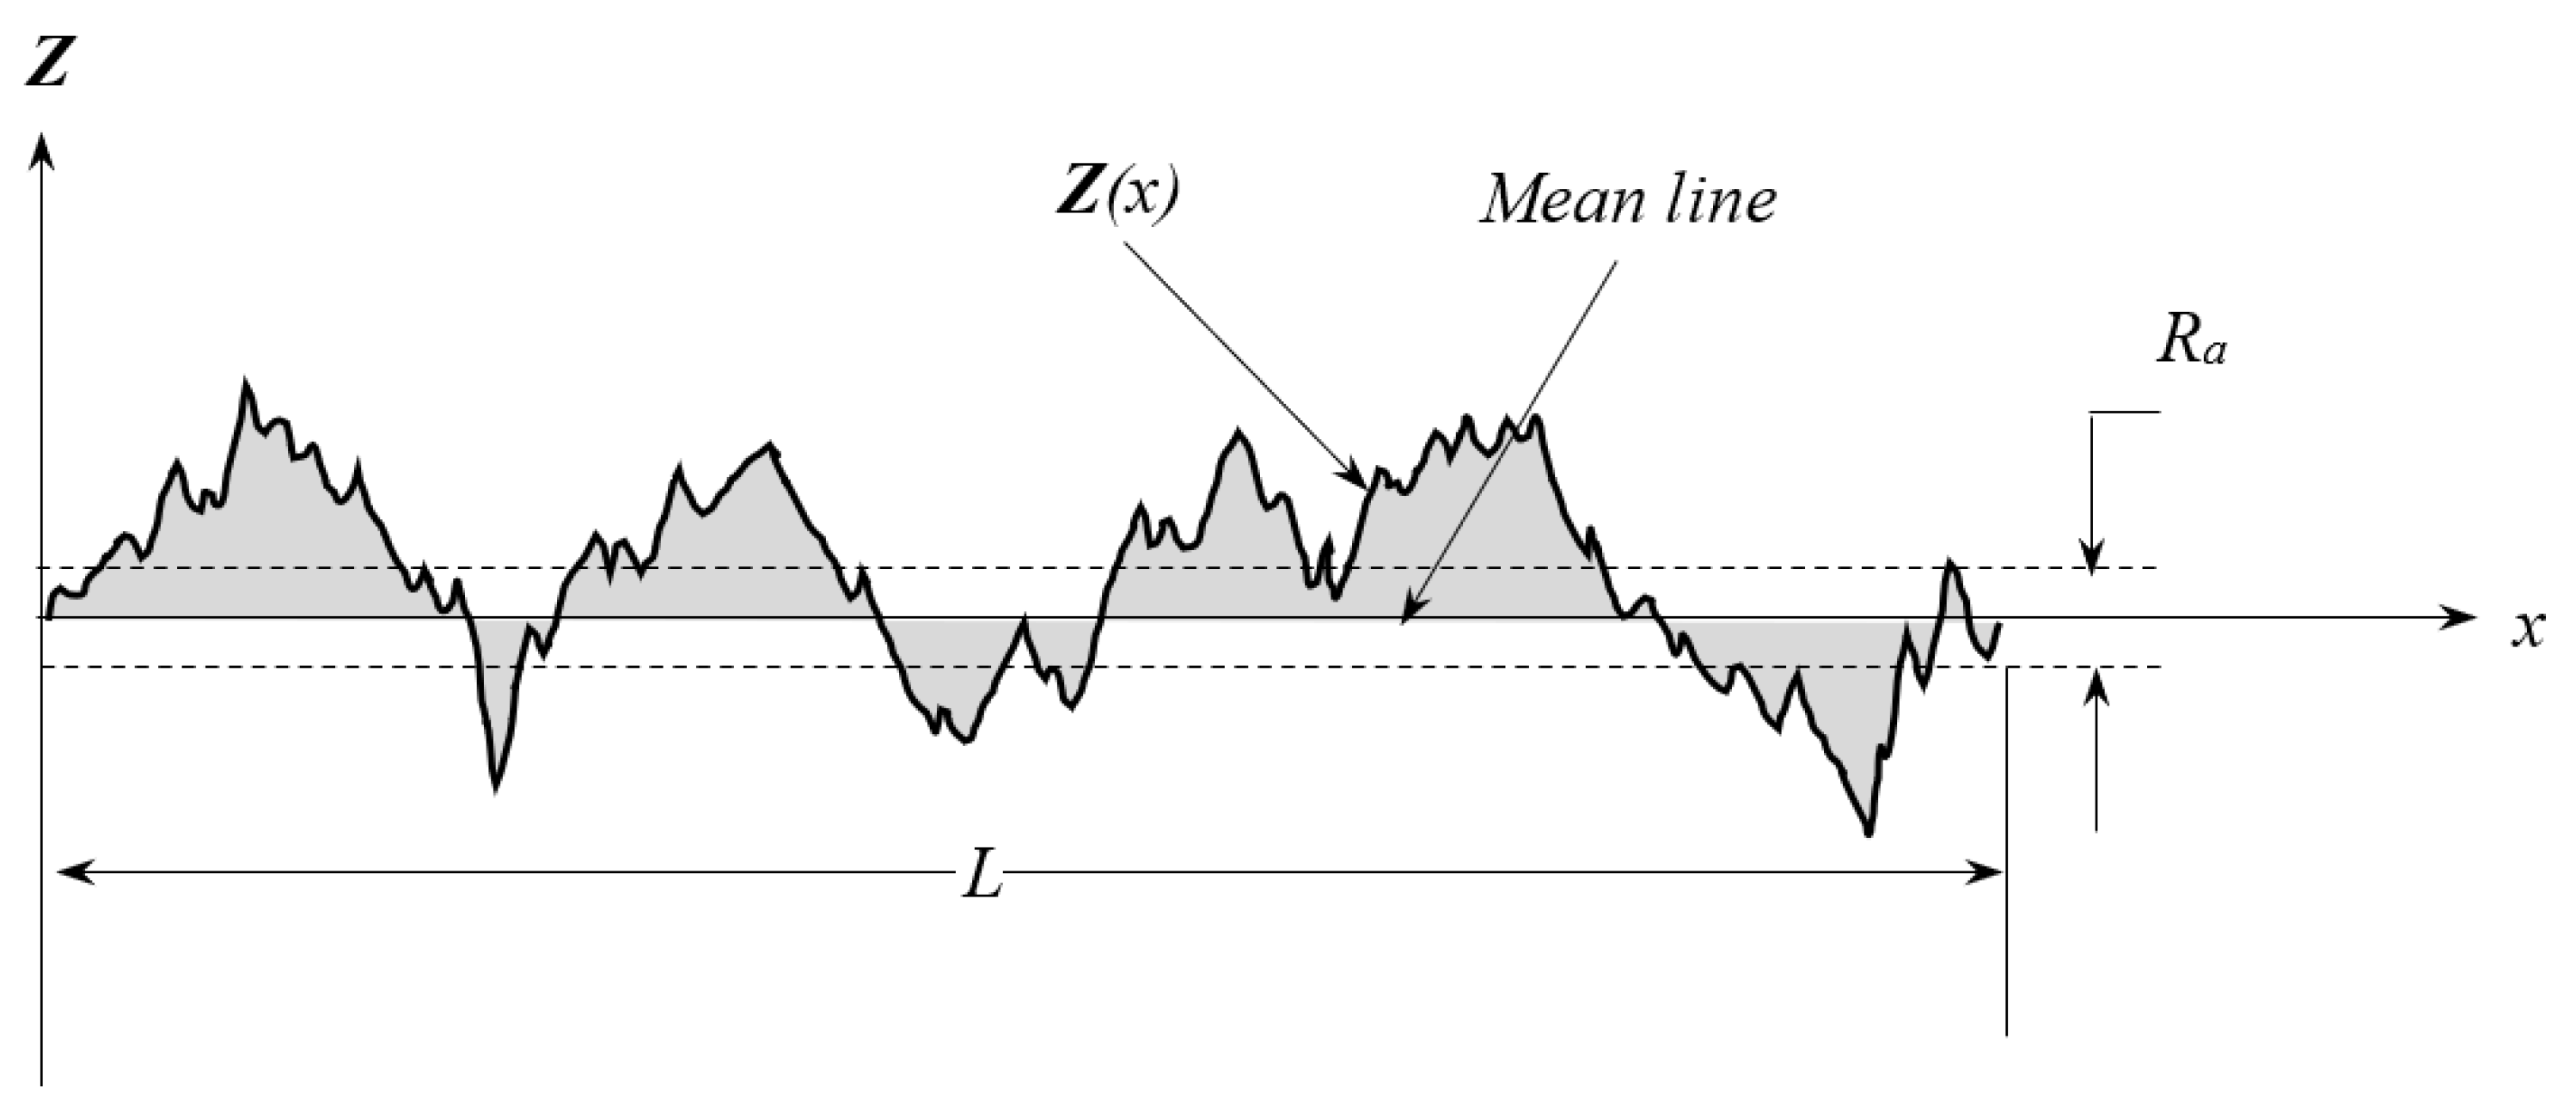
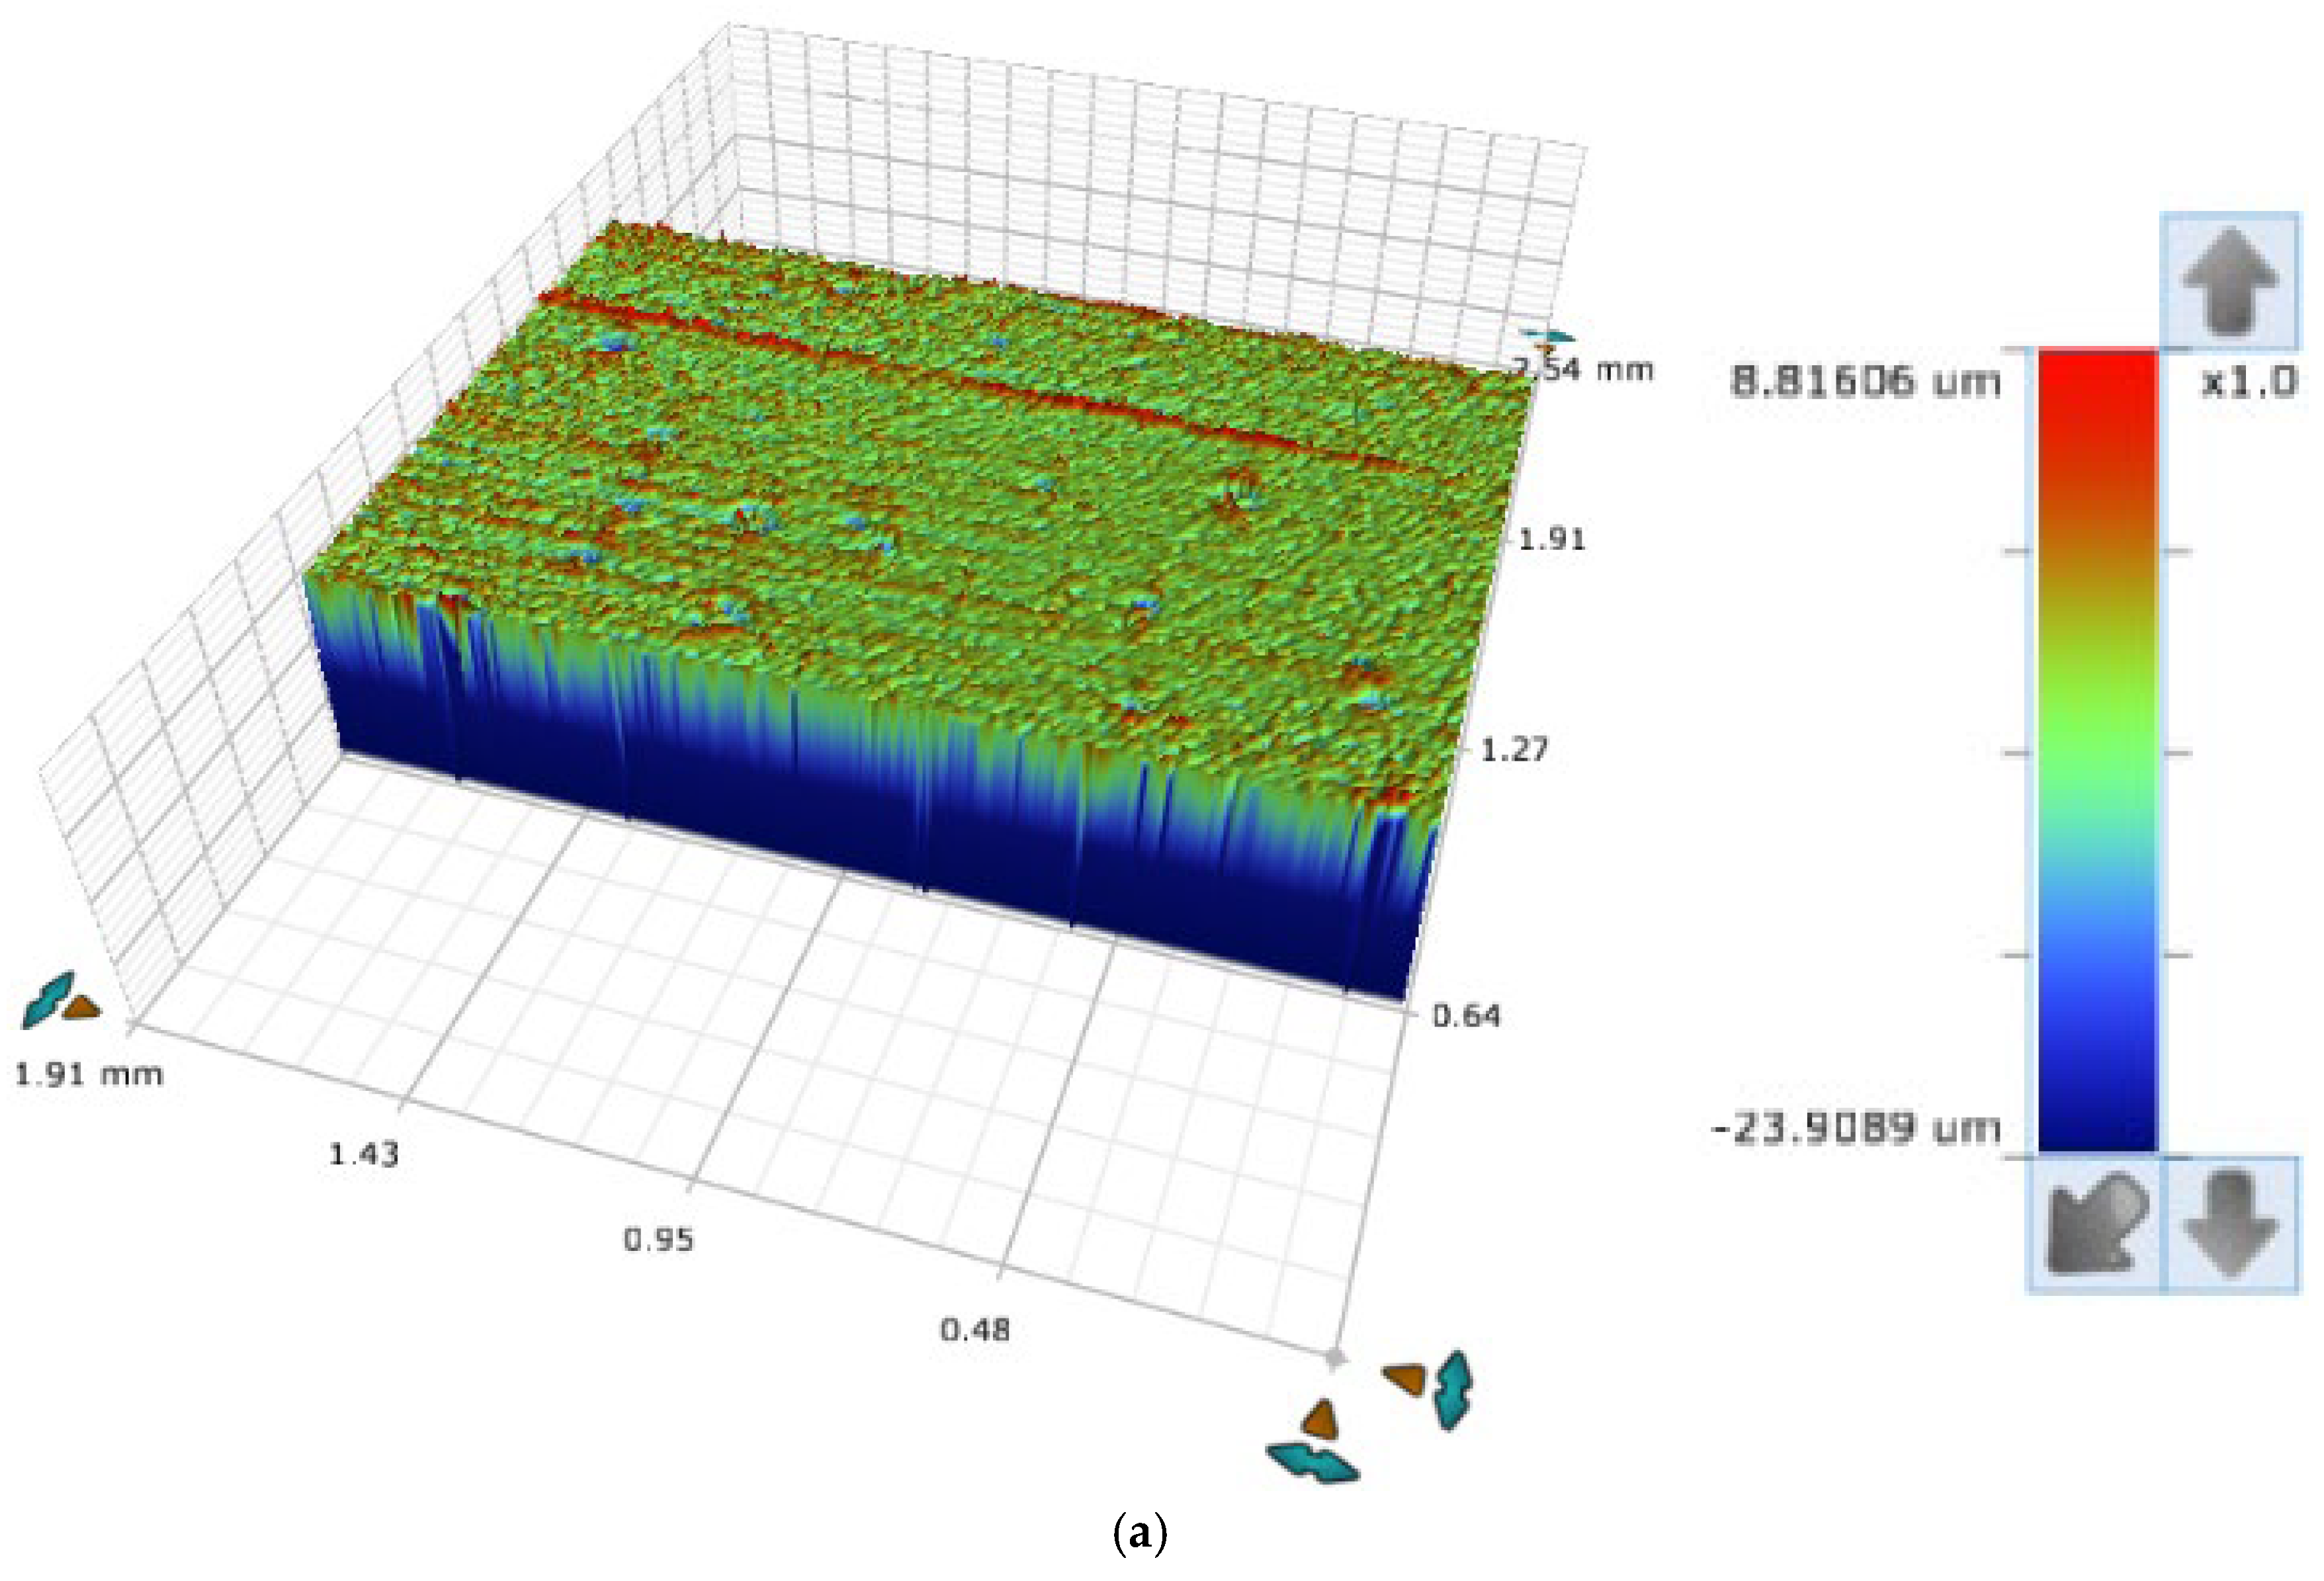
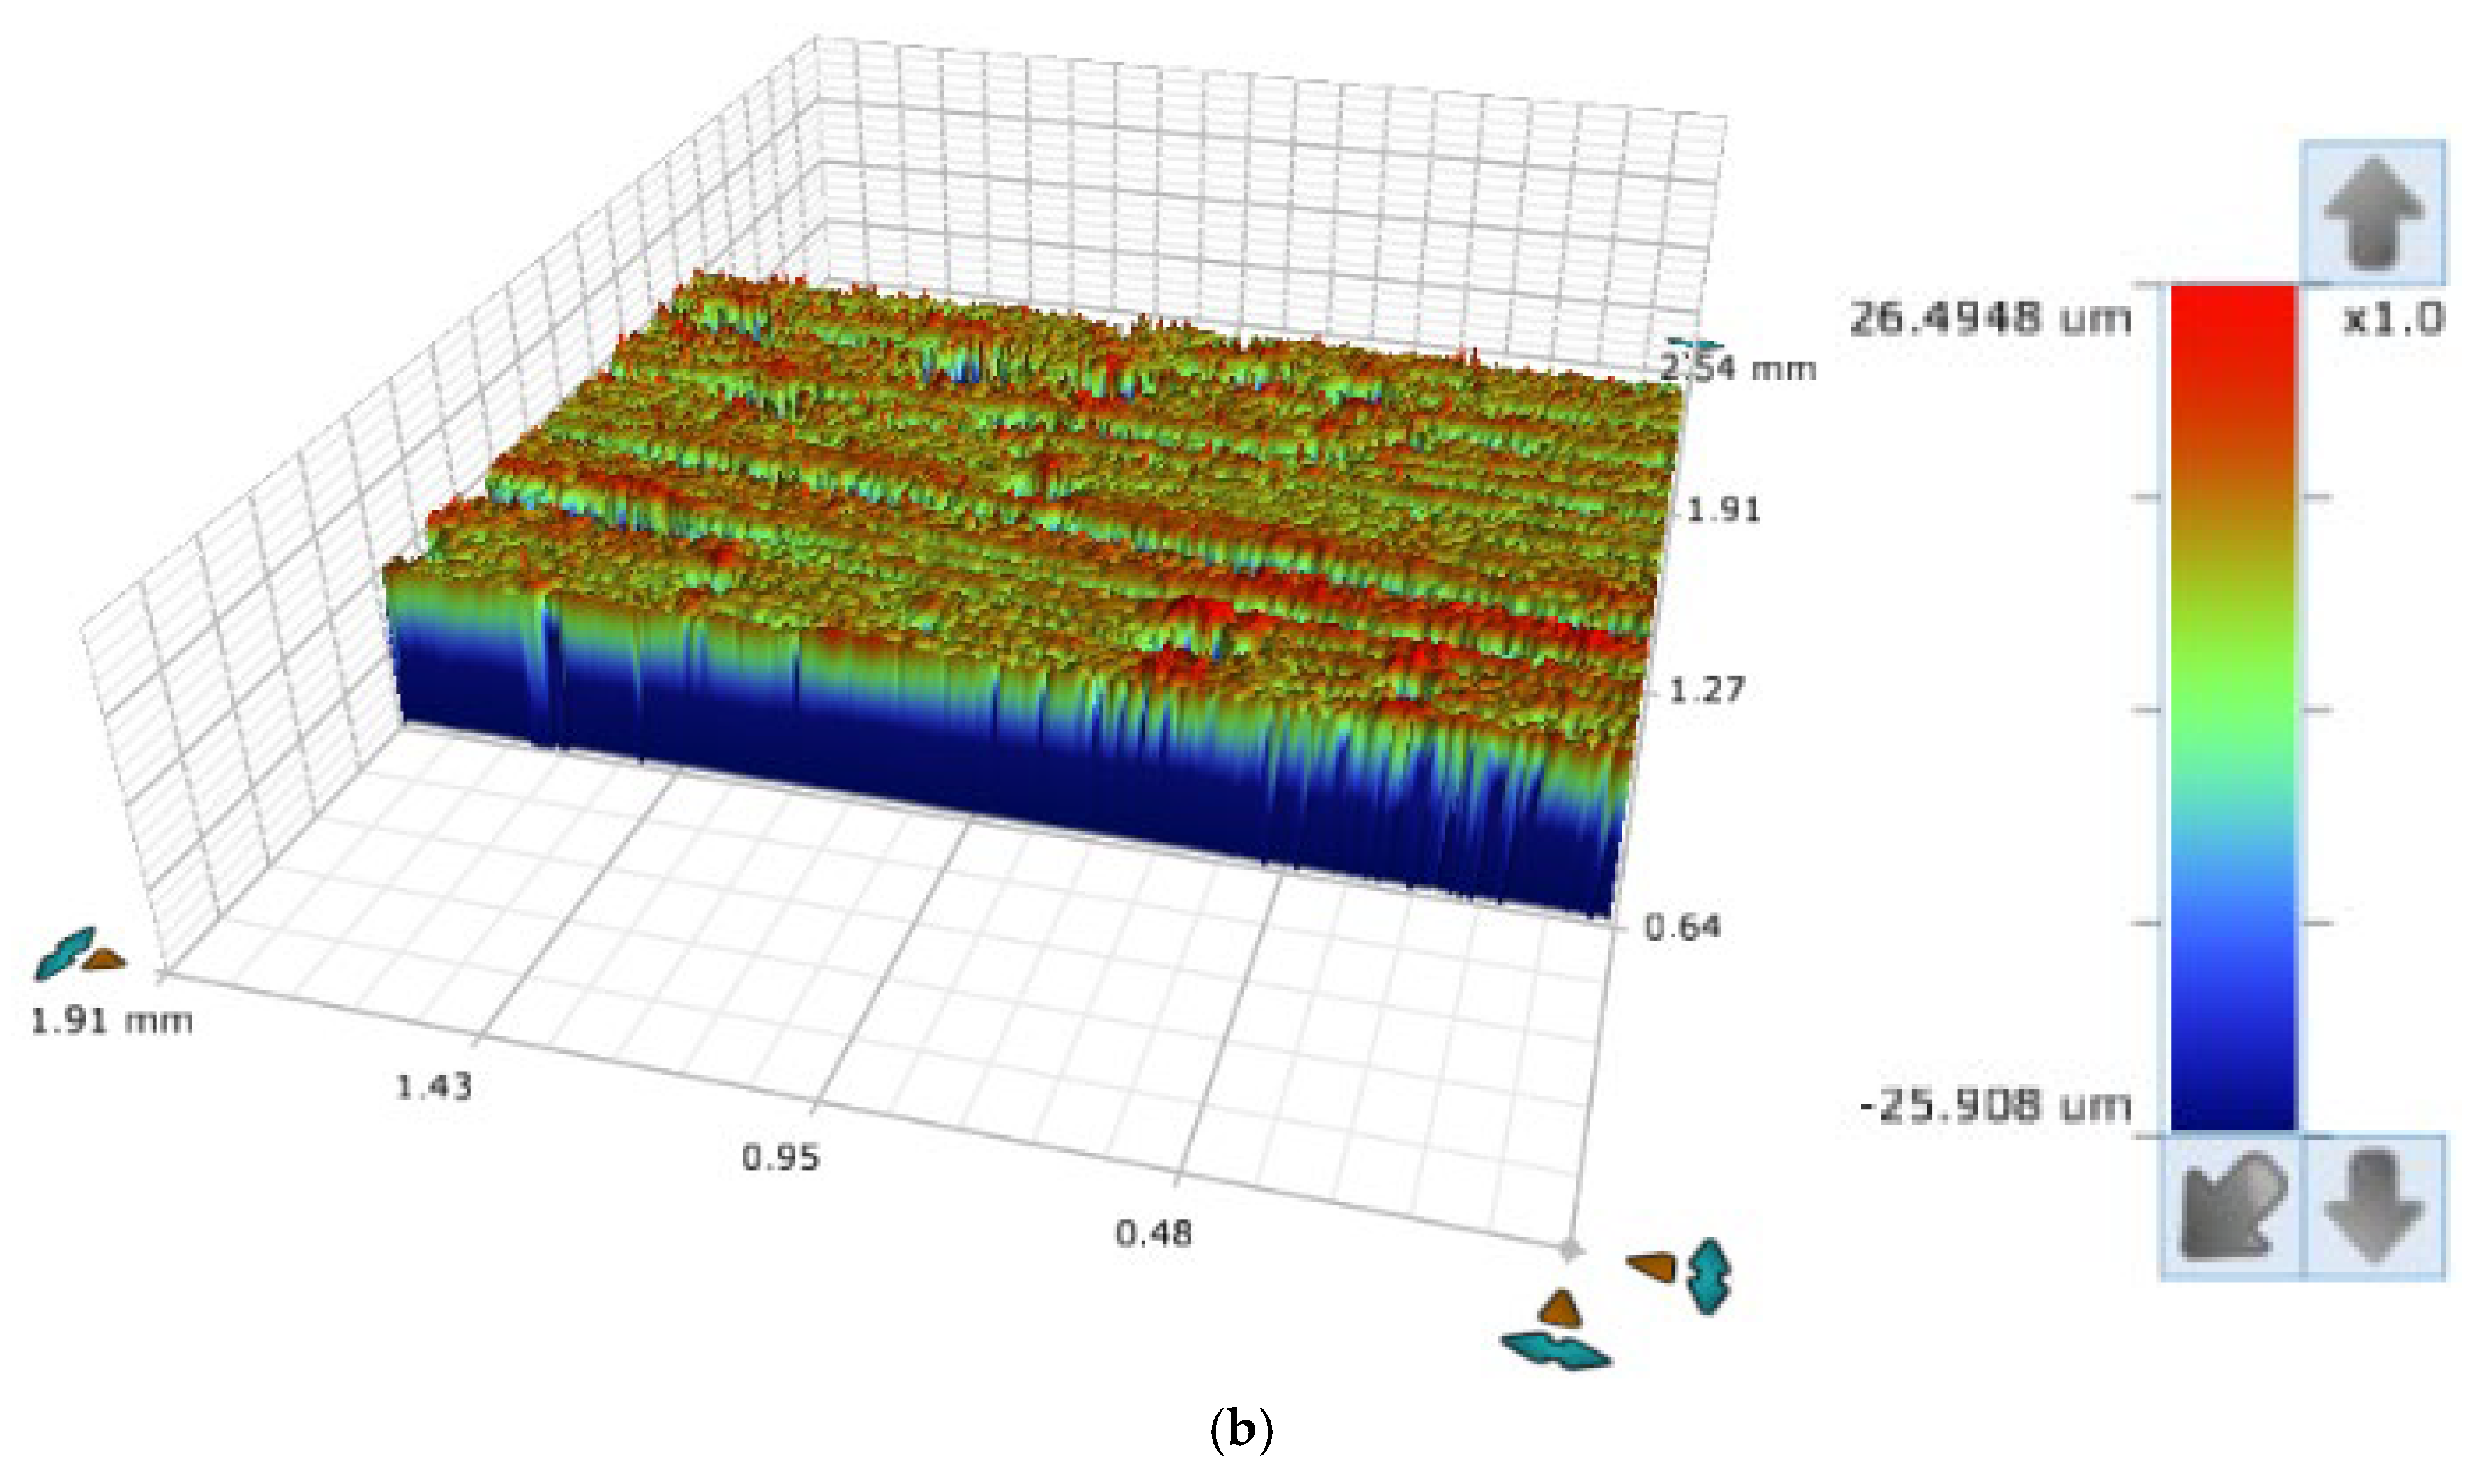
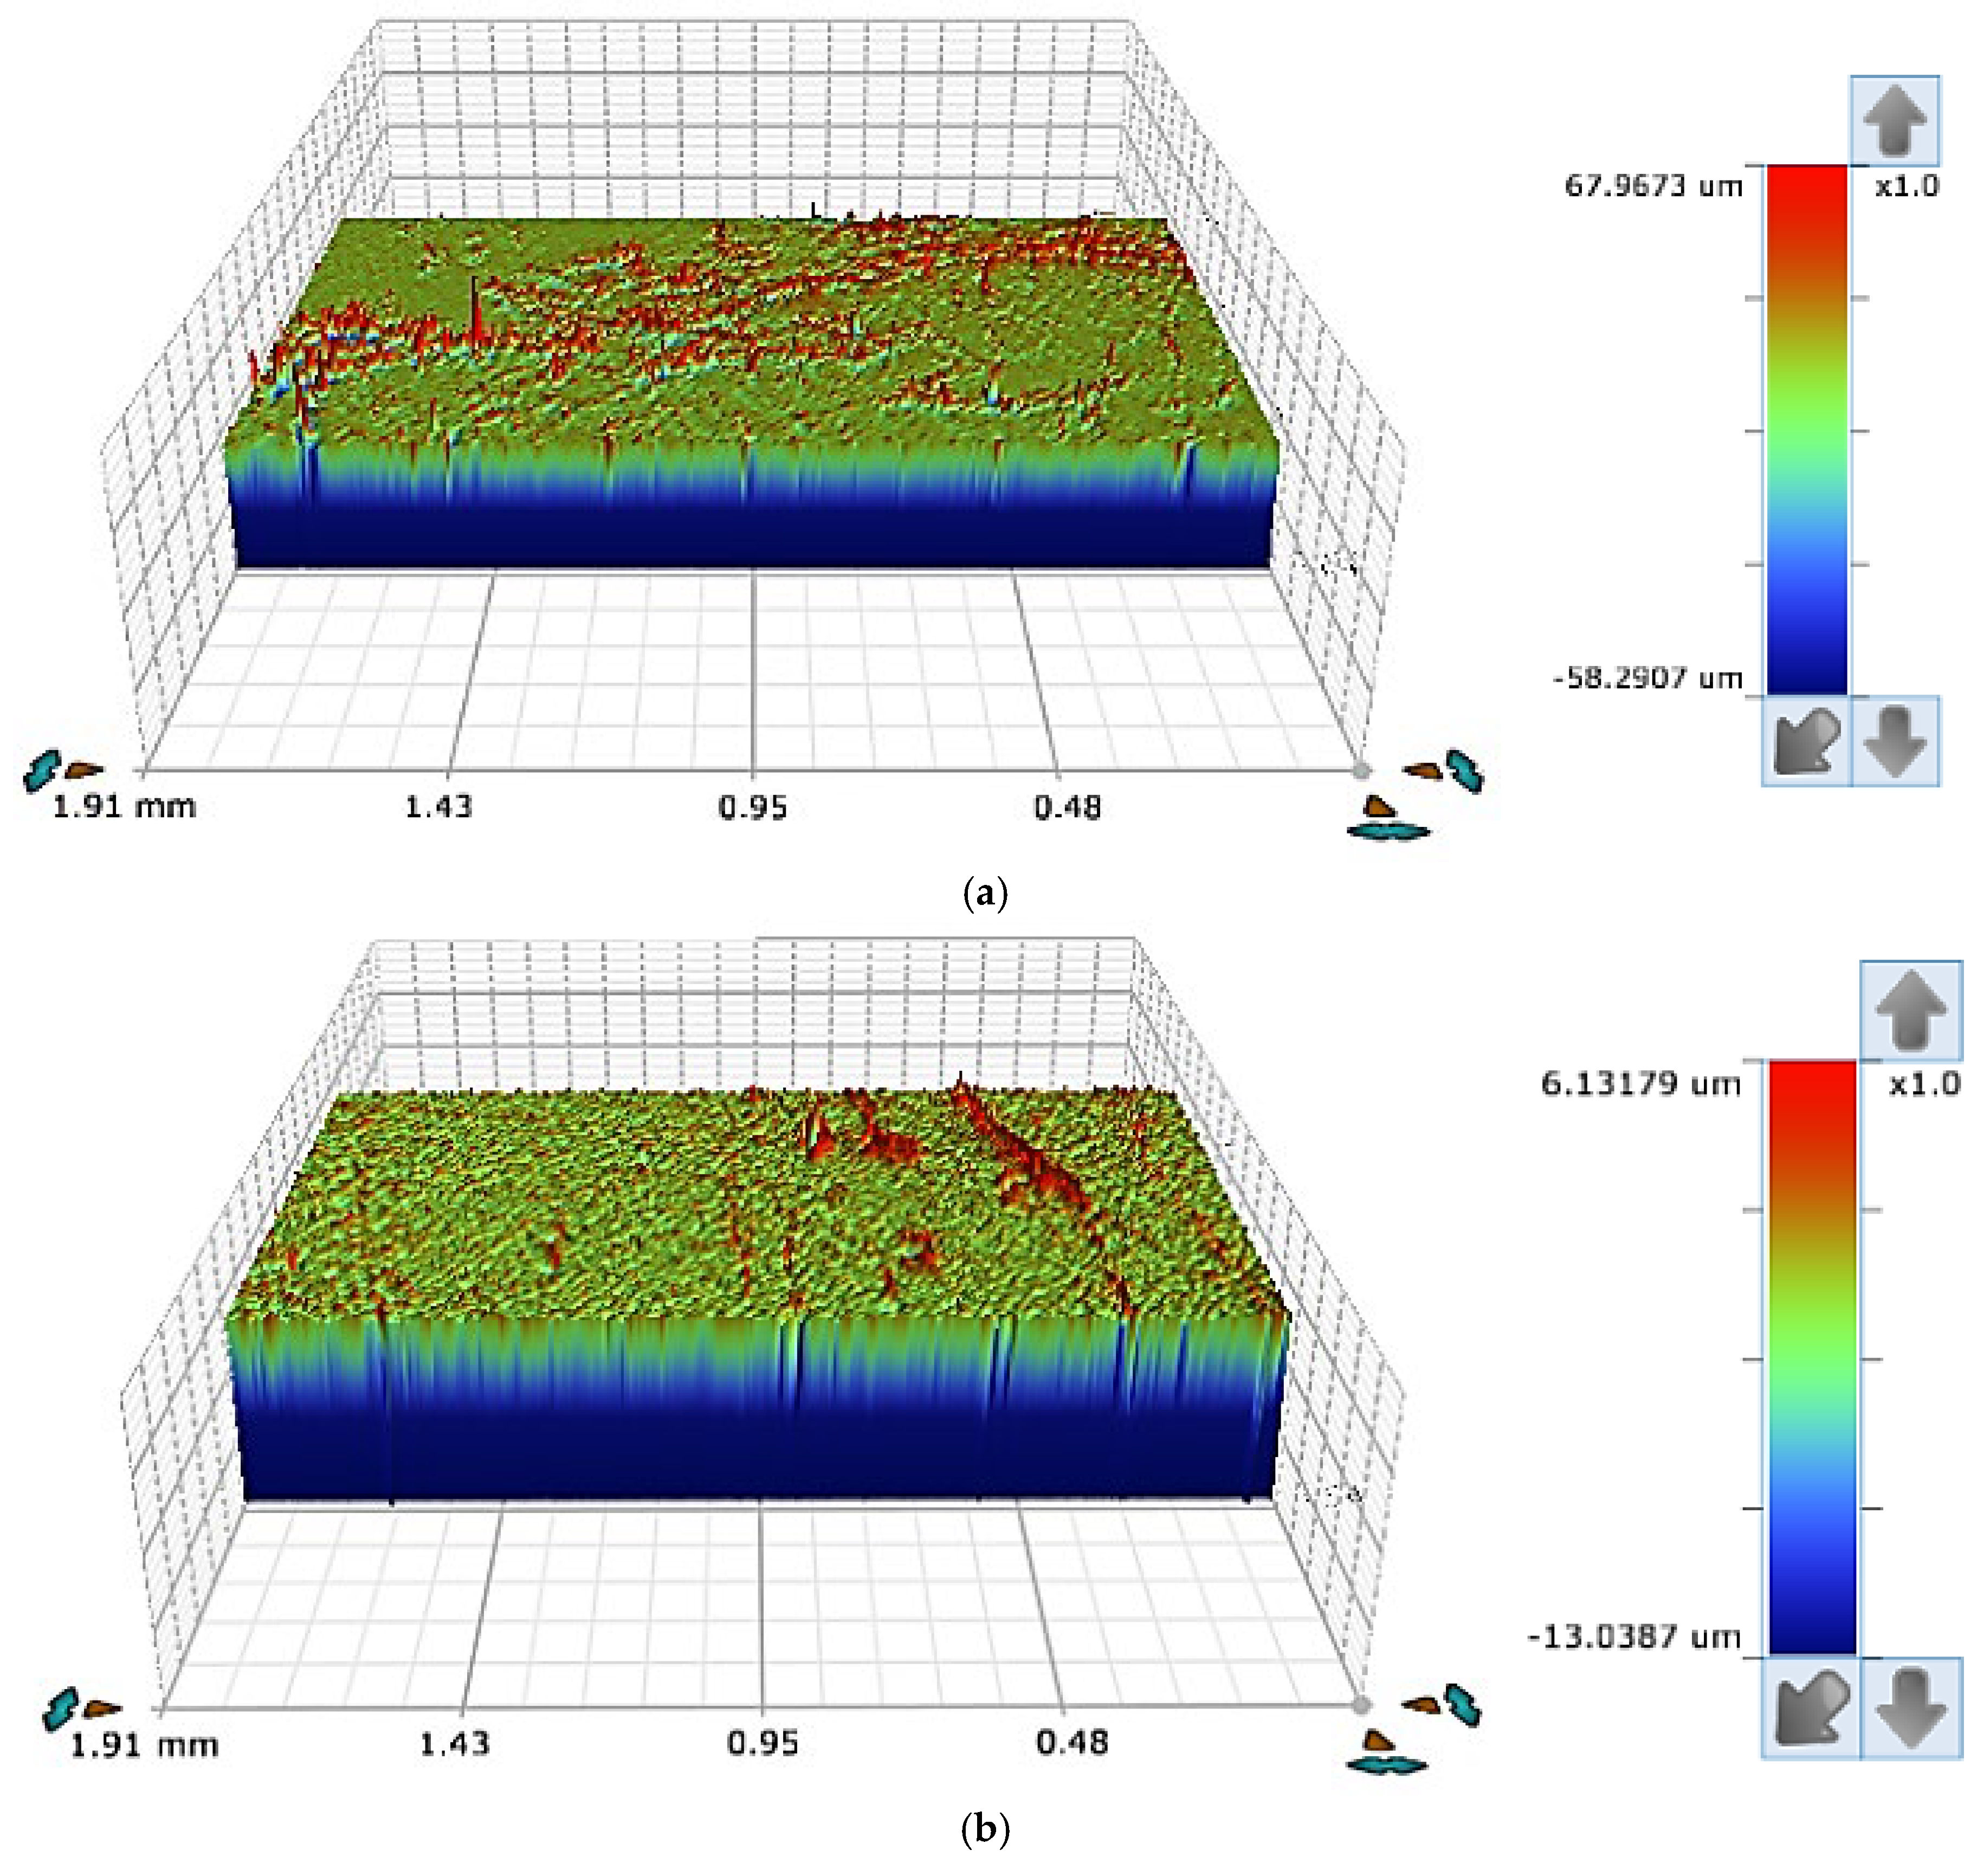
2.3.2. Surface Roughness Quantification

Every manufacturing process has a unique surface finish known as the “fingerprint.” This unique surface finish is in fact the surface topography of the finished product [38]. Peaks and valleys make up every material’s surface when observed at the microscopic scale. Variations in the dimensions of these “peaks and valleys”, as well as the spacing between them, dictate the surface topography’s variety.
A number of different methods can be used to describe the surface properties of materials. These include contact and non-contact approaches. More details of these techniques can be found in [39]. In this study, surface roughness is assessed utilizing a 3D optical profiling system, specifically the Contour GT-K1-3D Optical Microscope, manufactured by Bruker in Billerica, MA, USA, as illustrated in Figure 3. Three-dimensional optical profilometers have been utilized in the scientific and industrial fields to evaluate the performance and surface quality of materials [40]. The profiling system makes use of a method that has an easy-to-use interface. It uses interferometry with white and green light. With sub-nanoscale resolution, the profiling system can quickly measure three-dimensional surfaces at scales ranging from millimeters to nanometers. The Contour GT-K1 can conduct 3D surface metrology because of its quick data gathering abilities, simple measurement setup, and small fingerprint [41]. Moreover, the arithmetic mean of the absolute value (Ra) (ISO 4287 [42]), as defined by Equation (2) [43,44], was employed to quantify the roughness parameter for a specified sample length of the finished surface across various experimental configurations. In Equation (2), L represents the profile length, and Z denotes the absolute value of the roughness profile, as depicted in Figure 4.
R a = 1 L 0 L Z x d x .
The selection of the Ra parameter was primarily because Ra is one of the most commonly used parameters for evaluating surface roughness in both academic research and industrial practice, especially in the context of injection molding. Its widespread adoption is due to its simplicity, ease of measurement, and straightforward interpretation, making it a standard reference in many surface quality studies [45,46]. Ra serves as a significant parameter in evaluating the surface quality of polymeric components, particularly in injection molding. While Ra does not encompass all nuances of surface texture, its correlation with visual appearance and functional properties such as friction and wear has been documented in various studies. Experimental research indicates that improved surface quality, represented by reduced Ra values, enhances appearance characteristics; specifically, parts with lower roughness often exhibit better gloss and esthetic appeal [29,47].

2.4. Experimental Results from Injection Molding Tests

Seventy-nine test points were generated through design of experiments (DOE), with injection molding tests conducted at each of these points. Volumetric shrinkage on each of the specimens was determined according to Equation (1). Surface roughness was measured precisely at the center of each injection molding sample to ensure fair comparability. The method described in Section 2.3.2 was followed to determine the surface roughness values. Additionally, roughness was also measured 10 mm from the injection point. The results for product shrinkage and roughness are presented in Table 4 for each of the test points. It should, however, be mentioned that 4 of the 79 specimens had some problems and were excluded from the results in Table 4.
In Figure 5a,b, pictures of products with severe and moderate volumetric shrinkage are presented, respectively. In Figure 5b, which corresponds to sample No. 16, the occurrence of flashing is observed. This is attributed to the high injection and packing pressure applied, which reached the upper limit of the injection and packing pressures specified in Table 3. In Figure 6, samples exposed to both moderate and high injection and packing pressures are displayed, offering a comparative view of how varying pressure levels impact the product. The sample in Figure 6a, corresponding to sample 71, was subjected to an injection pressure of 625 bars and a packing pressure of 250 bars, whereas the product in Figure 6b, corresponding to sample 32, experienced higher pressures of 780 bars and 400 bars, respectively.
The product roughness profiles for products with low and high surface roughness for products with roughness measured at the center of the product are shown, respectively, in Figure 7a,b. Presented in Figure 8 are the roughness profiles corresponding to products in Figure 7 but measured 10 mm from the injection point.

3. Surrogate Modeling and Multi-Objective Optimization

The objective of this study is to optimize injection molding process parameters to minimize surface roughness while adhering to constraints ensuring an acceptable level of volumetric shrinkage. This involves establishing relationships between the process parameters and both surface roughness and volumetric shrinkage. Previous research in related fields has seen researchers develop various surrogate models to correlate injection molding process parameters with defects such as warpage and volumetric shrinkage. These surrogate models include artificial neural networks [48,49], support vector regression [50], response surface methods [6,12], and Kriging [11,13]. In this work, the Kriging approach was adopted to create two surrogate models. Optimization based on these surrogate models was then set up and solved for the minimum roughness subject to constraints on volumetric shrinkage. What follows is a discussion on the two Kriging models and optimization.

3.1. Surrogate Modeling: Kriging

Kriging, a geo-statistical interpolation technique, considers both the distance between known data points and the variability within those points when predicting values for unknown areas [51,52]. The Kriging method and its implementation using the MATLAB version: R2018b Kriging toolbox in this study are detailed in [53].
The two surrogate models, previously described, were constructed using experimental data (reported in Table 4) and the aid of the Kriging MATLAB toolbox [53]. To establish a relationship between roughness and process parameters, the roughness measured at the center of the product was used. The roughness data at the injection point exhibited significant fluctuations, making it impossible to establish a meaningful relationship between roughness and the process parameters. This was most likely due to the formation of wavelike flow marks at the injection point (see [31,54]).
To assess the reliability and generalization ability of the Kriging models, we applied Leave-One-Out Cross-Validation (LOOCV). In this method, each data point is removed once, and the model is trained on the remaining data to predict the excluded point. The prediction errors from all iterations were then used to calculate the Root Mean Square Error (RMSE), providing a quantitative measure of model accuracy. The resulting RMSEs were 0.299 mm3, which is low compared to the measured shrinkage range (1.97–6.45 mm3), and 0.135 µm, which is slightly higher but reasonable compared to the observed roughness range (0.395–0.993 µm), confirming that the model offers reasonable predictive performance and avoids overfitting.
To gain an insight into these relationships, the two surrogate models are plotted in Figure 9 and Figure 10 as functions of the process parameters. The plots in Figure 9 affirm the established patterns regarding the effects of process parameters on volumetric shrinkage. Figure 9a illustrates that increasing mold and melt temperatures leads to higher volumetric shrinkage, consistent with the observations in Figure 9c. Higher melt temperatures can increase shrinkage because the polymer expands more when heated and shrinks more significantly upon cooling. In addition, higher temperatures may lead to more polymer chain orientation during flow, which can cause uneven shrinkage. On the other hand, higher mold temperatures allow for the slower cooling of the material, reducing internal stresses and warpage but increasing shrinkage. It is also observed in Figure 9a that as the parking time rises, volumetric shrinkage tends to decrease. This is because longer packing times ensure that enough material is added to offset shrinkage during cooling.
Figure 9b indicates that an increase in both packing pressure and injection pressure results in decreased volumetric shrinkage. This is because higher packing and injection pressures force more material into the cavity during the packing phase, compensating for material shrinkage during cooling. Additionally, Figure 9d demonstrates that volumetric shrinkage declines with longer cooling times. Insufficient cooling time can lead to parts that are not fully solidified when ejected, causing warpage and higher shrinkage as the part cools outside the mold. Figure 9d also indicates that shrinkage is higher at higher speeds, as well as lower speeds. This is because higher injection speeds may lead to uneven shrinkage due to increased shear heating and faster cooling in certain regions, and lower injection speeds may prevent full cavity filling, leading to higher shrinkage or defects like voids. These observations are summarized in Table 5.
Figure 10 offers valuable insight into the correlation between surface roughness and injection molding process parameters. Figure 10a suggests that increasing mold temperature leads to a decrease in roughness, a trend also evident in Figure 10c. This behavior has been reported in [29,59]. This behavior is most likely attributed to the fact that higher mold temperatures allow the molten polymer to flow smoothly and conform closely to the smooth mold surface, thereby improving surface finish. This figure also shows that roughness decreases with increasing packing time. Longer packing time may help maintain the material in a molten state for a longer period, allowing for better surface replication, as well as reducing voids, sink marks, and surface defects caused by shrinkage, improving surface smoothness. Figure 10b illustrates that increasing the injection pressure leads to a reduction in roughness, a finding consistent with the results reported in [34]. Higher injection pressure improves mold surface replication by forcing the molten polymer into fine details of the mold and thus reducing voids and sink marks, leading to smoother surfaces. This figure also shows that for low injection pressures, as the packing pressure is increased, roughness decreases. This trend is reported in [29]. This trend is, however, reversed for higher packing pressure. It is observed in Figure 10c that as the melt temperature increases, the roughness decreases, which is a behavior that is also reported in [29,34]. Higher melt temperatures decrease the polymer’s viscosity, allowing for the better flow and replication of mold surface details and thus reducing surface roughness. Lastly, Figure 10d reveals that cooling time has minimal impact on surface roughness, corroborating the findings reported in [33]. However, the injection speed shows an interesting behavior (not seen in the literature) where the roughness dips as the injection speed increases and then increases again for higher speeds. This increase could be attributed to the flow becoming turbulent at higher speeds, leading to surface defects like flow marks and jetting. On the other hand, low speeds may result in incomplete mold filling, resulting in an increase in surface roughness. These observations are summarized in Table 6.
Injection molding process parameters, such as packing pressure, mold temperature, cooling time, injection speed, injection pressure, melt temperature, and packing time, play a crucial role not only in determining volumetric shrinkage and surface roughness but also in influencing the overall functional properties of the final product, including mechanical strength, esthetic quality, and dimensional stability.
For instance, packing pressure helps compensate for material shrinkage during the cooling phase. When applied adequately, it reduces the formation of sink marks and voids, thereby enhancing the product’s dimensional stability and part density [18,56,60]. Packing time, which refers to the duration that the pressure is maintained for after the mold is filled, impacts the extent of post-fill compaction. Sufficient packing time contributes to consistent dimensions, whereas excessively long durations may increase cycle time without significant improvements in product quality [56,60].
Melt temperature influences the viscosity of the polymer melt, affecting both mold cavity filling and the level of internal stress retained after solidification. While higher melt temperatures improve flow characteristics and help prevent short shots, they may also degrade the polymer if thermal thresholds are exceeded, ultimately compromising the mechanical strength of the finished part [61].
Mold temperature significantly affects the functional properties of injection-molded components. Elevated mold temperatures can promote polymer crystallization in semi-crystalline materials such as polypropylene (PP) and polyamide (PA), thereby enhancing tensile and flexural moduli along with tensile yield strength [62,63].
Cooling time is critical for dimensional accuracy. Longer cooling durations promote uniform solidification, reducing internal stresses and minimizing warpage and shrinkage [64,65].
Injection pressure also has a notable impact on product functionality. Higher injection pressures improve the ability of molten polymers to fill thin sections and complex geometries while also enhancing dimensional accuracy and reducing defects such as warpage [26].
Lastly, injection speed and melt temperature influence the strength of weld lines. Increasing both parameters has been shown to improve weld line strength, thereby reinforcing the structural integrity of the molded part [66].
It is important to note that semi-crystalline thermoplastics such as HDPE, polypropylene (PP), nylon, and polybutylene terephthalate (PBT) undergo a phenomenon known as supercooling. This occurs when the polymer melt is cooled below its solidification temperature without immediately crystallizing. Supercooling typically arises during rapid cooling in the injection molding process or when there are insufficient nucleation sites to initiate crystallization.
This phenomenon influences material shrinkage, as well as mechanical properties and optical clarity. Additionally, semi-crystalline thermoplastics may undergo secondary shrinkage, which takes place after the part has been ejected from the mold and continues as the part cools to room temperature—sometimes over extended periods. This contrasts with primary shrinkage, which occurs while the part is still inside the mold and is typically compensated for by packing pressure.
Although this study did not explicitly model the effects of supercooling or distinguish between primary and secondary shrinkage, the surrogate model developed using the Kriging technique inherently captures their combined impact. This is achieved through the inclusion of key process parameters—such as melt temperature, mold temperature, packing pressure, cooling time, and packing time—which are known to influence cooling dynamics, crystallization behavior, and shrinkage progression during and after solidification.
As a result, any changes in volumetric shrinkage caused by phenomena such as supercooling or delayed secondary shrinkage are reflected in the experimental shrinkage data used to train the surrogate model.
Therefore, the model effectively incorporates the net effects of these complex underlying mechanisms, even though they are not explicitly modeled or analyzed independently. This approach enables the prediction and optimization of shrinkage behavior within the practical constraints of process-oriented, data-driven modeling for injection molding.

3.2. Multi-Objective Optimization

The two previously developed surrogate models, representing surface roughness and volumetric shrinkage in relation to process parameters, were used to formulate a multi-objective optimization problem aimed at identifying optimal process settings. This problem was defined to simultaneously minimize both surface roughness and product volume shrinkage, with process parameters constrained by the bounds listed in Table 3.
The surrogate models were constructed using the Kriging method, selected for its proven capability in modeling complex, nonlinear relationships characteristic of injection molding processes. Unlike statistical approaches such as the ANOVA, which primarily quantify variance contributions of individual factors, Kriging produces a comprehensive approximation of the entire solution space, allowing for reliable predictions at untested parameter combinations. Moreover, it provides uncertainty quantification (e.g., confidence intervals), enhancing the reliability of decision-making—particularly when experimental data are limited.
In Equation (3), the aggregate objective function F consists of two components, F1 and F2, corresponding to surface roughness and volumetric shrinkage, respectively. The parameter vector z includes the molding process parameters, as listed in Table 3.
Minimize                         F = F 1 ( z ) , F 2 ( z ) Such   that                 z min z z max
Optimization was performed using the pattern search algorithm, which is suitable for problems where derivative information is unavailable [67,68]. The following settings were used: a mesh size tolerance of 10 6 ; maximum iterations set to 100   N , where N is the number of variables; an initial mesh size of 1.0; and mesh expansion and reduction factors of 2.0 and 0.5, respectively. The algorithm’s adaptive mesh refinement strategy ensured convergence, terminating when the mesh size dropped below the specified tolerance.
To evaluate the robustness of the obtained solutions, multiple optimization runs were initiated from different starting points across the feasible design space. These runs yielded highly consistent results, with variation below 5%, indicating reliable convergence toward the global Pareto front rather than local optima.
A representative Pareto front is shown in Figure 11, illustrating the inherent trade-off between surface roughness and volumetric shrinkage. This offers valuable insight for decision-makers by presenting a spectrum of optimal parameter combinations, balancing competing performance objectives without the need for additional simulations.
Three main points can be identified in this graph (listed in Table 7). The first point, P1, is the best choice for minimizing volumetric shrinkage, but the surface roughness will be at its maximum value. The opposite is true for the third point, P3. Meanwhile, the second point, P2, is the best compromise between the two functions.

4. Concluding Remarks

In this study, a framework for optimizing injection molding process parameters to minimize surface roughness and volumetric shrinkage in molded products was presented. The procedure involves constructing two surrogate models using the Kriging methodology to describe the relationships between process parameters and the two target outputs: surface roughness and volumetric shrinkage. These models were developed based on data obtained from actual injection molding experiments.
Several plots of the surrogate models as functions of the process parameters were generated to gain insights into these relationships. The observations from these plots reveal the following:
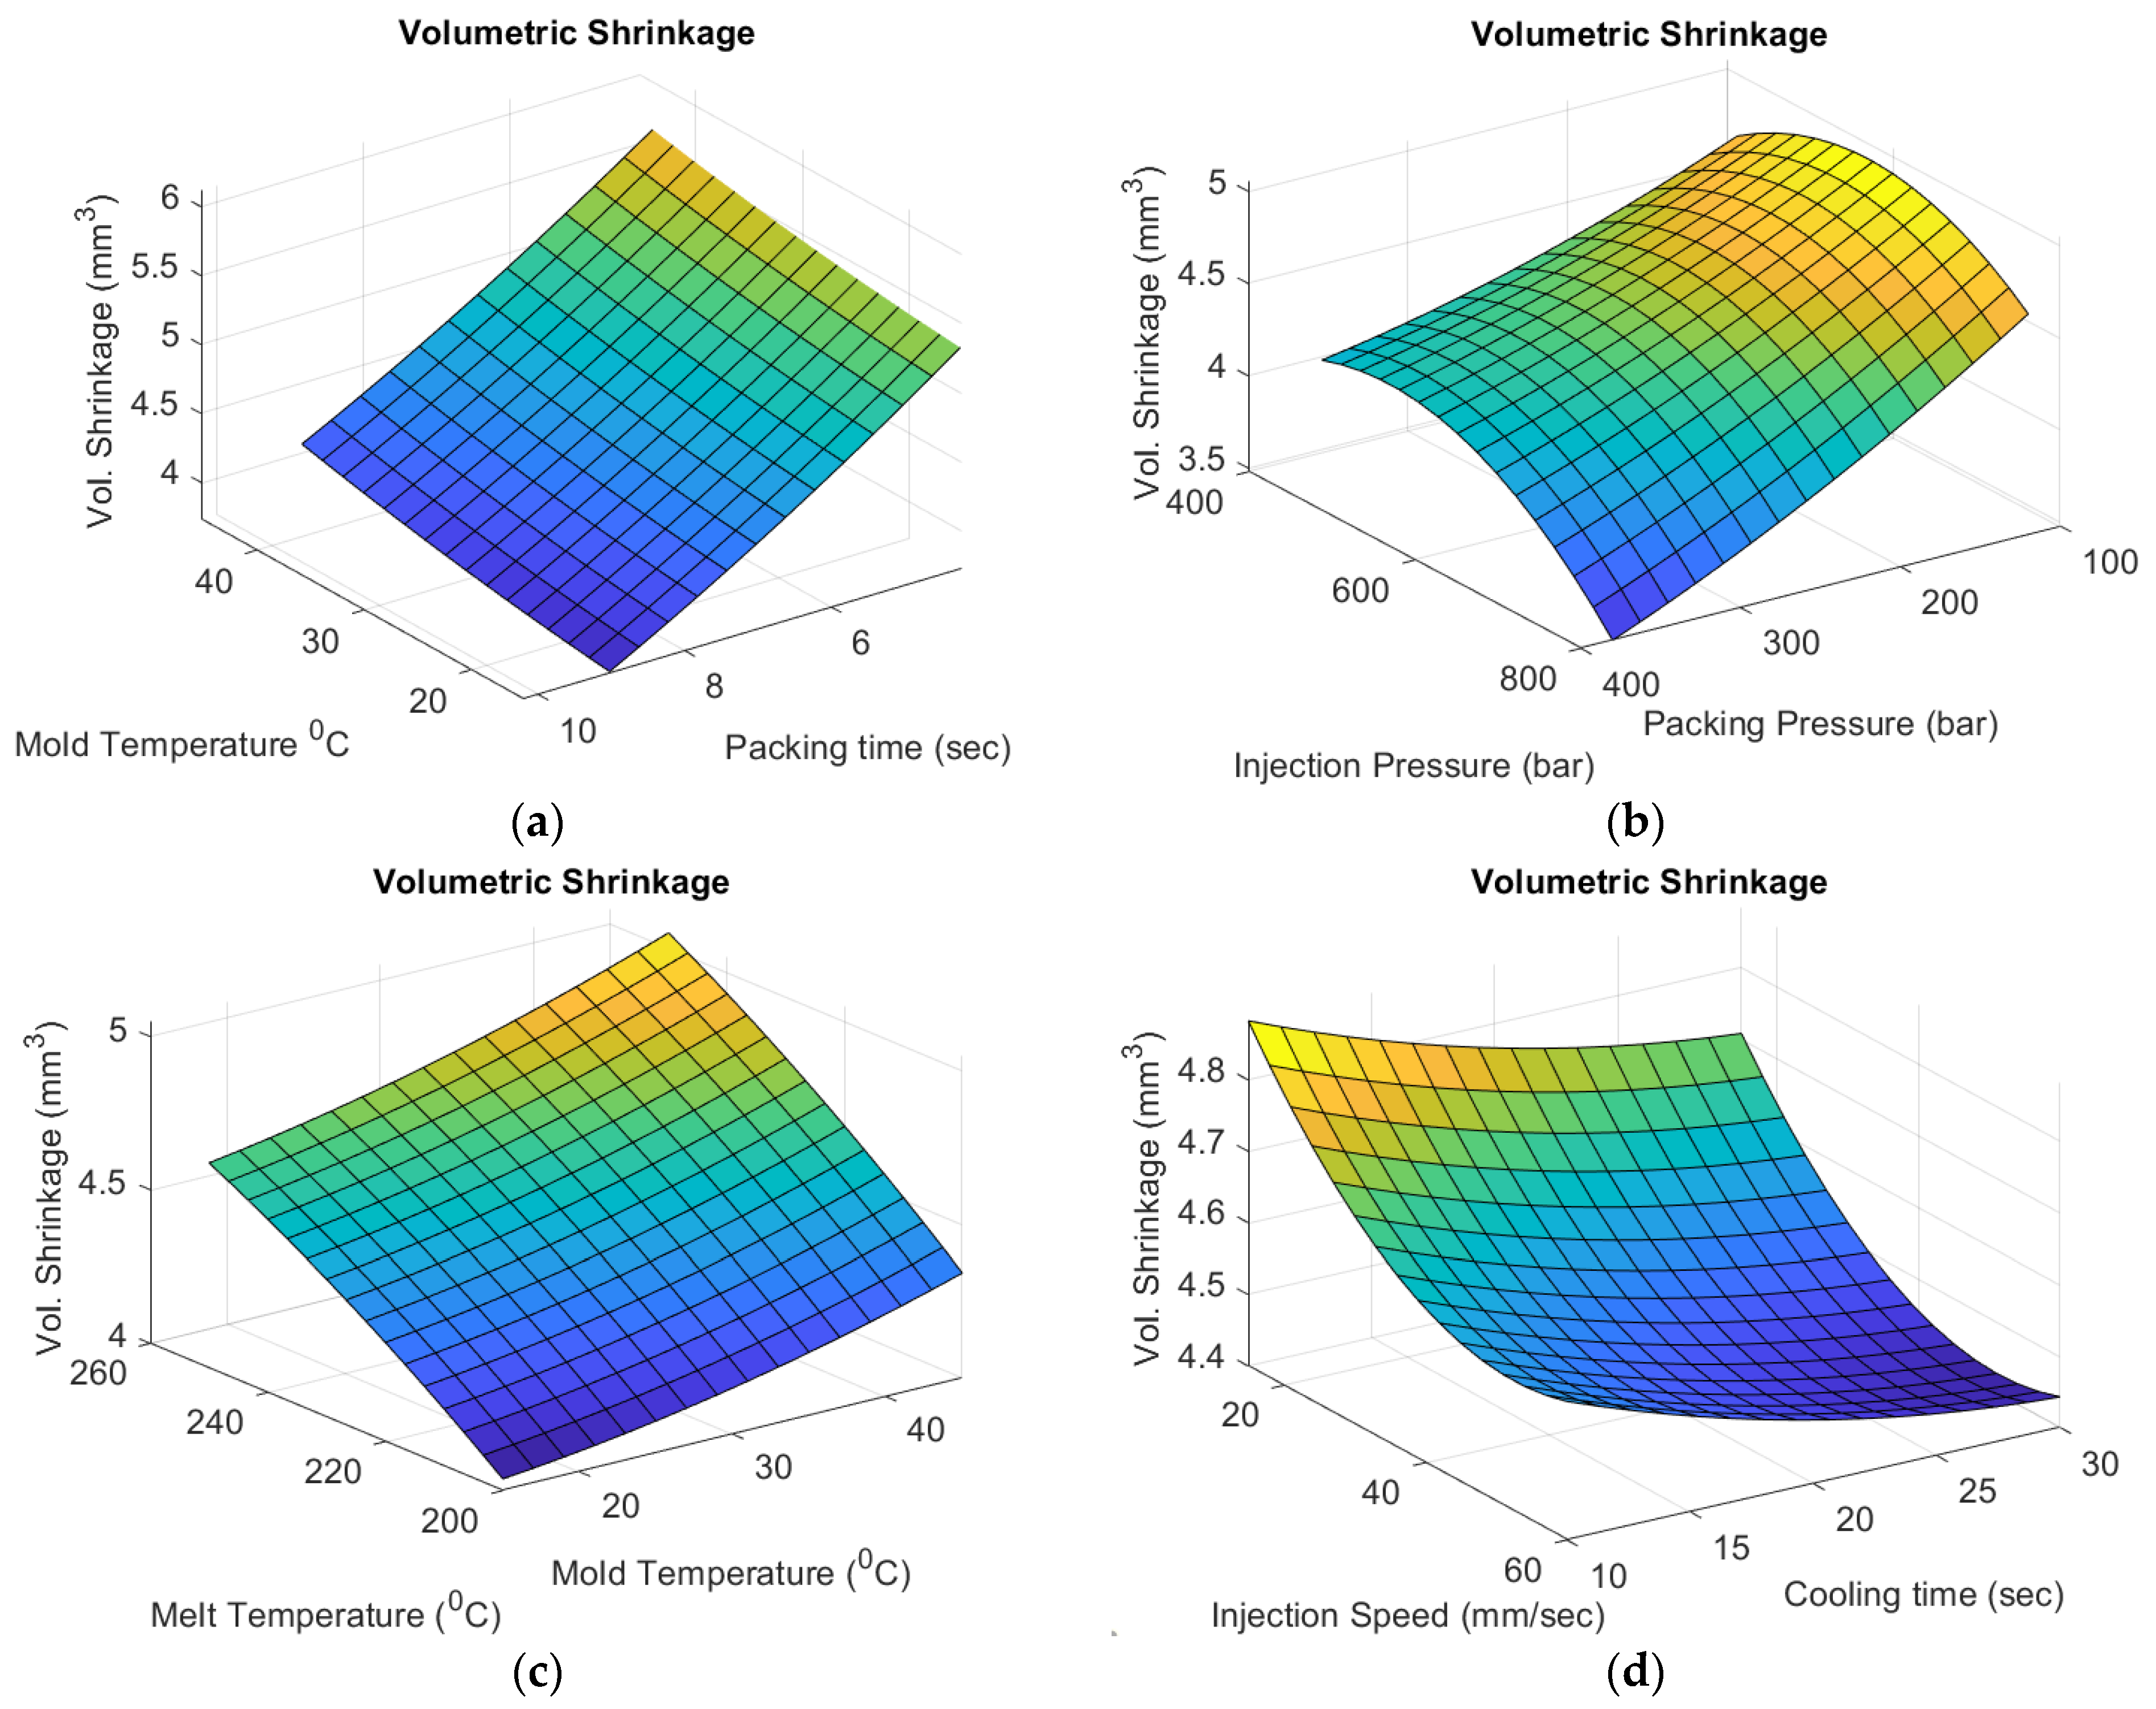
  • Volumetric shrinkage generally decreases with increasing injection pressure, packing pressure, packing time, and cooling time.
  • Surface roughness generally decreases with increasing mold temperature, packing time, injection pressure, and melt temperature.
These trends validate known relationships in the field regarding how injection molding parameters influence product quality.
A two-objective optimization problem was then formulated and solved using the pattern search algorithm, accounting for the interdependence between surface roughness and volumetric shrinkage. This process generated a Pareto front that highlights the trade-off between the two competing objectives and led to the identification of three optimal parameter sets:
  • Point 1: Minimizes volumetric shrinkage (1.9314 mm3) but results in the highest surface roughness (0.55956 µm).
  • Point 2: Achieves the lowest surface roughness (0.20557 µm) but results in the highest volumetric shrinkage (3.9286 mm3).
  • Point 3: Offers the best compromise with a volumetric shrinkage of 2.2348 mm3 and a surface roughness of 0.28246 µm.
Through an analysis of the Pareto front, the optimal balance between conflicting objectives was determined.
The dilemma of achieving both suitable surface roughness and minimal volumetric shrinkage, which are conflicting objectives, poses a significant challenge for the injection molding sector. The authors assert that the optimization framework proposed in this study can be readily implemented within the industry. This framework provides plastic injection molding engineers and managers with a potent decision-making tool, empowering them to identify the optimal compromise among process parameters to address both objectives effectively. Additionally, improvements to surface roughness can be achieved by adjusting the process parameters, potentially providing a cost-effective alternative to the more expensive approach of enhancing product roughness by improving mold surface roughness.

Author Contributions

Conceptualization, S.M.S.M.; methodology, S.M.S.M. and H.M.O.; validation, S.M.S.M.; formal analysis, S.M.S.M. and H.M.O.; investigation, S.M.S.M. and H.Z.K.; data curation, S.M.S.M. and H.Z.K.; writing—original draft preparation, S.M.S.M., H.Z.K. and H.M.O.; writing—review and editing, S.M.S.M., H.Z.K. and H.M.O.; visualization, S.M.S.M. and H.M.O.; supervision, S.M.S.M.; project administration, S.M.S.M. All authors have read and agreed to the published version of the manuscript.

Funding

This research received no external funding.

Institutional Review Board Statement

Not applicable.

Informed Consent Statement

Not applicable.

Data Availability Statement

All the data underpinning the conclusions of the presented study are accessible within this paper.

Acknowledgments

The researchers would like to thank the Deanship of Graduate Studies and Scientific Research at Qassim University for financial support (QU-APC-2025).

Conflicts of Interest

The authors declare no conflicts of interest.

References

  1. Zheng, R.; Roger, I.T.; Xi-Jun, F. Injection Molding: Integration of Theory and Modeling Methods; Springer: Berlin/Heidelberg, Germany; New York, NY, USA, 2011; p. 188. [Google Scholar]
  2. Rosato, D.V.; Rosato, D.V.; Rosato, M.G. Injection Molding Handbook, 3rd ed.; Springer: New York, NY, USA, 2000; Volume 1. [Google Scholar]
  3. Dang, X.-P. General frameworks for optimization of plastic injection molding process parameters. Simul. Model. Pract. Theory 2014, 41, 15–27. [Google Scholar] [CrossRef]
  4. Choi, G.H.; Lee, K.D.; Chang, N.; Kim, S.G. Optimization of Process Parameters of Injection Molding with Neural Network Application in a Process Simulation Environment. CIRP Ann. 1994, 43, 4. [Google Scholar] [CrossRef]
  5. Khosravani, M.R.; Nasiri, S. Injection molding manufacturing process: Review of case-based reasoning applications. J. Intell. Manuf. 2020, 31, 847–864. [Google Scholar] [CrossRef]
  6. Kurtaran, H.; Erzurumlu, T. Efficient warpage optimization of thin shell plastic parts using response surface methodology and genetic algorithm. Int. J. Adv. Manuf. Technol. 2005, 27, 468–472. [Google Scholar] [CrossRef]
  7. Ozcelik, B.; Erzurumlu, T. Determination of effecting dimensional parameters on warpage of thin shell plastic parts using integrated response surface method and genetic algorithm. Int. Commun. Heat Mass Transf. 2005, 32, 1085–1094. [Google Scholar] [CrossRef]
  8. Kurtaran, H.; Ozcelik, B.; Erzurumlu, T. Warpage optimization of a bus ceiling lamp base using neural network model and genetic algorithm. J. Mater. Process. Technology. 2005, 169, 314–319. [Google Scholar] [CrossRef]
  9. Ozcelik, B.; Erzurumlu, T. Comparison of the warpage optimization in the plastic injection molding using ANOVA, neural network model and genetic algorithm. J. Mater. Process. Technol. 2006, 171, 437–445. [Google Scholar] [CrossRef]
  10. Deng, W.-J.; Chen, C.-T.; Sun, C.-H.; Chen, W.-C.; Chen, C.-P. An Effective Approach for Process Parameter Optimization in Injection Molding of Plastic Housing Components. Polym.-Plast. Technol. Eng. 2008, 47, 910–919. [Google Scholar] [CrossRef]
  11. Gao, Y.; Wang, X. An effective warpage optimization method in injection molding based on the Kriging model. Int. J. Adv. Manuf. Technol. 2008, 37, 953–960. [Google Scholar] [CrossRef]
  12. Chen, C.-C.; Su, P.-L.; Lin, Y.-C. Analysis and modeling of effective parameters for dimension shrinkage variation of injection molded part with thin shell feature using response surface methodology. Int. J. Adv. Manuf. Technol. 2009, 45, 1087–1095. [Google Scholar] [CrossRef]
  13. Gao, Y.; Wang, X. Surrogate-based process optimization for reducing warpage in injection molding. J. Mater. Process. Technol. 2009, 209, 1302–1309. [Google Scholar] [CrossRef]
  14. Altan, M. Reducing shrinkage in injection moldings via the Taguchi, ANOVA and neural network methods. Mater. Des. 2010, 31, 599–604. [Google Scholar] [CrossRef]
  15. Farshi, B.; Gheshmi, S.; Miandoabchi, E. Optimization of injection molding process parameters using sequential simplex algorithm. Mater. Des. 2011, 32, 414–423. [Google Scholar] [CrossRef]
  16. Yin, F.; Mao, H.; Hua, L. A hybrid of back propagation neural network and genetic algorithm for optimization of injection molding process parameters. Mater. Des. 2011, 32, 3457–3464. [Google Scholar] [CrossRef]
  17. Yin, F.; Mao, H.; Hua, L.; Guo, W.; Shu, M. Back Propagation neural network modeling for warpage prediction and optimization of plastic products during injection molding. Mater. Des. 2011, 32, 1844–1850. [Google Scholar] [CrossRef]
  18. Zhao, J.; Cheng, G.; Ruan, S.; Li, Z. Multi-objective optimization design of injection molding process parameters based on the improved efficient global optimization algorithm and non-dominated sorting-based genetic algorithm. Int. J. Adv. Manuf. Technol. 2015, 78, 1813–1826. [Google Scholar] [CrossRef]
  19. Xu, Y.; Zhang, Q.; Zhang, W.; Zhang, P. Optimization of injection molding process parameters to improve the mechanical performance of polymer product against impact. Int. J. Adv. Manuf. Technol. 2015, 76, 2199–2208. [Google Scholar] [CrossRef]
  20. Mohan, M.; Ansari, M.N.M.; Shanks, R.A. Review on the Effects of Process Parameters on Strength, Shrinkage, and Warpage of Injection Molding Plastic Component. Polym.-Plast. Technol. Eng. 2017, 56, 1132466. [Google Scholar] [CrossRef]
  21. Kitayama, S.; Miyakawa, H.; Takano, M.; Aiba, S. Multi-objective optimization of injection molding process parameters for short cycle time and warpage reduction using conformal cooling channel. Int. J. Adv. Manuf. Technol. Vol. 2017, 88, 1735–1744. [Google Scholar] [CrossRef]
  22. Singh, G.; Pradhan, M.K.; Verma, A. Multi Response optimization of injection moulding Process parameters to reduce cycle time and warpage. Mater. Today Proc. 2018, 5, 8398–8405. [Google Scholar] [CrossRef]
  23. Ramesh, S.; Nirmala, P.; Ramkumar, G.; Sahoo, S.; Anitha, G.; Gnanasekar, A.K.; Isaac JoshuaRamesh Lalvani, J. Simulation Process of Injection Molding and Optimization for Automobile Instrument Parameter in Embedded System. Adv. Mater. Sci. Eng. 2021, 2021, 9720297. [Google Scholar] [CrossRef]
  24. Mohd Hanid, M.H.; Abd Rahim, S.Z.; Gondro, J.; Sharif, S.; Al Bakri Abdullah, M.M.; Zain, A.M.; El-hadj Abdellah, A.; Mat Saad, M.N.; Wysłocki, J.J.; Nabiałek, M. Warpage Optimisation on the Moulded Part with Straight Drilled and Conformal Cooling Channels Using Response Surface Methodology (RSM), Glowworm Swarm Optimisation (GSO) and Genetic Algorithm (GA) Optimisation Approaches. Materials 2021, 14, 1326. [Google Scholar] [CrossRef] [PubMed]
  25. Kitayama, S.; Matsubayashi, A.; Takano, M.; Yamazaki, Y.; Kubo, Y.; Aiba, S. Numerical optimization of multistage packing pressure profile in plastic injection molding and experimental validation. Polym. Adv. Technol. 2022, 33, 3002–3012. [Google Scholar] [CrossRef]
  26. Chen, J.; Cui, Y.; Liu, Y.; Cui, J. Design and Parametric Optimization of the Injection Molding Process Using Statistical Analysis and Numerical Simulation. Processes 2023, 11, 414. [Google Scholar] [CrossRef]
  27. Martínez-Mateo, I.; Carrión-Vilches, F.J.; Sanes, J.; Bermúdez, M.D. Surface damage of mold steel and its influence on surface roughness of injection molded plastic parts. Wear 2011, 271, 2512–2516. [Google Scholar] [CrossRef]
  28. Kaneda, R.; Takahashi, T.; Takiguchi, M.; Hijikata, M.; Ito, H. Optical Properties of HDPE in Injection Molding and Injection Press Molding for IR System Lenses Part II: Mold Temperature and Surface Roughness Effects on Injection Molding. Int. Polym. Process. 2017, 32, 237–244. [Google Scholar] [CrossRef]
  29. Oliveira, M.J.; Brito, A.M.; Costa, M.C.; Costa, M.F. Gloss and surface topography of ABS: A study on the influence of the injection molding parameters. Polym. Eng. Sci. 2006, 46, 1394–1401. [Google Scholar] [CrossRef]
  30. Theilade, U.A.; Hansen, H.N. Surface microstructure replication in injection molding. Int. J. Adv. Manuf. Technol. 2007, 33, 157–166. [Google Scholar] [CrossRef]
  31. Wang, G.; Zhao, G.; Wang, X. Experimental research on the effects of cavity surface temperature on surface appearance properties of the moulded part in rapid heat cycle moulding process. Int. J. Adv. Manuf. Technol. 2013, 68, 1293–1310. [Google Scholar] [CrossRef]
  32. Lee, J.; Turng, L.-S. Improving surface quality of microcellular injection molded parts through mold surface temperature manipulation with thin film insulation. Polym. Eng. Sci. 2010, 50, 1281–1289. [Google Scholar] [CrossRef]
  33. Guo, G. Investigation on surface roughness of injection molded polypropylene parts with 3D optical metrology. Int. J. Interact. Des. Manuf. 2021, 16, 17–23. [Google Scholar] [CrossRef]
  34. Usman Jan, Q.M.; Habib, T.; Noor, S.; Abas, M.; Azim, S.; Yaseen, Q.M. Multi response optimization of injection moulding process parameters of polystyrene and polypropylene to minimize surface roughness and shrinkage’s using integrated approach of S/N ratio and composite desirability function. Cogent Eng. 2020, 7, 1781424. [Google Scholar] [CrossRef]
  35. Arburg. Allrounder 420 C Golden Edition. Available online: https://www.arburg.com/media/daten/publications/technical_data/hydraulic_machines/golden_edition/ARBURG_ALLROUNDER_420C_GOLDEN_EDITION_TD_523676_de.pdf (accessed on 2 October 2022).
  36. SABIC. SABIC® HDPE M80064 High Density Polyethylene for Injection Moulding. Available online: http://www.b2bpolymers.com/TDS/SABIC_M80064.pdf (accessed on 10 January 2022).
  37. Oehlert, G.W. A First Course in Design and Analysis of Experiments; Freeman W. H.: New York, NY, USA, 2000. [Google Scholar]
  38. Blunt, L.; Jiang, X. Advanced Techniques for Assessment Surface Topography: Development of a Basis for 3D Surface Texture Standards “Surfstand”. Elsevier: Amsterdam, The Netherlands, 2003. [Google Scholar]
  39. Lonardo, P.M.; Trumpold, H.; De Chiffre, L. Progress in 3D Surface Microtopography Characterization. CIRP Ann. 1996, 45, 589–598. [Google Scholar] [CrossRef]
  40. Petheram, T.G.; Bone, M.; Joyce, T.J.; Serrano-Pedraza, I.; Reed, M.R.; Partington, P.F. Surface finish of the Exeter Trauma Stem: A cause for concern? Bone Jt. J. 2013, 95, 173–176. [Google Scholar] [CrossRef] [PubMed]
  41. Zein, H. Investigation of Surface Texture and Surface Residual Stresses in the Dry Face Turning Process of AL2024-T351. Int. J. Mech. Mechatron. Eng. 2020, 20, 123–143. [Google Scholar]
  42. ISO 4287; Geometrical product specifications (GPS)–Surface texture: Profile method–terms, definitions and surface texture parameters. International Organization for Standardization: Geneva, Switzerland, 1997.
  43. Dong, W.; Sullivan, P.; Stout, K. Comprehensive study of parameters for characterising three-dimensional surface topography: III: Parameters for characterising amplitude and some functional properties. Wear 1994, 178, 29–43. [Google Scholar] [CrossRef]
  44. Dong, W.P.; Sullivan, P.J.; Stout, K.J. Comprehensive study of parameters for characterising three-dimensional surface topography: IV: Parameters for characterising spatial and hybrid properties. Wear 1994, 178, 45–60. [Google Scholar] [CrossRef]
  45. Whitehouse, D.J. Handbook of Surface and Nanometrology; Taylor & Francis: Oxfordshire, UK, 2002. [Google Scholar]
  46. Thomas, T.R. Rough Surfaces; World Scientific: Singapore, 1998. [Google Scholar]
  47. Pisciotti, F.; Boldizar, A.; Rigdahl, M.; Ariño, I. Effects of injection-molding conditions on the gloss and color of pigmented polypropylene. Polym. Eng. Sci. 2005, 45, 1557–1567. [Google Scholar] [CrossRef]
  48. Shen, C.; Wang, L.; Li, Q. Optimization of injection molding process parameters using combination of artificial neural network and genetic algorithm method. J. Mater. Process. Technol. 2007, 183, 412–418. [Google Scholar] [CrossRef]
  49. Shen, C.-Y.; Wang, L.-X.; Zhang, Q.-X. Process Optimization of Injection Molding by the Combining ANN/HGA Method. Polym. Mater. Sci. Eng. 2005, 21, 23–27. [Google Scholar]
  50. Zhou, J.; Turng, L.-S.; Kramschuster, A. Single and multi objective optimization for injection molding using numerical simulation with surrogate models and genetic algorithms. Int. Polym. Process. 2006, 21, 509–520. [Google Scholar] [CrossRef]
  51. Martin, J.D.; Simpson, T.W. Use of Kriging Models to Approximate Deterministic Computer Models. AIAA J. 2005, 43, 853–863. [Google Scholar] [CrossRef]
  52. Paramasivam, C.; Venkatramanan, S. An introduction to various spatial analysis techniques. In GIS and Geostatistical Techniques for Groundwater Science; Venkatramanan, S., Prasanna, M., Chung, S., Eds.; Elsevier: Amsterdam, Netherlands, 2019; pp. 23–30. [Google Scholar]
  53. Lophaven, S.N.; Nielsen, H.B.; Søndergaard, J. DACE—A Matlab Kriging Toolbox. In IMM Informatiocs and Mathematical Modelling, 2nd ed.; Technical University of Denmark: Copenhagen, Denmark, 2002; pp. 1–34. [Google Scholar]
  54. Gim, J.; Turng, L.-S. A review of current advancements in high surface quality injection molding: Measurement, influencing factors, prediction, and control. Polym. Test. 2022, 115, 107718. [Google Scholar] [CrossRef]
  55. Lee, J.L.; Ho, C.H.; Lin, Y.; Shen, Y.K. Fabrication and detection for the skeletons of micro aerial vehicle using precision injection molding. Key Eng. Mater. 2010, 443, 75–80. [Google Scholar] [CrossRef]
  56. Huang, M.-C.; Tai, C.-C. The effective factors in the warpage problem of an injection-molded part with a thin shell feature. J. Mater. Process. Technol. 2001, 110, 1–9. [Google Scholar] [CrossRef]
  57. Nian, S.; Yang, S. Molding of thin sheets using impact micro-injection molding. Int. Polym. Process. 2022, 20, 441–448. [Google Scholar] [CrossRef]
  58. Chen, C.-S.; Chen, S.-C.; Liao, W.-H.; Chien, R.-D.; Lin, S.-H. Micro injection molding of a micro-fluidic platform. Int. Commun. Heat Mass Transf. 2010, 37, 1290–1294. [Google Scholar] [CrossRef]
  59. An, C.-C.; Chen, R.-H. The experimental study on the defects occurrence of SL mold in injection molding. J. Mater. Process. Technology. 2008, 201, 706. [Google Scholar] [CrossRef]
  60. Meiabadi, M.S.; Moradi, M.; Kazerooni, A.; Demers, V. Multi-objective optimisation of plastic injection moulding process using mould flow analysis and response surface methodology. Int. J. Mater. Prod. Technol. 2022, 64, 140–155. [Google Scholar] [CrossRef]
  61. Raz, K.; Sedlacek, F. Effect of melt temperature on weld line strength. Key Eng. Mater. 2019, 801, 264–269. [Google Scholar] [CrossRef]
  62. Rizvi, S. Effect of injection molding parameters on crystallinity and mechanical properties of isotactic polypropylene. Int. J. Plast. Technol. 2017, 21, 404–426. [Google Scholar] [CrossRef]
  63. Farotti, E.; Natalini, M. Injection molding. Influence of process parameters on mechanical properties of polypropylene polymer. A first study. Procedia Struct. Integr. 2018, 8, 256–264. [Google Scholar]
  64. Sánchez, R.; Aisa, J.; Martinez, A.; Mercado, D. On the relationship between cooling setup and warpage in injection molding. Measurement 2012, 45, 1051–1056. [Google Scholar] [CrossRef]
  65. Kuo, C.-C.; Xu, Y.-X. A simple method of improving warpage and cooling time of injection molded parts simultaneously. The Int. J. Adv. Manuf. Technol. 2022, 122, 619–637. [Google Scholar] [CrossRef]
  66. Turng, L.S.; Kharbas, H. Effect of process conditions on the weld-line strength and microstructure of microcellular injection molded parts. Polym. Eng. Sci. 2003, 43, 157–168. [Google Scholar] [CrossRef]
  67. Custódio, A.L.; Madeira, J.A.; Vaz, A.I.F.; Vicente, L.N. Direct multisearch for multiobjective optimization. SIAM J. Optim. 2011, 21, 1109–1140. [Google Scholar] [CrossRef]
  68. Madić, M.; Radovanović, M. Optimization of machining processes using pattern search algorithm. Int. J. Ind. Eng. Comput. 2014, 5, 223–234. [Google Scholar] [CrossRef]
Figure 1. A depiction of the Arburg Allrounder 420 C injection molding unit utilized in the experiments.
Applsci 15 05063 g001
Figure 2. Figure showing details of mold used in this study: (a) picture of two halves of mold; (b) injection molding product dimensions (front and side views).
Applsci 15 05063 g002
Figure 3. Three-dimensional optical profilometer (Contour GT-K1-3D Optical Microscope).
Applsci 15 05063 g003
Figure 4. A graphical illustration of the average surface roughness (Ra) definition.
Applsci 15 05063 g004
Figure 5. (a) Product sample No. 57, with excessive shrinkage (6.49 mm3). (b) Product sample No. 16, with moderate shrinkage (1.97 mm3).
Applsci 15 05063 g005
Figure 6. Products exposed to moderate and high injection and packing pressures. (a) Product sample No. 71, (b) product sample No. 32.
Applsci 15 05063 g006
Figure 7. Roughness profile for products with low and high roughness measured at center of product. (a) Roughness profile for product sample No. 72 with low roughness of 0.395 µm, (b) roughness profile for product sample No. 38 with high roughness of 0.993 µm.
Applsci 15 05063 g007aApplsci 15 05063 g007b
Figure 8. Roughness profile corresponding to products in Figure 7 but measured 10 mm from injection point. (a) Roughness profile for product sample No. 72 with roughness of 1.044 µm, (b) roughness profile for product sample No. 38 with roughness of 0.280 µm.
Applsci 15 05063 g008
Figure 9. Variation in the volumetric shrinkage plotted for the various process parameters. The color gradient from yellow to blue represents high to low shrinkage values, respectively. (a) Shrinkage versus mold temperature and packing time. (b) Shrinkage versus injection pressure and packing pressure. (c) Shrinkage versus melt temperature and shrinkage versus mold temperature. (d) Shrinkage versus injection speed and cooling time.
Applsci 15 05063 g009
Figure 10. Variation in surface roughness (Ra) for the various process parameters (The color gradient from yellow to blue represents high to low roughness values, respectively): (a) roughness versus mold temperature and packing time; (b) roughness versus injection pressure and packing pressure; (c) roughness versus melt temperature and mold temperature; and (d) roughness versus injection speed and cooling time.
Applsci 15 05063 g010
Figure 11. A plot of the Pareto front obtained from optimization.
Applsci 15 05063 g011
Table 1. A summary of studies on the optimization of injection molding process parameters for various objectives.
Ref.
No.
YearObjectives
to Be
Optimized
Process
Parameters
Description of the Study
[6]2005WarpageCooling time, packing pressure, mold temperature, packing time, and melt temperatureThe researchers investigated effective strategies for optimizing warpage in thin-shell plastic parts by employing a combination of response surface methodology (RSM) and genetic algorithms (GAs). This hybrid approach was used to minimize warpage defects in injection-molded thin-shell plastic components.
[7]2005WarpageDimensional parametersThis study aimed to determine the impact of dimensional parameters on the warpage of thin-shell plastic parts. An integrated approach combining response surface methodology (RSM) and genetic algorithms (GAs) was employed to analyze and optimize the dimensional parameters influencing warpage in injection-molded components.
[8]2005WarpageCooling time, mold temperature, melt temperature, packing pressure, and packing timeThe authors conducted a study focused on optimizing warpage in a bus ceiling lamp base. They employed a neural network model in combination with a genetic algorithm to optimize injection molding process parameters. This integrated approach aimed to minimize warpage, thereby improving the manufacturing process and enhancing the quality and performance of the final product.
[9]2006WarpageMold temperature, melt temperature, packing pressure, packing time, and cooling timeThe authors conducted a comparative study on warpage optimization techniques in plastic injection molding. This research evaluated the effectiveness of three approaches: analysis of variance (ANOVA), neural network modeling, and genetic algorithm (GA) optimization. The primary objective was to optimize warpage by assessing and comparing the performance of these different optimization methods within the injection molding process.
[10]2008WarpageVelocity pressure switch, injection molding velocity, injection time, and packing pressure (used in an illustrative example)The optimal process parameters for minimizing warpage were determined using a hybrid approach that combined the Taguchi method, regression analysis, and the Davidon–Fletcher–Powell (DFP) optimization technique. Initially, the Taguchi method was employed to estimate the preliminary process parameters. Subsequently, regression analysis was used to develop a surrogate model that relates the process parameters to warpage. Finally, the DFP method was applied to optimize the process parameters based on the developed model.
[11]2008WarpageMold temperature, melt temperature, injection time, and packing pressureThe authors developed an effective warpage optimization method for injection molding based on the Kriging model. The proposed method was implemented on a cellular phone.
[12]2009ShrinkageMelt temperature, mold temperature, packing pressure, and injection velocityThe aim of this research was to minimize the shrinkage of thin-shell injection-molded products through the optimization of the process parameters. The response surface methodology was used to develop a relationship between the parameters and shrinkage, which was then optimized to identify the optimal process parameters.
[13]2009WarpageMold temperature, melt temperature, injection time, packing time, and packing pressureProcess parameter optimization for achieving the minimum warpage was conducted. The Kriging surrogate approach was used in combination with design of experiments to create a relationship between process parameters and warpage. An adaptive optimization procedure was then used to optimize the process parameters. The developed procedure was applied in the development of a cellular phone cover.
[14]2010ShrinkagePacking time, injection pressure, melt temperature, and packing pressureThis work focused on reducing shrinkage in injection moldings using a combination of the Taguchi method, an analysis of variance (ANOVA), and neural network methods. The researchers aimed to optimize injection molding process parameters to minimize shrinkage in the final molded products. The Taguchi method helped design efficient experiments, the ANOVA provided insights into the significance of different parameters, and neural network methods facilitated predictive modeling for shrinkage reduction.
[15]2011Warpage and shrinkageMold temperature, melt temperature, holding pressure, packing time, pressure switch-over, and coolant inlet temperatureThe authors optimized these process parameters to minimize warpage and shrinkage defects using a sequential simplex algorithm.
[16]2011WarpageCooling time, mold temperature, packing time, packing pressure, and melt temperatureThe multi-objective optimization of process parameters was carried out to achieve optimal warpage and clamping force. The suggested optimization approach uses both a backpropagation neural network technique and a genetic algorithm.
[17]2011WarpageMold temperature, melt temperature, packing pressure, packing time, and cooling timeThis research involved using backpropagation neural network (BPNN) modeling for warpage prediction and the optimization of plastic products during injection molding. By integrating neural network techniques with optimization methods, this study aimed to improve product quality, reduce defects, and enhance manufacturing efficiency in plastic injection molding processes.
[18]2015Sink marks, shrinkage, and warpageInjection time, melt temperature, packing time, packing pressure, cooling temperature, and cooling timeThis study involved the development of a framework for minimizing product defects though a two-stage optimization approach. In the first stage, an improved efficient global optimization algorithm was used to establish the relationship between the defect and the process parameters. In the second stage, a non-dominated sorting genetic algorithm was used to conduct multi-objective optimization.
[19]2015WarpageMolt temperature, melt temperature, injection velocity, compression distance, compression force, compression velocity, and compression waiting timeIn this study, a neural network and particle swarm optimization were used to optimize injection process parameters to improve mechanical performance, as it is affected by warpage.
[20]2017Strength, warpage, and shrinkageMold temperature, holding pressure, cooling time, holding time, melt temperature, injection pressure, and melt temperatureThe effects of process parameters on the strength, warpage, and shrinkage of injection molding products were investigated. The mold temperature and holding pressure had the greatest effects on warpage and shrinkage.
[21]2017WarpageCooling temperature, packing time, injection time, packing pressure, cooling time, and melt temperatureThe authors studied cooling performance for conformal cooling channels in the injection molding process by considering warpage and cycle time. This study was conducted both numerically and experimentally. Due to the high cost of simulating the injection molding process, sequential approximate optimization based on a radial basis network approach was used to generate a Pareto front. It is reported in this study that the conformal cooling channels perform better than conventional cooling channels.
[22]2018Warpage and cycle timePacking time, packing pressure, injection pressure, and melt temperatureThe authors determined the optimal warpage and cycle time through multi-response optimization. This study utilized optimization techniques and experimental design methodologies to identify the optimal combination of process parameters that would lead to improved efficiency and reduced defects in injection-molded components.
[23]2021Shrinkage and warpagePacking time, mold temperature, packing pressure, melt temperature, and cooling temperatureThis study concentrated on the simulation process of injection molding and optimization for automobile instrument parameters in embedded systems.
[24]2021WarpageCooling time, packing pressure, melt temperature, and coolant temperatureThis study involved the warpage optimization of molded parts with straight-drilled and conformal cooling channels. This research utilized multiple optimization approaches including response surface methodology (RSM), Glowworm Swarm Optimization (GSO), and genetic algorithms (GAs). The researchers aimed to optimize the warpage of molded parts by comparing the effectiveness of different cooling channel designs, specifically straight-drilled channels versus conformal cooling channels.
[25]2022Warpage and cycle timeMelt temperature, packing pressure, cooling time, packing time, injection time, and cooling temperatureKitayama et al. conducted a study on the numerical optimization of multistage packing pressure profiles in plastic injection molding and validated their findings through experimentation. The researchers aimed to optimize the packing pressure profile during plastic injection molding. Packing pressure is a critical parameter that influences the final properties and dimensions of molded parts. The authors reported that the proposed procedure can reduce warpage and cycle time, as well as the clamping force.
[26]2023WarpageMelt temperature, mold temperature, injection pressure, holding time, and cooling timeThe authors aimed to minimize the warpage of polyethylene terephthalate by performing process parameter optimization through experimental, statistical, and numerical approaches. Through the presented approaches, the authors reported a reduction in warpage of approximately 7.7%.
Table 2. List of material properties of HDPE M80064 Series [36].
Material Property UnitsMagnitude
Flow Rate of the Melt (conducted at 2160 g and 190 °C)g/10 min8
Densityg/mm3 9.64 × 10 4
Vicat Softening Temp. (performed at 10.0 N)°C/°F128/262
Stress at Breaking Stress PointPa 15 × 10 6
Stress at YieldPa 33 × 10 6
Table 3. The lower and upper limits of the concerned process parameters.
Injection Molding ParametersSymbolLower BoundUpper BoundUnits
Injection pressure I P 450800bar
Packing pressure P P 100400bar
Packing time P t 39s
Cooling time C t 1030s
Injection speed I S 1560mm/s
Melt temperature M T 200250°C
Mold temperature M o T 1545°C
Table 4. Volumetric shrinkage and surface roughness from the injection molding experiments.
Injection Pressure
(Bar)
Ip
Measured Injection Pressure
(Bar)
Ip
Packing Pressure
(Bar)
Pp
Packing Time
(s)
Pt
Cooling Time
(s)
Ct
Injection Speed
(mm/s)
Is
Melt Temp.
(°C)
MT
Mold Temp.
(°C)
MOT
Volumetric Shrinkage
(mm3)
W
Surface Roughness
(µm) Ra
Center of Sample10 mm from Injection Point
145045710091015200153.970.7910.162
245045710033015200155.170.8711.932
345045740031015200154.590.6240.193
445045740093015200152.450.8230.149
580046210031015200155.260.6910.257
680046110093015200153.950.7290.304
780046040091015200152.550.7430.173
880046140033015200154.490.7561.986
945045210031060200155.380.7880.81
10450452100930602001540.7761.869
1145045240091060200152.630.6220.796
1245045240033060200154.620.6614.619
1380078510091060200154.340.5880.425
1480078310033060200155.210.610.619
1580079140031060200154.10.6320.544
1680078740093060200151.970.6291.346
1745044710031015200455.330.6980.65
1845044510093015200454.050.5940.508
1945045040091015200453.240.6530.445
2045044740033015200455.090.6330.788
2180044510091015200454.10.7880.481
2280044610033015200455.550.81.656
2380044440031015200455.170.8150.351
2480044640093015200453.150.6470.283
2545045310091060200454.190.5860.368
2645045210033060200455.680.6345.675
2745045340031060200455.310.6410.404
2845045340093060200453.250.6570.313
2980078310031060200455.530.6960.432
3080077910093060200454.140.7070.701
3180078140091060200452.280.7710.503
3280078040033060200454.270.830.504
3345034310031015250155.920.8610.418
3445034210093015250153.850.8880.263
3545034340091015250153.120.8160.59
3645034440033015250155.350.8720.179
3780034510091015250153.950.9150.297
3880034510033015250155.850.9930.28
3980034840031015250155.480.8011.243
4080034940093015250153.020.7960.44
4145045110091060250154.150.4480.559
4245045110033060250156.060.5140.553
4345045240031060250155.830.4930.425
4445045240093060250153.20.4470.465
4580063910031060250156.160.5910.389
4680063910093060250154.070.4340.526
4780063940091060250153.290.4140.468
4880064240033060250155.480.4324.228
4945033310091015250454.540.4690.294
5045033410033015250456.210.640.3
5145033540031015250455.950.486.331
5245033840093015250453.840.5190.8
5380033610031015250456.250.580.769
5480033810093015250454.430.5720.321
5580033840091015250453.940.4542.779
5680033740033015250455.870.6530.962
5745045110031060250456.490.5635.59
5845045210093060250454.630.4270.916
5945045240091060250454.130.4080.734
6045045240033060250456.110.70.473
6162562525062037.5200304.20.5370.744
6262551125062037.5250304.840.4280.323
6362562525062037.5225154.260.4621.747
6462562525062037.5225454.870.4220.442
6562539525062015225304.310.630.163
6662562825062060225304.510.5430.27
6745045225062037.5225304.440.4571.405
6880058025062037.5225304.450.4210.573
6962562510062037.5225304.970.420.49
7062562540062037.5225304.270.4810.587
7162562525061037.5225304.610.4391.044
7262562525063037.5225304.50.3950.371
7362562525032037.5225305.610.4350.786
7462562525092037.5225303.630.4440.386
7562562525062037.5225304.540.4550.823
Table 5. The effects of the injection molding process parameters on the volumetric shrinkage of the product.
Injection Molding ParametersObserved Effects of Increasing the Process Parameter Value on Volumetric ShrinkageFigureReference
Injection pressure Decreases Volumetric shrinkageFigure 9b[55]
Packing pressureDecreases Volumetric shrinkageFigure 9b[18,55,56]
Packing timeDecreases Volumetric shrinkageFigure 9a[18,56,57]
Cooling timeDecreases Volumetric shrinkageFigure 9d[18,58]
Injection speedIncreases Volumetric shrinkageFigure 9d-
Melt temperatureIncreases Volumetric shrinkageFigure 9c[18,55]
Mold temperatureIncreases Volumetric shrinkageFigure 9a,c[55,57]
Table 6. The effects of the injection molding process parameters on product roughness.
Injection Molding ParametersObserved Effects of Increasing the Process Parameter Value on RoughnessFigurePreviously Reported
Injection pressure Decreased roughnessFigure 10b[34]
Packing pressureDecreased roughness
(for low injection pressures)
Figure 10b[29]
Packing timeDecreased roughnessFigure 10a-
Cooling timeMinimal effectFigure 10d-
Injection speedRoughness dips as injection speed increases and then increases again for higher speedsFigure 10d-
Melt temperatureDecreased roughnessFigure 10c[29,34]
Mold temperatureDecreased roughnessFigure 10a[29,59].
Table 7. The main distinguished points on the Pareto front.
PointsVolumetric Shrinking
(mm3)
Surface Roughness
Ra
(µm)
Measured Injection Pressure
(bar)
Packing Pressure
(bar)
Packing Time
(s)
Cooling Time
(s)
Injection Speed
(mm/s)
Melt Temp.
(°C)
Mold Temp.
(°C)
P11.93140.559562001556.531800400309
P22.23480.282462501545.844800400309
P33.92860.2055725031.06235.984800127.03309
Disclaimer/Publisher’s Note: The statements, opinions and data contained in all publications are solely those of the individual author(s) and contributor(s) and not of MDPI and/or the editor(s). MDPI and/or the editor(s) disclaim responsibility for any injury to people or property resulting from any ideas, methods, instructions or products referred to in the content.

