Article

Optimization Design of Centrifugal Fan Blades Based on Bézier Curve Method

1
College of Vehicle and Traffic Engineering, Henan University of Science and Technology, Luoyang 471000, China
2
Zhejiang Yilida Ventilator Co., Ltd., Taizhou 318056, China
*
Authors to whom correspondence should be addressed.
Appl. Sci. 2025, 15(9), 5052; https://doi.org/10.3390/app15095052
Submission received: 10 March 2025 / Revised: 23 April 2025 / Accepted: 28 April 2025 / Published: 1 May 2025

Abstract

:
In order to improve the aerodynamic performance of the voluteless centrifugal fan, a multi-objective optimization design system was established by combining parametric modeling, experimental design, surrogate models, and optimization algorithms, with the static pressure and static pressure efficiency of the fan as the optimization objectives. The design parameters of the blade profile were obtained by fitting the blade profile with a Bézier curve. A mapping relationship between design parameters and optimization objectives was established by combining numerical simulation with a radial basis function neural network, and a genetic algorithm was used to optimize the blade profile. The results indicated a highly significant correlation between design parameters and optimization objectives, with a prediction error of no more than 1% for the surrogate model. The determination coefficients for static pressure and static pressure efficiency were 0.98 and 0.96, respectively. After optimization, the static pressure of the fan increased by 12.7 Pa at the design operating point, and the static pressure efficiency increased by 3.2%. The separation vortex decreased near the trailing edge of the blade suction surface, and the airflow impact at the leading edge of the blade decreased. The entropy production in the flow channel decreased, and the overall flow state of the fluid was improved.

1. Introduction

Centrifugal fans, as an important type of fluid machine, are widely used in fields such as ventilation, air conditioning, and industrial production. Their performance directly affects the efficiency and operational stability of the entire system. There are complex flow states such as secondary vortices, jets, and leakage flows inside the centrifugal fan, which may cause insufficient capacity to perform functions, low efficiency, surge, whistling, and other phenomena. Blades are the core components of centrifugal fans. The design and optimization of blades is of great significance for improving fan efficiency and reducing energy consumption.
In recent years, many scholars have carried out significant research into blade design optimization. Wu et al. [1] optimized the blade shape by controlling the velocity distribution, effectively reducing flow separation on the suction surface of the blade and the non-uniform jet–wake structures at the impeller outlet. Ye et al. [2] applied a skewing treatment to the blades, improving the non-uniformity of the inlet airflow and reducing both the impact losses and resistance losses at the blade inlet. Research by Ni et al. [3] indicated that there exists an optimal blade tilt angle at which fan performance is maximized. Based on Kulfan’s research [4], Zhu et al. [5] combined the class–shape transformation (CST) function with an orthogonal experimental design to optimize the blades, which resulted in a reduced circumferential velocity difference at the impeller outlet, more uniform outlet airflow, and an increased pressure difference between the suction and pressure surfaces of the blade—indicating enhanced work performance. Zhou et al. [6] employed the Hicks–Henne function to parameterize the blade profile, thereby increasing total pressure and efficiency while reducing low-frequency noise. Wei et al.’s [7] research showed that increasing the blade size can enlarge the working area of the blade, thereby improving fan pressure and efficiency. Lee et al. [8] designed a three-dimensional curved blade that reduced flow separation at the blade leading edge and minimized friction losses, resulting in a 6.3% increase in static pressure efficiency. Lei et al. [9] addressed the issue of non-uniform axial flow distribution in centrifugal fans by proposing the use of fourth-order Bézier curves to control the chord length at different blade heights. The results indicated that variable-chord blades enhanced the fan’s flow capacity, yielding a more uniform axial flow distribution and improved work performance. Ferrari et al. [10] increased fan efficiency by 10% while reducing average sound pressure level by 13 dB within a limited utilization space. Shao et al. [11] integrated the airfoil into the blade’s curved section and implemented an improved design, which increased the fan’s efficiency under rated conditions, enhanced the uniformity of the impeller outlet airflow, and suppressed the jet–wake phenomenon. Li et al. [12] optimized the blade airfoil using the CST function in combination with a Kriging surrogate model and a non-dominated genetic algorithm, thereby improving the fan’s pressure coefficient and broadening its effective operating range. Zhang et al. [13] performed design optimization for three different blade configurations of voluteless centrifugal fans based on the steepest descent method, which enhanced both the total pressure and total pressure efficiency under high-flow conditions, demonstrating the versatility of the method. Kim et al. [14] proposed several stepped leading edge designs for blades with serrated edges that decomposed large vortices into smaller ones and limited the downstream movement of axial vortex structures, thereby reducing the fan’s startup noise, albeit with a corresponding decrease in efficiency. Sercan Acarer et al. [15] defined the blade shape and tip speed ratio using 17 control parameters, and their results indicated that the blade inlet installation angle and installation position were the primary parameters affecting overall fan performance. Ferrari et al. [16] achieved rapid optimization of two-stage centrifugal fans through an optimization design method that combined one-dimensional and three-dimensional models.
Owing to its advantages of fewer control parameters, flexible curvature adjustment, and high-order continuity, the Bézier curve method has been widely applied in the field of rotating machinery. Rengma et al. [17] proposed a blade shape generation method based on a six-control-point Bézier curve for Savonius hydraulic turbines, which yielded better performance compared to traditional semi-circular blades or blades generated using the Taguchi method. Wang et al. [18] proposed a parameterization technique based on a global mapping model of Bézier surfaces and integrated this technique with a multi-objective evolutionary algorithm to achieve both global and local optimization of centrifugal compressor blades. Ma et al. [19] used the Bézier curve method to select 10 key structural parameters of the blade for design optimization, resulting in a 7.74% improvement in pump efficiency under design conditions.
As can be seen from the above, although the Bézier curve method has been well developed and has demonstrated significant application value in rotating machinery, related research in the field of voluteless centrifugal fans remains insufficient. In this paper, based on parametric modeling, a fourth-order Bézier curve method was used to fit the blade profile, obtaining seven control variables as optimization parameters, with fan static pressure and static pressure efficiency serving as the optimization objectives. The multi-objective optimization design of the voluteless centrifugal fan was achieved by integrating a radial basis function neural network (RBFNN) surrogate model with a multi-objective genetic algorithm (MOGA). By adjusting multiple parameters, the influence of blade geometry on the complex internal flow phenomena within the impeller was elucidated, providing a reference for the broader application of the Bézier curve method in rotating machinery. Our research also provides a new method for optimizing voluteless centrifugal fans.

2. The Experiment and Numerical Methodology of the Fan

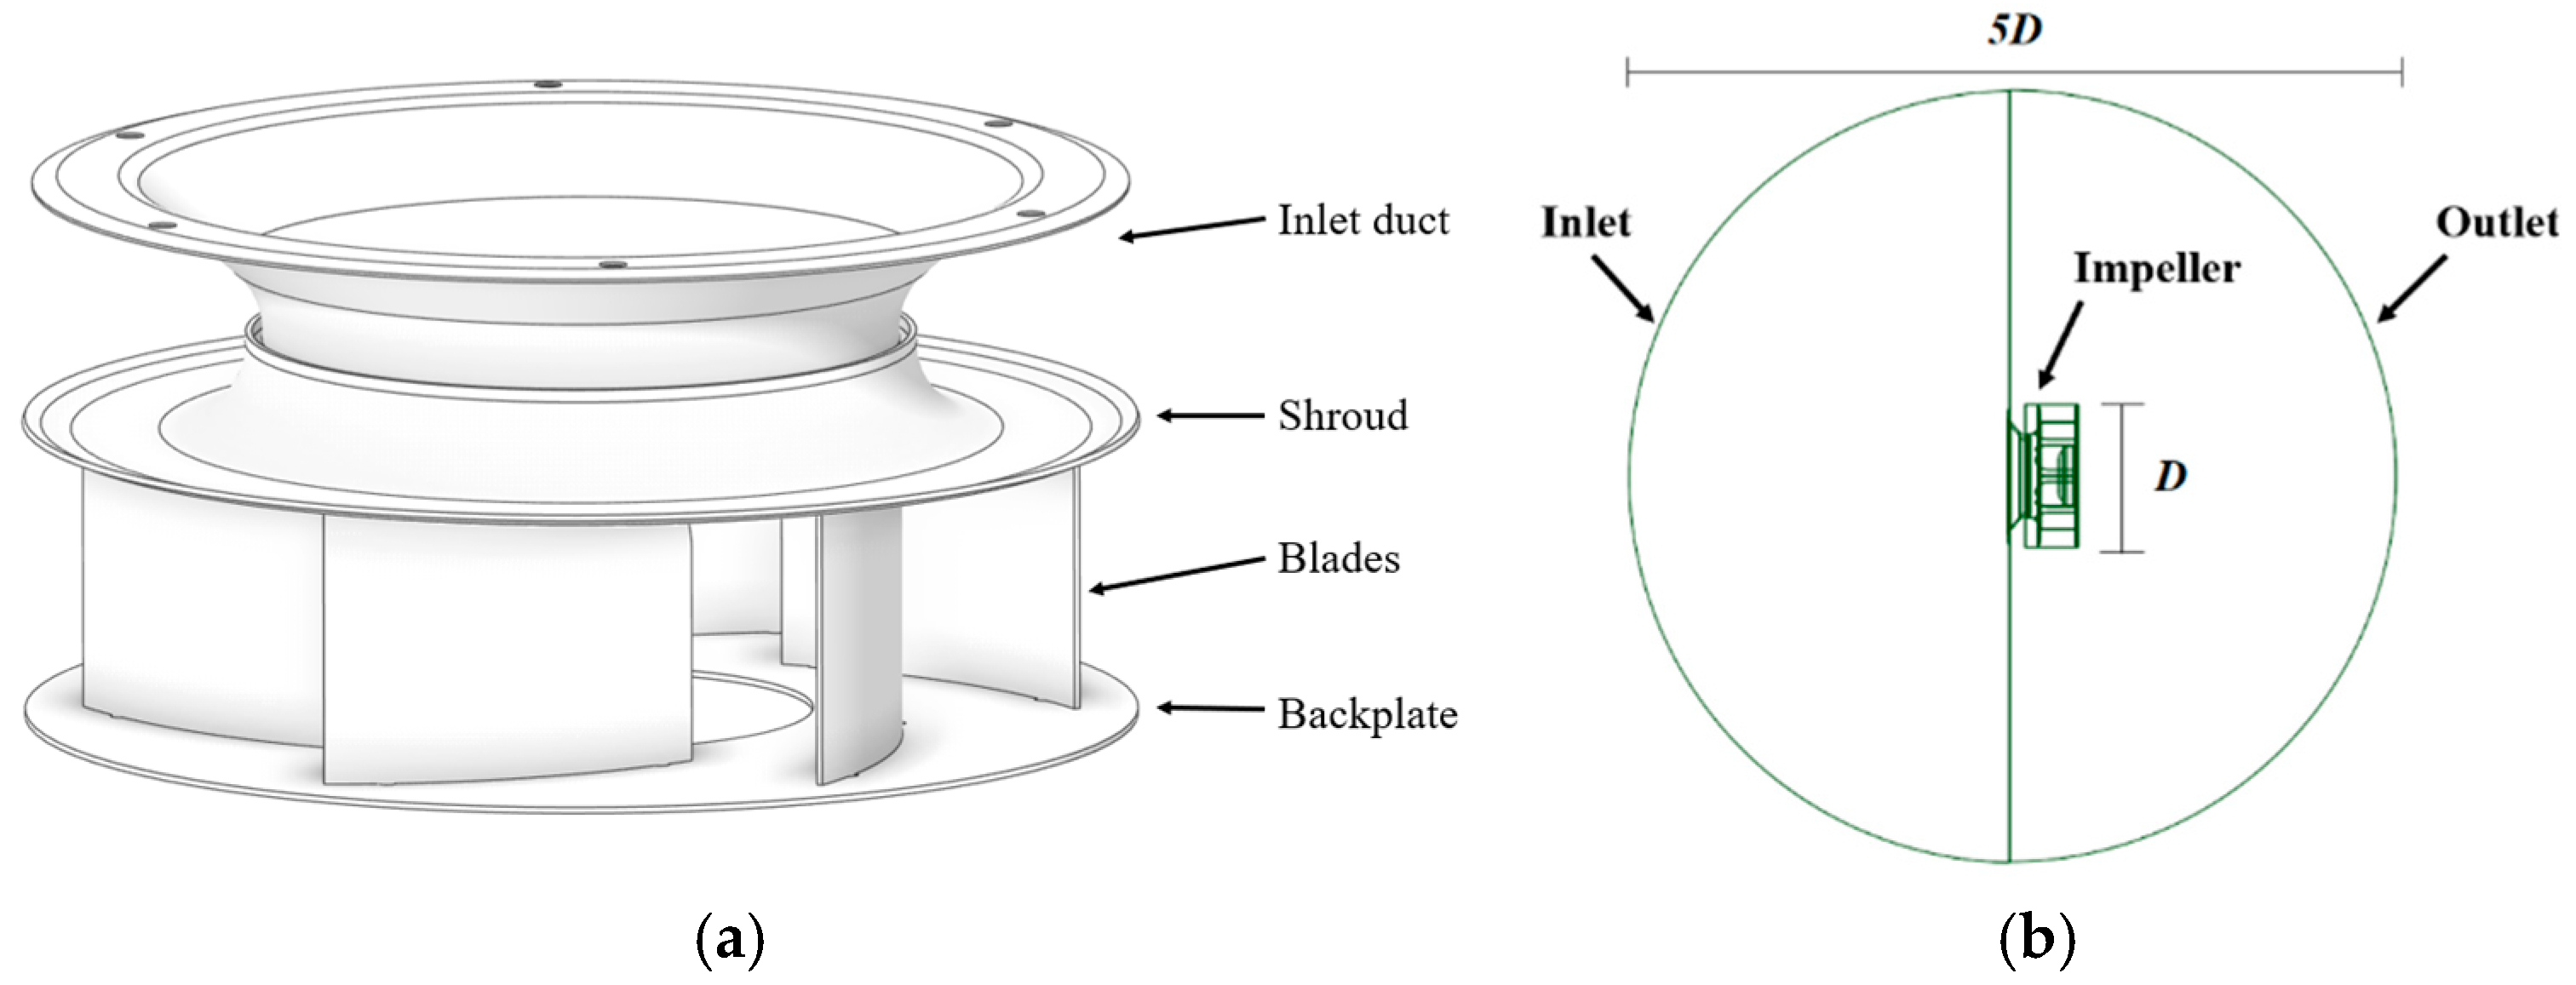
2.1. The Model of the Voluteless Centrifugal Fan

A three-dimensional model of our voluteless centrifugal fan is shown in Figure 1a. The main components were the inlet duct and the impeller. The impeller consisted of a shroud, backplate, and blades. The operating conditions and design parameters are shown in Table 1. In order to fully develop the fluid in the calculation domain and better fit the actual testing situation, a spherical inlet and outlet domain was used, and the diameter of the inlet and outlet domain was five times the impeller diameter, as shown in Figure 1b.

2.2. Boundary Condition and Mesh Validation

The internal flow within a voluteless centrifugal fan is approximately adiabatic during operation. Therefore, it can be simplified as a viscous incompressible flow. In this study the commercial software ANSYS Fluent 2023R1 was used to study the three-dimensional voluteless centrifugal fan. The turbulence model used was the realizable k-ε model. The enhanced wall treatment was applied for near wall treatment. This treatment is suitable for both coarse meshes as well as fine meshes. Other solid wall boundary conditions were set as viscous, no-slip, adiabatic solid walls. The SIMPLE algorithm was applied for the pressure–velocity coupling, and the second-order upwind scheme was applied for the momentum equation, energy equation, and turbulence dissipation equation. A mass flow rate of 0.964 kg·s−1 was given for the inlet, and the gauge pressure of outlet boundary condition was set to 0 Pa. During the calculation, a multi-reference frame model was used, with the impeller domain set as the rotating domain and the inlet and outlet domain as the stationary domains and the rotational speed was set to 3100 r·min−1. The interface between the dynamic and static interfaces was used to transmit data. According to the mesh quantity and accuracy requirements, the convergence residual was set to 10−5, and the inlet and outlet static pressure difference and impeller torque were monitored. When the convergence residual met the design requirements or the monitoring value remained basically unchanged, it was considered that the calculation has converged.
The meshes of the impeller surface, middle section, and boundary layers are given in Figure 2a. Five layers of boundary, with the height of the first layer of 0.03 mm, were used to capture the complex flow-field information near the impeller. And the y+ of the impeller meshes was close to 2, as shown in Figure 2b.
Static pressure is a fundamental parameter for the operation of a voluteless centrifugal fan, so the static pressure at the maximum efficiency condition was selected as the evaluation index for mesh independence verification. Considering the computational resources and time costs, the mesh size settings corresponding to the 9.77 million mesh model was selected for the numerical calculation after mesh independence verification, as shown in Figure 3.

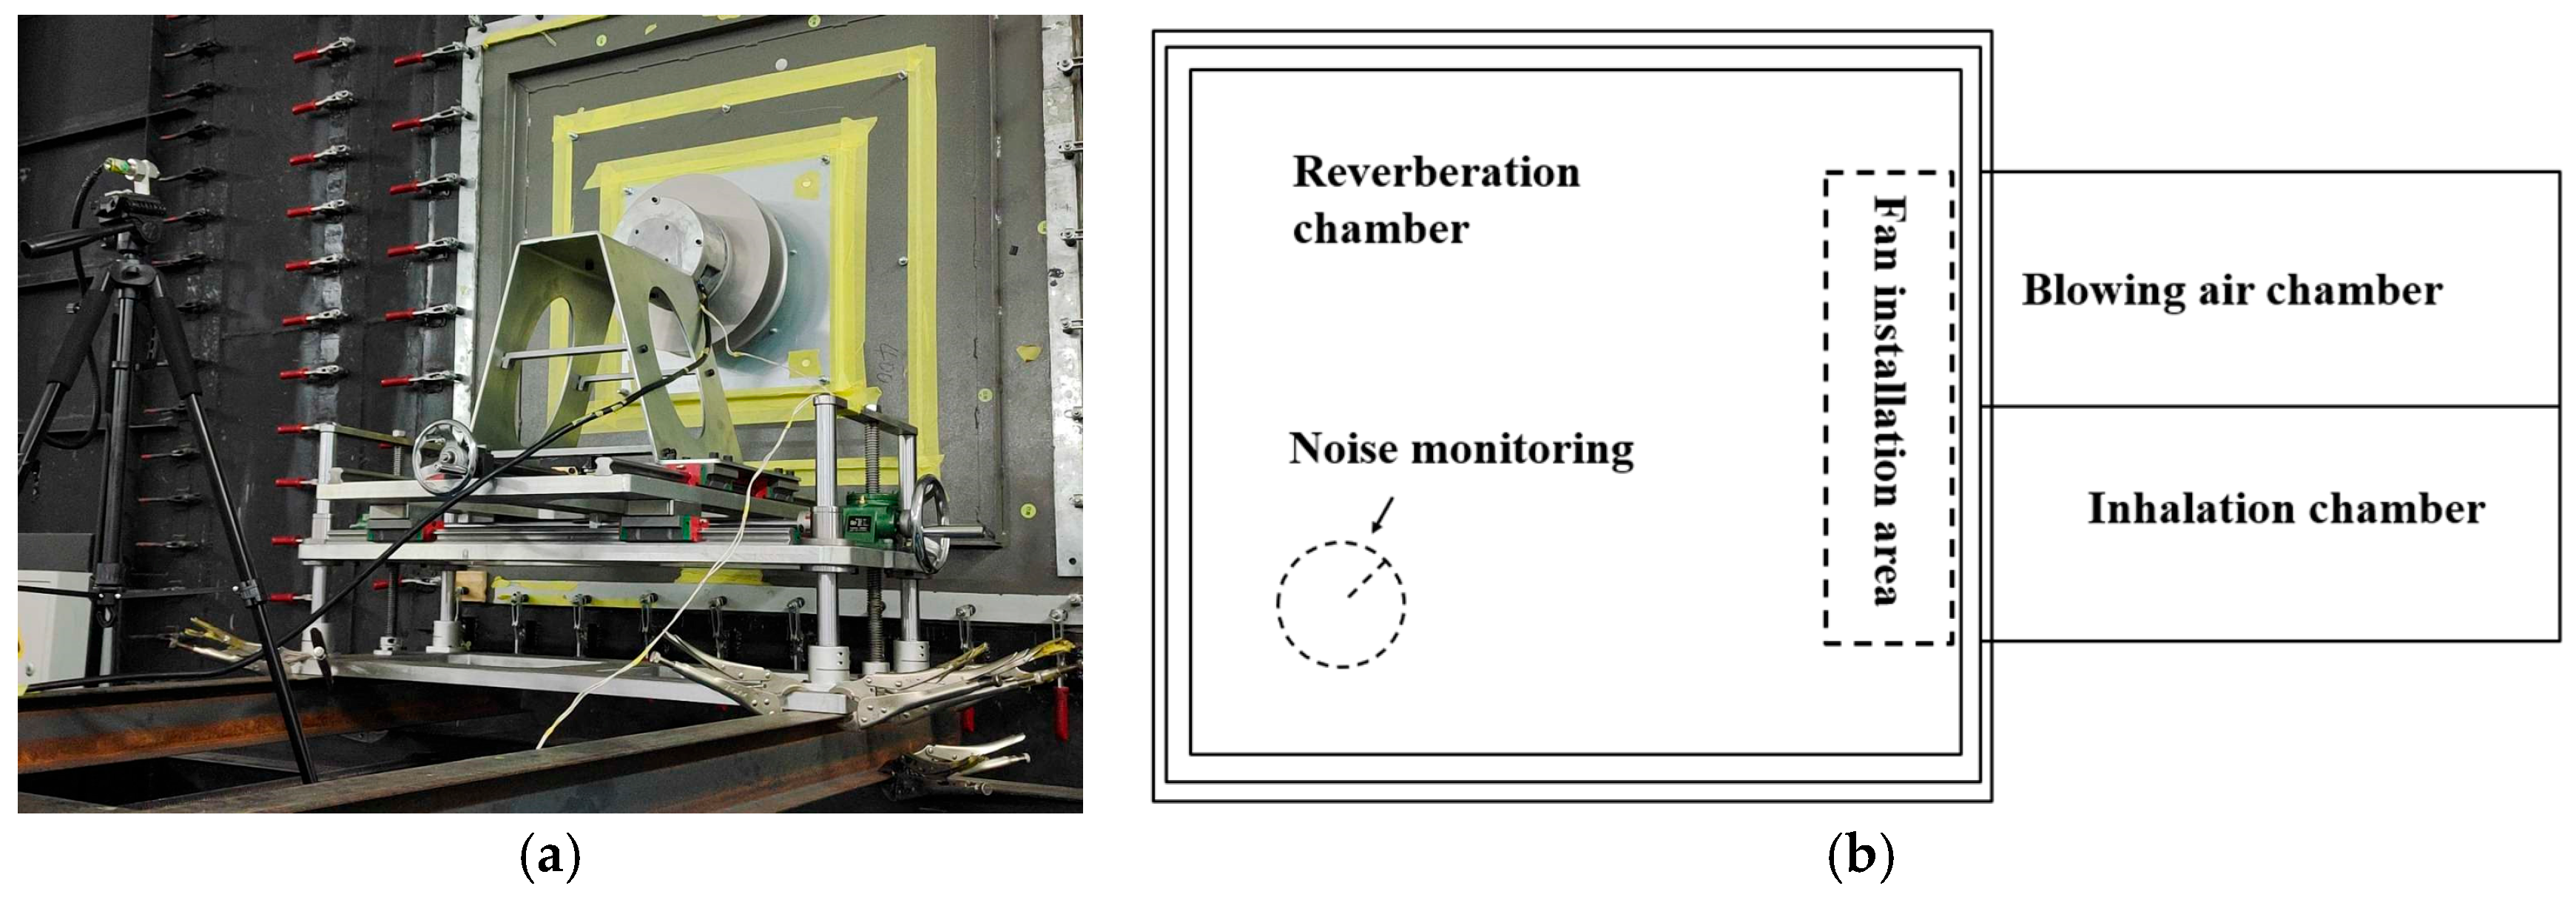
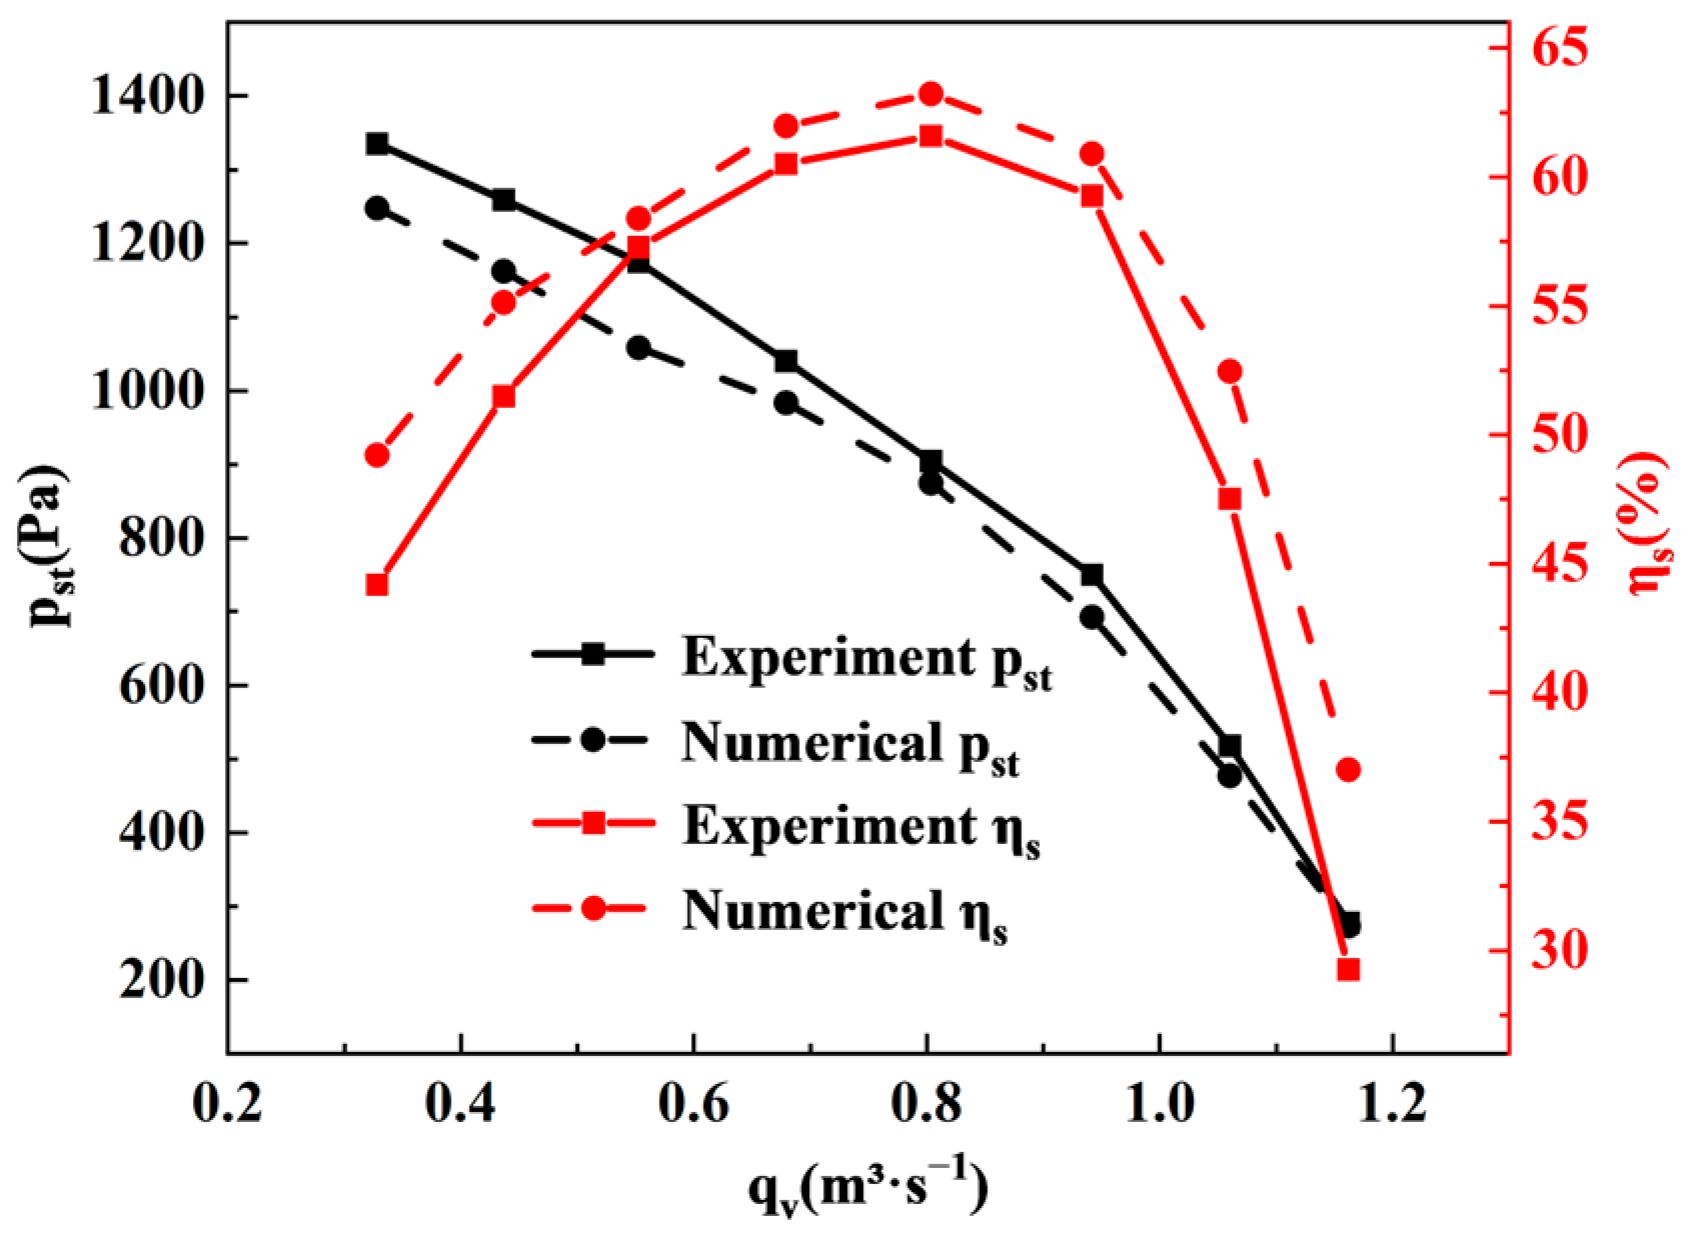
2.3. External Characteristic Performance Experiment and Numerical Validation

The experimental test of the fan was carried out at Zhejiang Yilida Ventilator Co., Ltd., in Taizhou, China, as shown in Figure 4. During experimental test, the fan was installed on the mounting wall between the blowing-air chamber and the inhalation chamber, so the airflow could form a closed chamber circuit through the cavity between the wind chambers. The control console and instrument cabinet can perform experimental control and data acquisition on devices such as microphones, pitot tubes, nozzles, and torque meters in the laboratory.
The static pressure pst and impeller static pressure efficiency ηs, which represent the external performance characteristics of the fan, can be calculated by
p s t = p o u t p i n
η s = p s t × q v T m × 2 π × N
where pin and pout are the static pressure values at the inlet and outlet of the fan, Pa; qv is the volumetric flow rate during fan operation, m3∙s−1; Tm is the torque of fan, N∙m; and N is the rotational speed, r∙min−1.
Due to the simplified treatment of the fan’s 3D model and the influence of environmental factors during experimental measurements, discrepancies may have arisen between the numerical simulation results and the experimental results. However, the overall trends were consistent. Figure 5 shows the validation results. At the design operating condition, the relative static pressure error was 3.5%, and the maximum static pressure error did not exceed 10%. Under low flow conditions, the instability of the internal flow within the fan resulted in a larger static pressure error. As the flow rate increased, flow stability was enhanced, and the static pressure error gradually decreased. Overall, the numerical calculation results accurately reflected the fan’s external performance characteristics, indicating that the simulation model was reliable and could be used for subsequent optimization design.

3. Multi-Objective Optimization Task

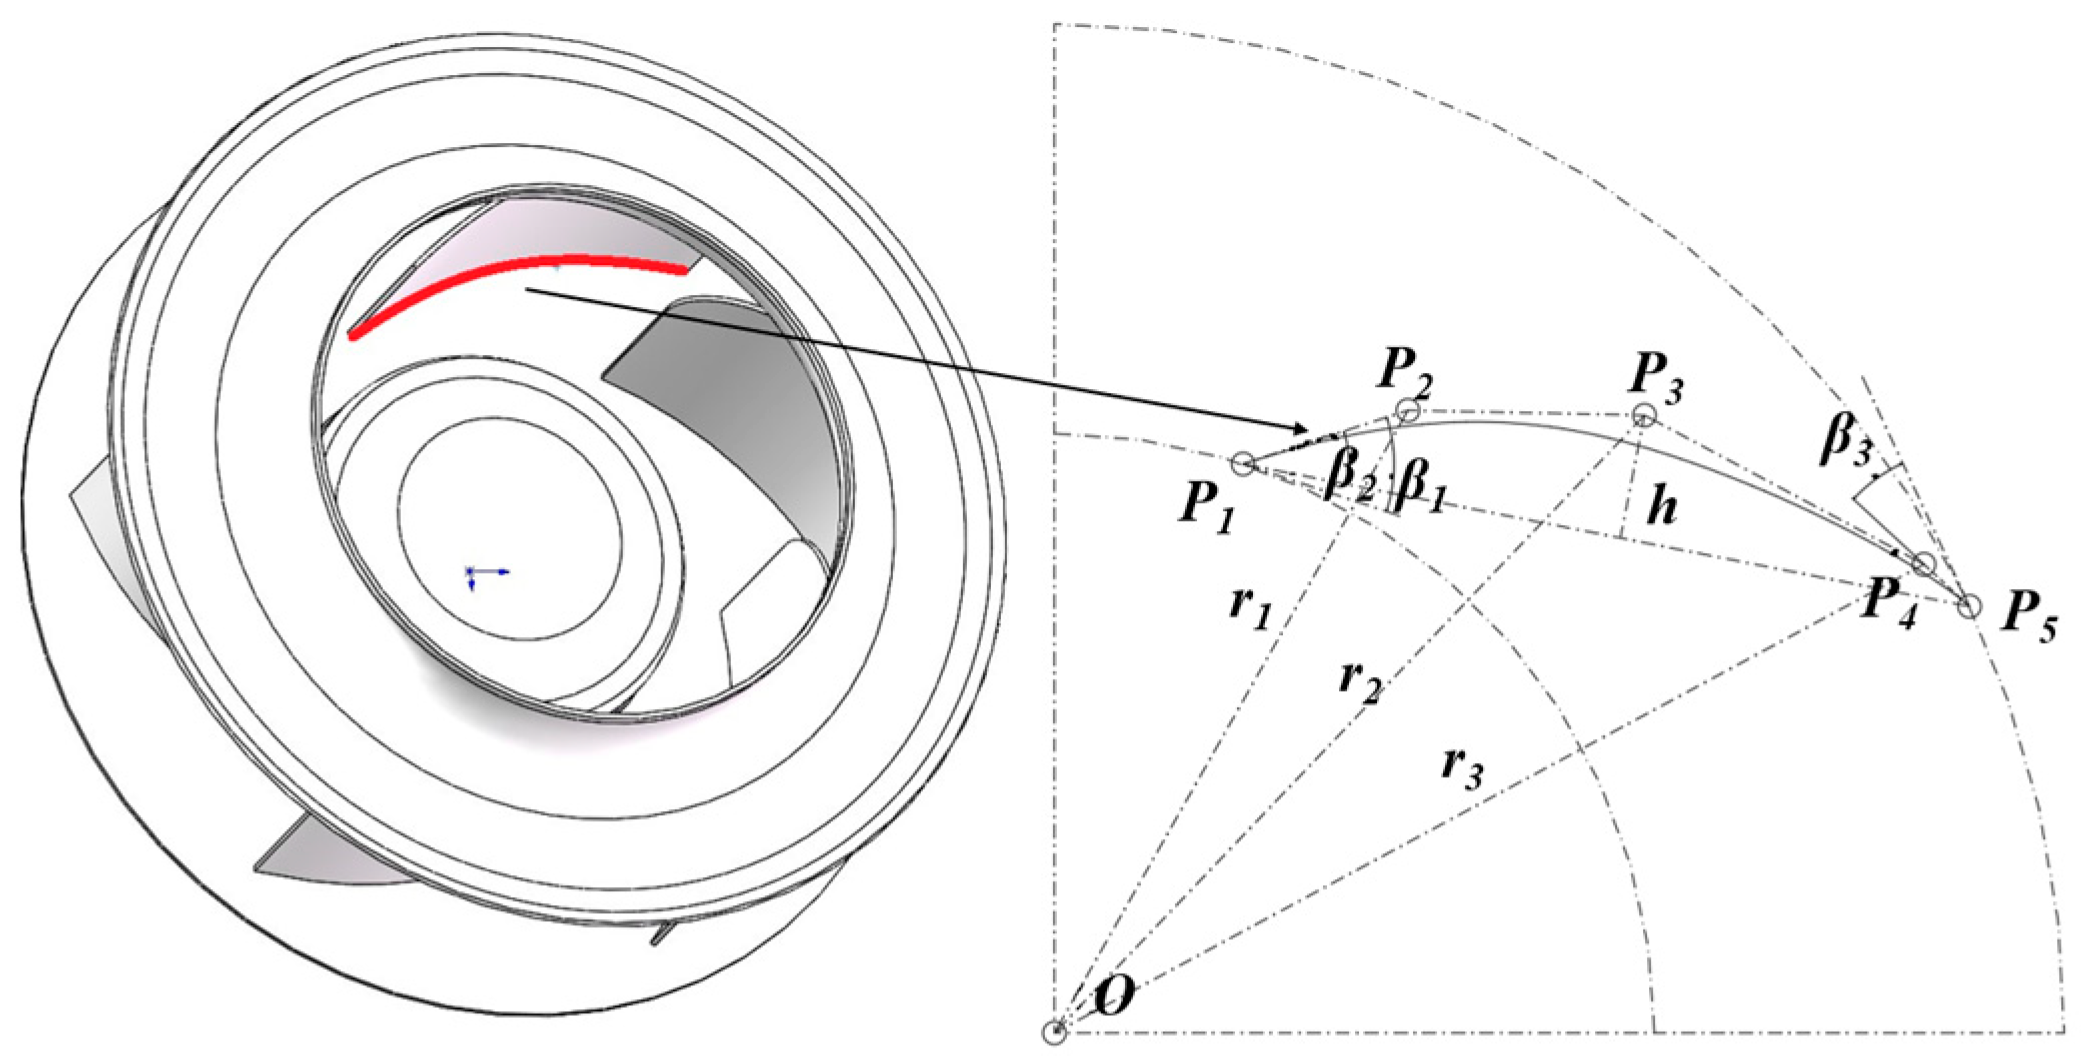
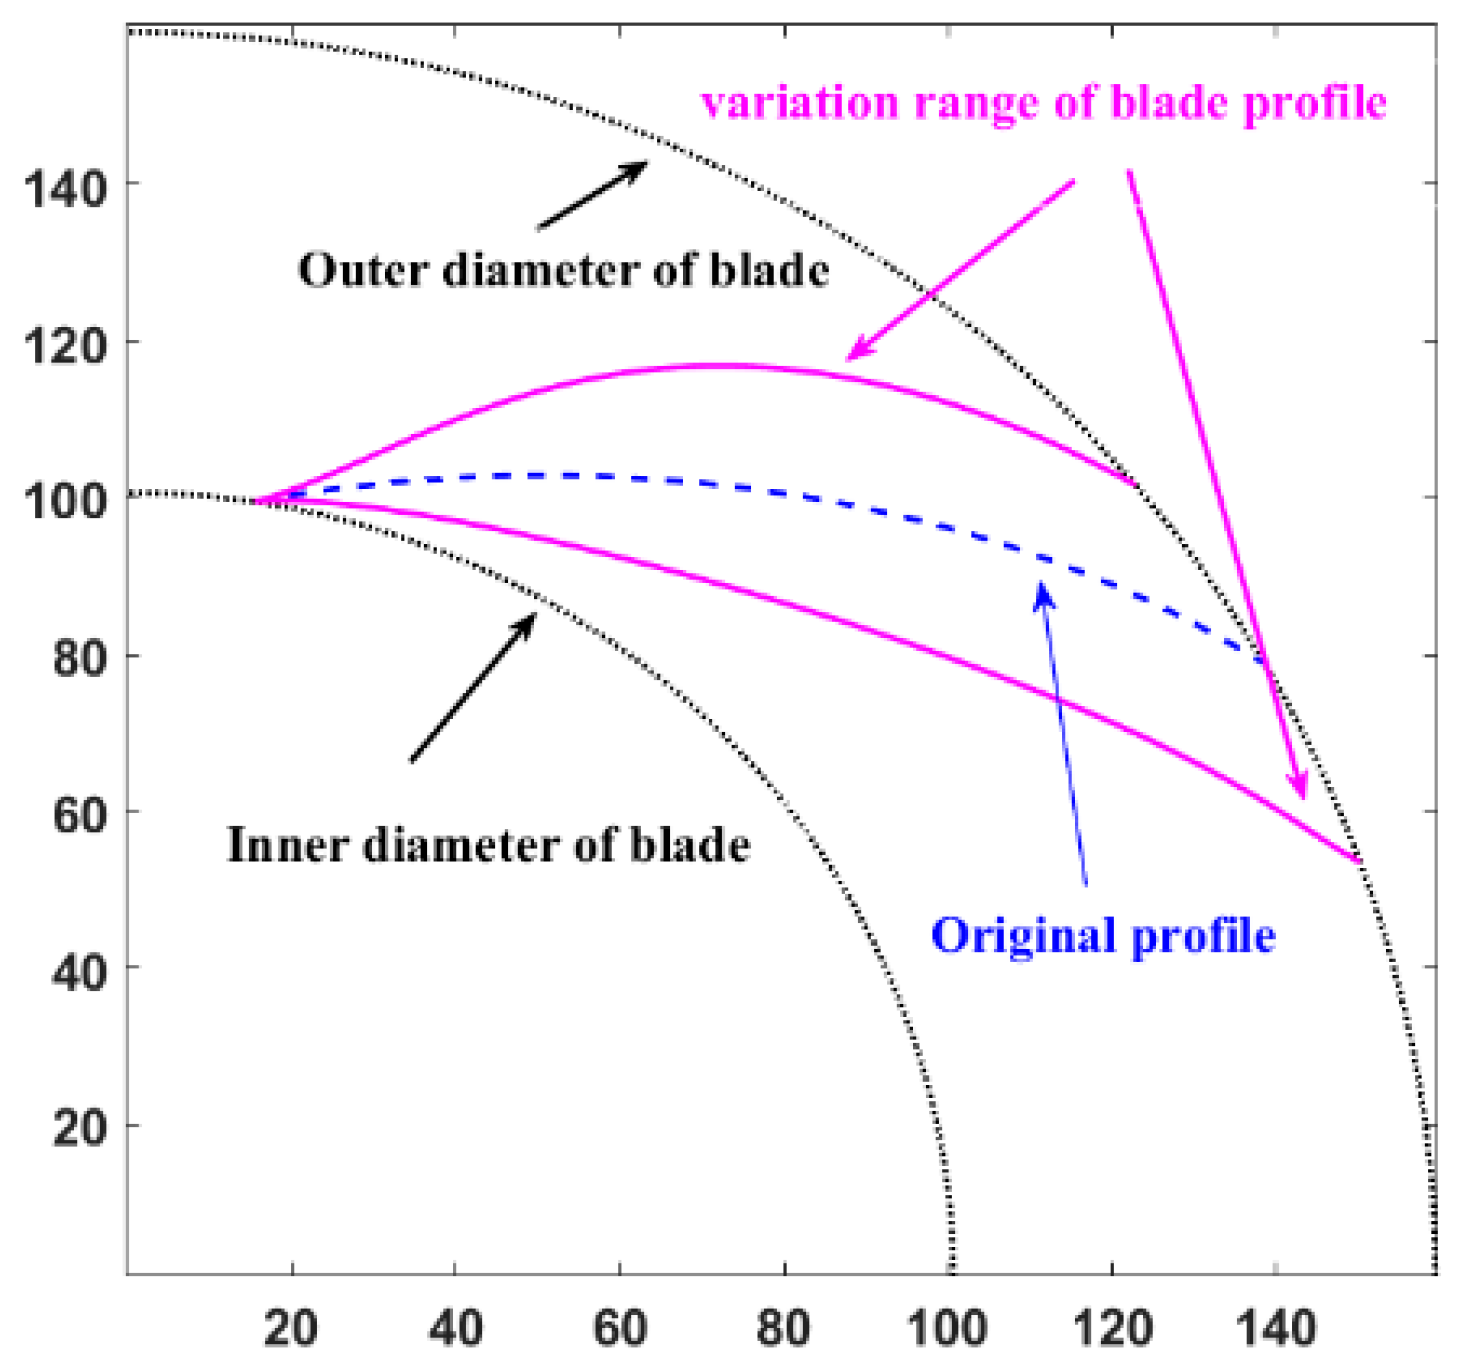
3.1. Blade Profile Parameter Design with Bézier Curve Method

In this study, the voluteless centrifugal fan had arc-shaped, equal-thickness blades with the same profiles on both the pressure and suction surfaces. A fourth-order Bézier curve was used to fit the blade profile, and the coordinates of five Bézier curve control points were obtained. By changing the coordinates or the relative positions of these control points, the Bézier curve could be controlled, to change the shape of the blade.
The Bézier curve is a vector-drawing method that uses n control points to determine the shape of the curve. The curve passes through the initial point A0 and the final point An, while it only approximates the intermediate points A2 through An−1 without actually passing through them. The expression for the fourth-order Bézier curve is
B ( t ) = i = 0 4 A i B 4 , i ( t ) , t [ 0 , 1 ]
B 4 , i ( t ) = 4 i t i ( 1 t ) 4 i , i = 0 , 1 , 2 , 3 , 4
The core idea of blade profile-fitting is to use the known curve points to deduce the control points of the Bézier curve. Suppose there are m discrete planar points Qm on the target curve corresponding to parameters tm, and these discrete points are assumed to lie on the Bézier curve. That is, they satisfy
Q m = i = 0 4 A i B 4 , i ( t m ) , t [ 0 , 1 ]
A matrix B is constructed for given parameters t0~tm, where each row represents the computed Bézier basis functions for a specific parameter ti. The basis functions for a fourth-order Bézier curve are as follows:
B i ( t ) = 1 t 4 4 1 t 3 t 6 1 t 2 t 2 4 1 t t 3 t 4
The Bessel function matrix B is constructed as follows:
B = ( 1 t 0 ) 4 4 ( 1 t 0 ) 3 t 0 6 ( 1 t 0 ) 2 t 0 2 4 1 t 0 t 0 3 t 0 4 ( 1 t 1 ) 4 4 ( 1 t 1 ) 3 t 1 6 ( 1 t 1 ) 2 t 1 2 4 1 t 1 t 1 3 t 1 4 . . . . . . . . . . . . . . . ( 1 t m ) 4 4 ( 1 t m ) 3 t m 6 ( 1 t m ) 2 t m 2 4 1 t m t m 3 t m 4
The control points through matrix operations are solved by
B A = Q
A = ( B T B ) 1 B T Q
where Q is the matrix of known data points:
Q = A ( t 0 ) A ( t 1 ) A ( t m ) T
and A is the matrix of control point:
A = A 0 A 1 A 2 A 3 A 4 T
The suction surface profile was selected as the fitting target (red line in Figure 6), and several two-dimensional point coordinates were obtained from the original profile. The coordinates of the control points Aj (xj, yj) were calculated based on Equations (6)–(11), and the 3D model could be rebuilt. The goodness of fit reached 99.6%, making it suitable for subsequent parametric design.

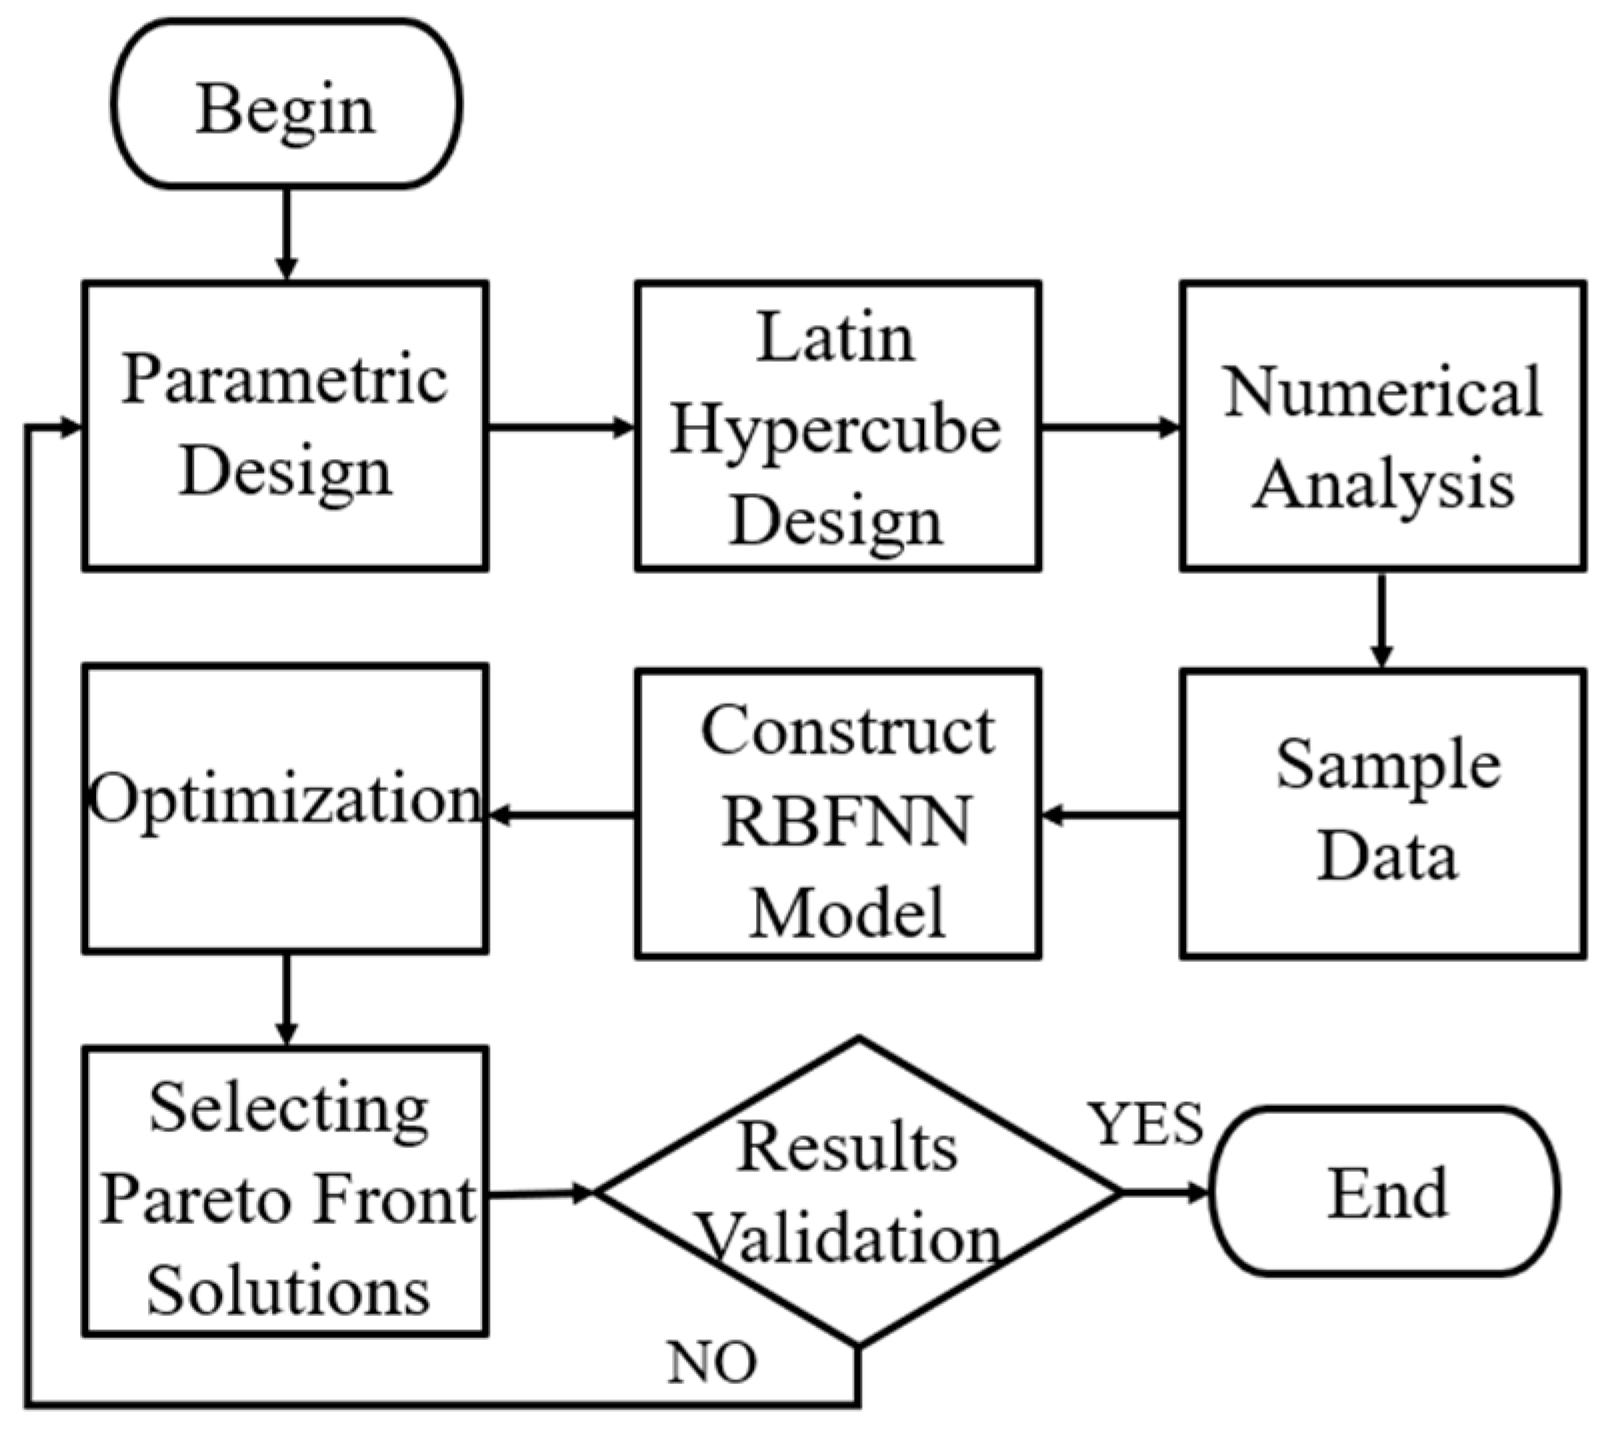
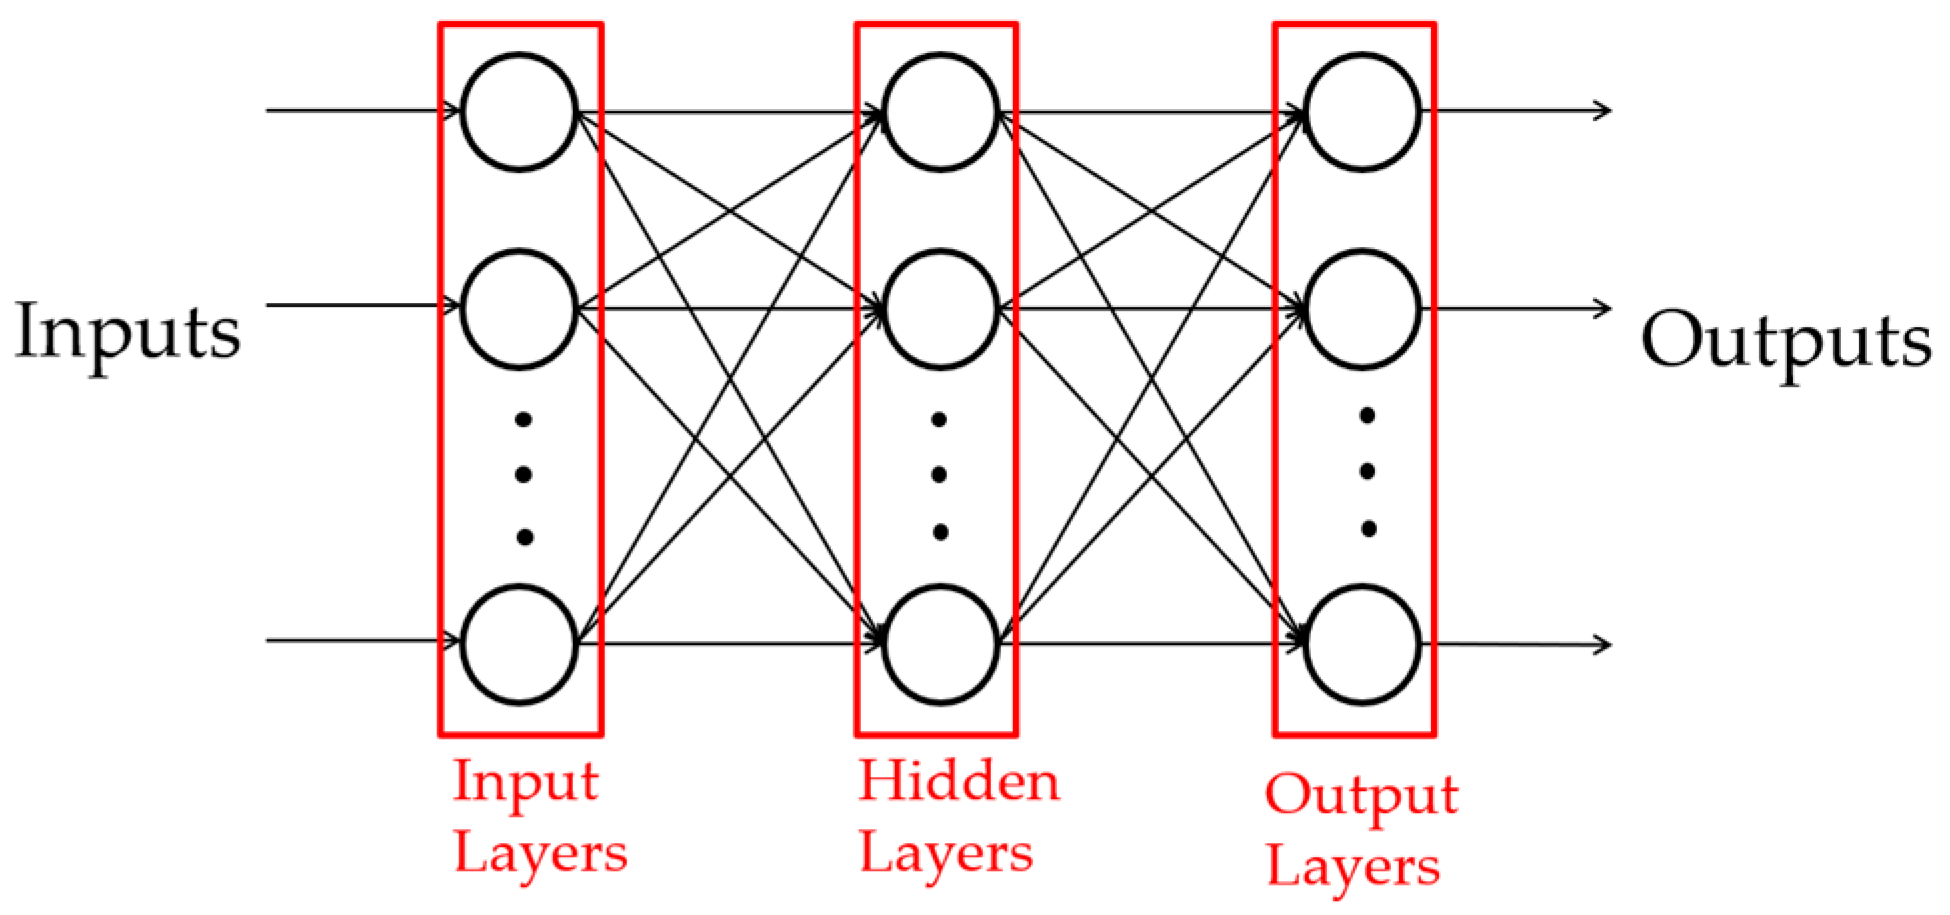
3.2. Design Parameter Selection and Surrogate Model Construction

In a two-dimensional coordinate system, O represents the origin of the coordinate axis, and determining the positions of five control points requires ten parameters. Firstly, it was determined that the coordinates of the blade inlet control point P1 and the radius of blade outlet control point P5 remained unchanged on the basis of the original blade profile. Then, the following seven parameters were selected as the blade profile control parameters: the inlet and outlet angles (β1 and β3) of blade; the radii (r1, r2, and r3) of control points P2, P3, and P4; the chord height (h) at control point P3; and the relative installation angle (β2) of the blade, as shown in Figure 6. After multiple reconstructions of the 3D model to eliminate any cases where a 3D model of the blade could not be generated, the variation ranges of these seven parameters were finally determined, as presented in Table 2. Figure 7 provides a more intuitive demonstration of the blade profile variation range.
Figure 6. Fitting blade profile using fourth-order Bezier curve.
Applsci 15 05052 g006

3.3. Optimization Schemes

The optimization scheme is illustrated in Figure 8. First, parameters were sampled using the optimal Latin hypercube design method, and after modeling and calculations, a sample dataset was established. Then, a radial basis neural network was used to train the dataset, and finally, a multi-objective genetic algorithm was employed for optimization.
The radial basis function neural network (RBFNN) is a feedforward neural network mainly used for tasks such as function approximation, classification, and pattern recognition. The core idea of the RBFNN is to use radial basis functions as activation functions for hidden layer neurons to construct a nonlinear mapping structure, as shown in Figure 9.
The activation function can be expressed as
R ( x p c i ) = e x p ( 1 2 σ 2 x p c i 2 ) , i = 1 , 2 , m
where x is an n-dimensional input vector; ci is the center value of the i-th basis function, which is the same as the input vector; σi represents the normalized constant of the width of the i-th center point of the basis function; and x p c i is the norm of vector xp-ci, representing the distance between ci. The Gaussian function value Ri(x) is obtained and is unique at the center value of a certain basis function. According to the above equation, as the x p c i increases, the value of the basis function Ri(x) decreases until it approaches 0. For a given input value, a small portion near the center of x is not activated.
The samples were divided into two parts, 80% for training and 20% for validation. The prediction results of the radial basis function neural network after training are shown in Figure 10. The absolute static pressure error of the verification points was mostly within 5 Pa, and the maximum absolute static pressure error was 12.5 Pa. The absolute static efficiency error of the verification points was mostly within 0.1%, and the maximum absolute static pressure efficiency error was 0.33%. The determination coefficients for static pressure and static pressure efficiency were 0.98 and 0.96, respectively. The error was within an acceptable range, and the overall model had a high level of confidence. It is believed that the trained neural network model can replace numerical simulation to predict target values and can be used for subsequent research.

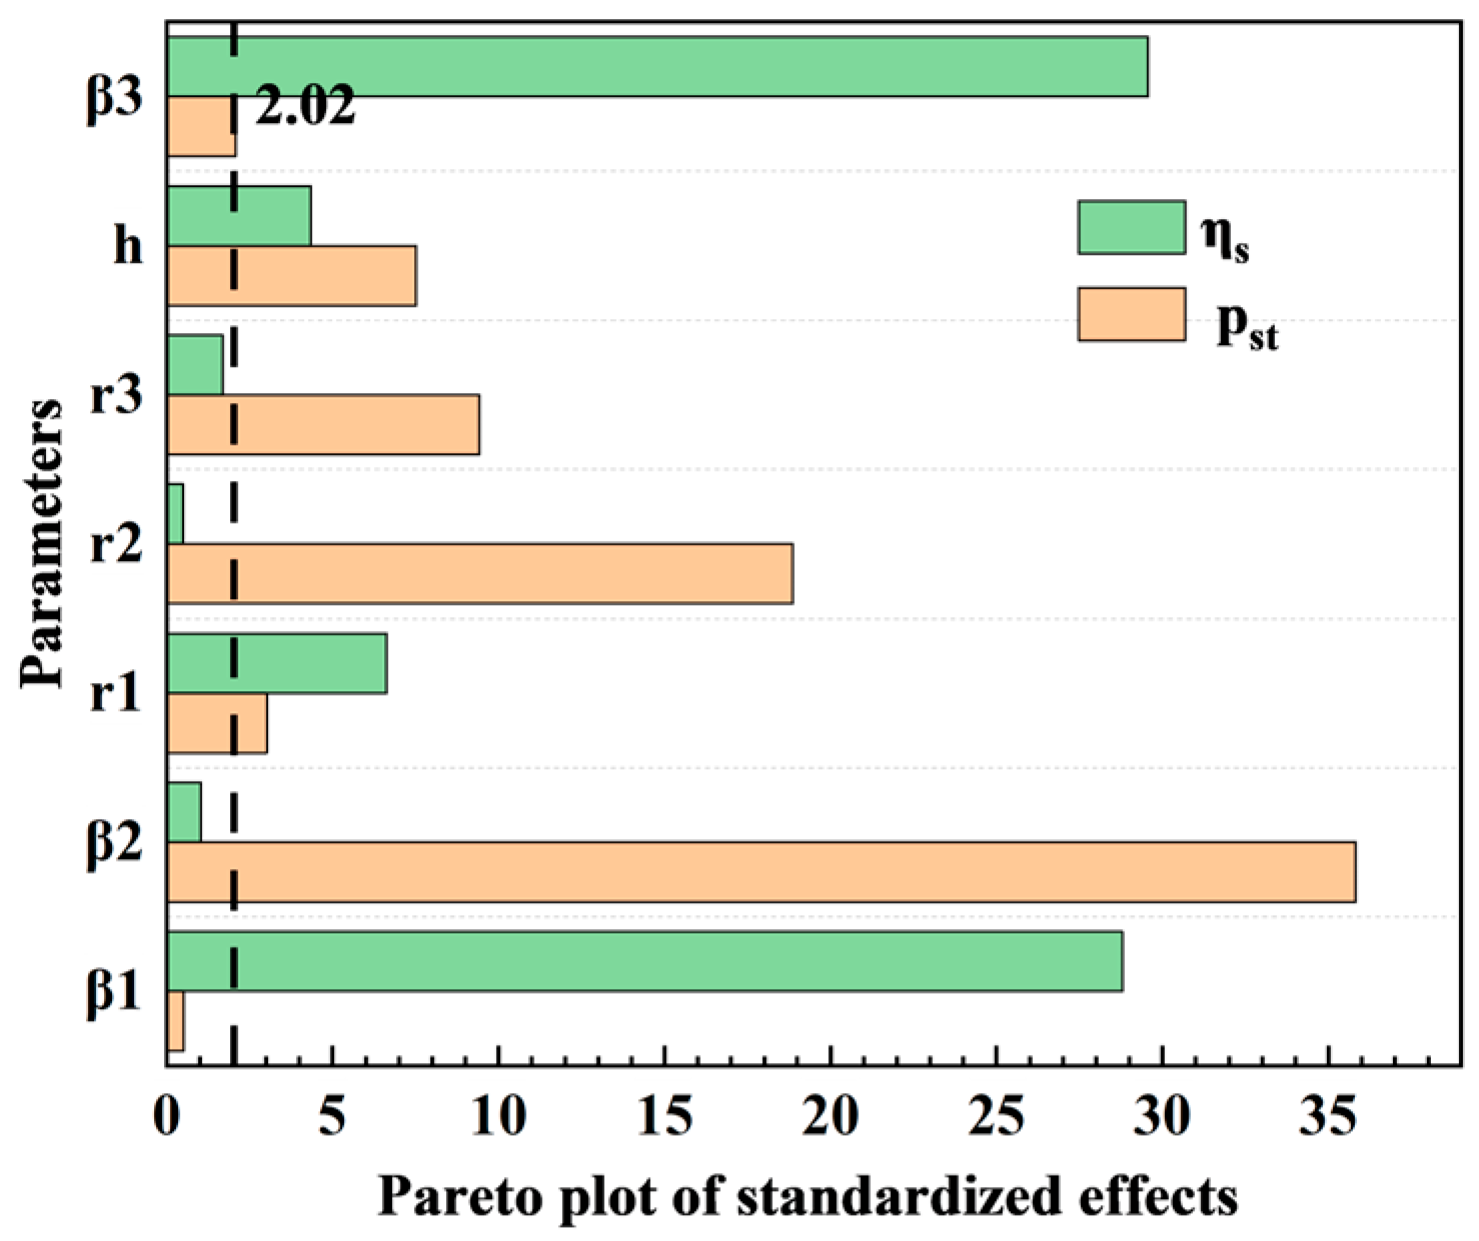
3.4. Significance Test of Parameter

A significance test can clarify the impact of design parameters on the optimization objectives, providing a basis and guidance for optimization tasks. The significance test was performed on 80 samples, and the results, using Minitab 22, are shown in Table 3. The overall models for pst and ηs reached an extremely significant level of correlation; β2, r1, r2, r3, and h exhibited an extremely significant correlation with pst; and β1, r1, h, and β3 exhibited an extremely significant correlation with ηs (p < 0.01 indicates an extremely significant level; p < 0.05 indicates a significant level). The goodness of fit for pst and ηs reached 98.9% and 98.8%, respectively.
On the Pareto plot of standardized effects, the reference line for statistical significance was plotted at t = 2.02, as shown in Figure 11. If the standardized effect of a parameter is greater than t, it indicates that the correlation of the parameter has reached a significant level, i.e., p < 0.05. It can be seen form the result that β2 and r2 had a significant impact on pst, while β1 and β2 had a significant impact on ηs. Overall, there were interactions between variables, and it was necessary to consider seven variables comprehensively for optimization design.

4. Result and Discussion

4.1. Selection and Validation of Optimization Results

Genetic algorithms (GAs) are inspired by the theory of biological evolution. By simulating natural selection and genetic variation mechanisms such as selection, crossover, and mutation, excellent individuals are selected as optimization results. MOGA has developed three mechanisms based on GAs: reducing computational complexity through fast non dominated sorting, introducing crowding distance to protect the diversity of the population and ensure uniform distribution among different individuals, and accelerating convergence by using the elite strategy to retain the current optimal individual in the selection operation.
A total of 4000 populations were calculated by MOGA, and a Pareto front solution was obtained after optimization. To demonstrate the distribution of population individuals in the optimization results, two objective results were projected onto a two-dimensional space for representation, as shown in Figure 12.
The optimized solution (AM) and two other optimized solutions (BM and CM) were selected within the range of ensuring an improvement in both pst and ηs from Pareto frontier solutions and verified by numerical calculation for result validation. The validation results are shown in Table 4. In operating conditions, the three optimized fan models showed improvement of performance in pst and ηs results compared to the prototype fan. The RBFNN results of the optimized fan had a relative error of no more than 1% compared to the numerical results, indicating that the RBFNN results were reliable and had achieved the goal of optimizing the performance of the centrifugal fan.

4.2. Flow-Field Analysis

Figure 13 provides a more intuitive demonstration of the changes in the blade profile. The original blade profile was an arc, so its curvature was the same at different chord lengths. Due to a decrease in β1 and r1, the optimized blade profile became more pronounced at the inlet section, with increased curvature; meanwhile, the range of r1, r2, and r3 reduced along with a decrease in h making the mid-to-rear section of the optimized blade profile smoother, with reduced curvature. Under the influence of β2, the optimized blade profile exhibited decreased curvature at the outlet section, even showing curvature opposite to that in the mid-to-anterior section, and changes in β3 lead to an increased chord length. The outlet angles of AM, BM, and CM increased sequentially, resulting in a corresponding increase in pst, which was consistent with the conclusions in Figure 12 and Table 4.
Figure 14 shows the comparison of the external performance characteristics of the prototype fan and the three optimized fans, with the overall trends of the performance curves remaining essentially consistent. The ηs of the optimized fan had been improved in both the operating and low flow conditions, while its efficiency decreased at high flow rates; additionally, the maximum efficiency operating condition has shifted towards low flow rates, which may have been caused by the decrease in the maximum flow rates of the optimized fan. Similarly, the pst was improved in both operating and flow conditions, while the pst was decreased at high flow rates, for the same reason as the decrease in efficiency. In practical applications, high-flow conditions are rarely used; therefore, the improvements in performance under the design and low-flow conditions—which are of greater engineering concern—make the optimization results quite reasonable.
In this study, the origin of the coordinate system is located at the center of the back plate of the impeller. The impeller rotates along the Z-axis, and the airflow enters the impeller in the negative direction of the Z-axis. In order to better demonstrate and analyze the internal flow-field characteristics of the fan, the flow conditions at three heights of Z = 20 mm (near the rear plate of the impeller), Z = 45 mm (in the middle of the impeller), and Z = 70 mm (near the front plate of the impeller) were analyzed, as shown in Figure 15.
Figure 16 shows the pressure distribution on the blade surface of fans. It can be seen that in PM, there is a high-pressure region near the front of the pressure side trailing edge, indicating that this area is the main work-performing region on the pressure surface. In contrast, the pressure near the trailing edge of the pressure surface is slightly lower, suggesting that this region performs less work compared to the high-pressure area. The high-pressure area near the trailing edge of the pressure surface increases in AM, implying that the effective work area of the blade has expanded after optimization, resulting in improved performance, while the performance of BM and CM deteriorates in the same area. Regarding the pressure distribution on the suction surface, PM has a larger low-pressure region near the leading edge compared to AM, which indicates that the optimized AM experiences a milder inlet impact flow and reduced impact loss. Overall, AM shows a more uniform pressure distribution with a reduces pressure gradient, leading to enhanced fan performance.
Figure 17 shows the streamline distribution of fans. In PM, the flow separation on the blade suction side is most severe near the shroud, and the separation phenomenon decreases with reduced blade height. This is because the airflow near the shroud has not fully developed, resulting in complex local flow conditions—especially near the trailing edge, where PM exhibits significant separation. In optimized fans, with modifications to the blade curvature and outlet angle, the flow separation near the trailing edge adjacent to the shroud is improved. Additionally, in PM, a low-velocity region exists near the back plate due to the influence of the motor and the inlet incidence angle. Overall, the internal streamlines in optimized fans are smoother, with both the blade suction surface separation and the inlet impact flow being suppressed, and the low-velocity region within the impeller reduced. This indicates that the blade profile curvature optimized using the Bézier curve method better conforms to the fluid flow characteristics.
The entropy generation theory is often used to analyze and assess irreversible energy losses in a system. In turbulence, the entropy generation rate is mainly caused by turbulent dissipation and the viscous dissipation of the fluid. The calculation formula for the entropy generation rate (EGR) is as follows:
S D = S D A + S D B
S D A = μ T 2 u ¯ x 2 + v ¯ y 2 + ω ¯ z 2 + u ¯ x + v ¯ y 2 + v ¯ y + ω ¯ z 2 + u ¯ x + ω ¯ z 2
S D B = μ T 2 u x 2 + v y 2 + ω z 2 + u x + v y 2 + v y + ω z 2 + u x + ω ¯ z 2
where S D is the total entropy generation rate; S D A and S D B are the entropy generation rates caused by the mean velocity and the fluctuating velocity, respectively (W·m−3·K−1); u ¯ , v ¯ , and ω ¯ and u , v , and ω represent the time-averaged velocities and the fluctuating velocities in the x, y, and z directions, respectively; T is the temperature, taken as 298 K; and μ is the dynamic viscosity of the fluid (Pa·s).
In numerical calculations, the turbulent fluctuating velocity cannot be directly represented, so it is substituted by the ε equation:
S D = ρ ε T
where ρ represents the fluid density (kg·m−3) and ε denotes the turbulent dissipation rate (m2·s−3).
Figure 18 illustrates the distribution of the entropy generation rate in the fan flow passage of fans based on Equations (13), (14) and (16). Overall, the regions with higher entropy generation rate are located at the blade inlet, the blade outlet, and along the blade’s suction side. These high entropy generation areas are attributed to various complex internal flow phenomena, including impact losses caused by the inlet incidence angle, the jet-wake phenomena generated at the blade trailing edge, and the flow separation on the blade suction surface. In particular, the flow separation and jet-wake phenomena on the suction side near the shroud at the mid-section of the impeller are most obvious, while near the back plate, inlet impact is the dominant feature. After optimization, compared with PM, AM and BM exhibited a shift in the flow separation on the blade suction surface near the shroud toward the blade trailing edge, which suppressed the separation and reduced local entropy generation. Additionally, the entropy generation losses at the mid-section near the impeller’s trailing edge were also mitigated, leading to more stable local flow conditions. Furthermore, improvements in the low-speed flow caused by the motor and the correction of the improper airflow inlet angle contributed to a reduction in the overall entropy generation rate. However, compared to PM, CM did not show significant optimization.
Figure 19 shows the distribution of vortex structures captured with a Q-criterion threshold of 40,000, highlighting the close relationship between turbulence and vortices. The vortex structures were primarily concentrated in regions with unstable airflow, such as the blade inlet, blade outlet, and near the motor. After optimization, the vortex cluster and vorticity at the inlet on the blade suction surface near the back plate were reduced, and the vortex band near the back plate became significantly narrower. Additionally, the vortex cluster near the shroud at the blade outlet diminished, and the vorticity in the outlet region decreased.

5. Conclusions

Fitting the blade profile with fourth-order Bézier curves, a surrogate mapping between the design parameters and the optimization objectives was established with a radial basis neural network model, and multi-objective optimization was carried out using a multi-objective genetic algorithm. The following conclusions were reached:
  • The fourth-order Bézier curve method achieved a fitting accuracy of 99.6% when reproducing the original blade shape, which met the required precision for blade profile fitting.
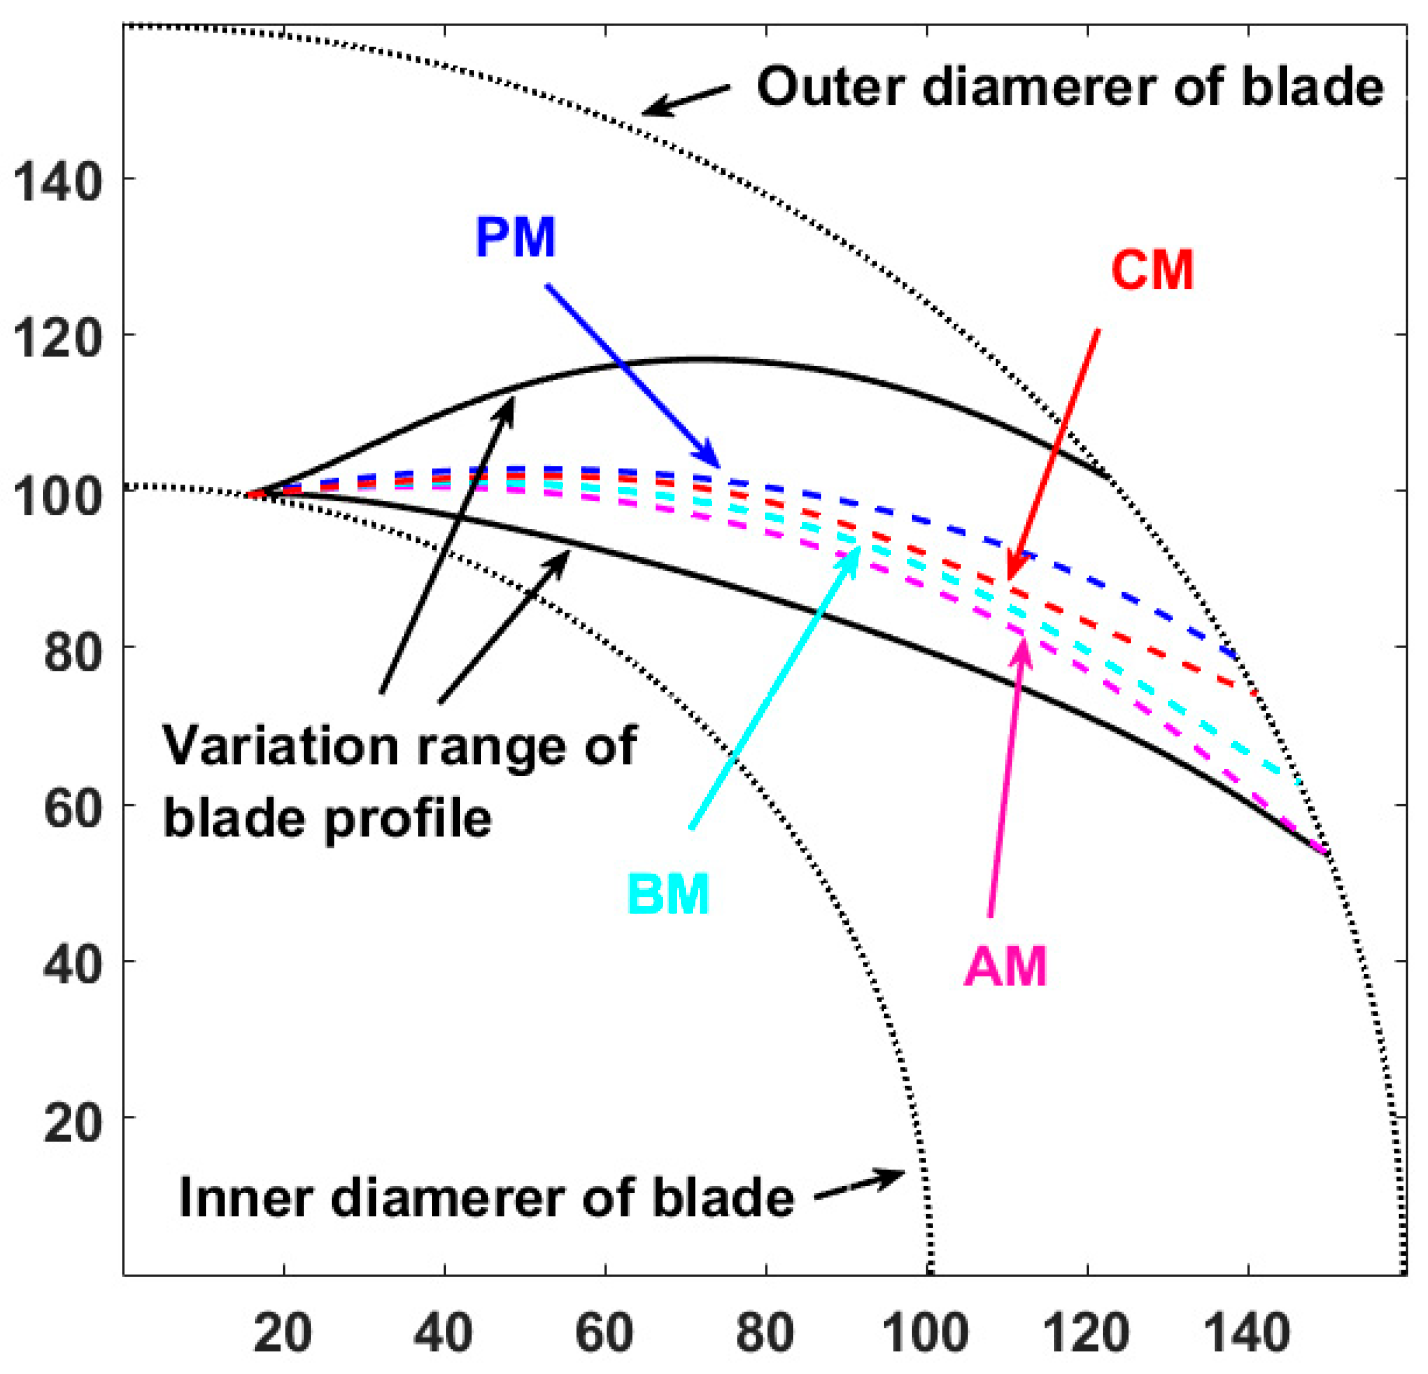
  • Based on the blade profile display results, the fourth-order Bézier curve method offered more flexible control over the curvature at different chord lengths. The optimized blade curvature increased from the inlet to a peak and then decreases towards the outlet, resulting in a more pronounced profile at the inlet and a smoother profile at the outlet.
  • The optimal Latin hypercube summation method was used to construct the samples, and significance analysis was conducted on the design parameters. It can be seen form the result that β2 and r2 had a greater influence on static pressure, while β1 and β3 had a greater impact on static pressure efficiency. The optimization results were consistent with the significance analysis, indicating that there were interactions among the design parameters and that the overall model was extremely significantly correlated.
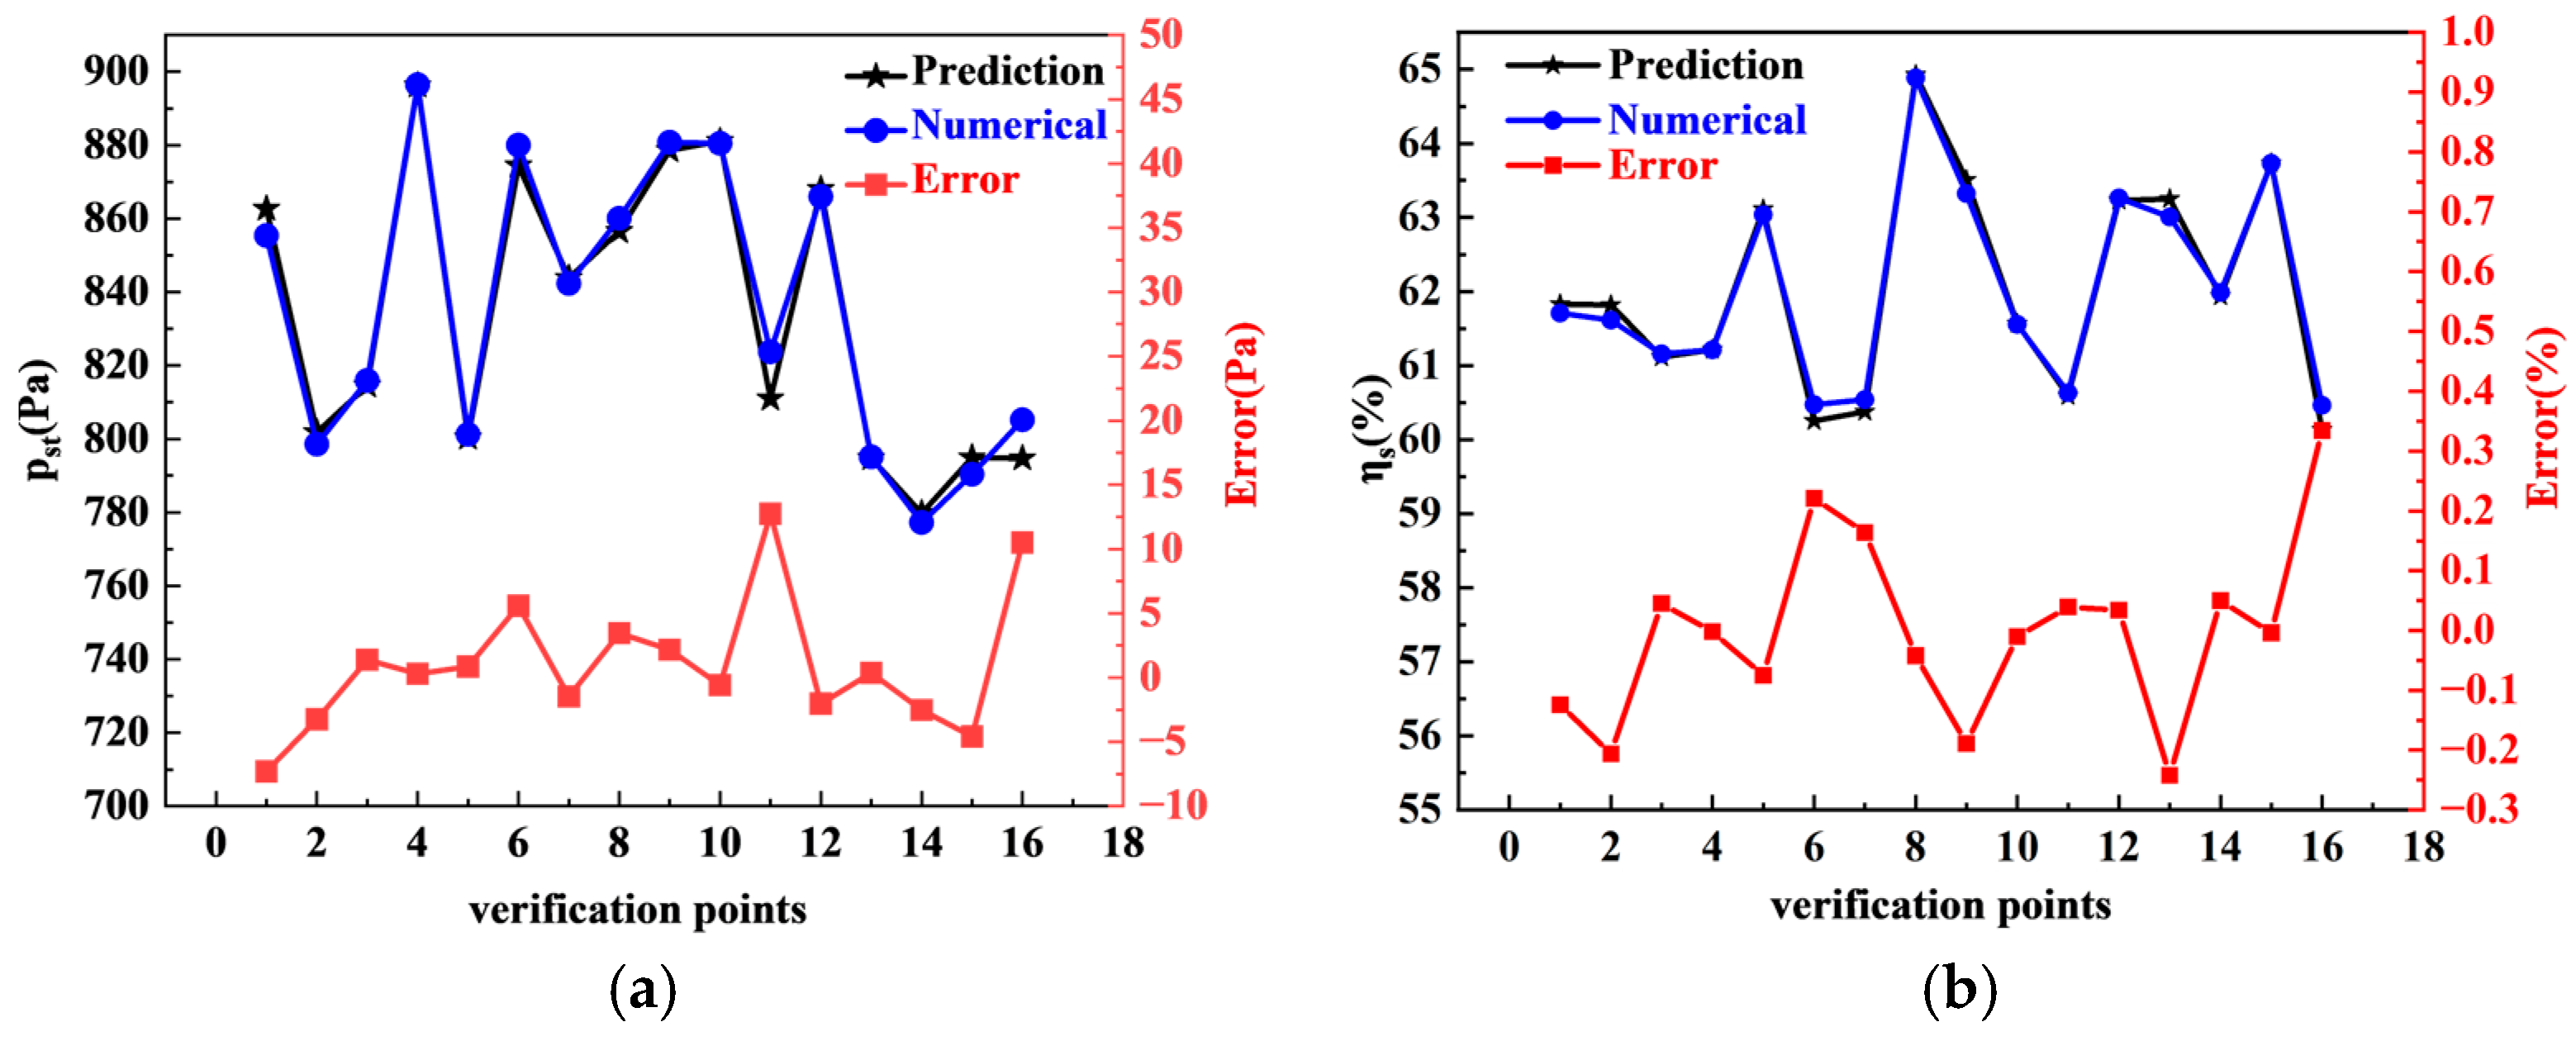
  • The radial basis neural network accurately and effectively captured the mapping relationship between the design parameters and the target outcomes. Compared with numerical results, the prediction error of the surrogate model did not exceed 1%, which met the accuracy requirements.
  • After optimization, the fan’s static pressure at the design operating condition increased by 12.7 Pa, and the static pressure efficiency increased by 3.2%, leading to improved fan performance. The optimized fan’s high-efficiency point shifted toward the low-flow region, with notable improvements in both efficiency and static pressure under low-flow conditions. This broadened the high-efficiency operating range, making the fan better suited to various application scenarios.
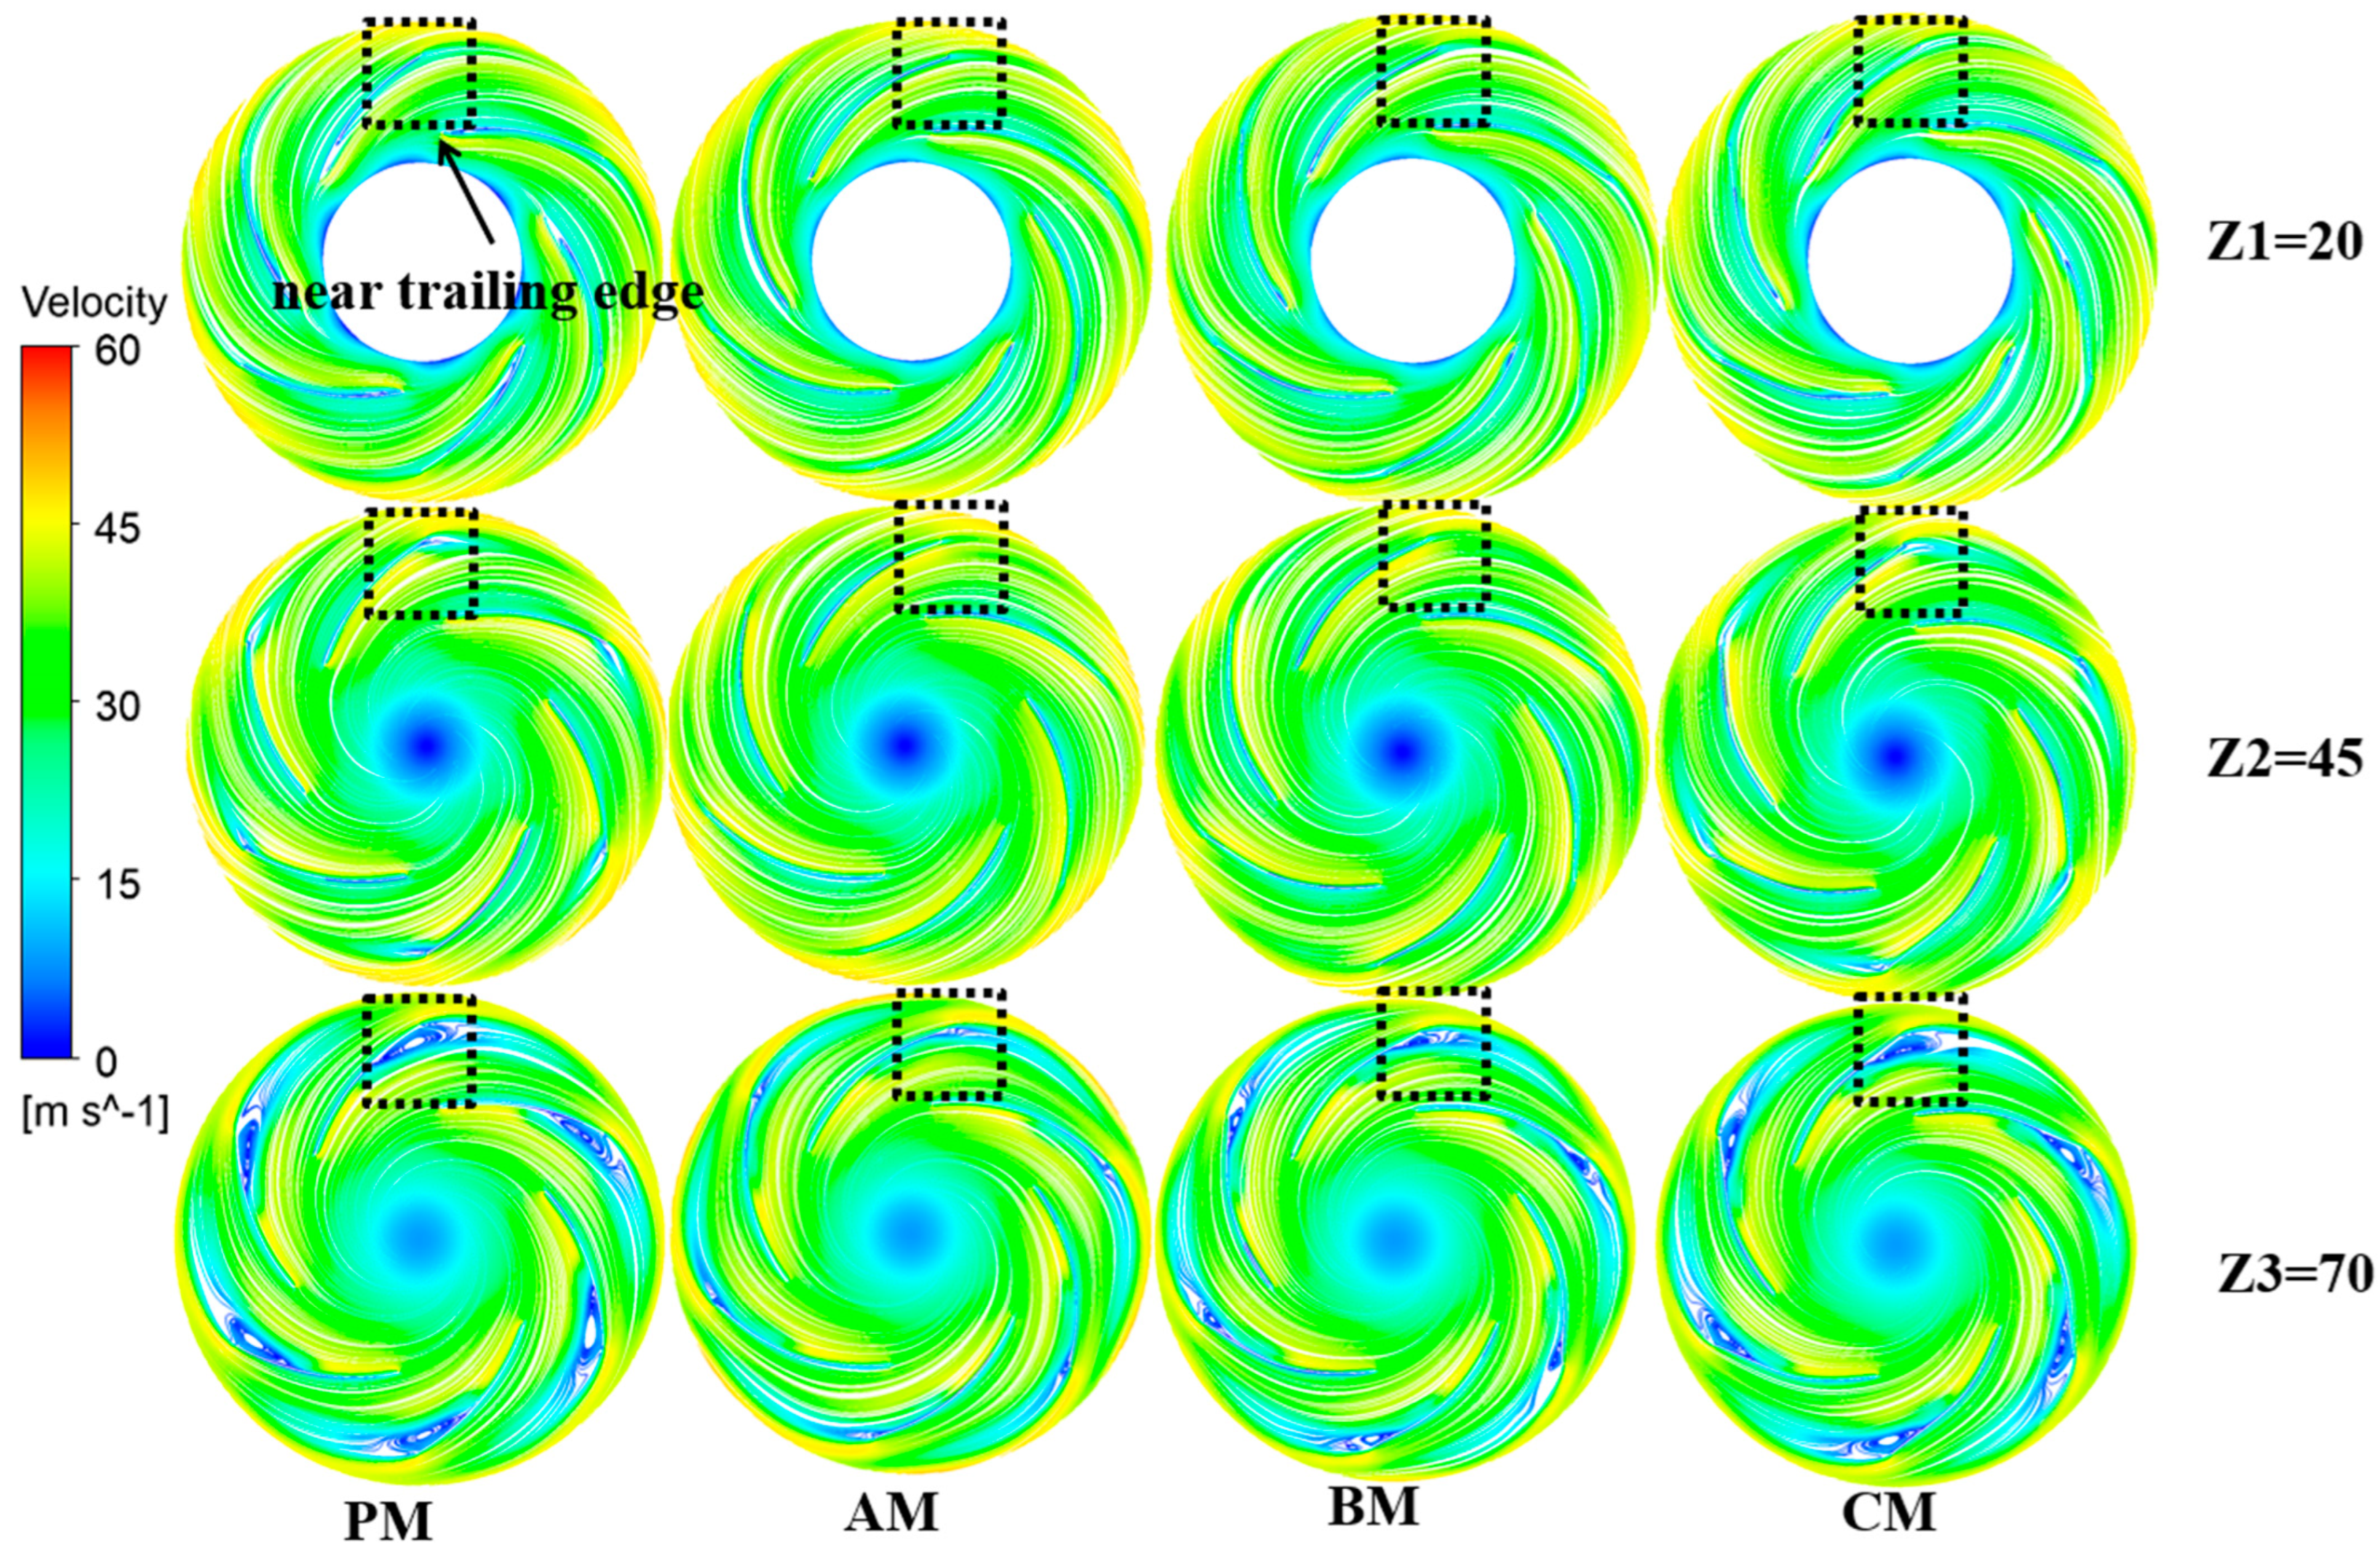
  • After optimization, the streamlines aligned more closely with the blade profile. The impact at the blade inlet and the separation on the suction side were improved, resulting in reduced flow loss. At the same time, the vortical structures and vortex intensity within the channel were significantly diminished, effectively suppressing complex flow phenomena.

Author Contributions

Methodology, K.L. and T.H.; software, J.W. and D.Z.; validation, H.H., D.G. and L.J.; writing—original draft preparation, J.W.; writing—review and editing, K.L., M.L. and T.H. All authors have read and agreed to the published version of the manuscript.

Funding

This research was funded by the National Natural Science Foundation of China, grant number 52376005; the National Natural Science Foundation of China, grant number 52378094; the Henan Provincial Science and Technology Research Project, grant number 222102220033, the Henan Provincial Science and Technology Research Project, grant number 242102220004; and the Luoyang Science and Technology Research Project, grant number 2302035A.

Institutional Review Board Statement

Not applicable.

Informed Consent Statement

Not applicable.

Data Availability Statement

The original contributions presented in the study are included in the article, further inquiries can be directed to the corresponding author.

Acknowledgments

The authors would like to thank the anonymous reviewers for their valuable comments and suggestions.

Conflicts of Interest

Authors Haijiang He, Dewu Gong and Lihua Jiang were employed by the company Zhejiang Yilida Ventilator Co., Ltd. The remaining authors declare that the research was conducted in the absence of any commercial or financial relationships that could be construed as a potential conflict of interest.

References

  1. Wu, L.; Dou, H.-S.; Wei, Y.; Chen, Y.; Cao, W.; Ying, C. Optimization of Blade Profile of a Plenum Fan. Int. J. Fluid Mach. Syst. 2016, 9, 95–106. [Google Scholar] [CrossRef]
  2. Ye, J.; Liu, W.; Duan, P.; Huang, X.; Shao, J.; Zhang, Y. Investigation of the Performance and Flow Behaviors of the Multi-Blade Centrifugal Fan Based on the Computer Simulation Technology. Wirel. Pers. Commun. 2018, 103, 563–574. [Google Scholar] [CrossRef]
  3. Ni, S.; Cao, W.; Xu, J.; Wang, Y.; Zhang, W. Effects of an Inclined Blade on the Performance of a Sirocco Fan. Appl. Sci. 2019, 9, 3154. [Google Scholar] [CrossRef]
  4. Kulfan, B.M. Recent Extensions and Applications of the ‘CST’ Universal Parametric Geometry Representation Method. Aeronaut. J. 2010, 114, 157–176. [Google Scholar] [CrossRef]
  5. Zhu, M.; Li, Z.; Li, G.; Ye, X.; Liu, Y.; Chen, Z.; Li, N. An Investigation on Optimized Performance of Voluteless Centrifugal Fans by a Class and Shape Transformation Function. Processes 2023, 11, 1751. [Google Scholar] [CrossRef]
  6. Zhou, S.; Yang, K.; Zhang, W.; Zhang, K.; Wang, C.; Jin, W. Optimization of Multi-Blade Centrifugal Fan Blade Design for Ventilation and Air-Conditioning System Based on Disturbance CST Function. Appl. Sci. 2021, 11, 7784. [Google Scholar] [CrossRef]
  7. Wei, Y.; Ying, C.; Xu, J.; Cao, W.; Wang, Z.; Zhu, Z. Effects of Single-Arc Blade Profile Length on the Performance of a Forward Multiblade Fan. Processes 2019, 7, 629. [Google Scholar] [CrossRef]
  8. Lee, K.J.; Park, I.W.; Bang, K.S.; Kim, Y.M.; Ahn, Y.C. Optimal Design of a Plenum Fan with Three-Dimensional Blades. Appl. Sci. 2020, 10, 3460. [Google Scholar] [CrossRef]
  9. Lei, J.; Cui, Q.; Qin, G. Performance Improvement of Multi-Blade Centrifugal Fan Based on Impeller Outlet Flow Control. Phys. Fluids 2024, 36, 095181. [Google Scholar] [CrossRef]
  10. Ferrari, C.; Beccati, N.; Pedrielli, F. CFD Methodology for an Underhood Analysis towards the Optimum Fan Position in a Compact Off-Road Machine. Energies 2023, 16, 4369. [Google Scholar] [CrossRef]
  11. Shao, W.; Feng, J.; Zhang, F.; Wang, S.; Li, Y.; Lv, J. Aerodynamic Performance Optimization of Centrifugal Fan Blade for Air System of Self-Propelled Cotton-Picking Machine. Agriculture 2023, 13, 1579. [Google Scholar] [CrossRef]
  12. Li, Z.; Luo, P.; Zhu, M.; Chen, Z. Surrogate Model on the Extension Operation Range of an Isolated Centrifugal Fan. J. Appl. Fluid Mech. 2024, 17, 900–911. [Google Scholar] [CrossRef]
  13. Zhang, H.; Wang, Z.; Yang, H.; Zhu, Z.; Wei, Y. Blade Shape Optimization and Internal-Flow Characteristics of the Backward Non-Volute Centrifugal Fan. Proc. Inst. Mech. Eng. Part J. Power Energy 2022, 236, 673–688. [Google Scholar] [CrossRef]
  14. Kim, S.J.; Sung, H.J.; Wallin, S.; Johansson, A.V. Design of the Centrifugal Fan of a Belt-Driven Starter Generator with Reduced Flow Noise. Int. J. Heat Fluid Flow 2019, 76, 72–84. [Google Scholar] [CrossRef]
  15. Acarer, S.; Uyulan, Ç.; Karadeniz, Z.H. Optimization of Radial Inflow Wind Turbines for Urban Wind Energy Harvesting. Energy 2020, 202, 117772. [Google Scholar] [CrossRef]
  16. Ferrari, C.; Pinelli, M.; Spina, P.R.; Bolognin, P.; Borghi, L. In Fluid Dynamic Design and Optimization of Two Stage Centrifugal Fan for Industrial Burners. In Proceedings of the ASME 2011 Turbo Expo: Turbine Technical Conference and Exposition, Vancouver, BC, Canada, 6–10 June 2011; 2011; pp. 483–490. [Google Scholar]
  17. Rengma, T.S.; Gupta, M.K.; Subbarao, P.M.V. A Novel Method of Optimizing the Savonius Hydrokinetic Turbine Blades Using Bezier Curve. Renew. Energy 2023, 216, 119091. [Google Scholar] [CrossRef]
  18. Wang, Y.; Sun, Z.; Liu, J.; Liu, M.; Zhou, Y. Optimization Design of Centrifugal Impeller Based on Bezier Surface and FFD Space Grid Parameterization. PLoS ONE 2024, 19, e0310792. [Google Scholar] [CrossRef] [PubMed]
  19. Ma, P.; Li, L.; Wang, B.; Wang, H.; Yu, J.; Liang, L.; Xie, C.; Tang, Y. Optimization of Submersible LNG Centrifugal Pump Blades Design Based on Support Vector Regression and the Non-Dominated Sorting Genetic Algorithm II. Energy 2024, 313, 133812. [Google Scholar] [CrossRef]
Figure 1. Schematic of the fan model: (a) the voluteless centrifugal fan and (b) the computational domain of the fan.
Applsci 15 05052 g001
Figure 2. The meshes of the fan: (a) details of boundary layers and (b) wall y+.
Applsci 15 05052 g002
Figure 3. Mesh independence verification.
Applsci 15 05052 g003
Figure 4. Experimental system: (a) field site and (b) laboratory schematic diagram.
Applsci 15 05052 g004
Figure 5. Variation in static pressure rise and efficiency.
Applsci 15 05052 g005
Figure 7. The variation range of blade profile.
Applsci 15 05052 g007
Figure 8. Optimization schemes of the fan.
Applsci 15 05052 g008
Figure 9. RBFNN network structure.
Applsci 15 05052 g009
Figure 10. The errors between prediction and numerical values of verification samples of (a) static pressure and (b) static pressure efficiency.
Applsci 15 05052 g010
Figure 11. The Pareto plot of standardized effects.
Applsci 15 05052 g011
Figure 12. Pareto front solutions.
Applsci 15 05052 g012
Figure 13. Profiles of the prototype blade and three optimized blades.
Applsci 15 05052 g013
Figure 14. External performance characteristics of fans: (a) static pressure and (b) static pressure efficiency.
Applsci 15 05052 g014
Figure 15. Schematic diagram of section selection.
Applsci 15 05052 g015
Figure 16. Blade surface pressure of fans.
Applsci 15 05052 g016
Figure 17. Streamline of fans.
Applsci 15 05052 g017
Figure 18. Entropy generation rate of fans.
Applsci 15 05052 g018
Figure 19. Vortex structures and vorticity of fans.
Applsci 15 05052 g019
Table 1. The main design parameters of the voluteless centrifugal fan.
ParameterValue
Design flow rate/kg·s−10.964
Design rotational speed/r·min−13100
Number of blades6
Outer diameter of impeller/mm360
Inner diameter of impeller/mm213
Blade inlet angle/°20
Blade outlet angle/°30.9
Thickness of blades/mm2
Width of the impeller/mm94
Table 2. Expression and variety range of parameters.
ParametersExpressionOriginal ValueVariety Range
β1 arctan ( y 2 y 1 ) / ( 1 + x 1 ( y 2 y 1 ) x 2 x 1 ) 20°15°~25°
β2 arctan ( y 5 y 4 ) / ( 1 + x 4 ( y 5 y 4 ) x 5 x 4 ) 30.9°20°~40°
r1 r 1 = x 2 2 + y 2 2 117.8 mm110 mm~135 mm
r2 r 2 = x 3 2 + y 3 2 141.36 mm125 mm~150 mm
r3 r 3 = x 4 2 + y 4 2 155.74 mm149 mm~157 mm
h ( y 5 y 1 x 5 x 1 x 3 y 3 y 5 y 1 x 5 x 1 x 1 + y 1 ) / ( 1 + y 5 y 1 x 5 x 1 2 ) 18.97 mm13 mm~25 mm
β3 arctan ( y 5 y 1 x 5 x 1 y 2 y 1 x 2 x 1 ) / ( 1 + ( y 5 y 1 ) ( y 2 y 1 ) x 5 x 1 x 2 x 1 ) 20.67°15°~25°
Table 3. Significance test.
p Value
Itempstηs
Model<0.0001<0.0001
β10.6416<0.0001
β2<0.00010.2351
r10.0043<0.0001
r2<0.00010.8135
r3<0.00010.1189
h<0.0001<0.0001
β30.0389<0.0001
Table 4. Comparison of RBFNN result (R) and numerical result (N) at design point.
Casepst (N)/Papst (R)/Paηs (N)/%ηs (R)/%
Prototype (PM)870.30 63.01
A model (AM)882.98881.2066.2566.28
B model (BM)916.61913.4465.3165.14
C model (CM)929.72936.9163.4363.50
Disclaimer/Publisher’s Note: The statements, opinions and data contained in all publications are solely those of the individual author(s) and contributor(s) and not of MDPI and/or the editor(s). MDPI and/or the editor(s) disclaim responsibility for any injury to people or property resulting from any ideas, methods, instructions or products referred to in the content.

