1. Introduction
Belt conveyors are widely used for the transportation of bulk materials and raw resources [
1,
2]. They are employed across numerous industrial sectors, including open-pit and underground mining, metallurgy, cement plants, factories, and ports. Their widespread adoption is primarily due to their relatively simple construction, high reliability, and capability to operate in environments where alternative transport methods are either impractical or impossible. However, the use of conveyors is accompanied by a range of operational challenges. Continuous efforts are made to develop new solutions aimed at achieving a fully automated transport system, in line with the principles of Industry 4.0 [
3,
4,
5].
1.1. Conveyor Belt Structure and Operational Challenges
One of the most failure-prone components of a conveyor system is the conveyor belt itself, which is in direct contact with the transported material and therefore vulnerable to damage. Belt wear processes can be divided into natural, cumulative wear caused by friction and bending (such as edge and cover abrasion, and core fatigue), and random, sudden events like belt cuts, punctures, and breakages [
6,
7,
8,
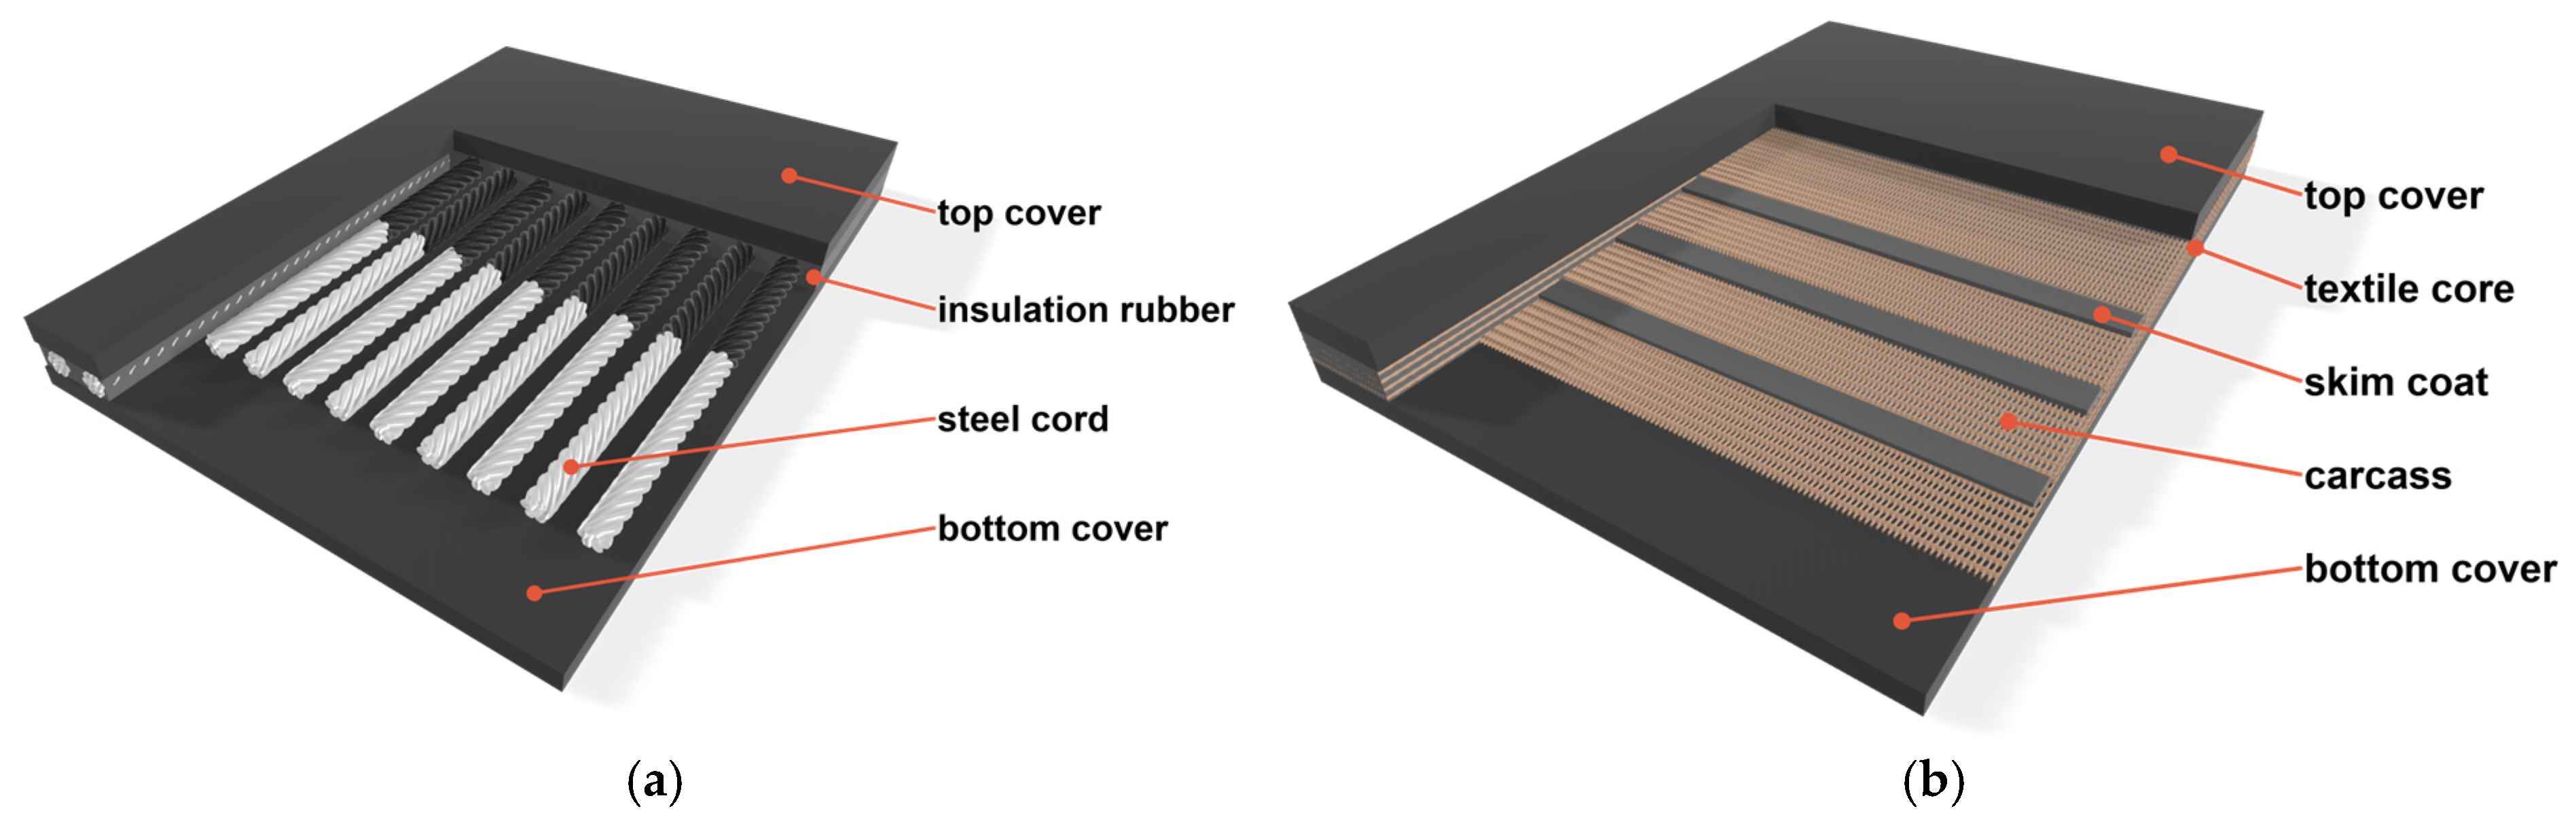
9]. A typical conveyor belt consists of three layers:
- 1.
Top cover, which protects the core from damage caused by falling material and abrasive forces during loading and transport;
- 2.
Core, which transmits longitudinal forces required for moving large masses of material and allows the belt to flex into a trough shape;
- 3.
Bottom cover, which protects the core from wear due to contact with pulleys and idlers along the conveyor route.
Depending on the materials used in the core layer, conveyor belts are categorized as either textile-reinforced or steel cord-reinforced.
Figure 1 illustrates the structural schematics of both types.
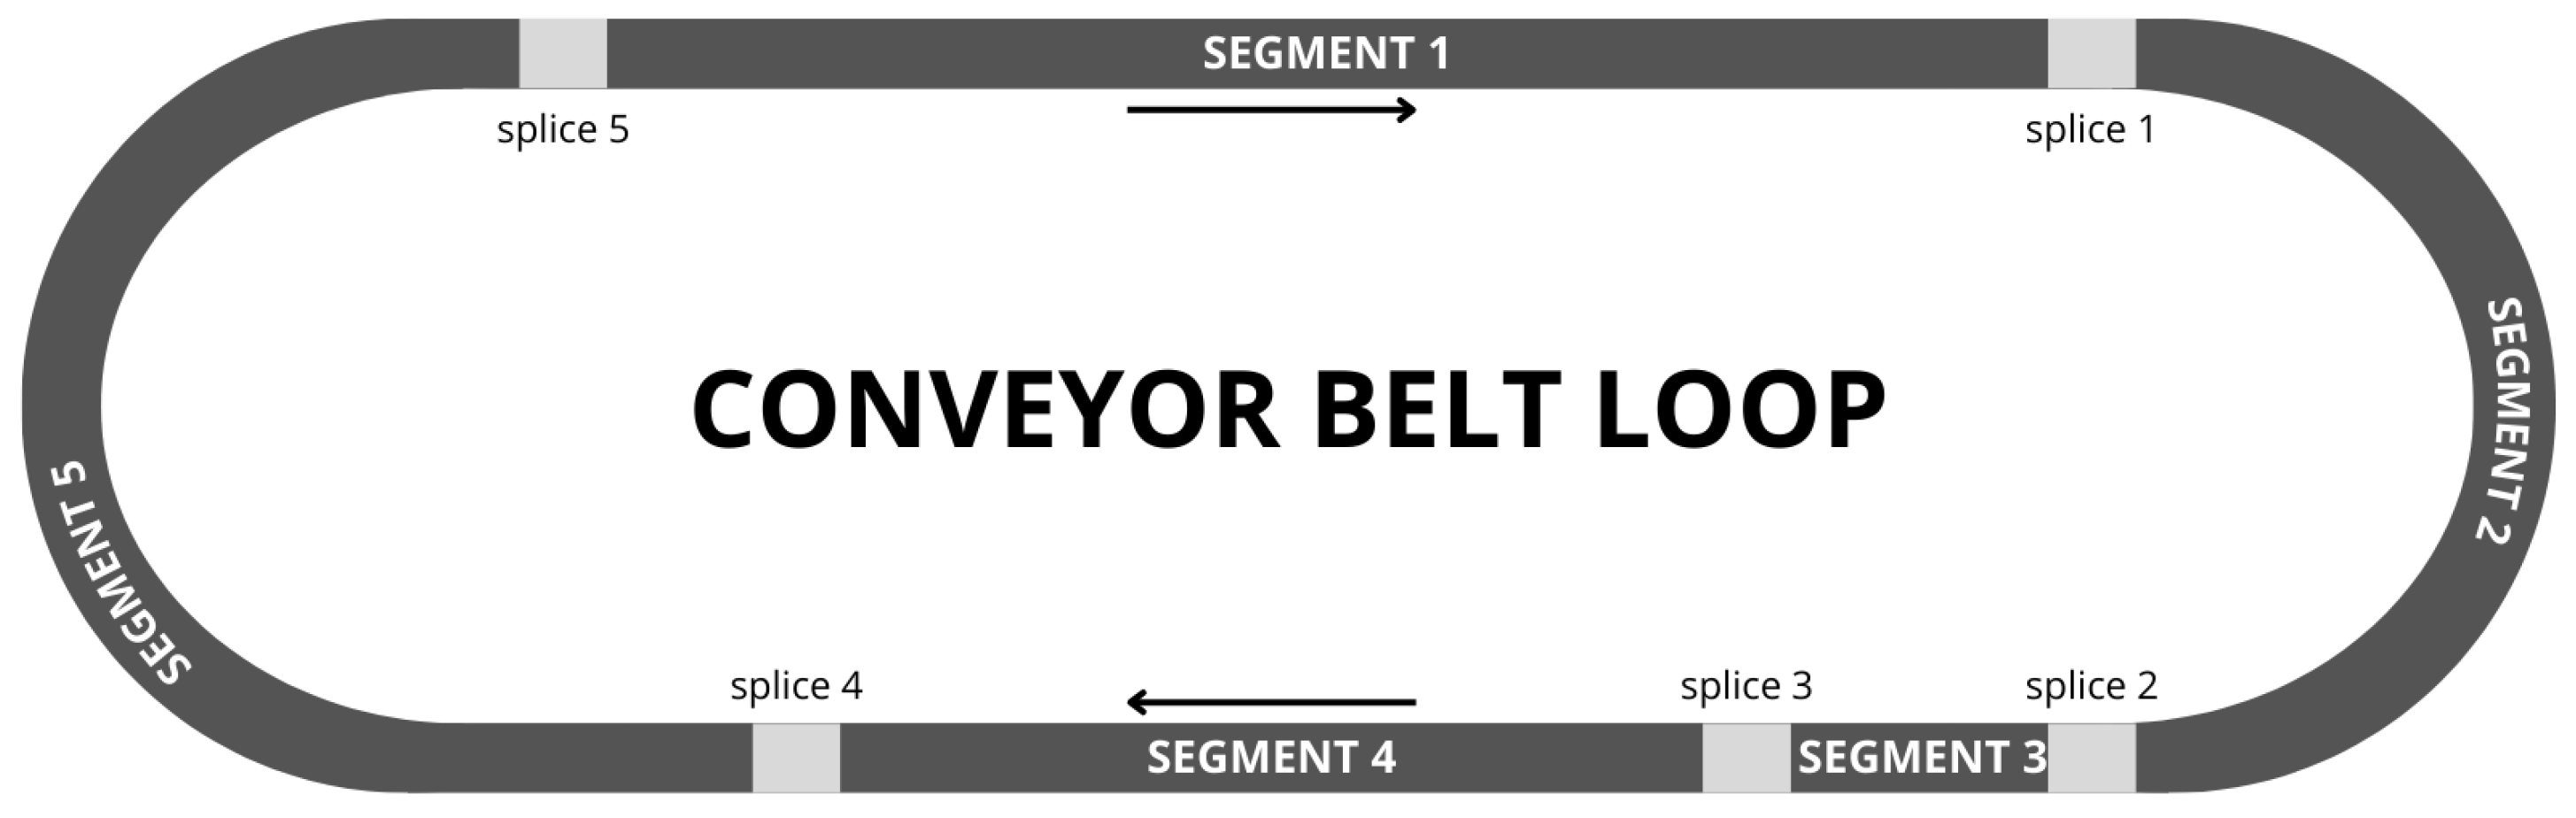
Conveyor belts are assembled into a closed loop from multiple sections, which are delivered to the installation site on reels. Due to transportation constraints (maximum permissible weight and reel diameter), individual sections typically cannot exceed several hundred meters in length [
10]. These sections must be spliced to form a durable loop capable of fulfilling the required transport function. At the splice location, the belt core loses its continuity over a short region, making the splice the weakest link in the series-structured loop. An example of such a closed conveyor belt loop is shown in
Figure 2.
To ensure the required strength and fatigue resistance, standards have been developed for belt splicing (e.g., PN-C-94147:1997 (PN-C-94147:1997; Połączenia taśm przenośnikowych metodą wulkanizacji; Polski Komitet Normalizacyjny, Warszawa, Polska 1997), EN-ISO-1120:2012 (EN-ISO-1120:2012; Conveyor belts—Determination of strength of mechanical fastenings—Static test method; International Organization for Standardization; Geneva, Switzerland. 2012)). Textile-reinforced belts may be joined using hot vulcanization, cold bonding/welding, or mechanical fasteners, while steel cord belts are exclusively joined by hot vulcanized splices. A properly executed vulcanized splice (in accordance with standards or reference procedures) ensures the maximum possible splice strength relative to the nominal strength of the joined belts (up to 80% for textile belts, and up to 100% for steel cord belts).
Vulcanization requires specialized equipment (vulcanizing press) and is performed under controlled conditions: constant temperature (approximately 145–155 °C), high pressure (up to 2 MPa), and a defined time (depending on belt thickness). Despite the complexity and cost, vulcanized splicing is the most commonly used method due to its superior strength.
The cost of a single vulcanized splice ranges from 12,000 to 20,000 PLN (depending on belt type, width, and splice design), making the splicing market highly valuable. However, failure of even a single splice—among thousands in operation worldwide—can result in multimillion losses that far exceed the cost of splice execution. For example, halting copper ore deliveries to a processing plant due to a splice failure (with a repair duration of several hours) or exceeding a ship’s port docking time due to unloading issues may have significant financial consequences, such as reduced copper output or penalty fees for schedule overruns.
Quantifying such losses is difficult, as neither service companies nor end-users are inclined to share these data. Failures often stem from poor-quality splicing, either due to unqualified service providers, cost-driven selection of contractors, or inadequate training and compensation of in-house personnel. Another frequently overlooked cause is the failure to verify the proper functioning of the vulcanizing presses used during splice installation.
The Belt Transport Laboratory [
11] at Wrocław University of Science and Technology annually investigates the causes of defective splices. It is common for splices to fall short of the expected strength. One approach adopted by some belt manufacturers to mitigate this risk is to exceed the declared belt strength in practice. Splice samples may pass verification criteria relative to the declared belt strength, but not the actual, higher values. While overspecifying the belt strength ensures splice test success, it leads to heavier, stiffer belts, increasing energy consumption. Nevertheless, this approach safeguards system reliability and reduces failure-related costs, including production losses due to weak splices.
1.2. Factors Affecting Splice Durability and Reliability
The Ishikawa diagram (also known as a cause-and-effect diagram or “fishbone diagram”) is a well-established tool in the analysis of technological process quality and in the identification of potential problem sources [
12,
13]. In this study, the diagram presented in
Figure 3 was developed by the authors to systematically organize knowledge regarding the factors affecting the durability and reliability of conveyor belt splices.
The creation process of the diagram involved a review of the available literature on the use of Ishikawa diagrams in industrial applications [
14,
15,
16], as well as the analysis of the authors’ own experimental findings conducted at the Belt Transport Laboratory. Six main categories of causes were identified: workmanship quality, material quality, technical condition of vulcanizing presses, human and organizational errors, employee training levels, and environmental conditions.
The structure of the diagram was designed following the recommendations for the analysis of cornerstone root causes [
17], enabling a more comprehensive understanding of the complex relationships between primary factors and failure consequences. Identifying the main cause groups also facilitates the design of targeted corrective actions in the manufacturing and maintenance processes of conveyor belts.
In the literature on process quality management, it is emphasized that proper construction and analysis of an Ishikawa diagram not only allows the identification of existing problems but also supports the prediction of potential failure points in new industrial applications [
15,
16]. Therefore, the diagram developed in this study serves as a supportive tool for the subsequent stages of data analysis and the development of diagnostic methods.
Splices can suffer the same types of damage as the belt itself, but due to their design—higher stiffness, repeated rubber vulcanization, and reduced strength—they are more susceptible to both sudden impact damage (e.g., from falling rocks) and fatigue processes. Reduced rubber-to-cord adhesion in splices (due to double heating) and repeated bending over pulleys and idlers may lead to splice fatigue and strength degradation, eventually causing gradual separation (cords slipping out of the rubber) or sudden failure (cords tearing out under tension spikes during startup or belt blockage).
1.3. Current Diagnostic Methods for Conveyor Belt Splices
The assessment of conveyor belt splice quality is a critical aspect of conveyor system maintenance. Various methods have been developed to evaluate splice condition, each with specific advantages and limitations.
Visual inspection remains the most common method due to its low cost and simplicity. It involves checking the surface condition of the splice, looking for visible cracks, misalignment, or surface wear. However, after vulcanization, the internal structure becomes inaccessible, and visual methods cannot detect hidden defects or internal degradation. Moreover, the only measurable parameter post-vulcanization is the external distance between the locks, which may not accurately reflect the load-bearing length of the splice.
X-ray imaging offers a non-destructive means of visualizing the internal arrangement of steel cords and rubber layers. X-ray systems can detect internal misalignments, cuts, and discontinuities, providing detailed images similar to physically exposed splices. However, X-ray inspection requires stationary, heavy, and costly equipment, along with adherence to strict radiation safety protocols, and, despite some efforts toward automation, does not offer standardized, automated evaluation of splice geometry.
Magnetic methods have been recognized as promising alternatives. Early studies [
18,
19] demonstrated the feasibility of detecting broken cords using magnetized belt monitoring. Recent developments, such as the DiagBelt system [
20], expanded magnetic diagnostics to detect both damages and changes in the splice geometry under operational conditions. Magnetic methods offer non-destructive, real-time monitoring possibilities without the need for belt disassembly or exposure to hazardous environments.
Mechanical approaches based on the force–displacement response have also been proposed to monitor splice integrity [
21]. By analyzing changes in mechanical behavior, early stages of fatigue or weakening can be inferred. Nevertheless, such methods typically require controlled testing conditions and may not be easily applicable for online monitoring.
Finite element method (FEM) simulations have been used to better understand the stress distribution and failure mechanisms in splices [
22]. Although FEM allows detailed modeling of the splice structure and prediction of weak points, it is computationally intensive and relies heavily on accurate input data regarding material properties and geometry.
IoT-based condition monitoring systems have recently been proposed, aiming to integrate sensors and wireless data transmission for real-time assessment of splice health [
23]. While promising, IoT solutions are still under development and face challenges related to sensor durability, data interpretation, and system integration in harsh industrial environments.
In summary, while traditional methods like visual and X-ray inspection provide valuable information, they suffer from limitations such as subjectivity, lack of internal access post-vulcanization, high costs, and operational constraints.
Magnetic diagnostics, for example the DiagBelt+ system tested in this study, represent a significant advancement, enabling objective, repeatable, and non-invasive assessment of splice geometry and quality during conveyor operation.
Although electromagnetic methods based on magnetic remanence or magnetic flux leakage have been used for several decades to inspect steel cord conveyor belts, the traditional systems developed in the early 1980s had significant technical limitations [
18,
19]. These earlier systems generated a one-dimensional signal with relatively low resolution [
24], requiring extensive manual interpretation by trained engineers. The signal represented changes in the magnetic field around potential defects but did not allow for direct visualization of splice geometry [
25,
26,
27]. Moreover, manual signal analysis was tedious and prone to errors due to operator fatigue and the difficulty of detecting subtle anomalies across long belt sections.
In contrast, the DiagBelt+ system proposed in this study introduces significant technical improvements: it provides two-dimensional visualization of the recorded magnetic signal, improving interpretability and enabling the detection of both localized damage and changes in splice geometry. The system achieves a higher spatial resolution and automated signal acquisition and facilitates the development of classification algorithms that can further automate the assessment process. By reducing the reliance on manual analysis and operator experience, DiagBelt+ increases reliability, repeatability, and objectivity in splice quality evaluation.
1.4. The Need for Diagnostic Tools for Splice Quality Verification Failure
Risk increases when a splice is improperly executed. Critical factors include the splice length, step count, cord layout, workmanship precision, equipment used, and vulcanization conditions [
20,
28,
29]. To mitigate these risks, it is essential to introduce diagnostic procedures and equipment for routine verification of the splice quality, benefiting both end-users and service providers. Not all workers align with their employer’s goals, so routine diagnostic inspection of belt splices using methods that visualize splice geometry (cord cut accuracy and alignment) is a crucial step toward reliable conveyor operation.
Despite the critical importance of splice integrity for conveyor system reliability, there is currently a lack of practical tools for verifying the quality of splice execution, particularly during acceptance testing of work performed by external contractors. While video documentation of the splicing process is theoretically possible (similar to the recording of police interventions), it is challenging to implement consistently in industrial conditions.
Moreover, there are no established methods for routinely monitoring changes in splice condition during operation. Splices are subject to mechanical damage and cumulative fatigue processes, including repeated bending over pulleys and idlers. Degradation phenomena such as reduced adhesion between the rubber matrix and the steel cords (caused by contamination, poor material quality, or improper vulcanization) may lead to cord pull-out and splice elongation over time. These changes typically remain undetected until critical failure occurs.
Therefore, there is a pressing need for non-invasive diagnostic tools that can be used both during initial splice acceptance and for ongoing monitoring during conveyor operation. The central objective of this study is to evaluate the potential of the DiagBelt+ magnetic diagnostic system as a tool for assessing splice geometry and quality, both immediately after installation and throughout the operational life of conveyor belts.
2. Materials and Methods
The DiagBelt+ diagnostic system, developed at Wrocław University of Science and Technology and implemented under industrial conditions, is based on a magnetic method that enables the assessment of the technical condition of belt segments within a closed loop. It is capable of locating and identifying damage in conveyor belt sections. Until now, however, it has not been applied to the assessment of conveyor belt splice integrity.
The system consists of two permanent magnet bars positioned close to the belt surface (approximately 30 mm) and a measurement head equipped with inductive magnetic coils. Magnetization of the steel cords within the belt core generates a magnetic field around them, and any discontinuity in a cord alters the shape of this field. These alterations are detected by the coils in the measurement head. Additionally, the system includes an encoder that tracks the position along the belt loop (or relative to the splice), enabling precise localization of signal occurrences.
Figure 4 shows a frame from an animation illustrating the operation of the system.
A detailed explanation of the system’s operation can be found in references [
30,
31,
32]. Validation of the DiagBelt+ system’s diagnostic reliability was performed under both laboratory [
32] and industrial conditions. In the laboratory setup, the stability and repeatability of the recorded signals for different measurement parameters confirmed the system’s robustness and measurement credibility when assessing splice geometry on the test conveyor belt. Additionally, further validation was conducted as part of a research grant focused on conveyor belt damage detection. During this project, defects detected by the DiagBelt+ system were verified by physically exposing the steel cords by milling off the top rubber cover prior to belt refurbishment. Visual confirmation of the damage, corresponding to the anomalies detected magnetically, demonstrated the system’s ability to reliably identify internal defects and changes in the belt’s core structure. Selected verification images are presented in [
33].
The algorithms implemented in the system previously enabled in-depth analysis of the belt segment condition but had not been applied to splice evaluation. The first attempts in this direction were undertaken by the authors, who analyzed signals generated at splice locations—areas that, as full cross-sectional discontinuities of the cords, also cause alterations in the magnetic field. These results were published in [
34]. At that time, due to the lack of possibility to confirm the actual distances and signal dimensions, and because of many adjustable measurement system parameters (sensitivity threshold, distance of the head from the belt) [
31] and the variable speeds of tested belts, it was not possible to develop and validate a model capable of identifying the actual geometry of the splices based on system readings.
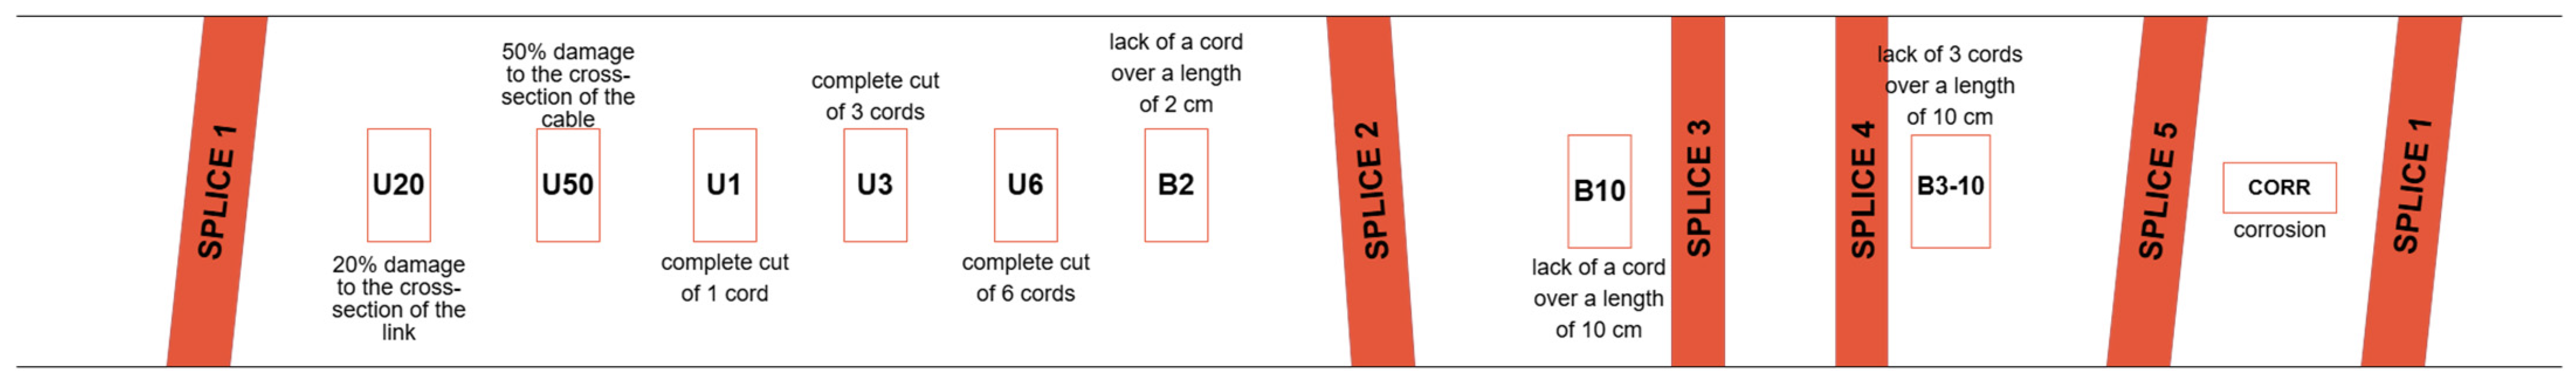
In the Belt Transport Laboratory at Wrocław University of Science and Technology, an ST2500 conveyor belt is available for testing. It is 40 cm wide and approximately 17.8 m long, with five splices fabricated along its length—three scarf splices and two straight splices. The splice layout on the test belt is shown in
Figure 5.
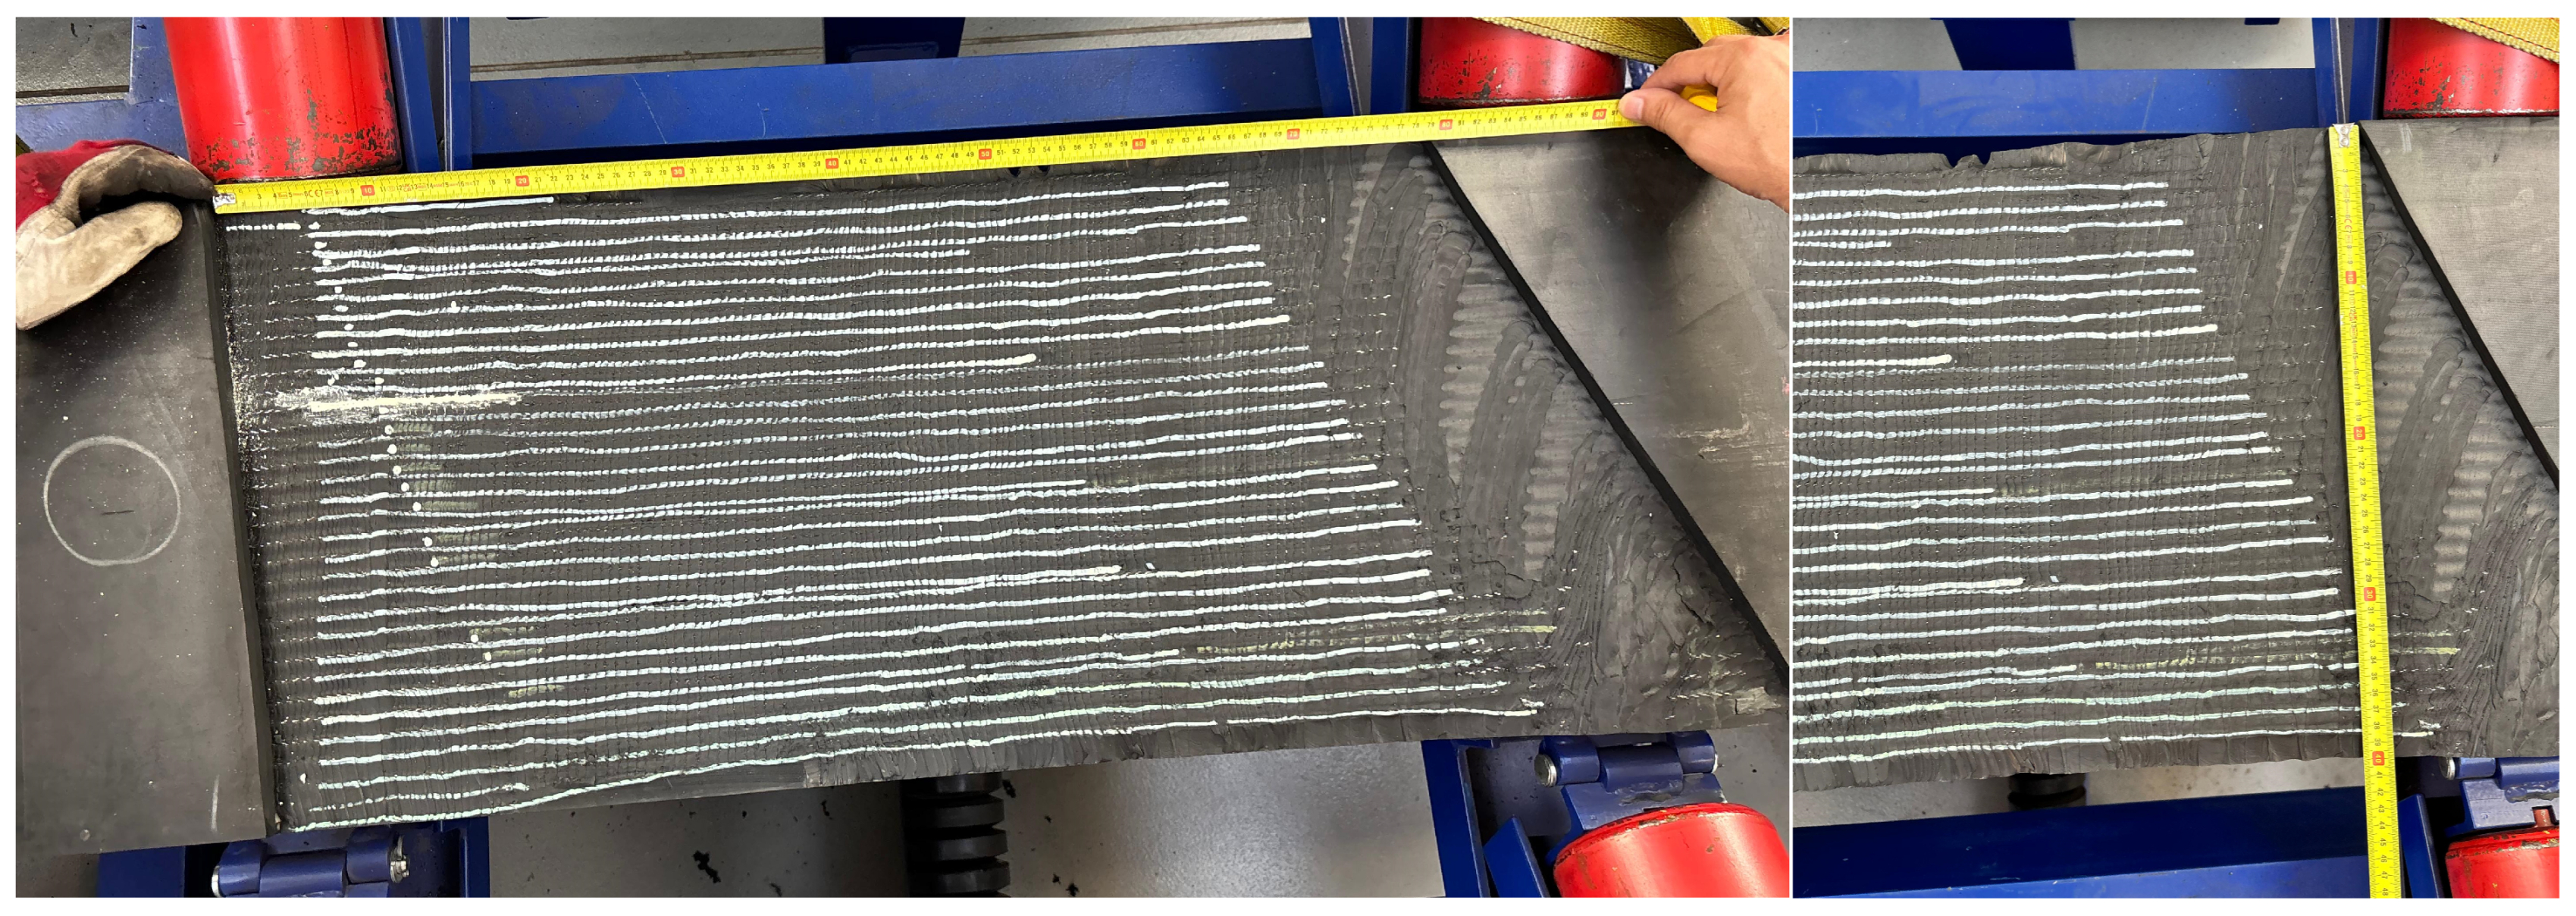
To enable data verification, three splices were milled from the carrying cover side to expose the cords, and the lengths of each splice were measured. The exposed straight and bias splices are shown in
Figure 6 and
Figure 7.
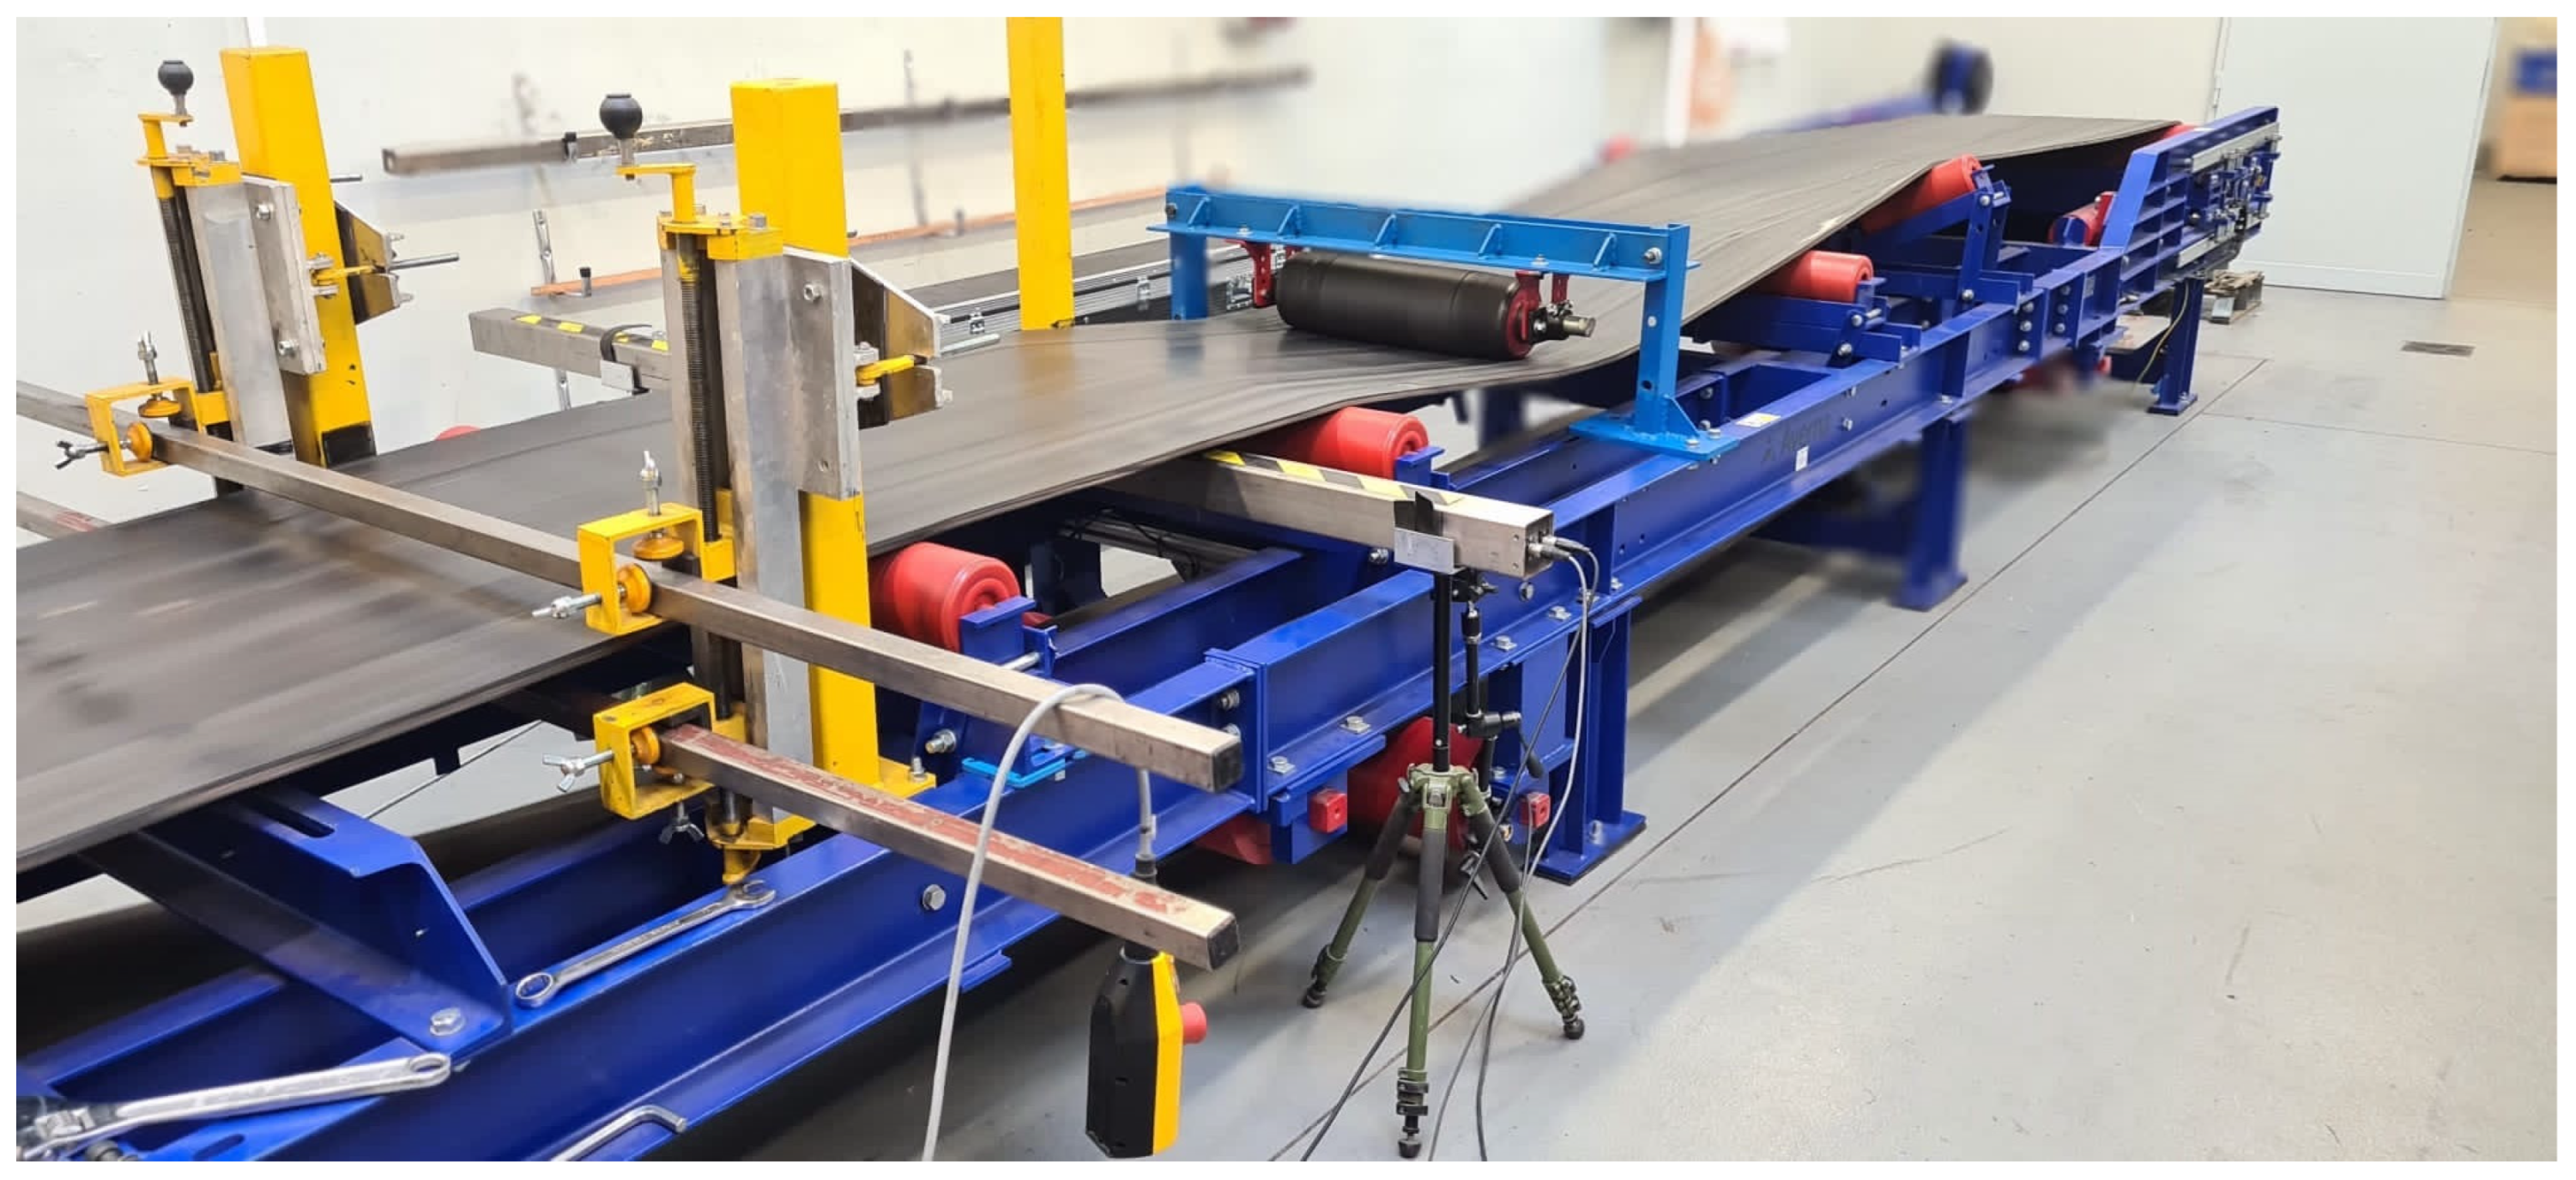
Then, the DiagBelt+ magnetic system was installed on the laboratory conveyor, with the measurement head positioned at a distance of 20 or 30 mm from the belt surface.
This range was selected to balance measurement quality and operational safety: smaller distances increase the risk of damaging the measurement head due to belt vibrations, whereas greater distances cause significant weakening of the recorded signal, making its interpretation difficult. To minimize belt vibrations during operation, a guide roller was installed on the running side.
The belt speeds were set to 1, 2, 3, and 4 m/s, which correspond to typical industrial conveyor speeds and are achievable within the laboratory setup. For each speed, the sensitivity threshold of the system was adjusted to levels 2, 4, or 6, with 50 measurement loops performed for each parameter set.
The sensitivity thresholds were selected to ensure clear visibility of core damage signals, following practices used in industrial conditions. A threshold setting of 2 results in a highly spread signal due to increased sensitivity, while at a setting of 6, some defects may become invisible depending on the belt speed.
The methodology for selecting appropriate measurement parameters based on the belt type (e.g., speed and steel cord diameter) is described in [
31]. The laboratory setup used during the experiments is shown in
Figure 8.
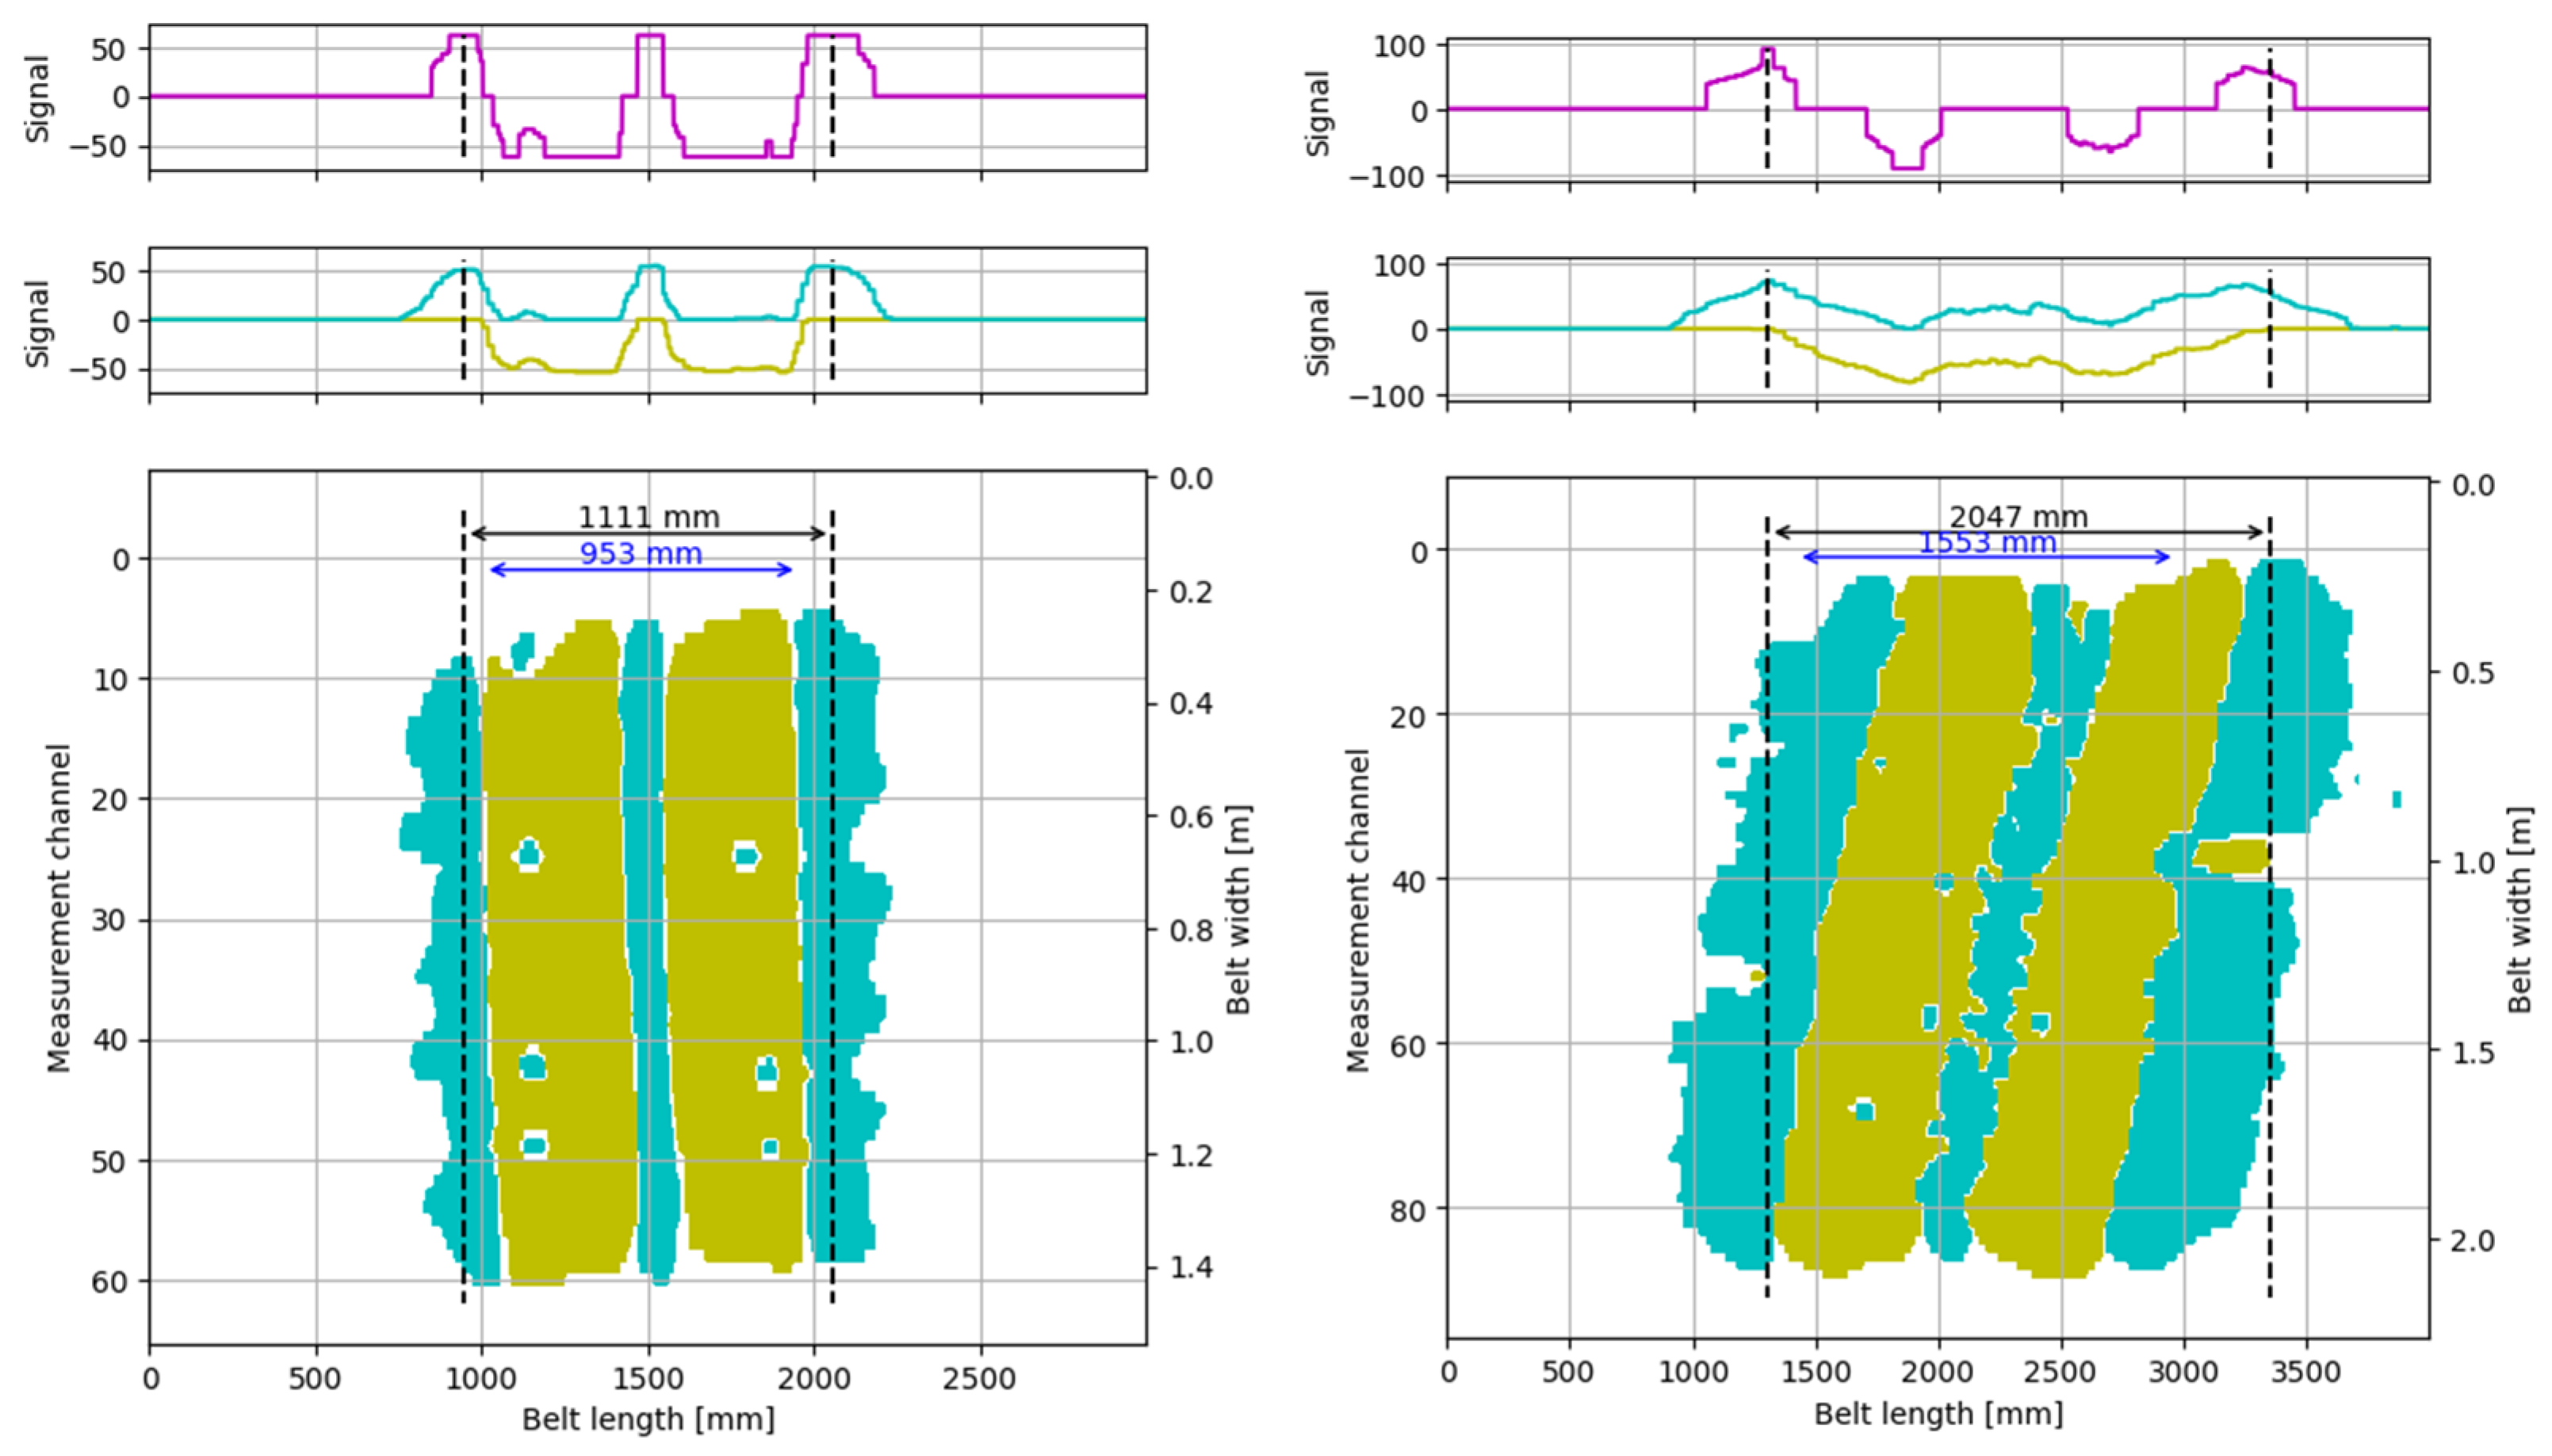
An example of a single measurement loop for various parameter sets is presented in
Figure 9. In the DiagBelt+ system, the data acquisition rate is constant at 400 Hz, which corresponds to one data point recorded approximately every 2.5 mm of belt travel at a belt speed of 1 m/s. In
Figure 9, the starting point of the loop was aligned with the beginning of the positive polarity signal from splice 2. Due to changes in the system’s measurement parameters, particularly the sensitivity threshold, the recorded signal width and shape can vary, resulting in apparent visual differences in the displayed length of the splice region across the graphs. However, the physical loop length remains unchanged, regardless of the starting point chosen for visualization. The purpose of presenting these graphs is to illustrate that the appearance and extent of the recorded signal are influenced by the measurement settings, not by changes in the actual geometry of the splice.
In each loop, the signals corresponding to the belt splices were measured—using the width of the yellow signal (representing the negative polarity of the magnetic field), as shown in
Figure 10.
3. Results
To assess the impact of the measurement system parameters on the variability of the recorded w-y-y signal, a statistical analysis was conducted based on data from 50 repetitions of the experiment for each unique configuration of measurement conditions. The factors considered were the following:
Splice number (splice);
Measurement head distance (g [mm]);
Measurement speed (v [m/s]);
System sensitivity threshold (s).
For each combination of these parameters, basic descriptive statistics of the w-y-y variable were calculated, including the number of observations, mean, median, standard deviation, extreme values (min, max), and interquartile range (IQR). The values are presented in
Table 1.
The analysis showed that the value of the w-y-y signal is characterized by a relatively low level of variability under repeatable experimental conditions. In most cases, the standard deviation did not exceed 12 mm, and the differences between the mean and median values were insignificant, which may suggest a symmetrical distribution of the data and the absence of significant outliers.
No clear influence of the sensitivity level (s) on the data spread was observed—both in terms of absolute values and dispersion indicators (std, IQR).
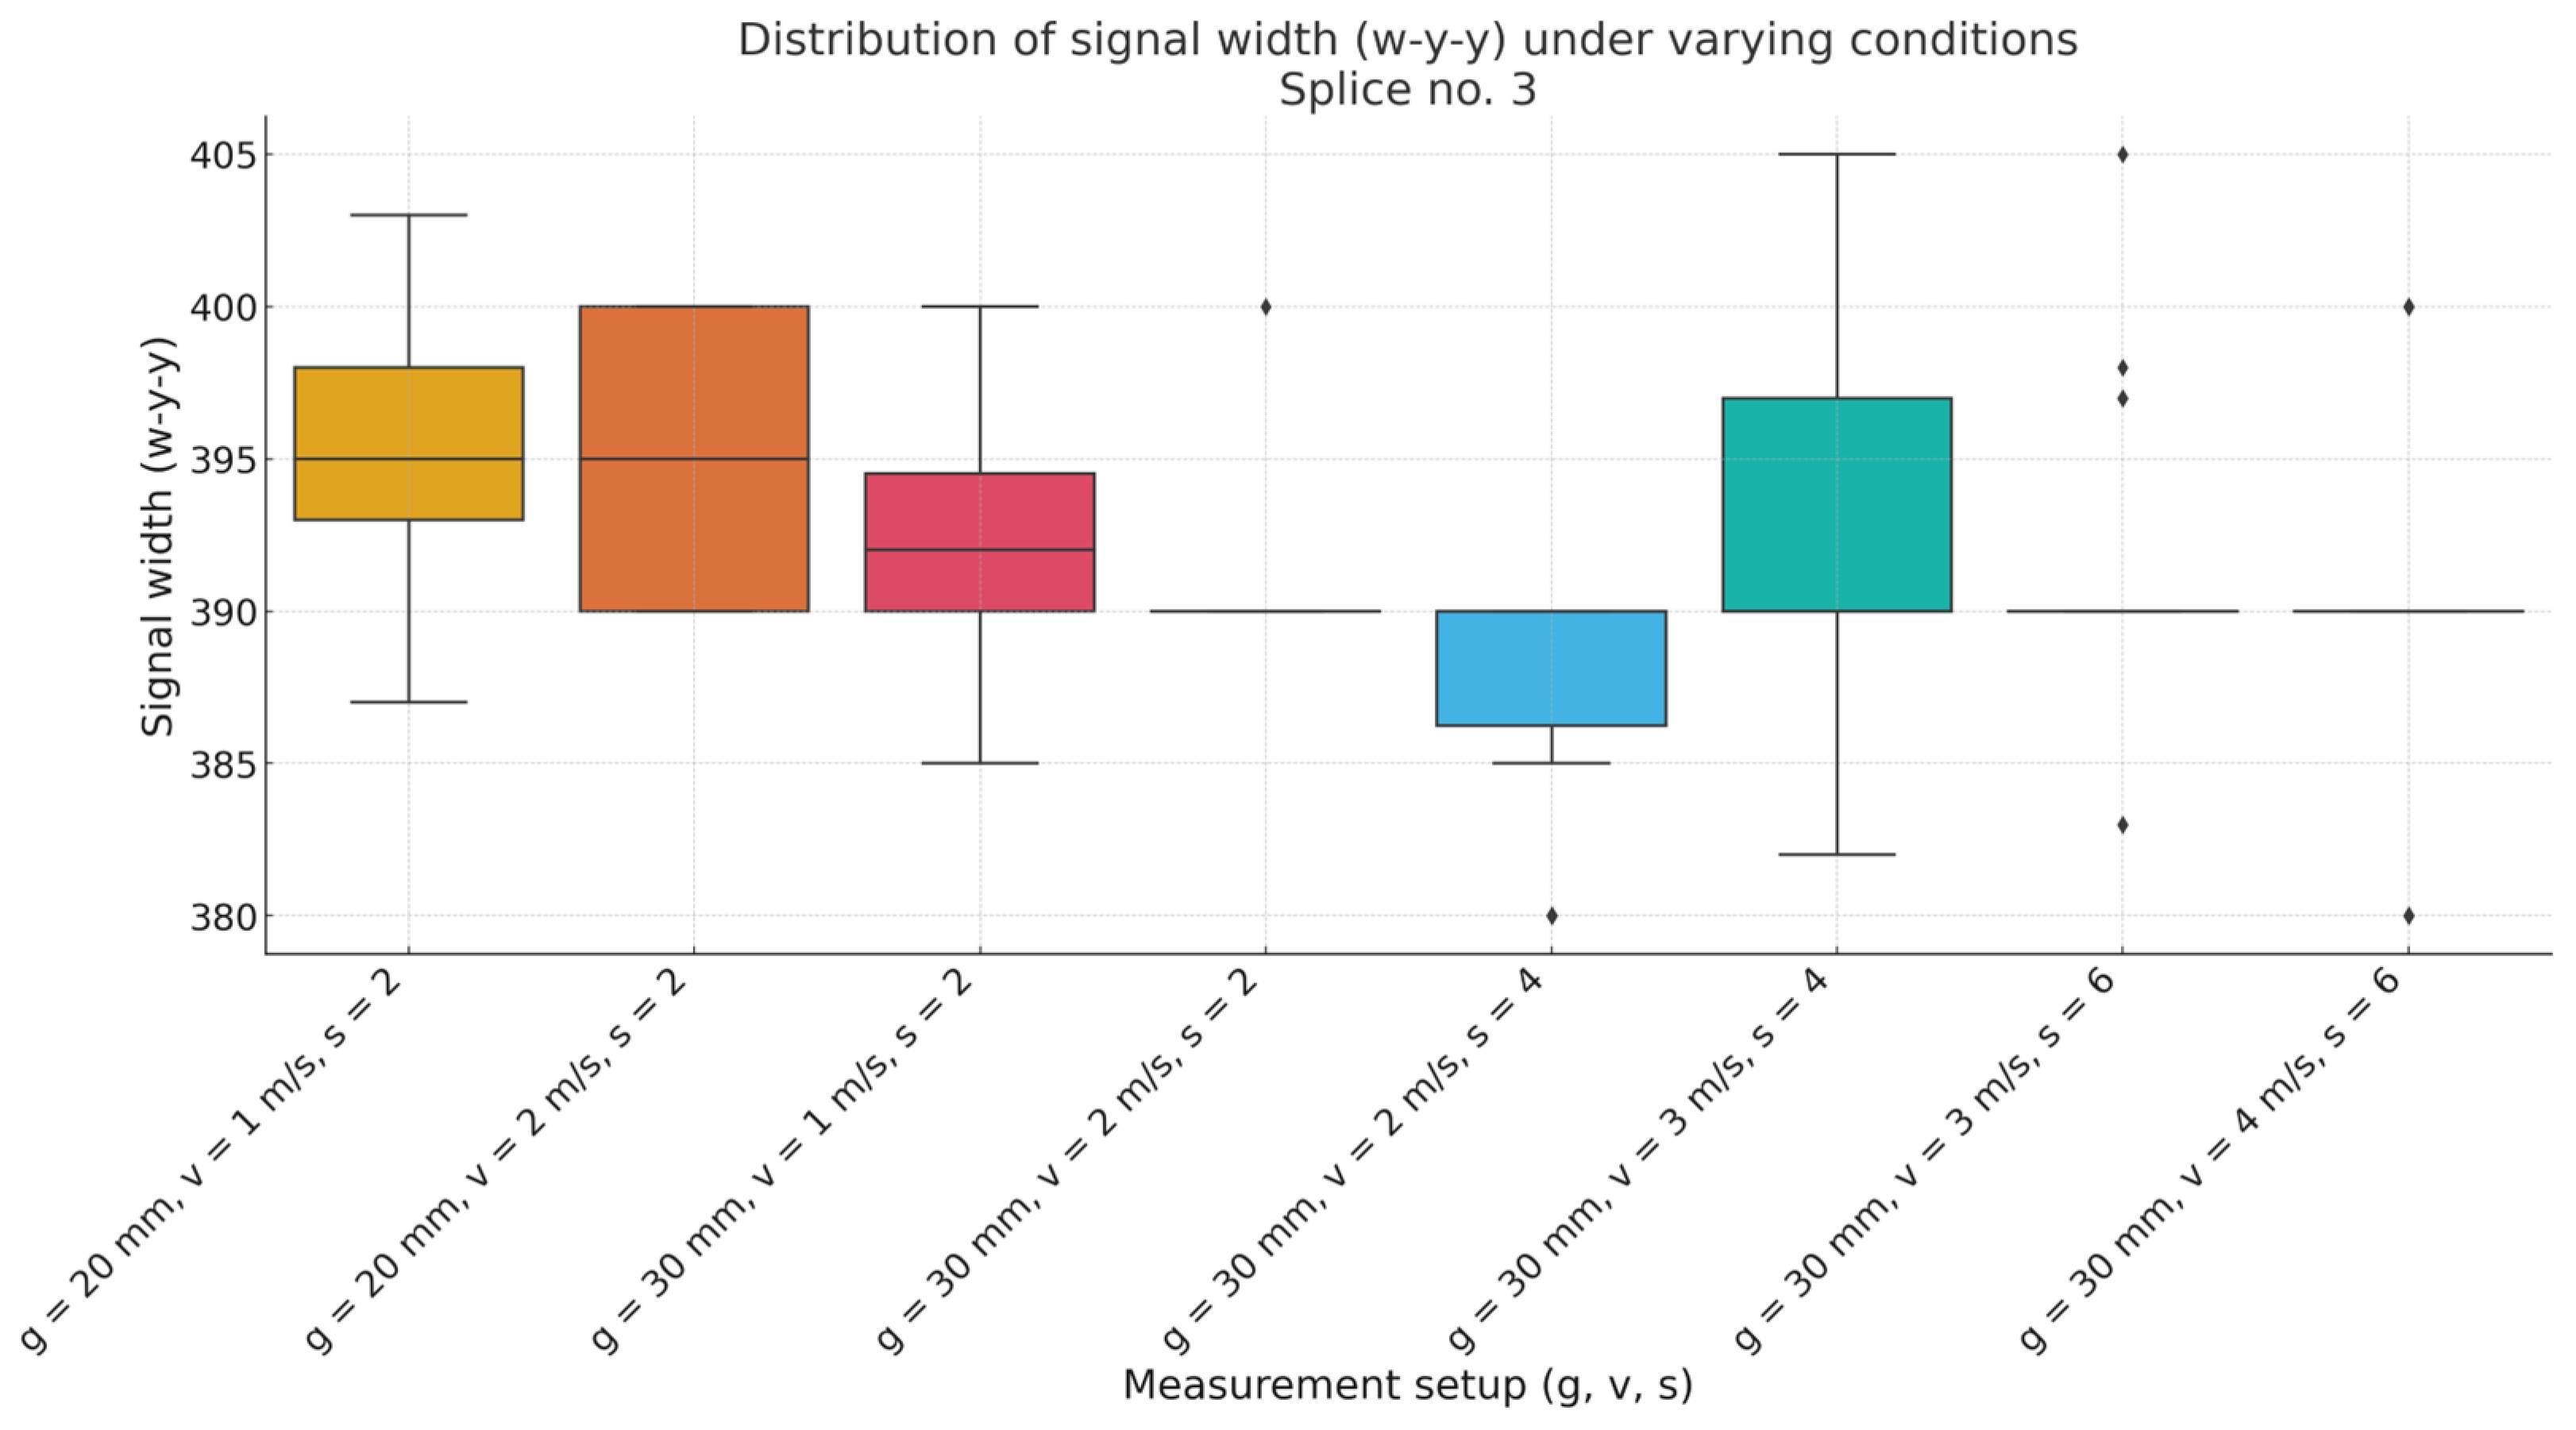
To visualize the influence of measurement parameters on the w-y-y signal, an example for splice no. 3 is shown (
Figure 11). The box plot shows the signal distribution for different combinations of g, v, and s. The visible stability of the results suggests that these parameters do not significantly affect the variability of the signal.
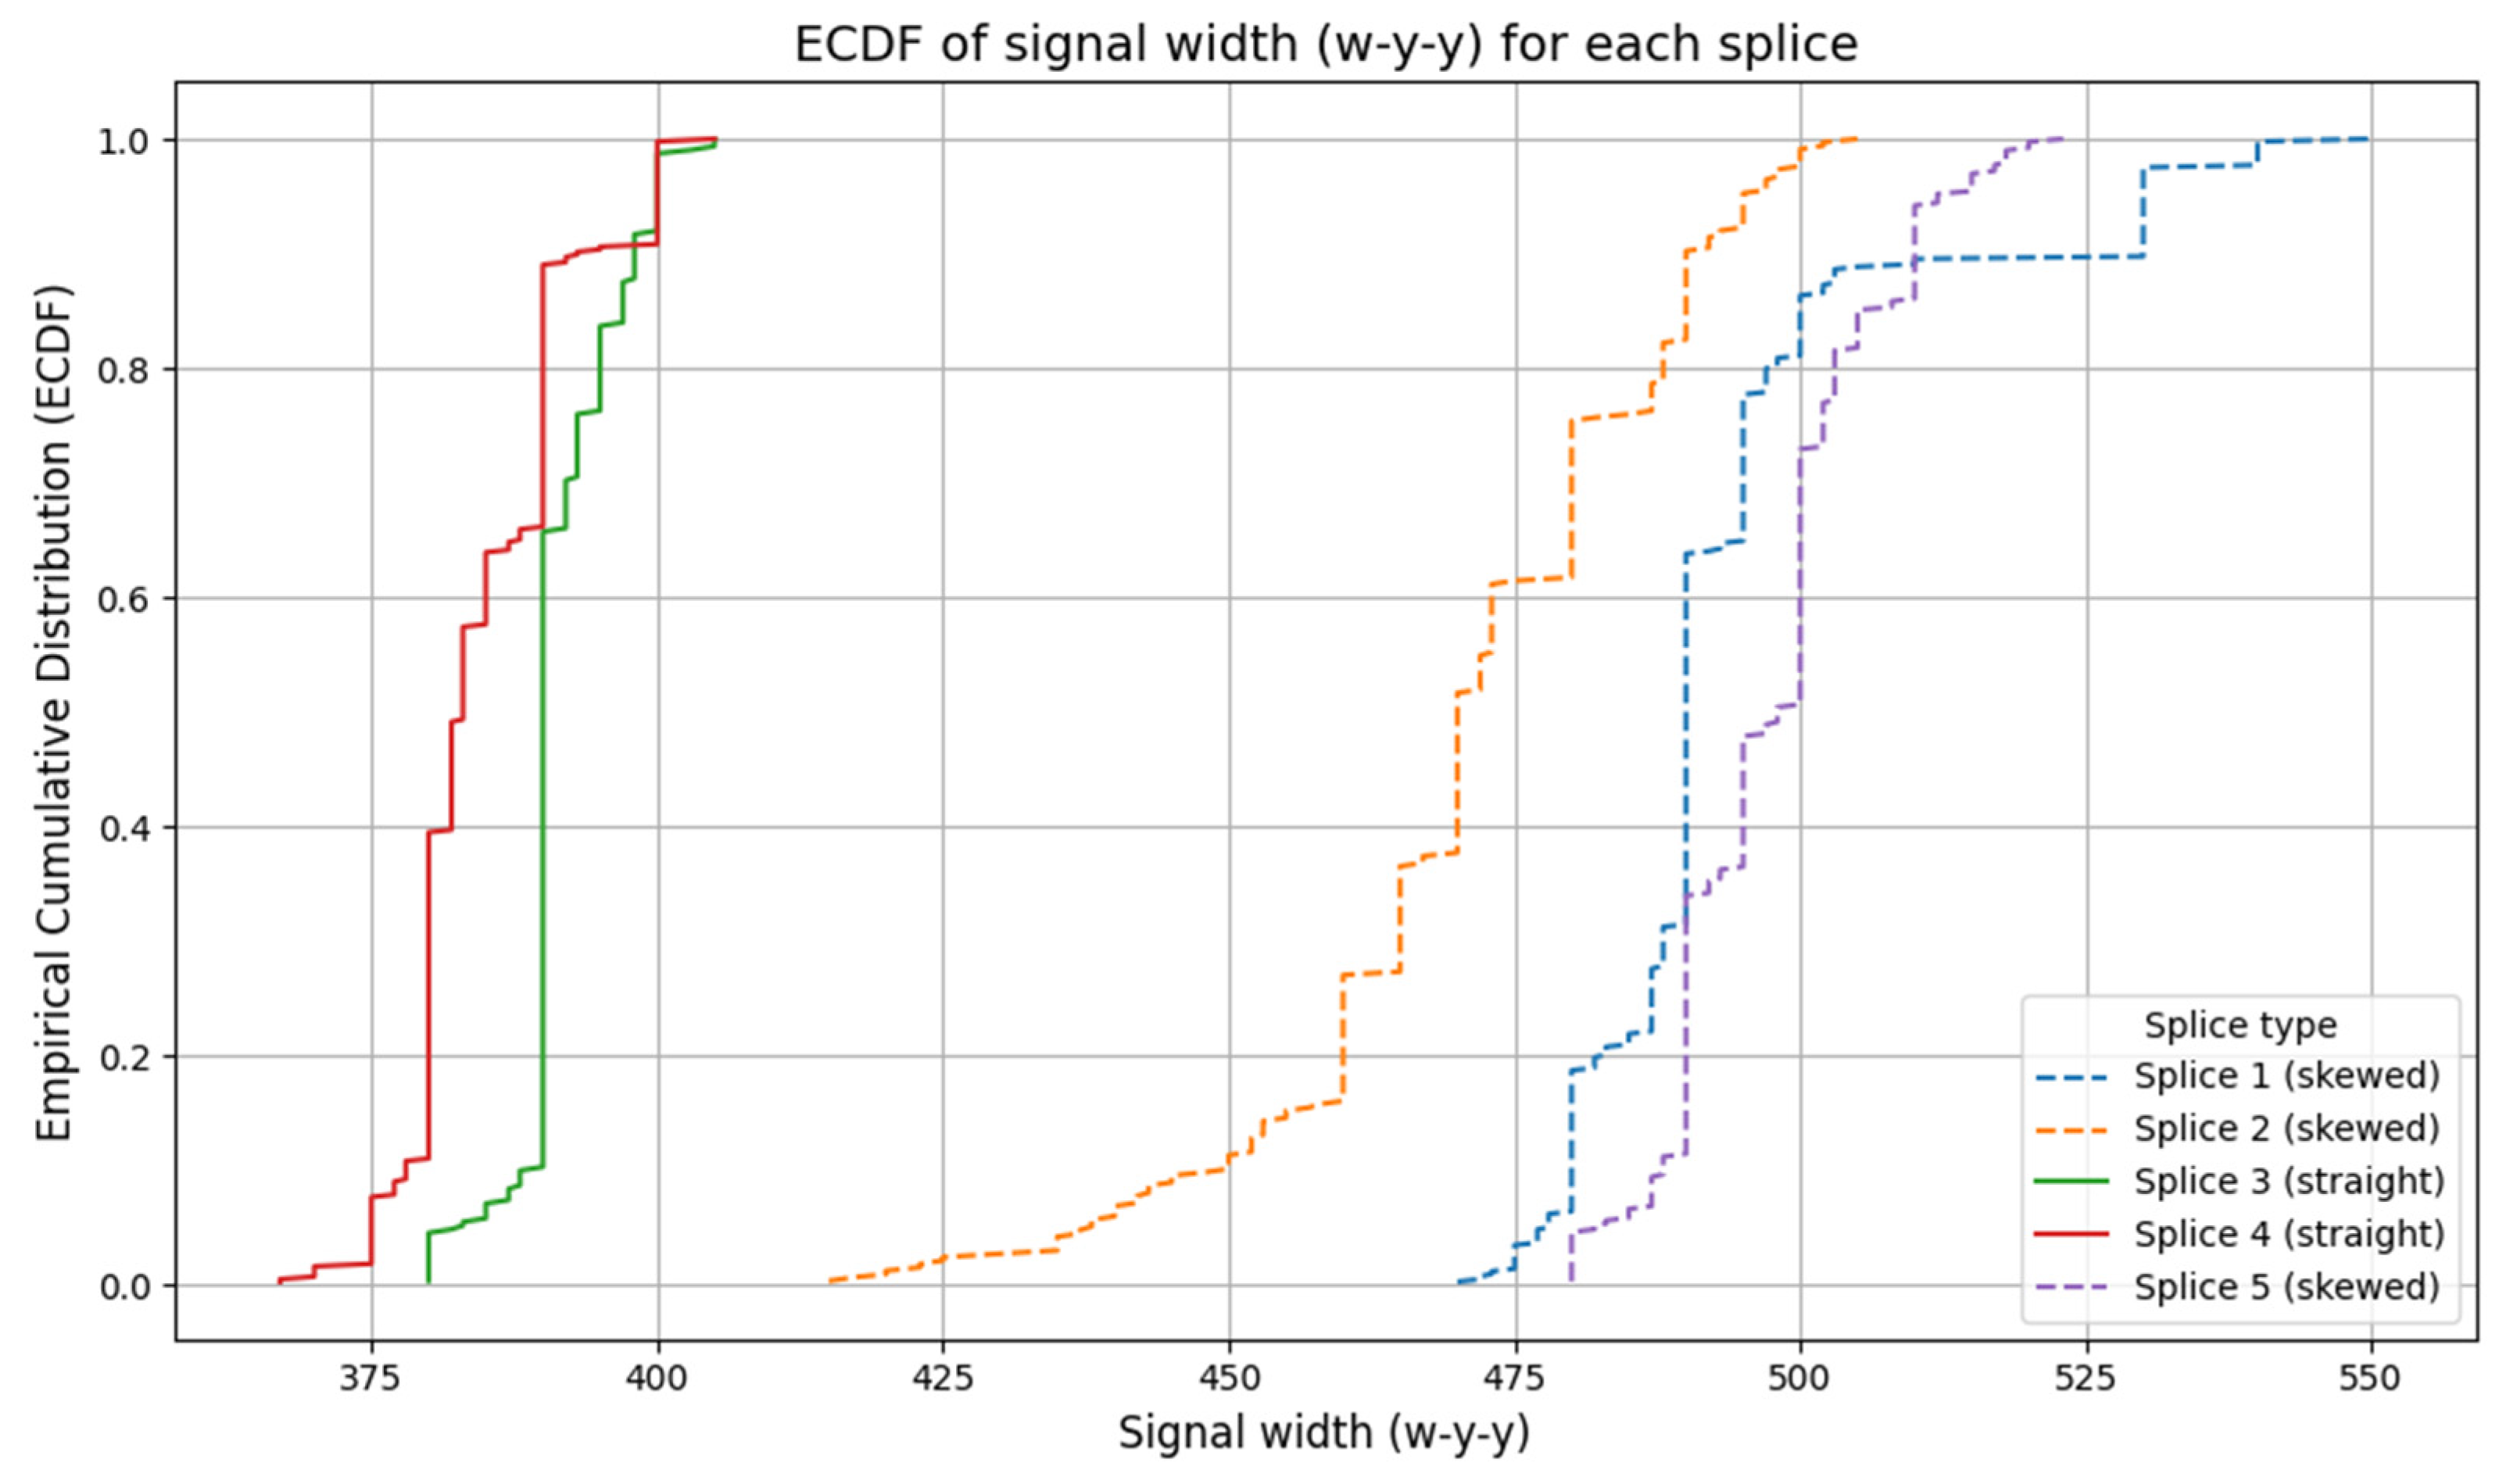
In order to assess the spread of the w-y-y signal between different splices, empirical cumulative distribution functions (ECDFs) of this variable were plotted separately for each splice. The ECDF is a tool that allows for a full visualization of the measurement data distribution without assuming a specific statistical model.
Figure 12 shows the empirical distributions for the five splices. Individual splices are marked with different colors, and the line type corresponds to the splice geometry: solid lines represent straight splices, while dashed lines represent scarf splices.
The shape of the ECDF curves indicates low variability of the w-y-y signal within each splice—the steeper and more vertical the ECDF curve, the more concentrated the measurement values are around the median. In the analyzed cases, the distributions are very similar in shape, suggesting that neither the geometry of the splice nor its number significantly influences the distribution of signal width.
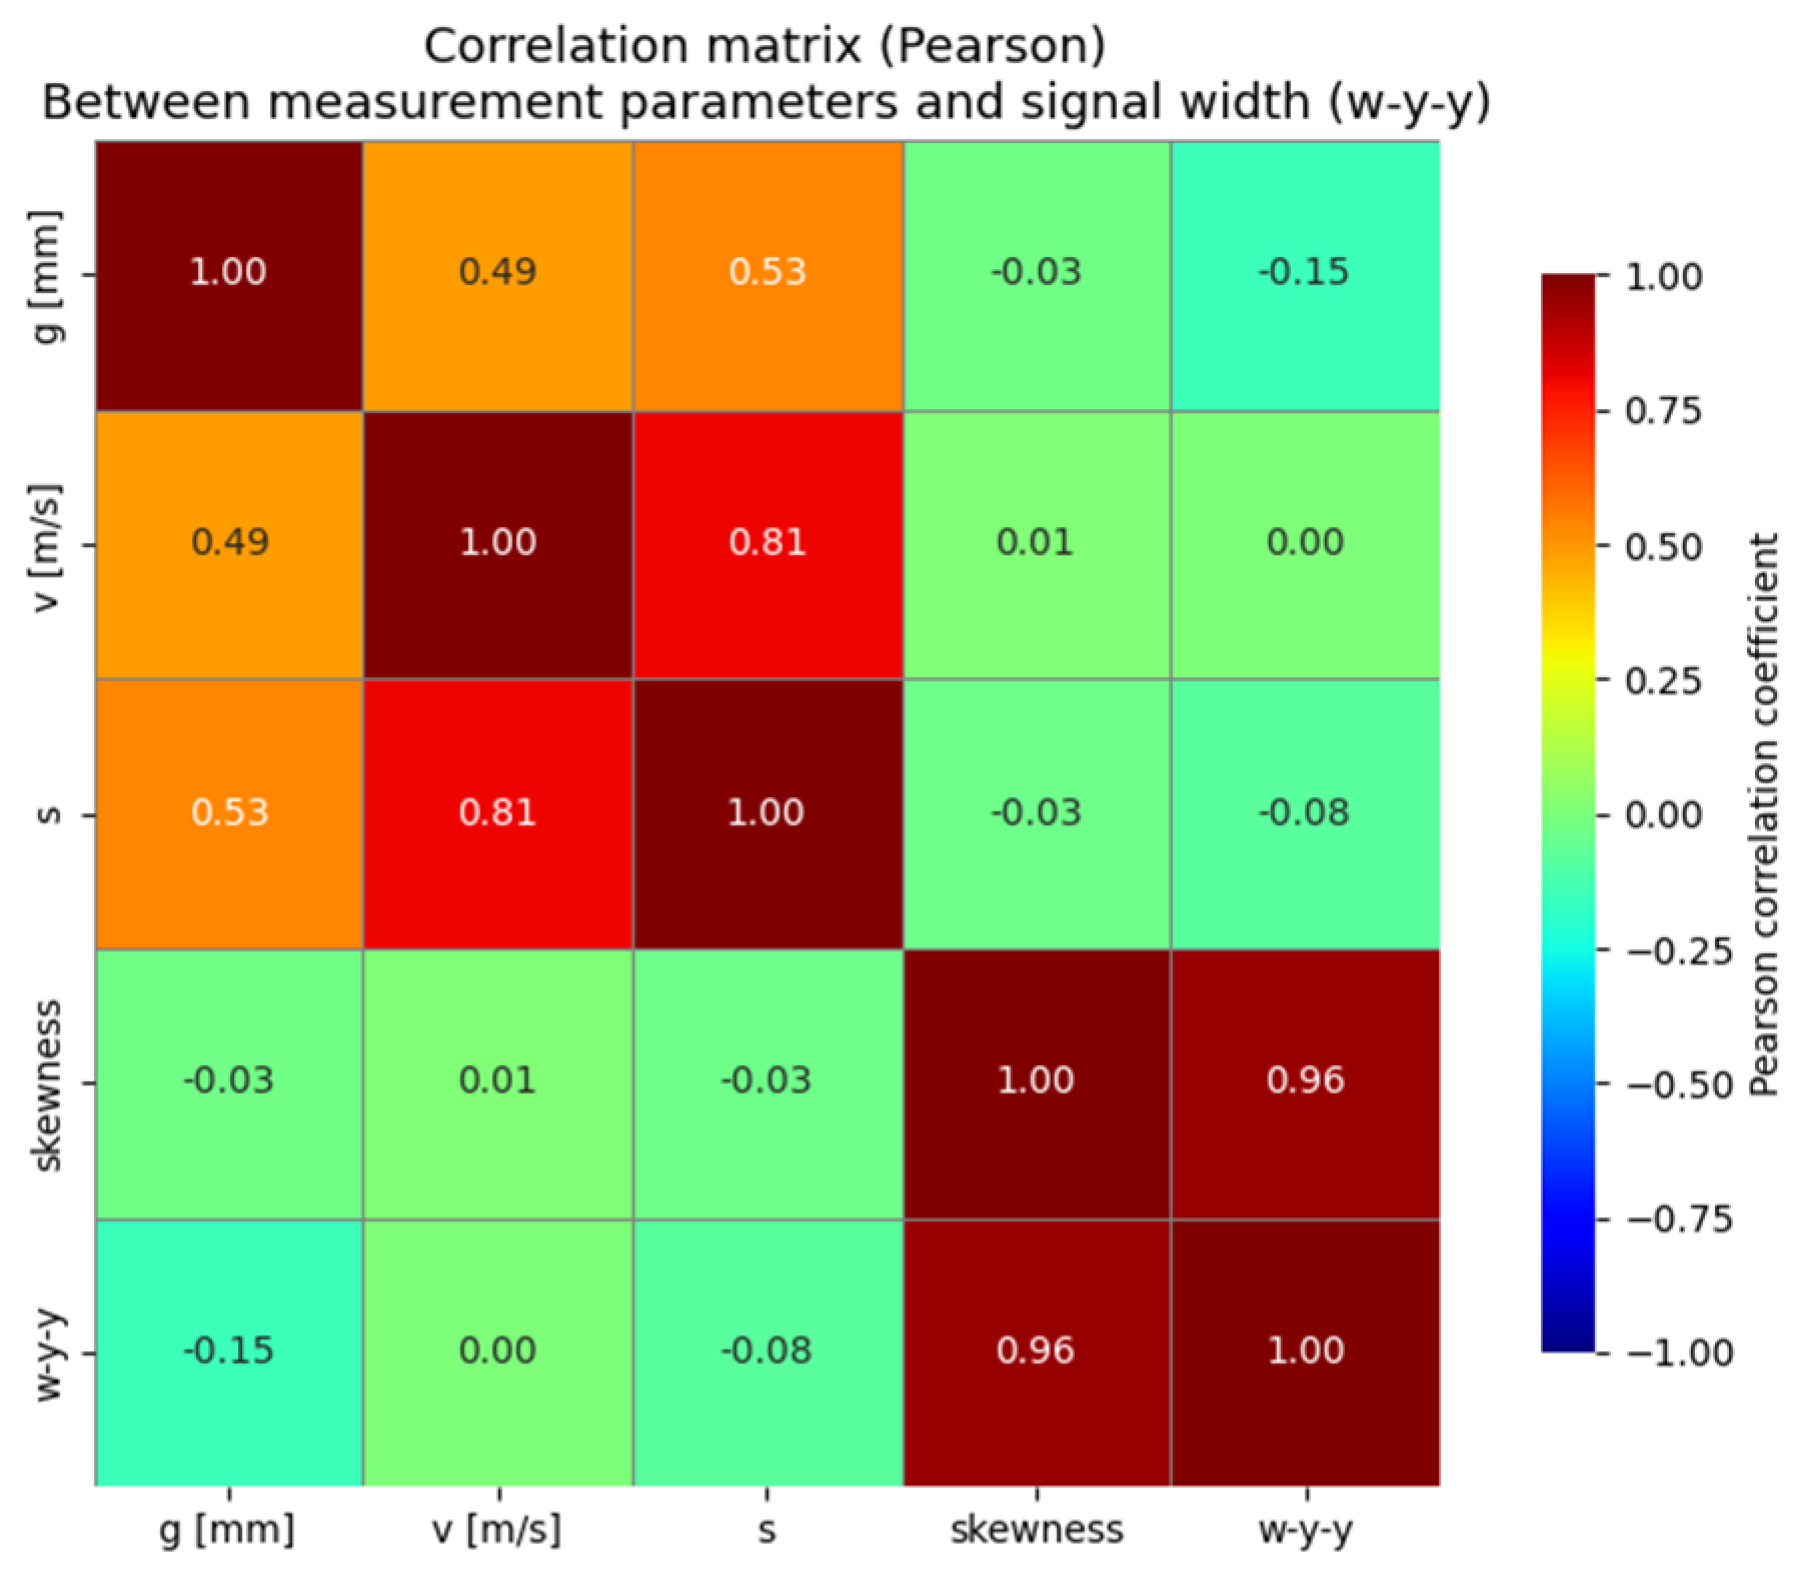
To investigate potential relationships between the w-y-y signal width and the parameters of the measurement system, Pearson correlation coefficients were calculated between the system operating parameters (g [mm], v [m/s], s) and the binary skewness variable. The results are presented in
Figure 13 in the form of a correlation matrix.
The obtained correlation coefficients between w-y-y and all analyzed variables fall within the range from −0.15 to 0, which clearly indicates the absence of significant linear relationships. The highest observed correlation was between the w-y-y signal width and the distance of the head from the belt, which is justified by the shape of the magnetic signal, but its value remains statistically insignificant from a practical interpretation standpoint.
A particularly important observation is that the skewness of the splice (a binary variable taking values 0—straight splice, 1—scarf splice) shows no significant correlation with the signal width, which is also reflected in the earlier graphical analyses (ECDF, box plot). Therefore, it can be concluded that neither the geometry of the splice nor the basic parameters of the measurement system have a linear influence on the examined signal feature.
4. Discussion
The primary objective of the conducted research was to evaluate the influence of selected measurement parameters of the DiagBelt+ magnetic diagnostic system on the stability and repeatability of signals recorded at the locations of conveyor belt splices. The experiments were carried out under controlled laboratory conditions using a belt with five splices of known geometry (both straight and scarf), tested at different belt speeds, measurement head distances, and system sensitivity thresholds.
The results clearly indicate that the width of the w-y-y signal, corresponding to the magnetic response of the splice, is highly stable under varying measurement conditions. The standard deviation values were generally low, not exceeding 12 mm in most configurations, and the relationship between the mean and median values, as well as the interquartile ranges (IQRs), suggested that the data distribution was symmetrical and free of significant outliers. Importantly, the Pearson correlation analysis confirmed that measurement parameters such as the belt speed, head distance, and sensitivity threshold did not significantly influence the signal width. Similarly, the splice geometry (straight vs. scarf) showed no substantial impact on the variability of the recorded signal.
Although minor fluctuations in the recorded signal widths (w-y-y) were observed during the experiments, their impact was carefully analyzed. The use of the median value, rather than the arithmetic mean, in the statistical analysis was intended to minimize the influence of potential measurement errors or outlier events. Median-based analysis ensures a more robust estimation of the central tendency, particularly when dealing with non-Gaussian distributions or occasional anomalies caused by belt vibrations or local magnetic field disturbances.
In the case of scarf (angled) splices, slight increases in signal width variability were observed. This can be attributed to the geometric arrangement of the cords: due to the splice angle, the discontinuities at the cord terminations are staggered along the belt length, resulting in magnetic field variations that may be simultaneously detected across multiple measurement channels. As a result, the effective region of signal disturbance appears slightly extended compared to straight splices, where the terminations are aligned perpendicularly to the belt travel direction.
Nevertheless, the overall low interquartile ranges (IQRs) and standard deviations obtained across all splice types and measurement conditions confirm the high stability and reliability of the DiagBelt+ system’s signal acquisition process.
These findings highlight the robustness of the DiagBelt+ system in recording repeat and consistent magnetic signatures from belt splices under different operational settings. The results form a strong basis for further research focused on the automated classification of splice types and conditions, using signal analysis methods. Such capabilities would significantly enhance the reliability and efficiency of splice quality verification in industrial conveyor systems.
5. Conclusions
Currently, no diagnostic methods are available for the measurement and monitoring of splice geometry changes during conveyor belt operation. This represents a critical gap in industrial maintenance practices, where early detection of splice degradation could prevent costly system failures and production downtime.
This study introduces an innovative application of the DiagBelt+ magnetic diagnostic system, expanding its traditional role from damage localization to the non-invasive assessment of splice geometry and quality. By systematically analyzing the influence of key measurement parameters on the recorded signal’s stability, this research demonstrates that splice conditions can be reliably assessed without the need for belt disassembly or physical exposure.
The practical implications of the findings are significant. The demonstrated stability and repeatability of the recorded signals under different operational conditions suggest that the DiagBelt+ system could be used for routine quality verification of newly installed splices and for continuous monitoring of splice integrity during conveyor belt operation. Such an approach would provide end-users and service providers with a reliable, non-invasive tool for maintaining conveyor system reliability and minimizing the risk of unexpected failures.
From an academic perspective, this research opens up new directions for the development of advanced diagnostic and classification algorithms capable of detecting not only standard damage but also subtle changes in splice geometry. In subsequent stages of the research, we plan to expand the experimental dataset by introducing controlled defects into splices and to develop machine learning models for automated assessment based on magnetic signal profiles.
Furthermore, by analyzing the repeatability of measurements and identifying the factors that can influence signal stability, this study provides important guidelines for optimizing measurement settings to avoid disturbances during data acquisition. Such optimization enhances the reliability of the collected data regarding splice dimensions and potential risks. Ultimately, it opens up the possibility of developing early-warning procedures and alarm systems for splice degradation based on real-time magnetic signal monitoring.


