Abstract
Mining and stone processing activities generate a large amount of various types of waste. Among these, Stone Waste Sludge (SWS) constitutes 22.5 percent of the raw material processed and is disposed of by delivering it to now disused quarries with significant landscape and environmental consequences. This paper describes research aimed at identifying the possible uses of this waste, transforming it from a waste to a resource for the production of building blocks. The production of such building blocks is based on historical preparations of mixtures for artificial stone and is developed through an experimental approach and a simple and economical production methodology. Mixes consisting mainly of SWS and Portland cement (PC) were designed and tested. The aggregates and PC were mixed, wetted, and compacted under high pressure in special molds to form the specimens. The design of the mixtures and related tests aimed to define the process parameters considered such as the amount of water (W), the ratio of PC to SWS, and the compaction pressure. The compressive strength of the manufactured specimens at the age of 28 days was identified as the response variable. The results indicated that all of the mixtures had high mechanical strength values even when using high amounts of SWS relative to the amount of PC and that all of them have excellent characteristics for use as building elements in construction. This implies that such waste has an excellent potential for large-scale reuse in construction and encourages further research and testing, both in terms of the thermo-hygrometric properties of such elements and in terms of LCA analysis.
1. Introduction
The construction industry involves activities with some of the highest consumption of raw materials and significant waste generation [1,2,3,4,5,6,7,8]. According to the European Commission, it requires large quantities of resources, accounting for about 50 percent of all the materials extracted and accounting for more than 35 percent of the EU’s total waste production [9].
Among the various activities, particularly incidental is the production of natural stone building components and the production of cement mortars and concretes.
In relation to the production of mortars and concretes, according to the data from the Global Cement and Concrete Association, global concrete production amounts to about 14 × 1013 m3/year. This massive use leads to the predominant extraction of raw materials for cement and concrete aggregates, making them the most mined mineral resources globally [10,11].
The quarrying and processing of stone involves two primary mechanical processes that generate a significant amount of waste of various types: large waste and debris, granules, dust, and stone waste sludge known as marmettola (SWS). The waste generated from the cutting and processing of stone can range from a minimum of 35 percent to a maximum of 75 percent of the stone product, and on average, the SWS is 22.5 percent of the raw material processed [12].
Such waste is now a serious environmental problem because, if it is dumped on the ground, it can reduce the filtration rate of rainwater and degrade soil fertility, and if it is dumped into rivers, streams, and oceans, it contaminates the water [13].
Consequently, the need to reduce the extraction from nonrenewable sources, as well as the amount of products going to landfill, becomes an essential imperative to safeguard natural ecosystems for future generations [13,14,15].
To date, the main use of SWS is landfilling, but there are numerous studies and research conducted for their reuse in so many areas. These approaches consider the life cycle of the material and adopt circular economy principles.
For example, the potential applications include the use of SWS as a neutralizing agent for acidic wastewater in the glass industry [16], as a heavy metal removal agent for industrial wastewater [17], and in flue gas desulfurization in high-power industrial burners using both dry and wet technologies [18,19,20]. Within the construction industry, numerous studies highlight the use of stone processing waste as a secondary raw material in the formulation of innovative materials for the production of tiles [21], cement [22,23,24], mortar [25,26,27,28], concrete [29,30,31], and bricks [32,33,34]. In these formulations, SWS can replace or supplement cement and/or fine aggregate at different percentages. Its high fineness provides good mix cohesion, increases its workability, and reduces concrete’s permeability. In many cases, such experiments also involve the use of both organic and inorganic additives. In addition to the cement matrix, other studies involve the use of SWS in lime-based products [12], polymer matrix materials, and 3D printing materials [35].
In the literature, some reviews are available about the use of stone waste in concrete, studying the effect of the partial substitution of aggregates and cement in concrete. Some of them [36] carried out a portfolio of the state of the art on the reuse of ornamental stone and have investigated more the strengths and weaknesses of using stone waste in polymer composites, providing a waste stream classification. Others [37] have reviewed scientific contributions about the use of marble, including mining and processing waste, focusing on the impact of replacing traditional components with waste on the technological performance of concrete in its fresh and hardened state, such as its mechanical properties and durability. The results show that with the use of marble powder, with a replacement rate of 10%, the cement does not reduce the performance of concrete and mortars. When employed for the substitution of fine and coarse aggregates, marble waste can reach higher percentage contents, between 50% and 75%, optimizing the reuse of higher quantities of waste. Nevertheless, the geological nature of the coarse aggregates and the particle size distribution of the fine aggregates replaced by dust influence the final properties. It should be noted that the different chemical and mineralogical characteristics of the raw material from which SWS is produced determine the most appropriate application scenarios. In particular, it is possible to distinguish SWS from marble, SWS from granite, and SWS from limestone. Among the most common reuse scenarios are the following: the packaging of bricks and tiles with marble SWS [38,39] and granite SWS, sometimes fired with clay mixtures; the packaging of ceramics and stoneware with granite SWS [40]; and the packaging of concretes and mortars with marble SWS [41] and limestone SWS. However, little research has been performed on the possibility of using limestone SWS in the formulation of mixtures for the production of building blocks. Therefore, the contribution aims to investigate the possibility of manufacturing building blocks with the use of limestone SWS and products through simple and low-impact processes. With reference to the issues outlined, the paper describes the research pursuing the following objectives:
- Reduce the amount of raw materials mined, such as sand, for the production of mortars and cements.
- Reduce the amount of waste disposed of in landfills.
- Experiment with high-performance, low-cost construction materials with simple production processes.
These objectives have been achieved through the study and experimentation of innovative mixtures for the production of concretes and blocks using SWS aggregates that give high performance and recover waste from the supply chain.
The innovation of this study lies in the mix design approach, the production process, and the evaluation of the resulting properties. These characteristics have been compared with the current Italian regulations, and the potential applications of the tested products in the construction sector have been identified. The aim is to guide the construction and building materials industry towards innovative and circular solutions for the production of more sustainable building elements through the use and valorization of SWS. The results obtained show that it is possible to use significant quantities of such waste to produce building blocks that can be manufactured using few raw materials, without additives and using simple and inexpensive production processes. For example, no baking or energy-intensive production processes are required.
2. Materials and Methods
2.1. Design Approach
In the approach to studying the possibilities of using SWS as a raw material for building materials, some design guidelines have been defined as follows:
- Repurpose as much as possible the basic recipes historically used to make artificial stone.
- Use a cementitious matrix binder.
- Minimize the binder use.
- Produce mixes with few raw materials.
- Produce low-cost mixes.
- Use simple production processes that are already in use.
In the panorama of studies carried out in this field, the research of M. Galetakis [42,43] is very similar to the one presented here, in terms of intention and the materials used. These studies deal with the development of building materials using waste materials from the processing of stone materials, such as quarry limestone dust (QLD), which is obtained from the grinding of the same in the process of producing aggregates for asphalt mixes and Portland cement (PC). This research has been referred to for the general framework and methodological approach of the work reported here.
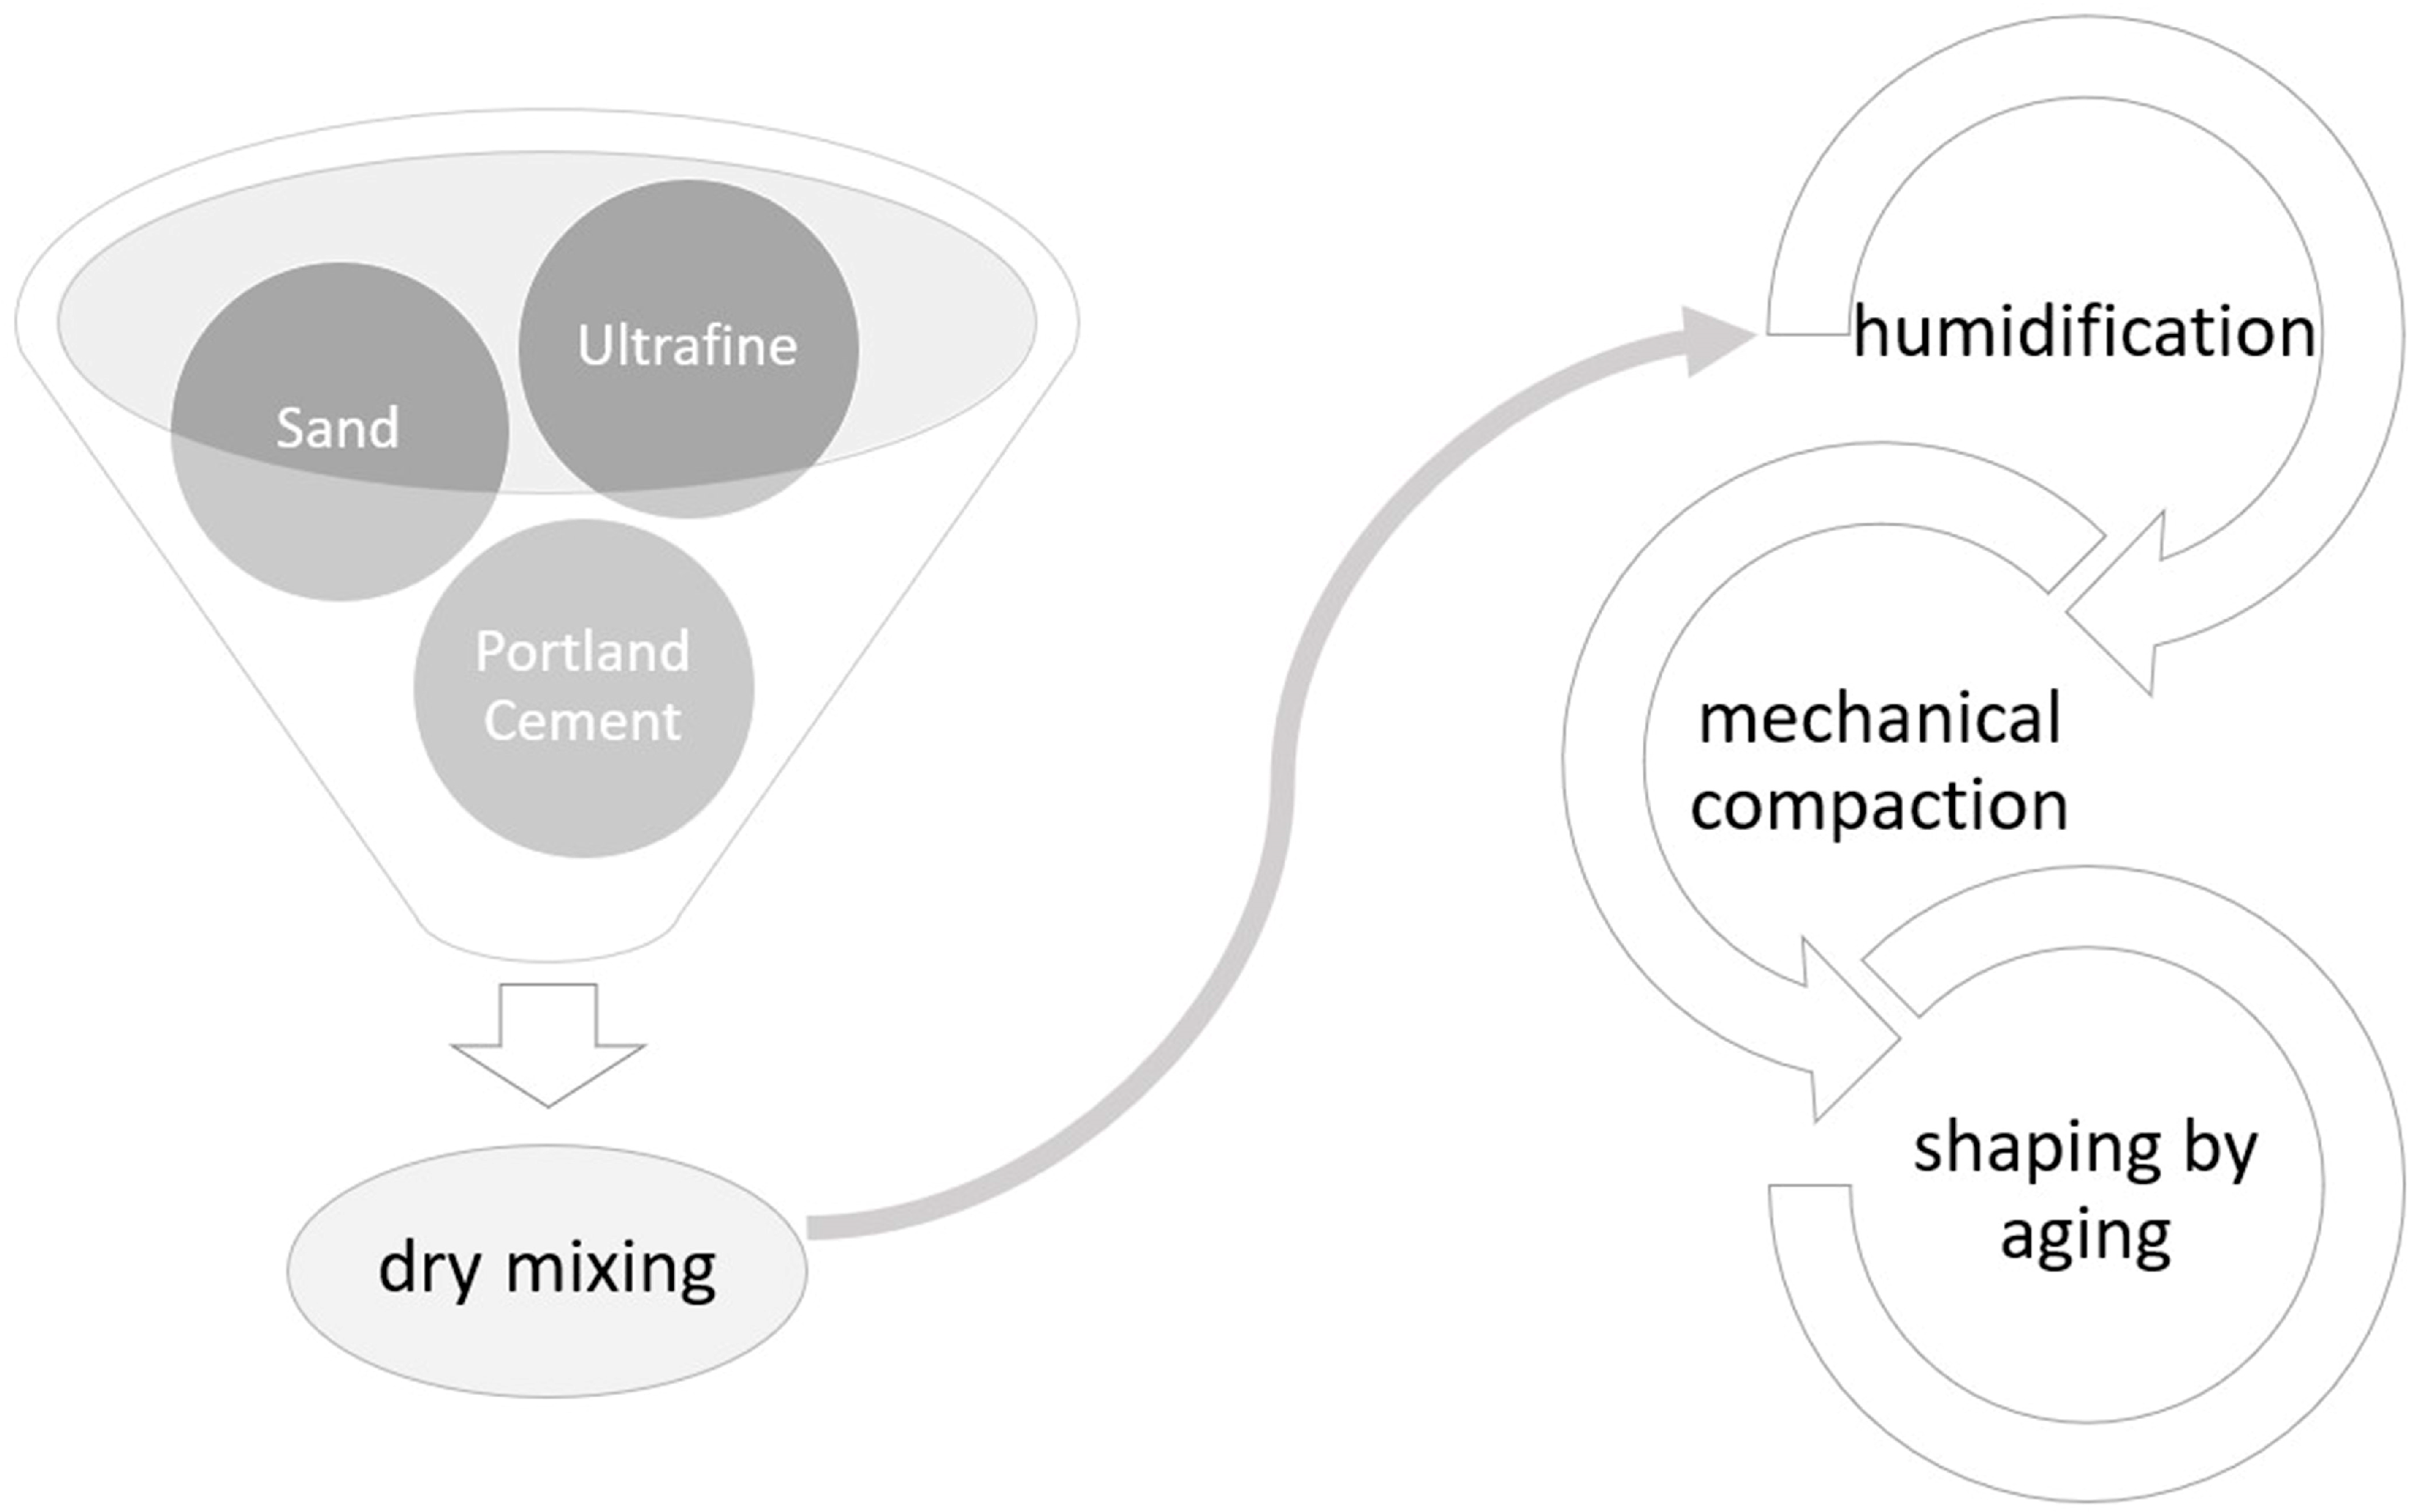
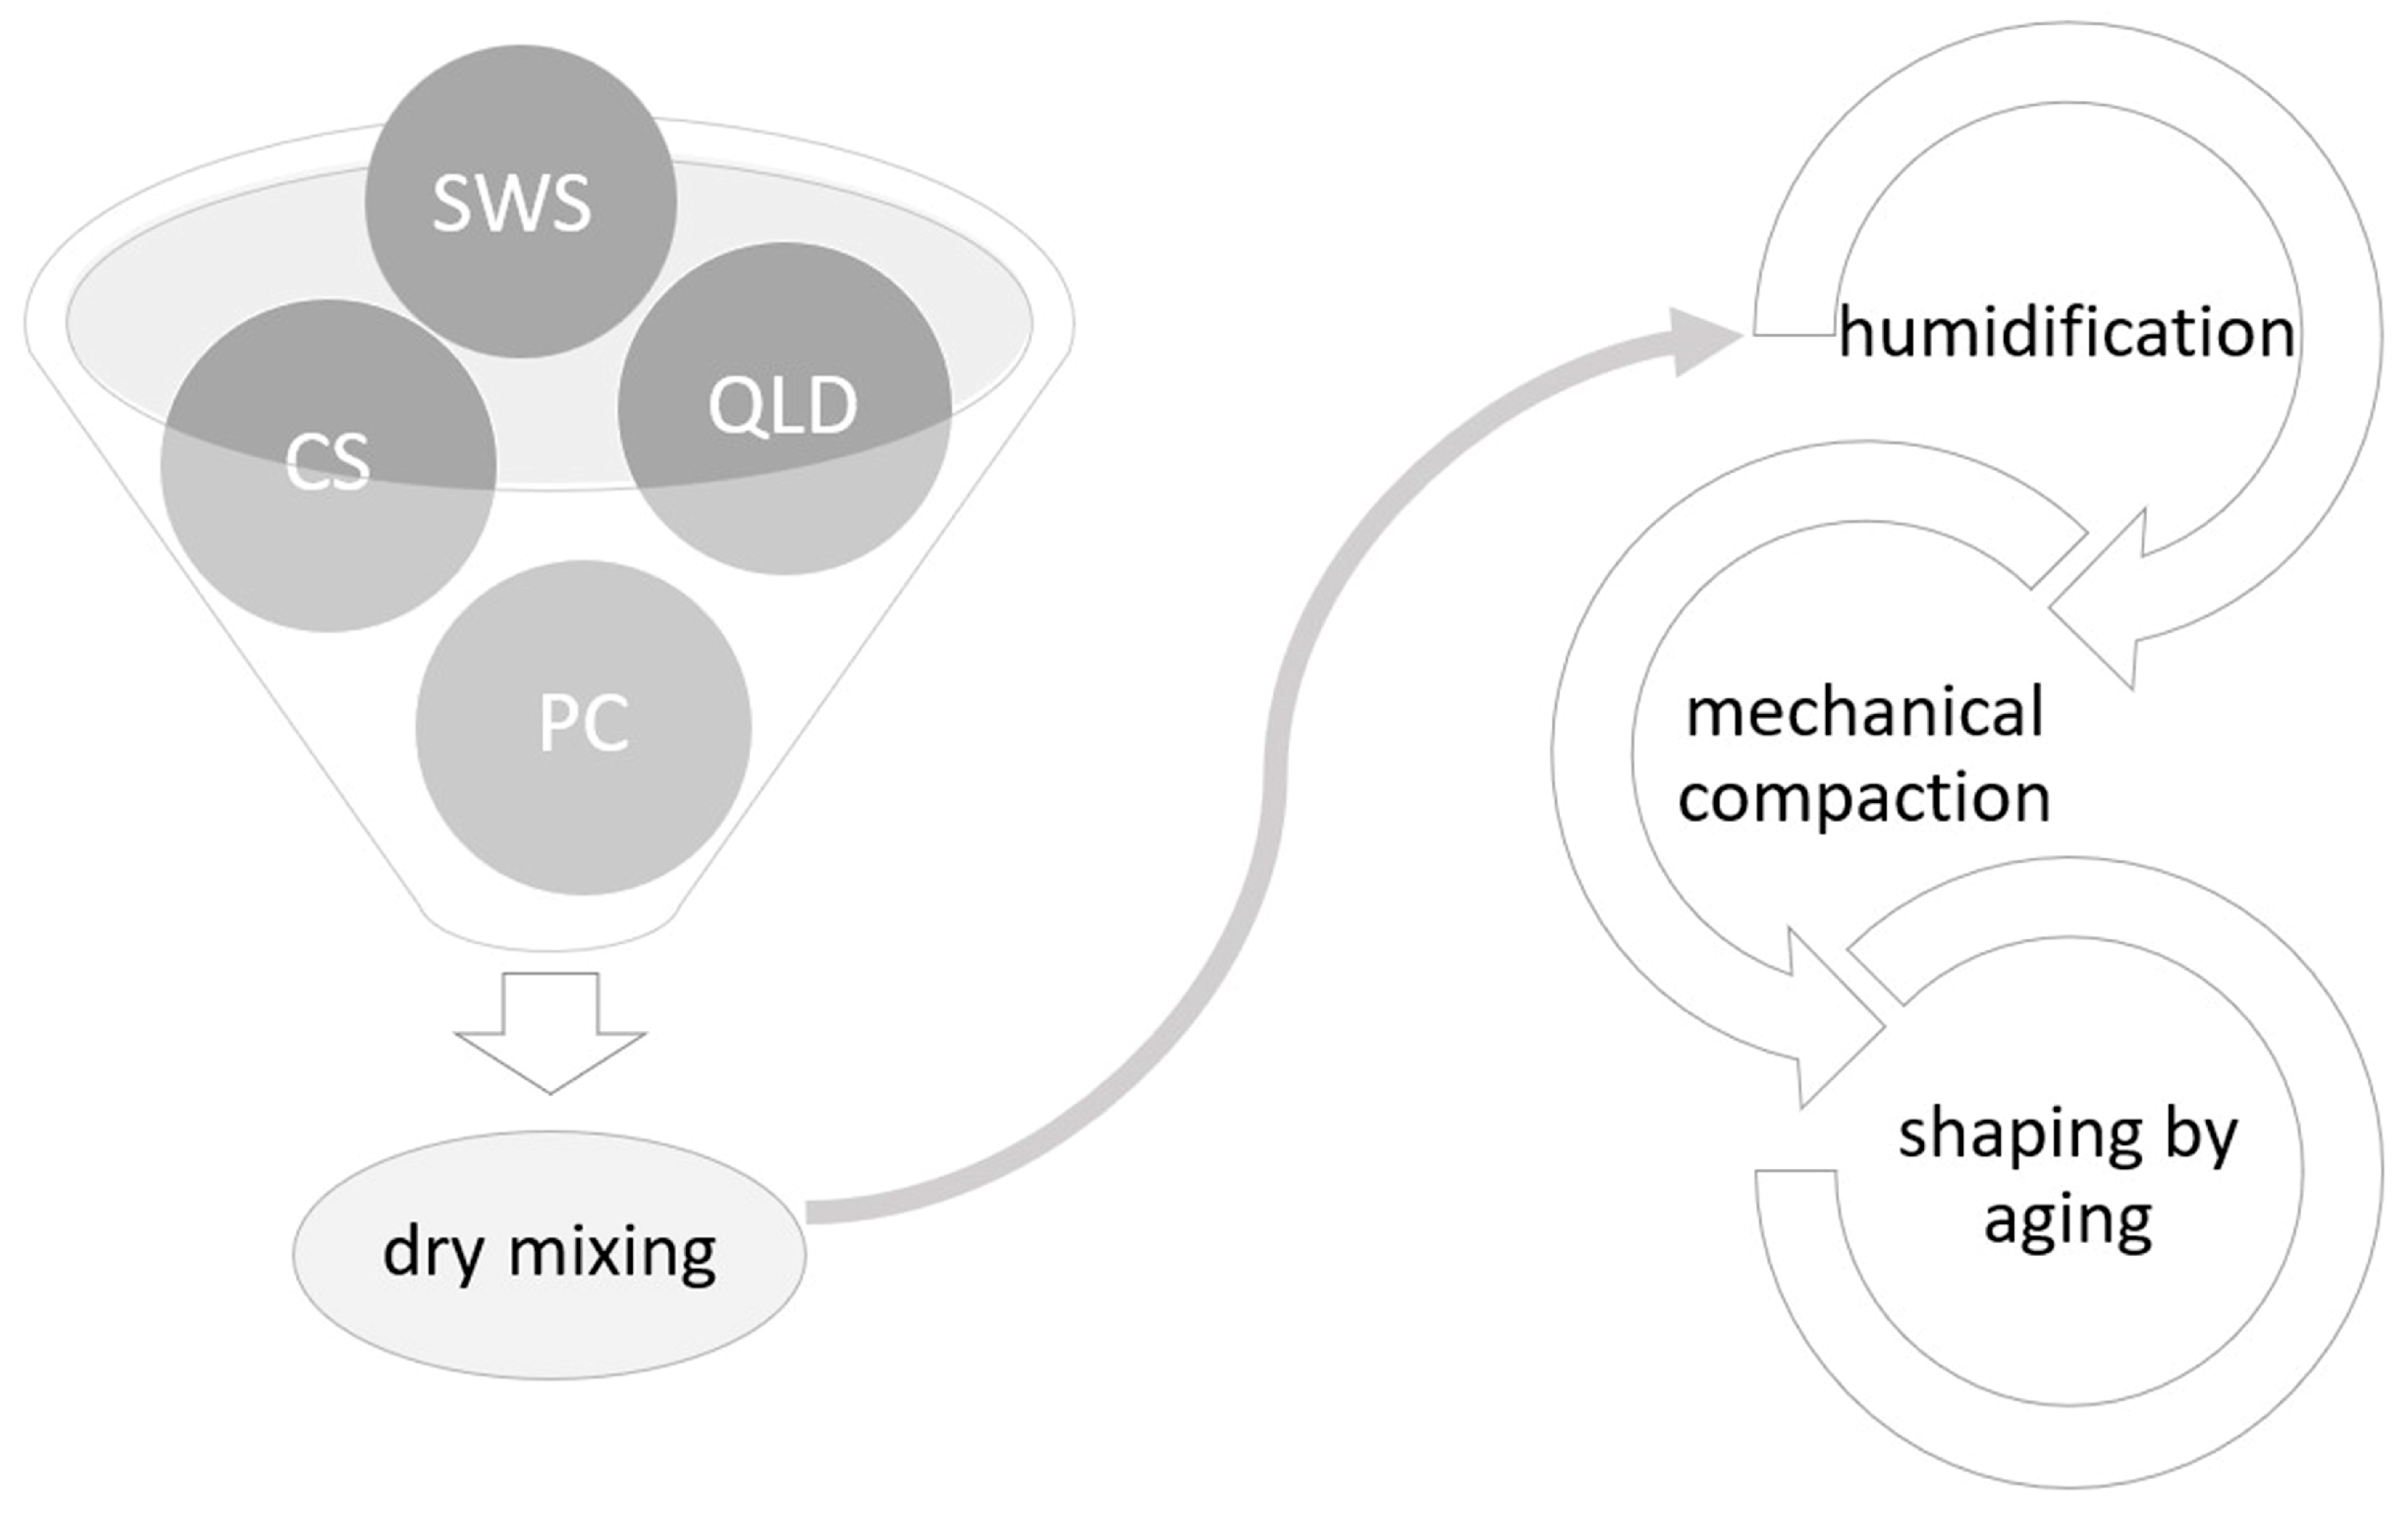
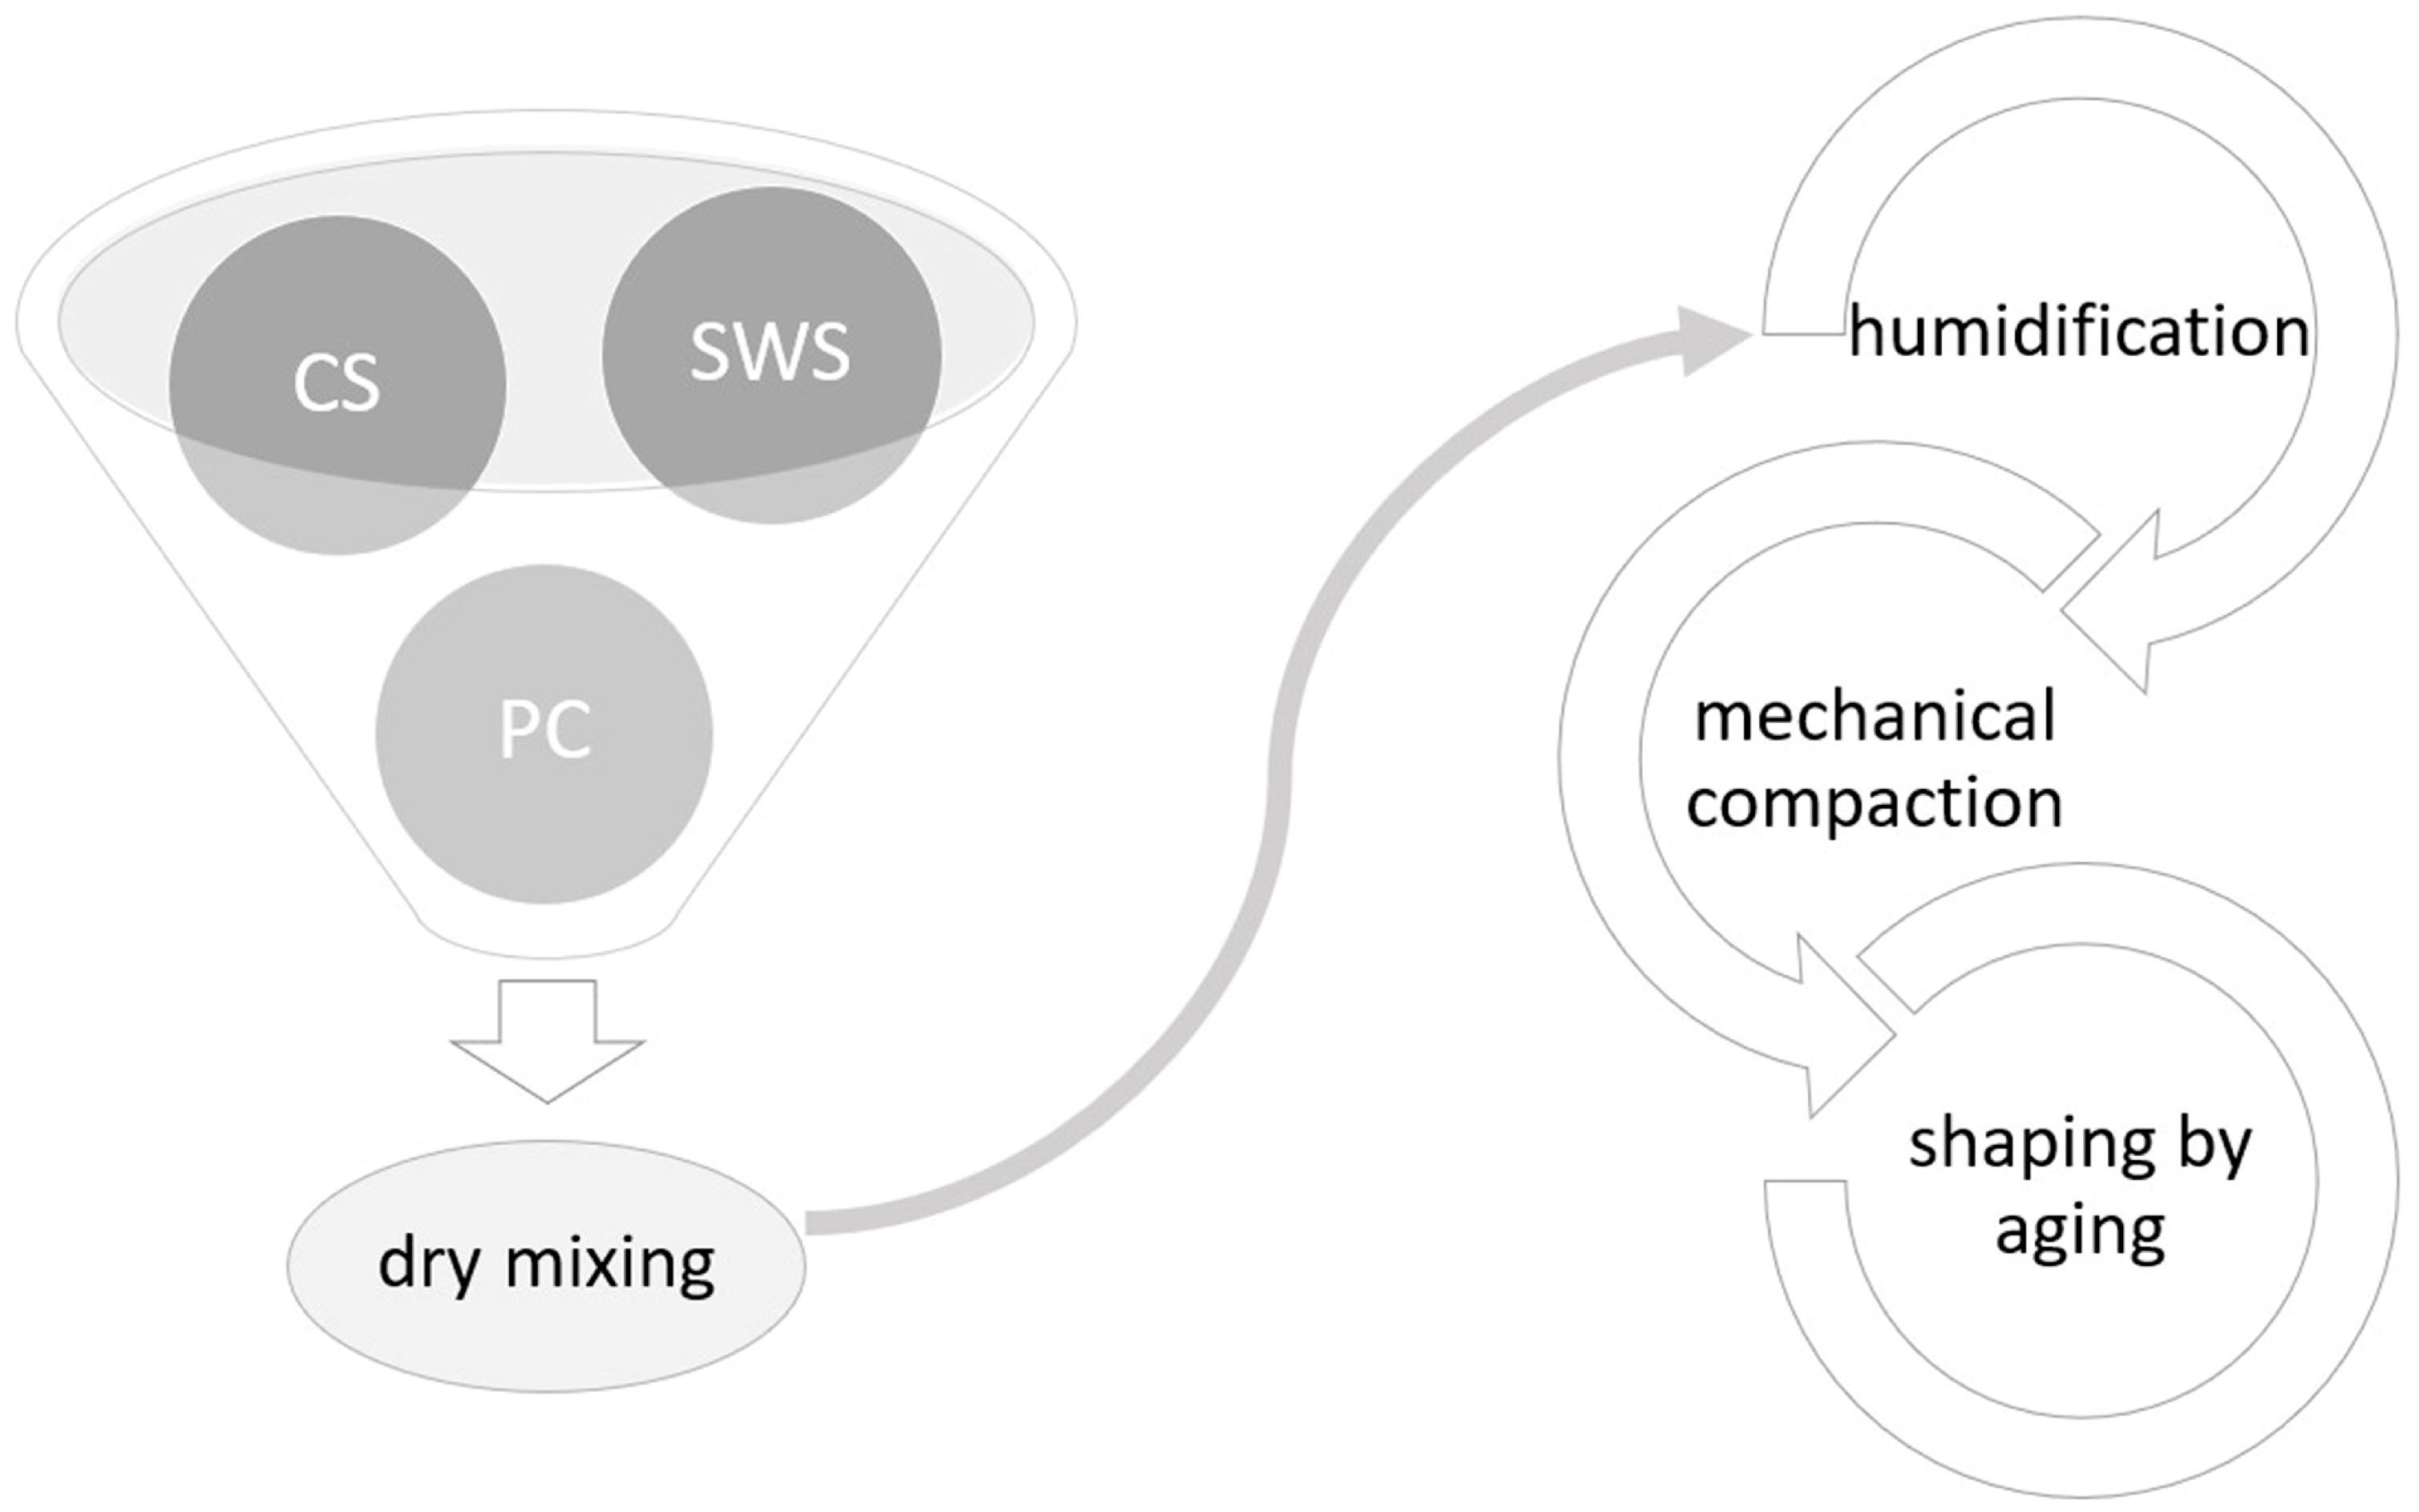
The production cycle proposed here includes the same steps as those used in the production of structural artificial stone: dry mixing of the raw materials, humidification with a quantity of water limited to that necessary for amalgamation, introduction into molds, mechanical compaction, and shaping by the aging of the elements [44].
Compaction involves applying mechanical energy to the compound to “rearrange” its particles and reduce the number of voids. This process strengthens the material by increasing its shear strength and reducing its water permeability. The compaction results are obviously influenced by a number of factors, such as the water content of the material, the type of material being compacted, and the amount of energy used for compaction.
The production cycle then includes the steps shown in the flowchart (Figure 1).

Figure 1.
Production process flowchart.
2.2. Materials
The materials used in the trial are limestone sand (CS) for the production of mortars, water (W), PC, and finally QLD and SWS as ultrafine materials. The waste was taken from the stone production processes of the marble basin of Apricena.
The PC used was of the type, CEM I 42.5 R, conforming to the prescribed composition of UNI EN 197-1:2011 [45];
The W was as required by UNI EN 1008:2003 [46];
The CS used was natural standard sand (according to CEN EN 196-1 [47])
SWS consists of stone processing waste generated in wet stone processing plants, the characterization of which was performed in a previous study [12], the results of which are presented below.
Mineralogical analysis was carried out via X-ray diffractometry, and the results show that the main phase is calcite (CaCO3), while traces of Dolomite (MgCa(CO3)) and hematite (α-Fe2O3) were detected as compounds. The results of TG-DTA show a sample mass loss of 43.30%, and a calcium carbonate content of 98.41% by mass. The experimental data were confirmed via the hydrochloric acid attack performed on two powder samples, and indicate an average value of non-carbonate impurities of 1.56% by mass and a calcium carbonate content equal to 98.44% by mass. The chemical composition of SWS was determined via X-ray fluorescence spectrometry, which was also used to support the XRD analysis carried out quantitatively. The results show that SWS is composed mainly of CaO (55.6%), and all the other components (Fe2O3, Al2O3, SiO2, Na2O, K2O, TiO2, SO4, CO2) were present in amounts less than 0.1% except MgO (0.25%). The results of the eluate analysis show that with reference to the Italian Regulations [48], the SWS was found not to be “non-hazardous waste”, and can be designated for recovery. The specific gravity is 2.80 g/cm3. The moisture content of the SWS is equal to 23.5%.
The test performed to measure the ISO brightness level showed a very high and almost pure degree of whiteness with a value of 93.5% ± 1. The particle size distribution of the solid particles, obtained by using the laser diffraction method, shows that the maximum particle size, expressed as the equivalent diameter, was equal to 77 μm. Only 8% of the mass had a particle size between 22.5 μm and 77 μm, while the remaining 92% of the mass had a particle size below 77 μm. Only 8% by mass had a particle size between 22.5 μm and 77 μm, while the remaining 92% by mass had a particle size below 22.5 μm, with 7% by mass having a particle size below 0.5 μm. The Blaine specific surface area was 9273.79 cm2/g. This value confirms the significant fineness of SWS.
QLD, derived from stone crushing in the aggregate production process in Crete, was used in the first phase of the study and was analyzed by Prof. M. Galetakis [36,37] who compared it with the results obtained for SWS. QLD and SWS have mineralogical compositions that were analyzed using completely similar X-ray difractometers. They consist primarily of calcite (approximately 98% by weight) with traces of other elements such as quartz and dolomite. The chemical compositions are also similar (Table 1), with an absolute prevalence of CaCO3 present in amounts greater than 98%, with a difference of 0.22% between QLD and SWS.

Table 1.
Chemical analysis: main elements in the composition of SWS and QLD.
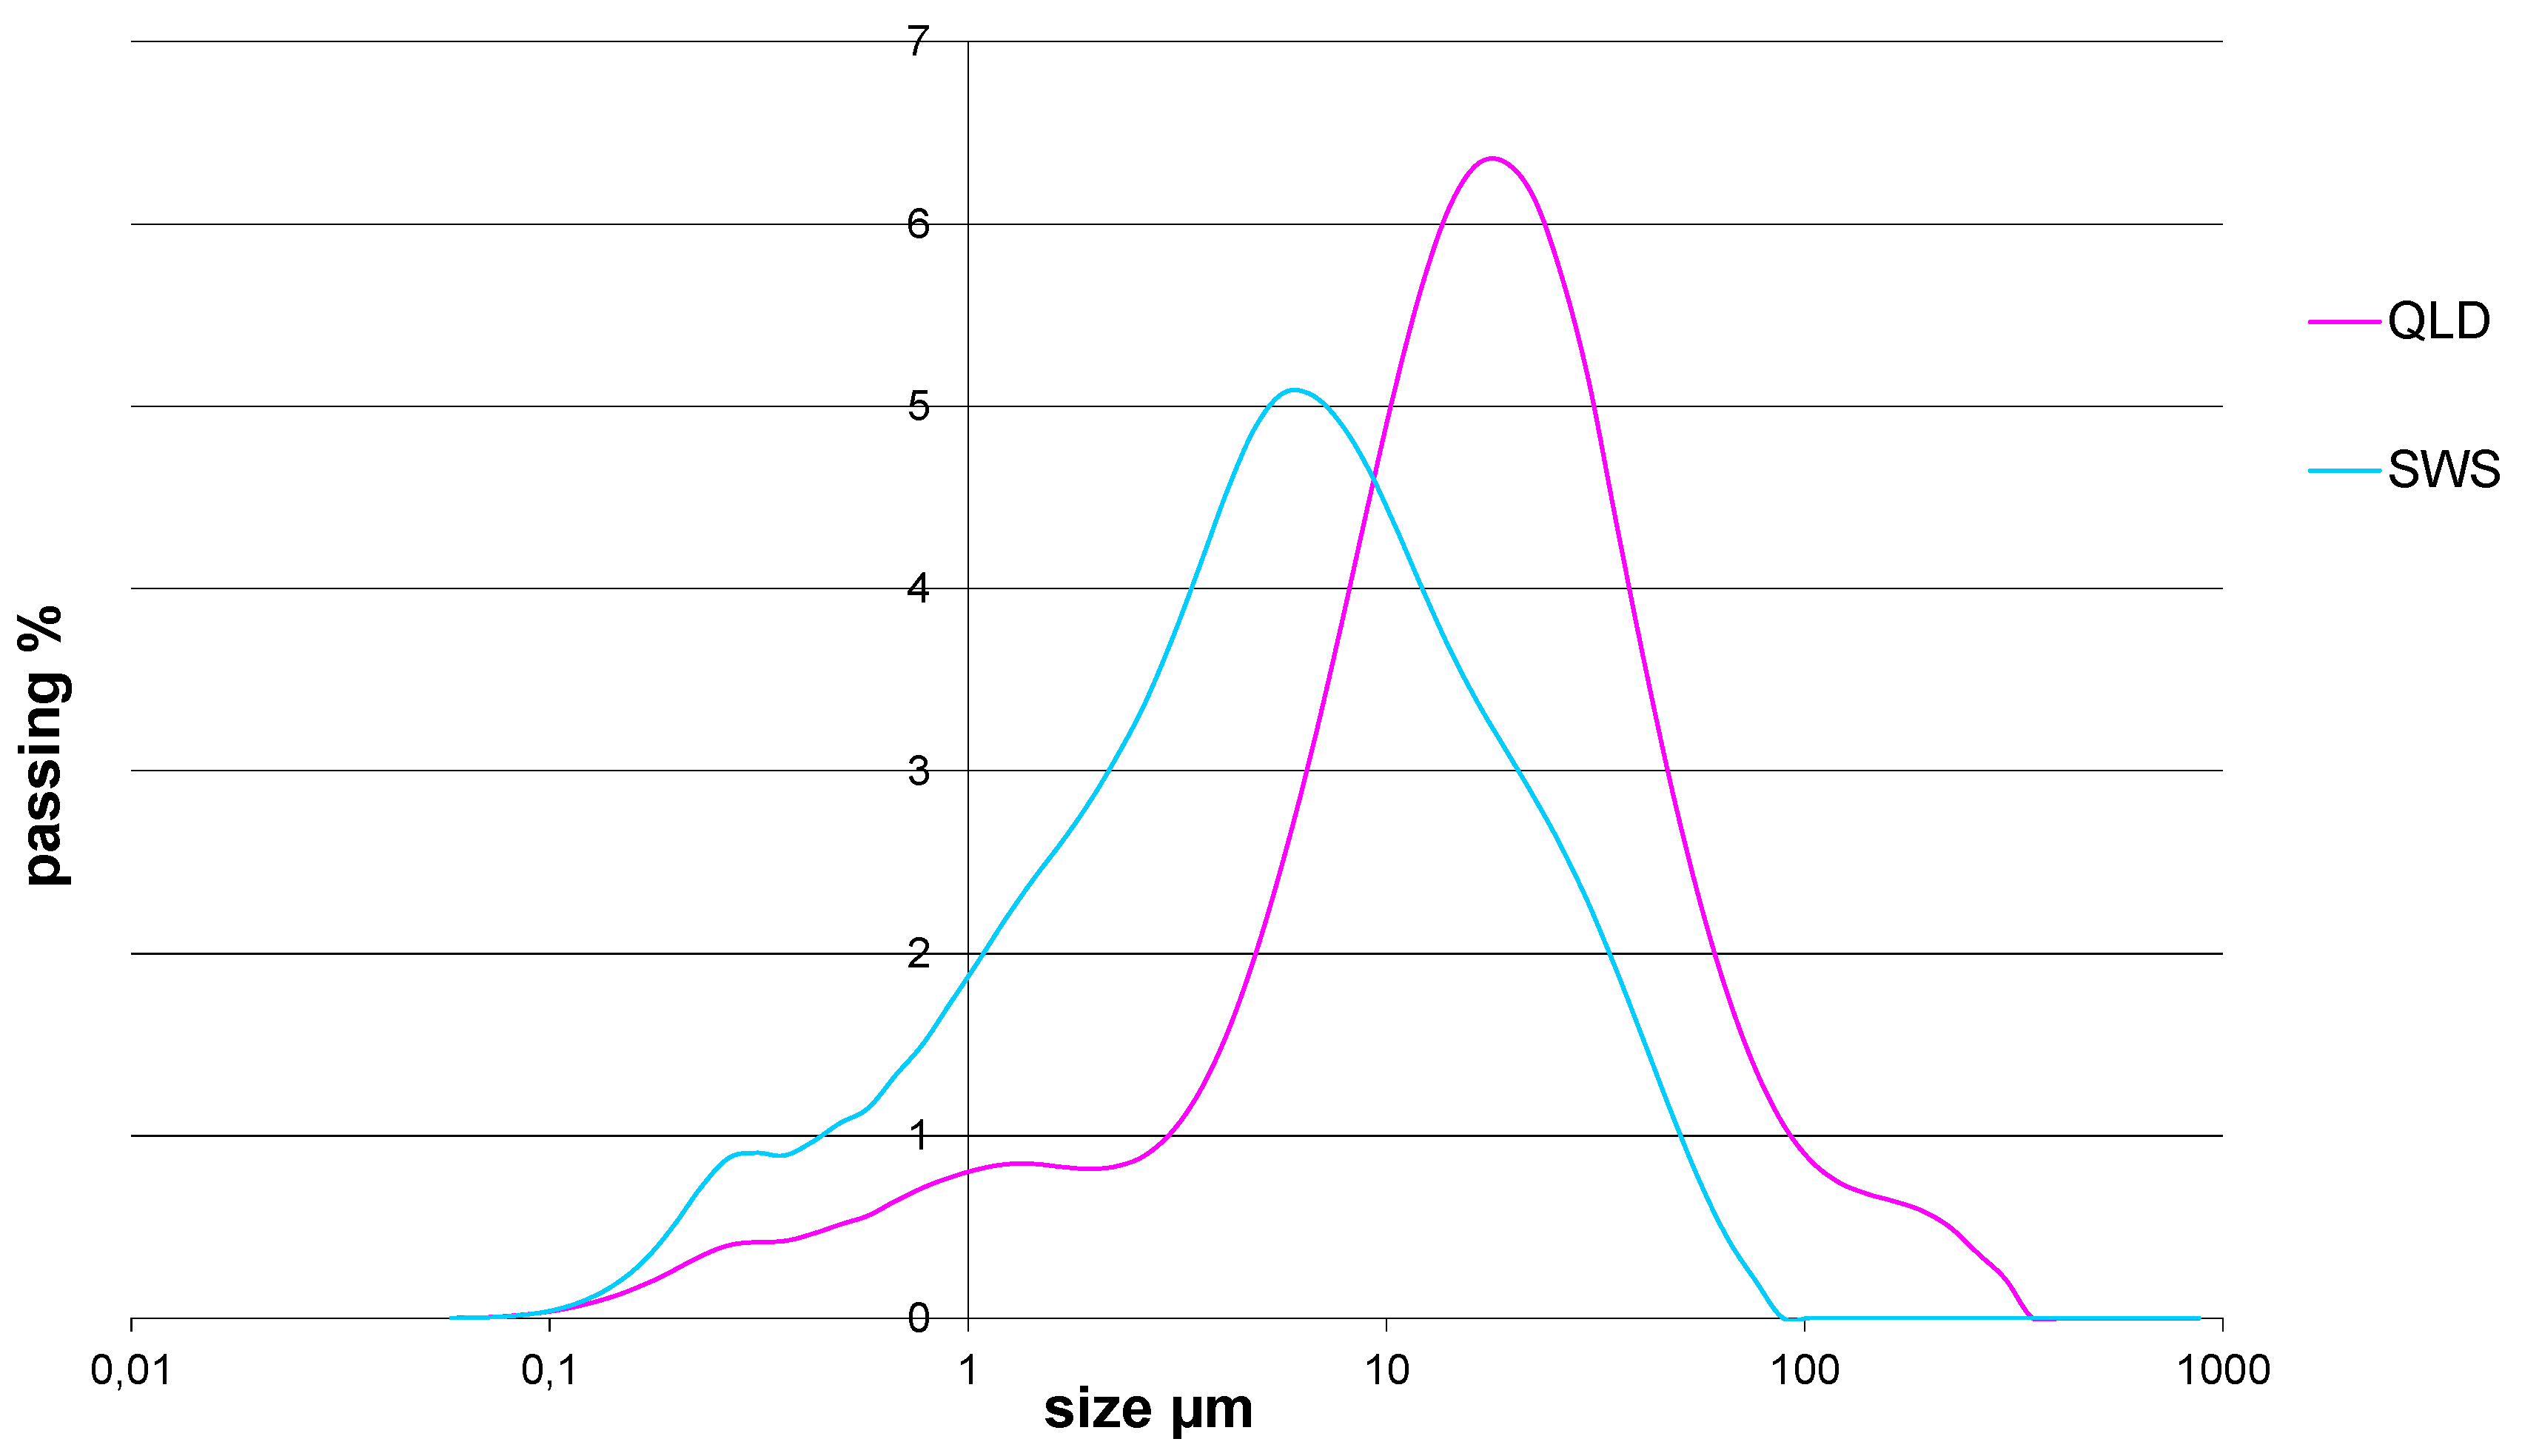
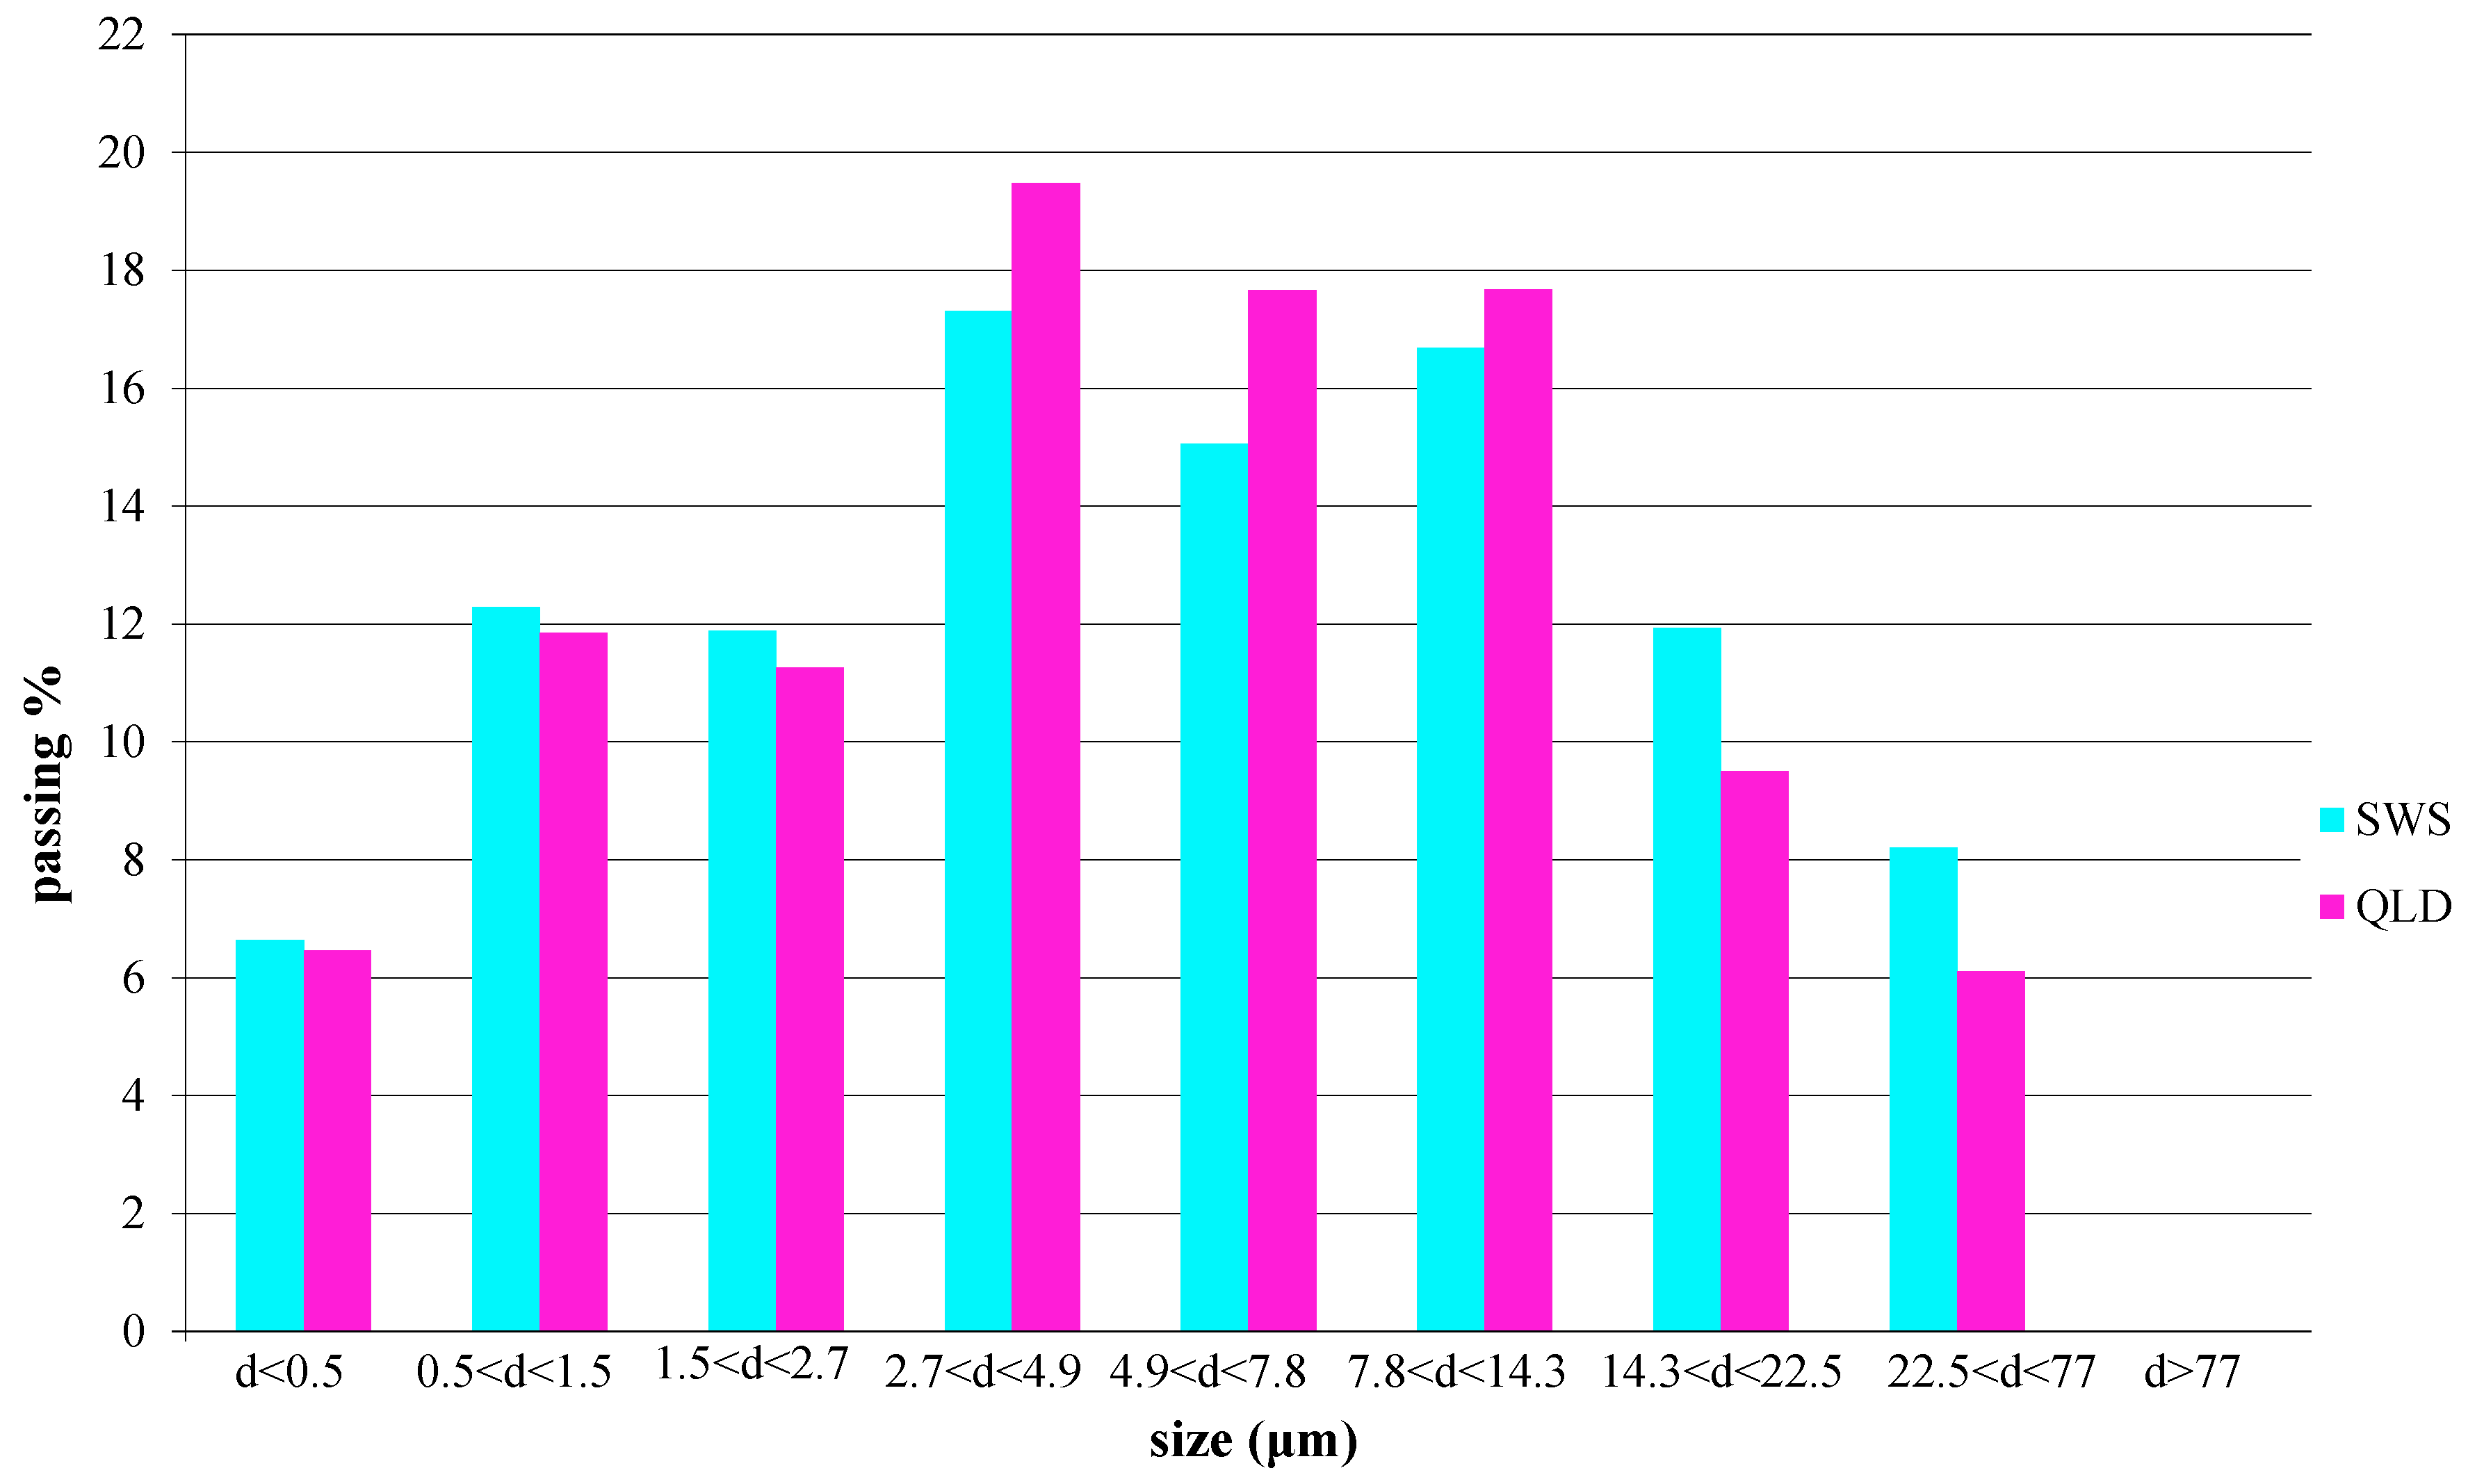
In contrast, the particle sizes of the two types of waste analyzed were slightly different (Figure 2 and Figure 3). Although they are mostly ultrafine materials, it appears that SWS contains the largest amount of ultrafine material, while QLD produced for the production of concrete aggregate tended to be slightly larger in diameter.
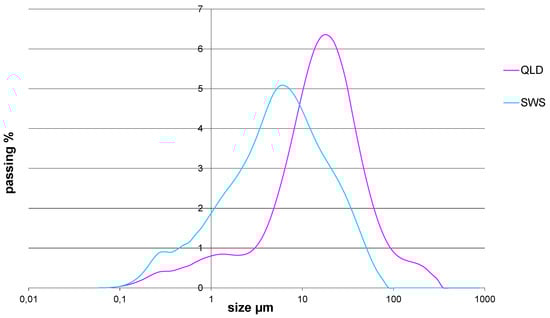
Figure 2.
Comparison of grain size of SWS and QLD.
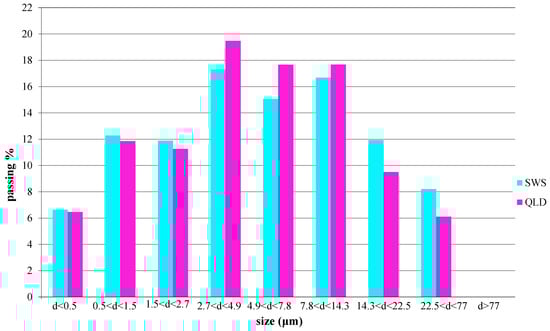
Figure 3.
Comparison of the three waste types in terms of particle size divided into nine diameter classes.
The specific surface area measured by using Blaine’s air permeability method confirmed that sludge is the finer material than the two types of powder analyzed (Table 2), and its permeability is the lowest.
Table 2.
Comparison of the specific surface areas of the analyzed waste types.
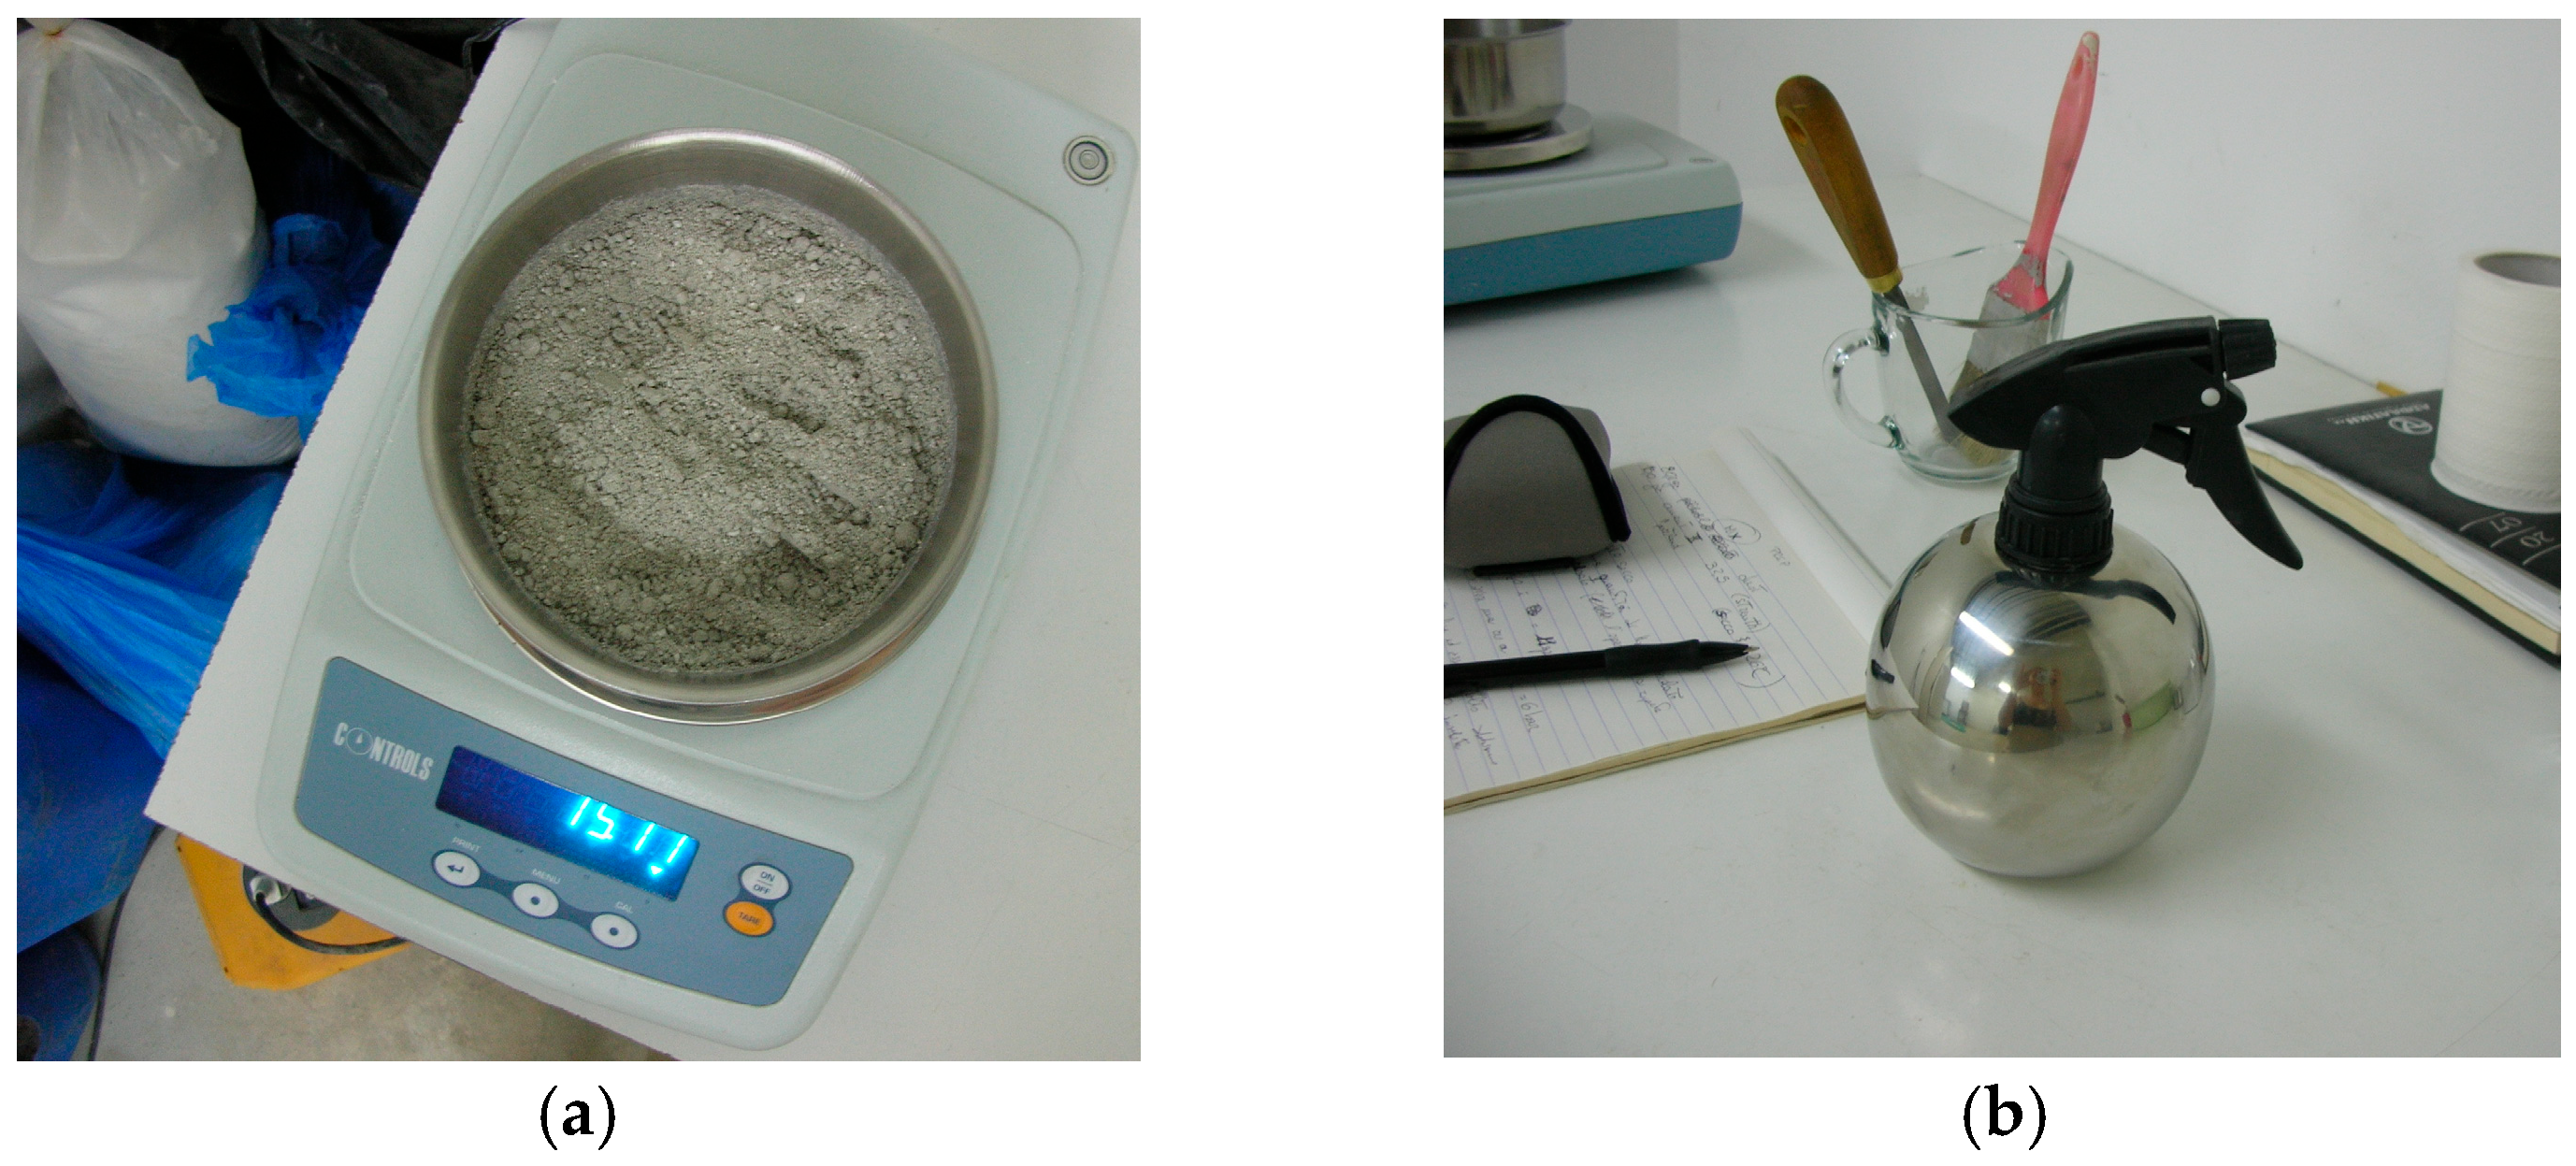
The degree of compaction of the materials was then tested to find the maximum load beyond which the volume loss of the two samples was insignificant. For this purpose, two slurries were prepared with one of two types of waste, cement and water. The resulting information was used to determine the compaction pressures to which the specimens would be subjected in the next steps. Each slurry, following the research settings initiated by Prof. Galetakis [42], consisted of 80 g of recycled aggregate and 15 g of Portland cement mixed dry and moistened with enough water to make the slurry wet (Figure 4).

Figure 4.
The dough was mixed dry and then moistened with steamed water. (a) Dry mix; (b) vaporizer.
The doughs obtained were placed in cylindrical molds with an internal diameter of 50 mm and a height of 80 mm and compacted in a load cell (Figure 5) through a stress–strain cycle.
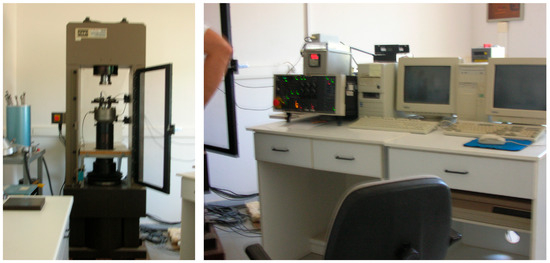
Figure 5.
Load cell and measuring equipment.
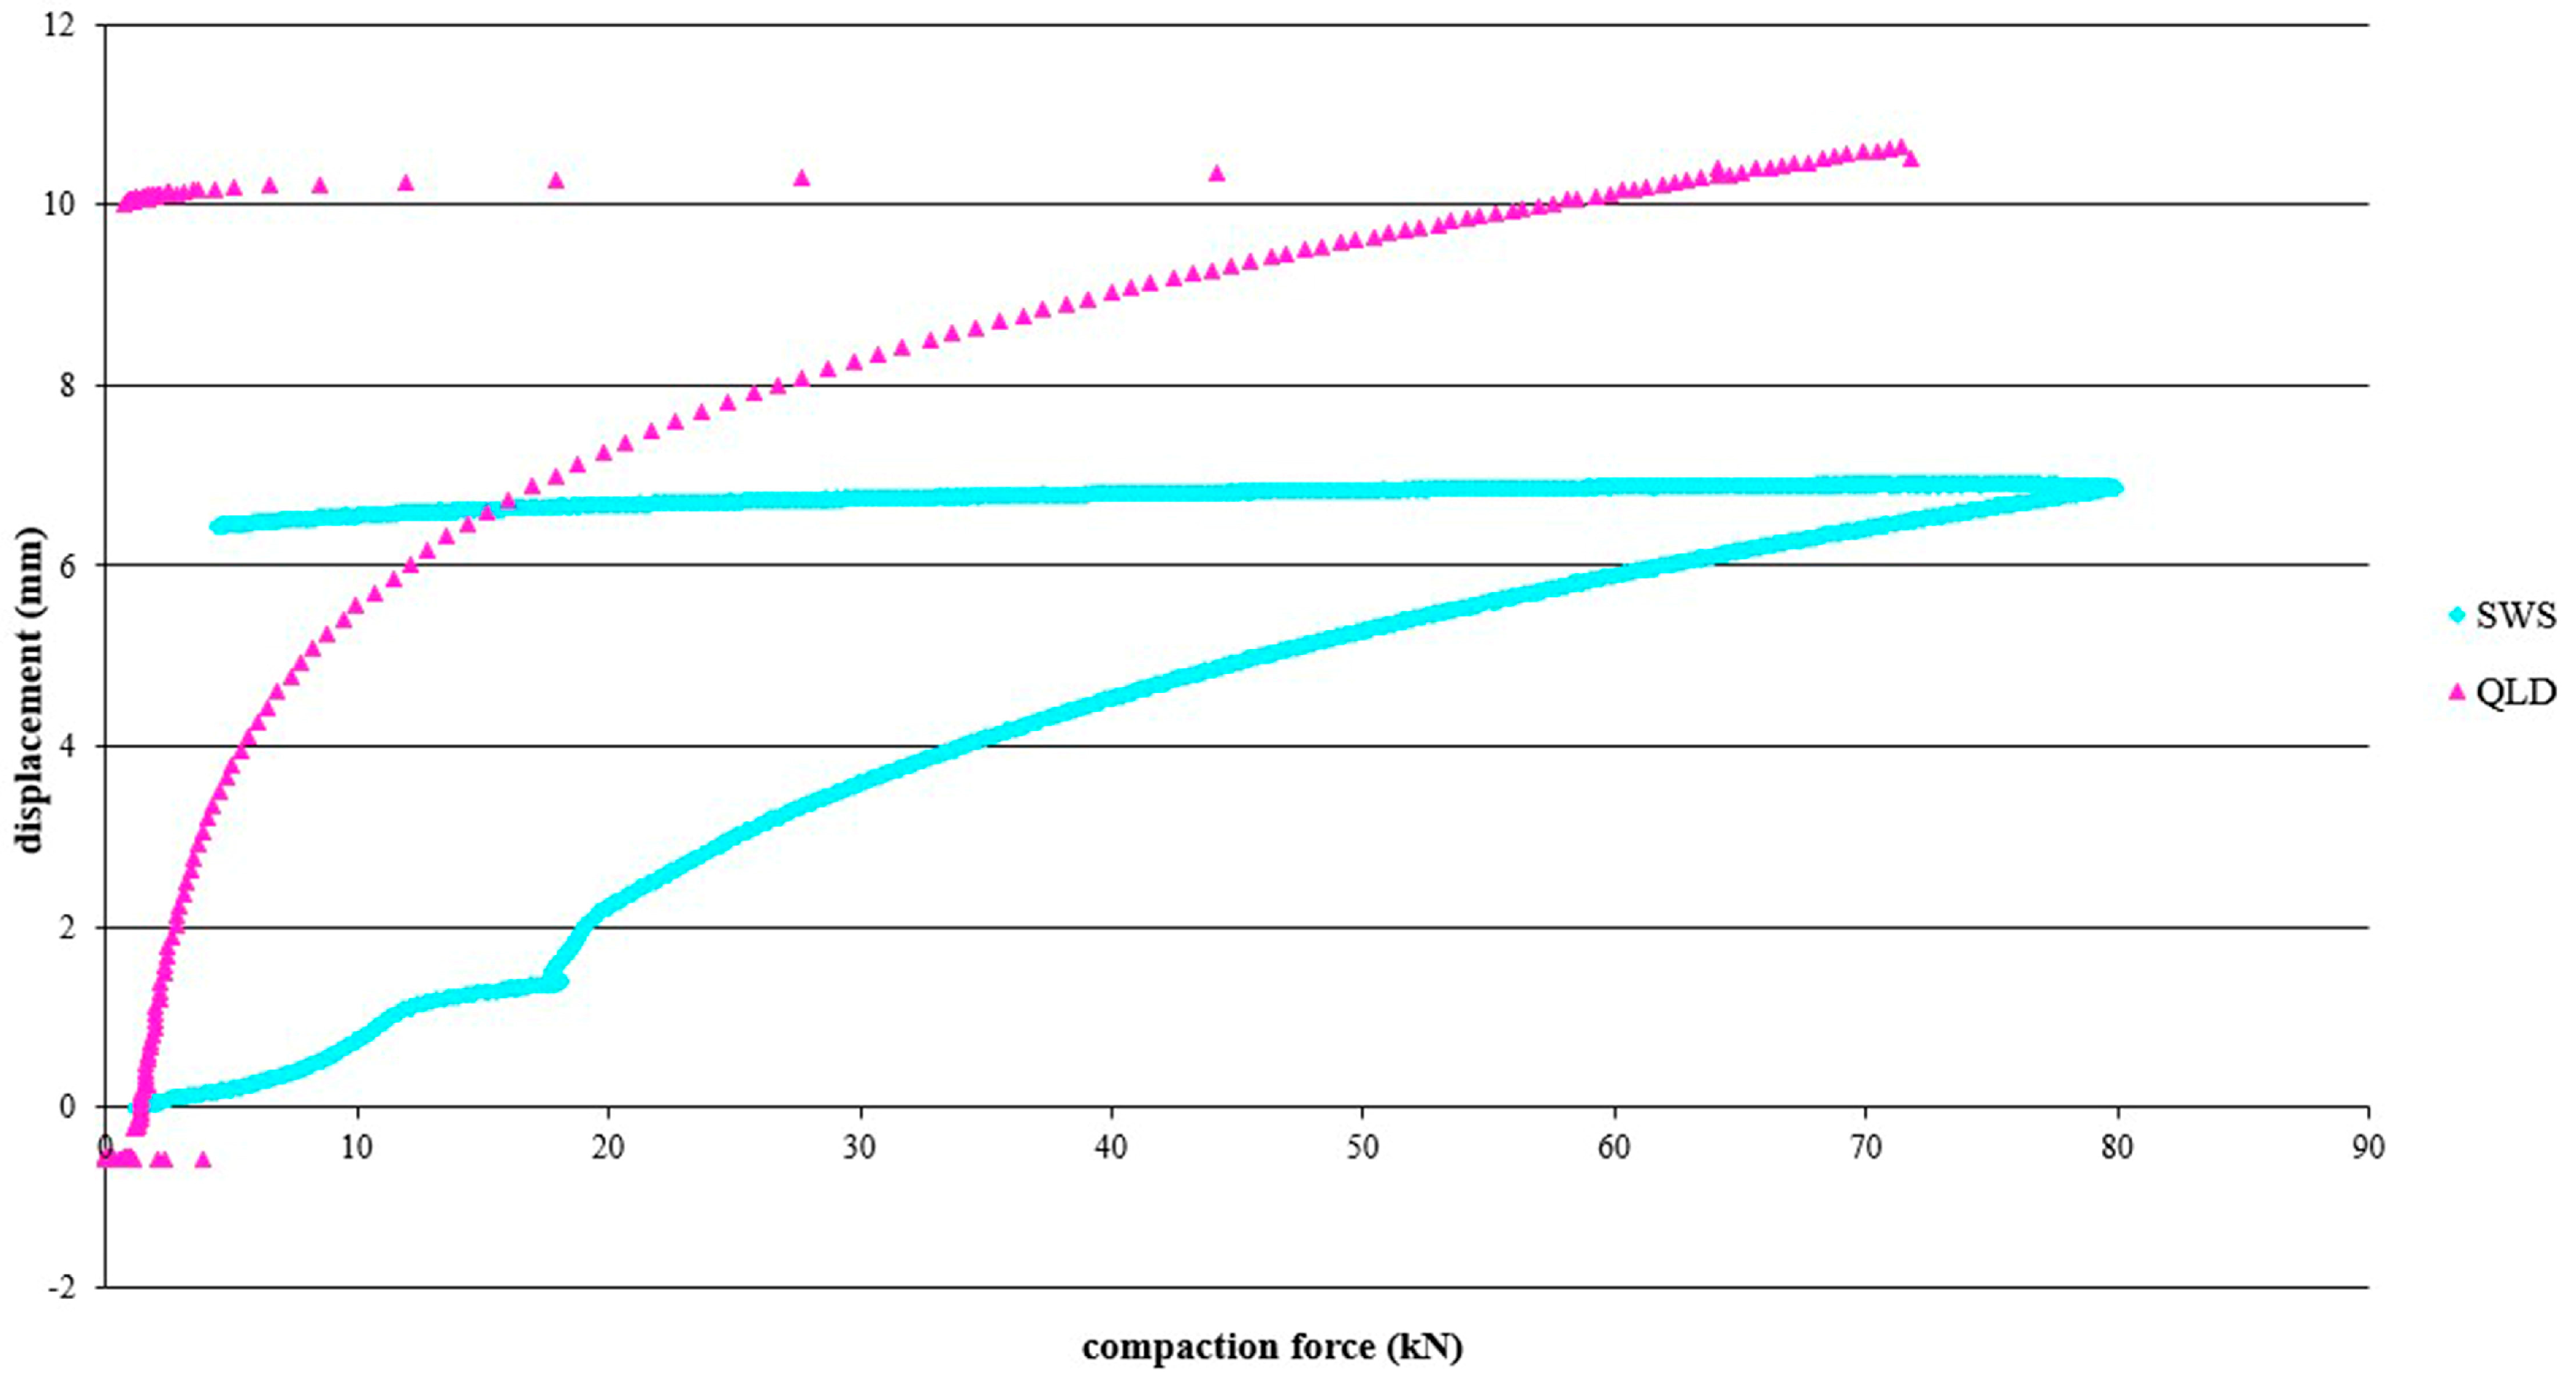
The results obtained (Figure 6) highlight that the specimens containing QLD had an initial settlement of about 50 percent of the total, which occurs very quickly and at small load increments, while the compaction values of the specimen containing SWS were lower, the process occurring more slowly than at higher pressure values. This again reflects the different grain size of the SWS, which is finer than the powders and therefore has a better initial grain distribution with fewer voids, even before the compaction stage. It could be observed that the relative decreases became insignificant after the application of forces of 60–70 kN for SWS, and 50–60 kN for QLD.
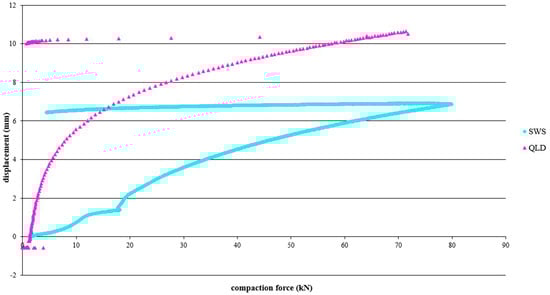
Figure 6.
Compaction test results.
2.3. Experimentation Activity
A Spanish commercial product, the Hyperbrick [49], was used as a reference for the design of the doughs, and is well suited to the materials to be processed as well as to the principles and procedures identified. It is a “regenerated stone”, homogeneous, and without inclusions, packed in solid and hollow structural bricks, obtained by cold compression of natural inert materials with fine and ultrafine grain size and PC used in small quantities.
The high pressures to which the mixture is subjected make it possible to obtain a high-density, close-grained, bubble-free material with a low water absorption coefficient and low capillarity (less than 0.7%), making it stable without shrinkage or significant expansion. The thermal properties ensure high thermal inertia and an insulation coefficient of 0.80 to 0.85 W/m2/°C. The product tested at 28 days had a uniaxial compressive strength of 100 kg/cm2, with a minimum value guaranteed by the company of 8.5 MPa and a minimum flexural strength of 1.66 MPa [50].
The documentation provided by the company gives information on the grain size of the aggregates, as well as the materials and their percentages in the mixes [51,52].
The raw materials used were PC, W, and aggregates with grain sizes ranging from 6 mm to 0.002 mm.
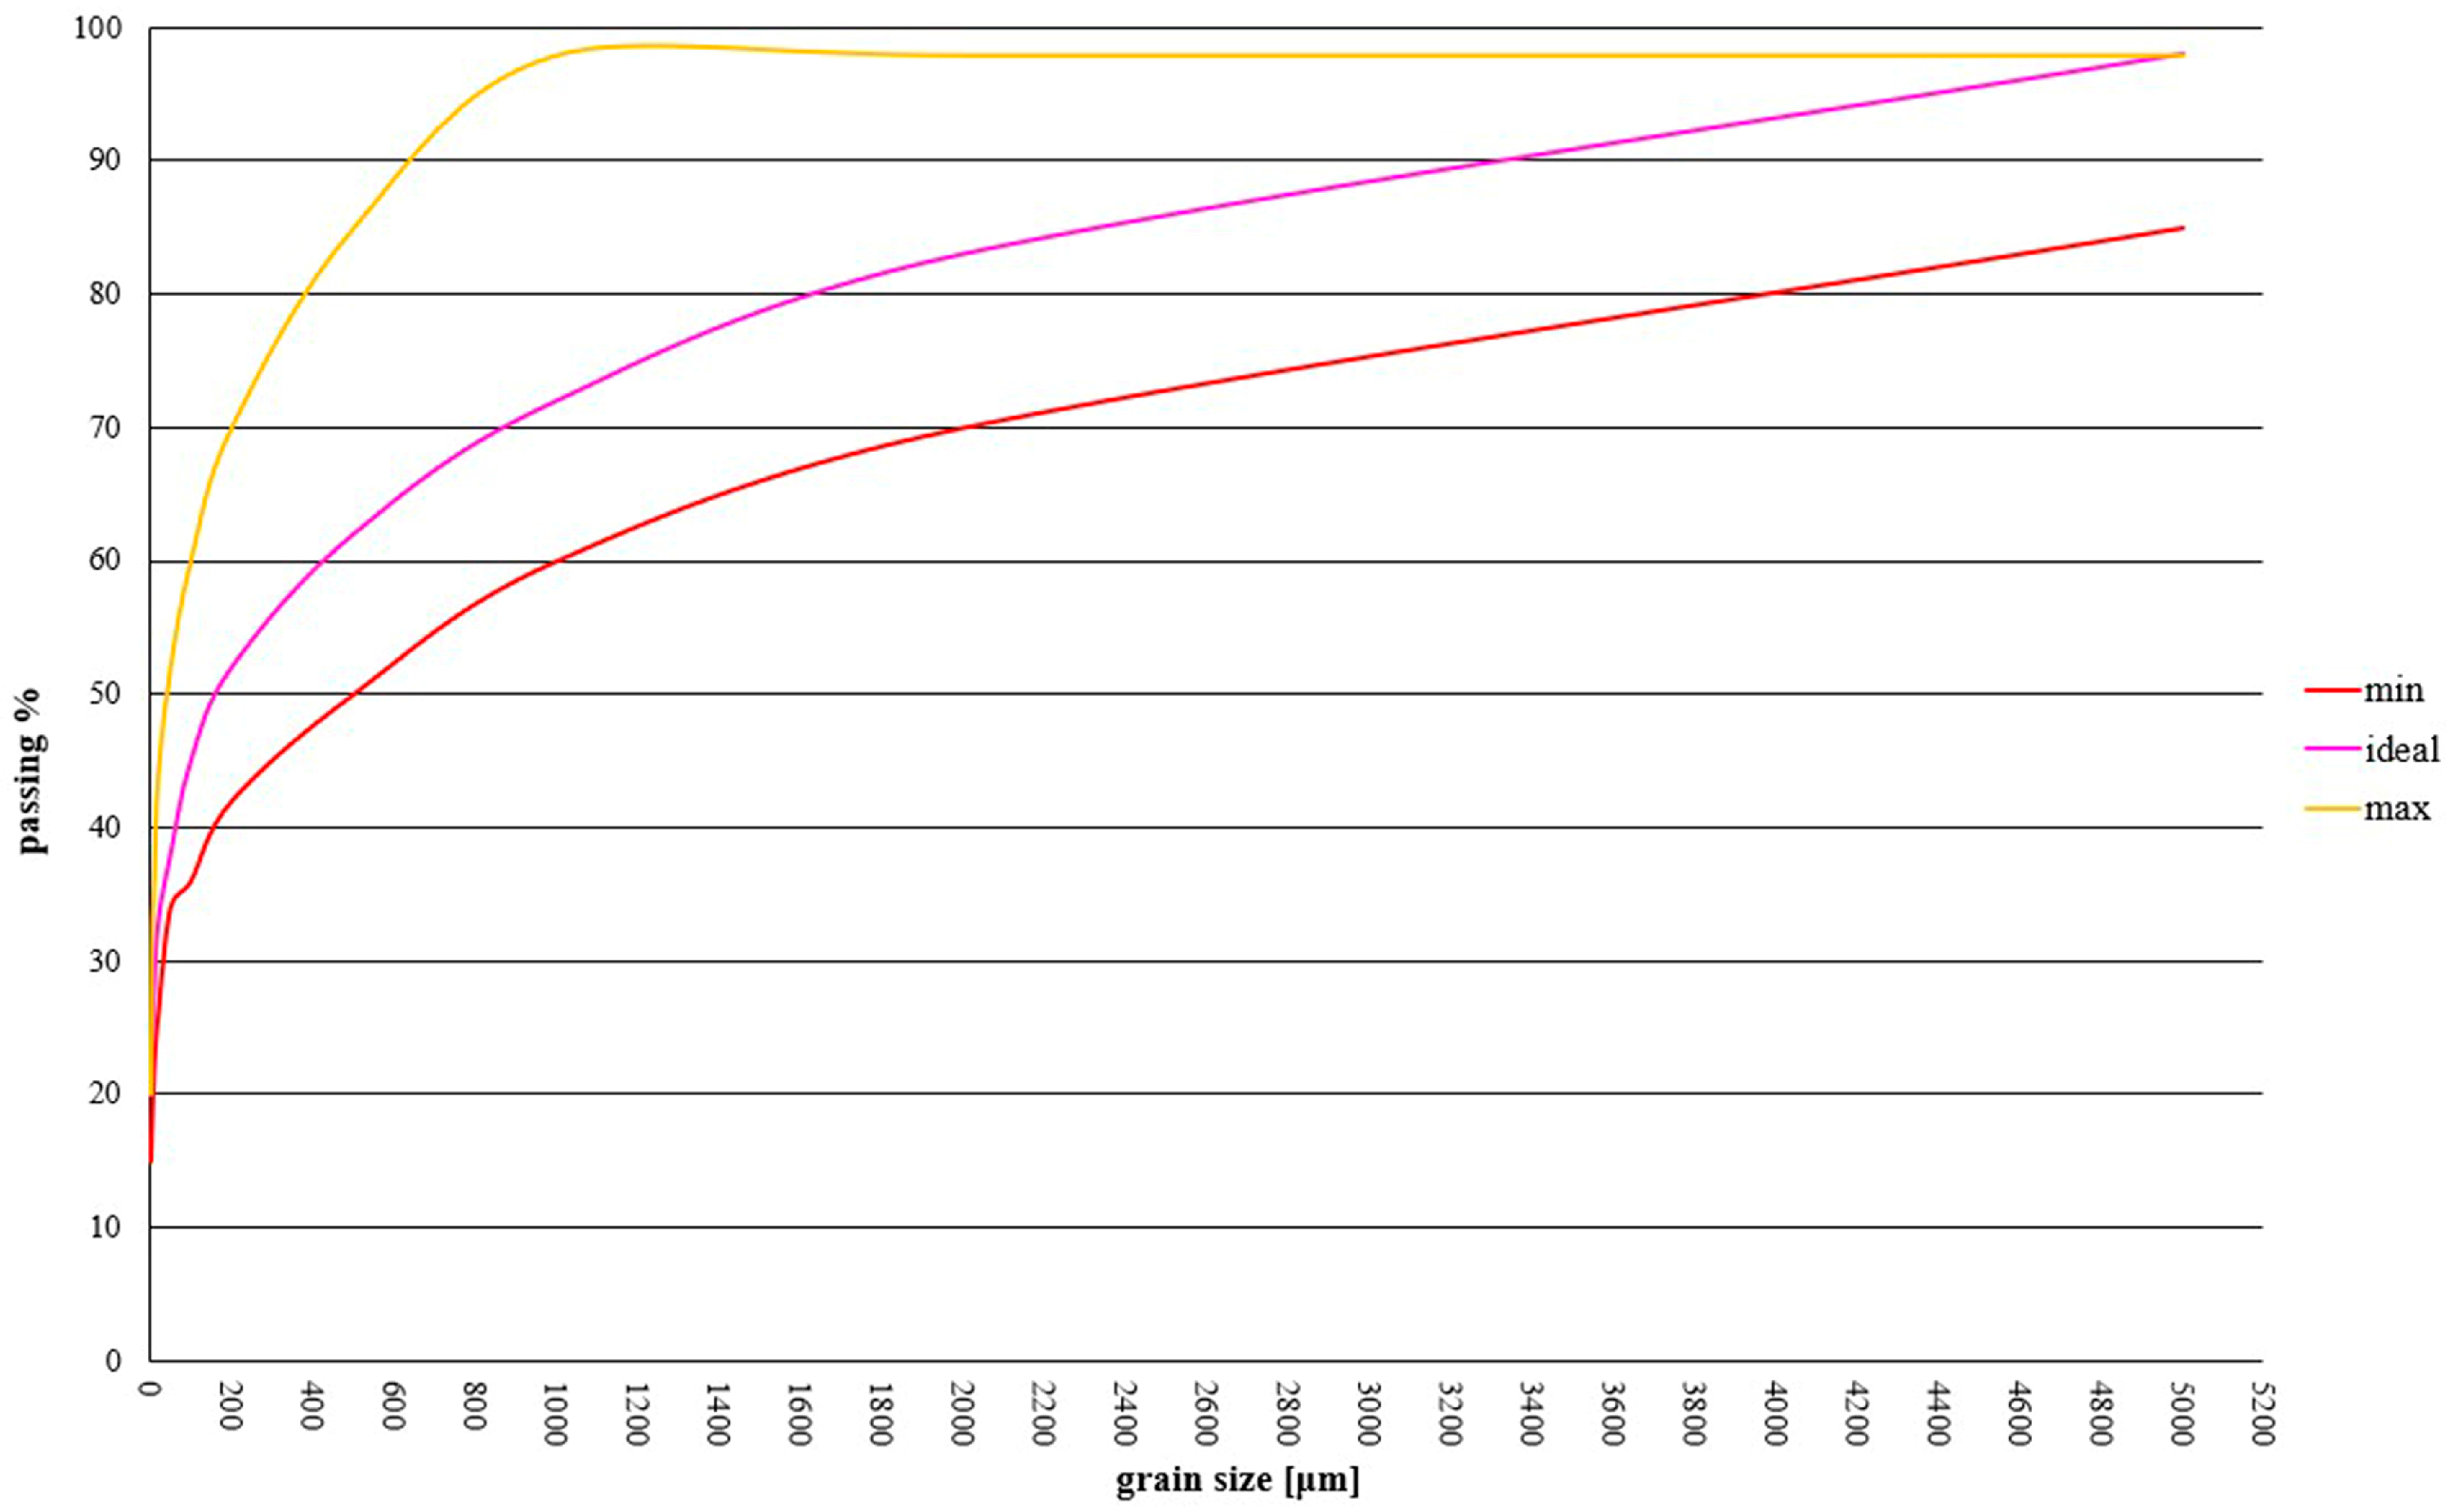
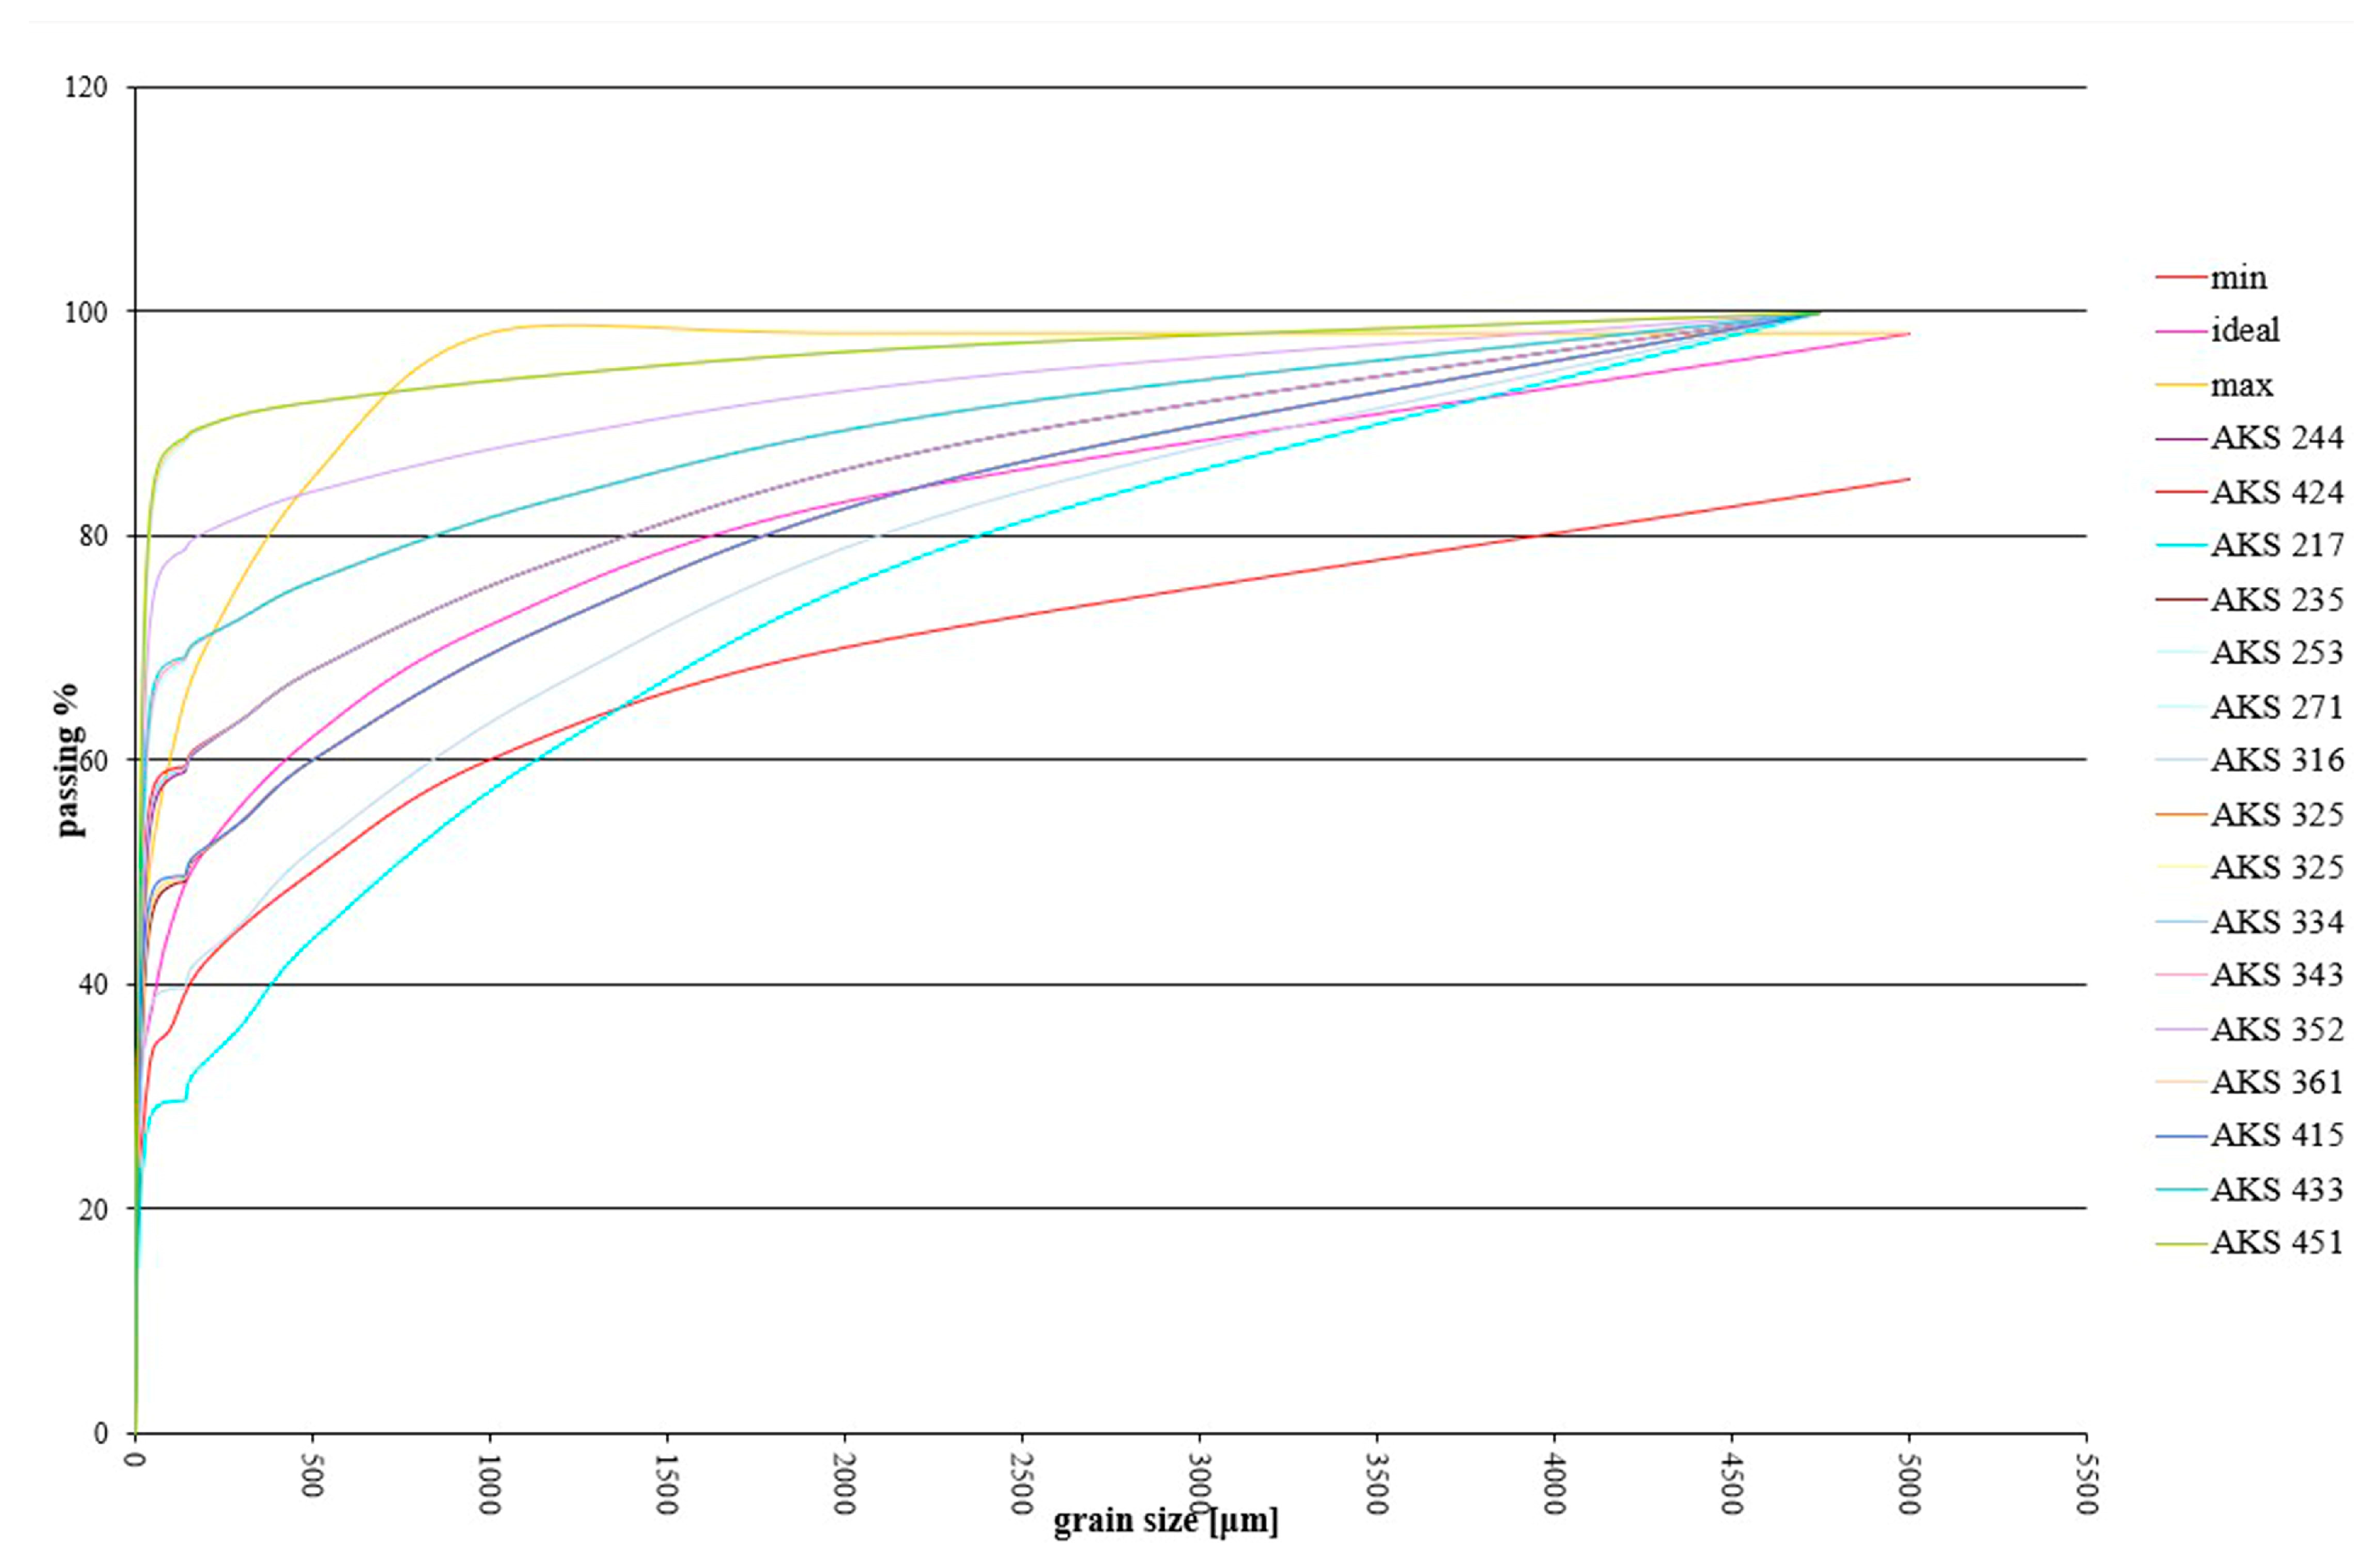
For a correct particle size distribution, an optimal reference curve [53] is provided, which generates a relatively large particle size range within which deviations from the ideal curve are possible (Figure 7). However, it is advisable to achieve as close as possible the ideal values and to minimize deviations in the silt range from 0.05 to 0.005 mm.
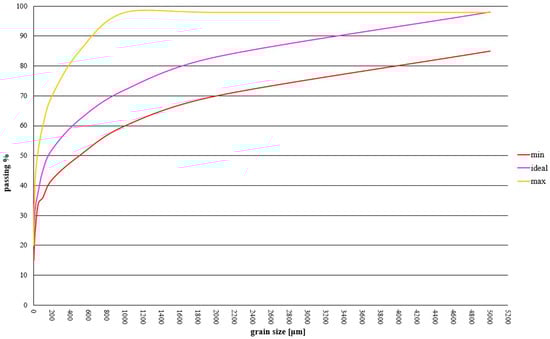
Figure 7.
Display of the optimum spindle and curve.
Table 3 shows the grain sizes that characterize the ideal melt.
Table 3.
Passing percentages at the screens compared with the relative diameters of the ideal, maximum, and minimum curves.
Once the dough is prepared, the instructions provided by Hyperbrick indicate that it should be pressed in a special machine that applies a force of 12–16 tons (120–160 kN) to each block. The block was then demolded and left to age for 28 days.
The present experiment was conducted using two different combinations of materials, the first using three types of inert components and the second using only two inert components. In the first stage, three different mixtures were prepared in which the amounts of dry materials were used to make the amount of water vary in each mixture. In the second stage, four different mixtures were prepared in which the amount of water was used to make the amount of cement vary. Finally, in the third stage, I ashlars were prepared with a single mixture, and three specimens were prepared from this mixture.
2.3.1. Inert Three-Component Mixtures
The design of the mixture involved the use of three aggregates of different grain size, such as commercial sand (CS) of the appropriate grain size in terms of the identified grain size spindle, SWS, and QLD as fine materials (Figure 8).

Figure 8.
Flow chart of the production process with raw material identification.
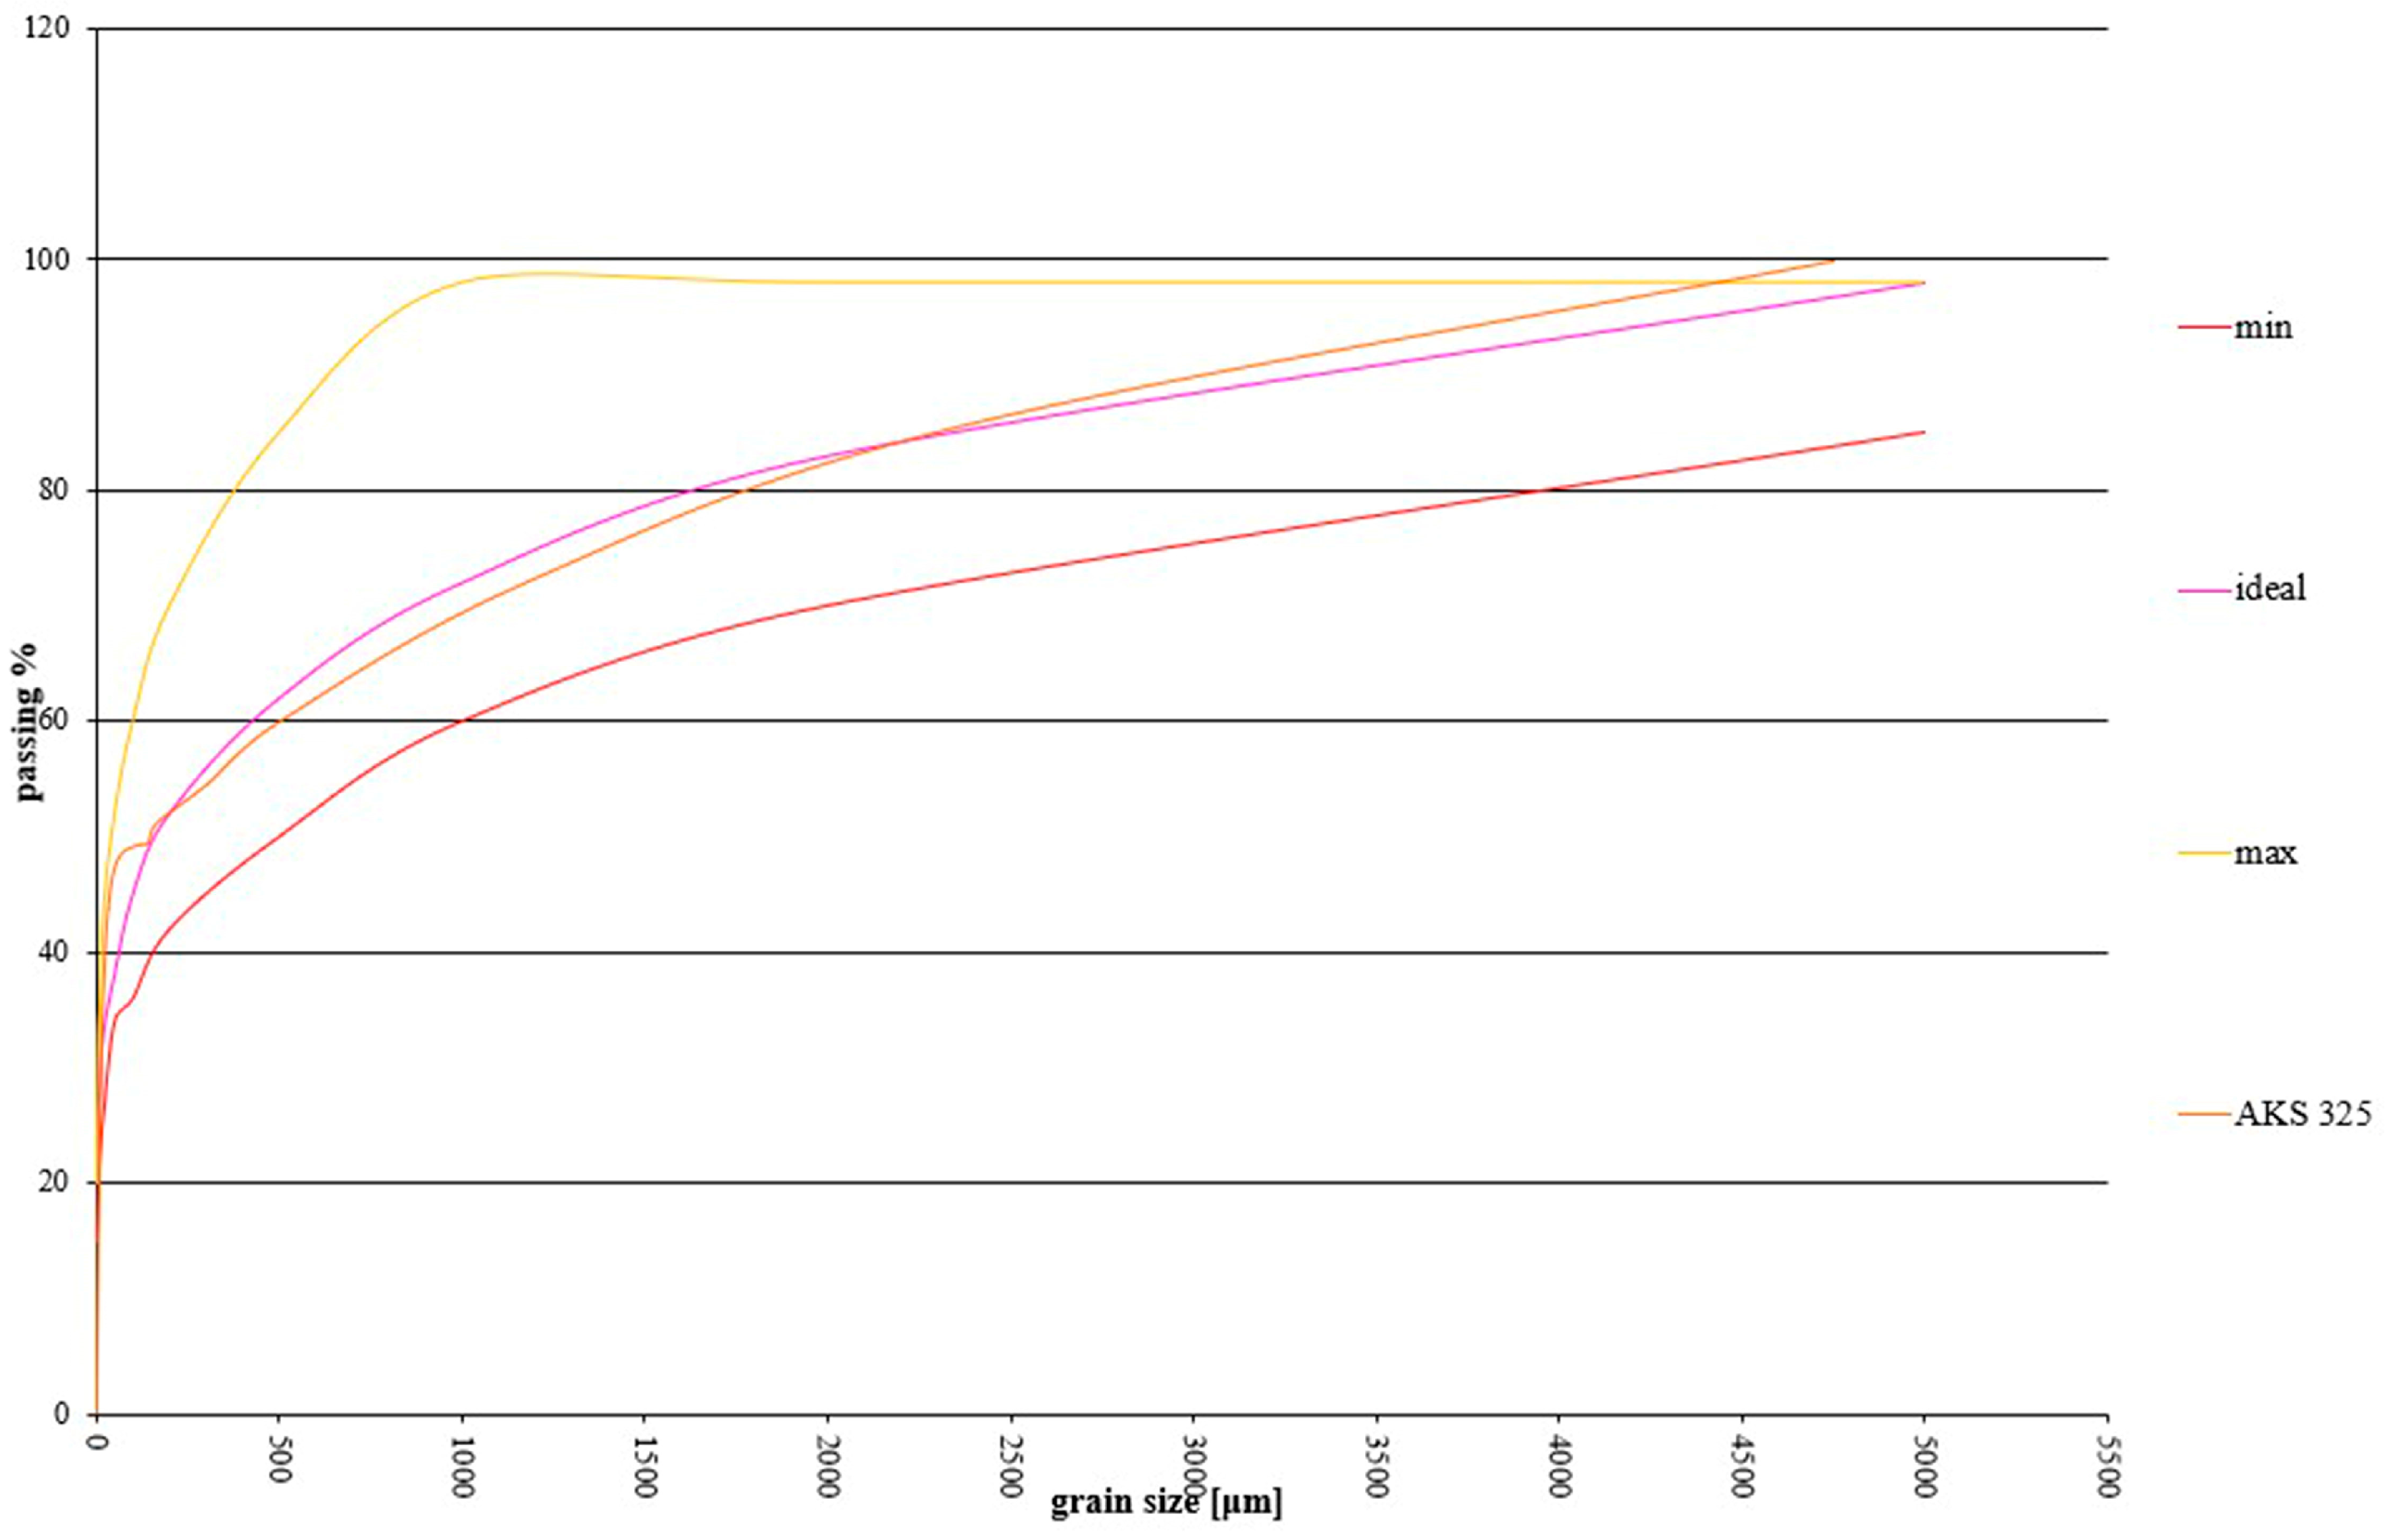
Various compositions were designed by combining different percentages of aggregate raw materials (Figure 9) following the experimental approach [43], and among these, the one that best approximated the ideal reference curve, the AKS325 curve (Figure 10), was identified, which involved the use of 30% by weight of the total aggregates of SWS, 20% of QLD, and 50% of CS.
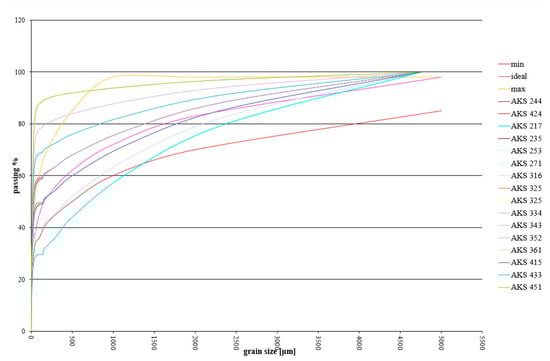
Figure 9.
Some of the designed particle size curves.
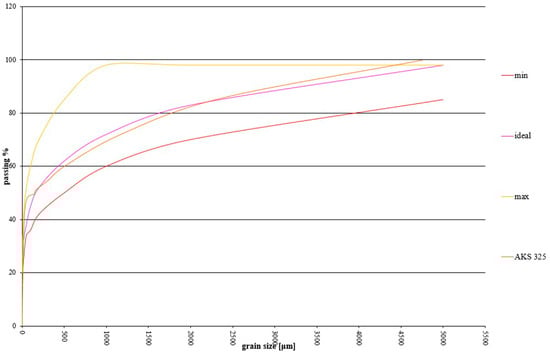
Figure 10.
The AKS325 particle size curve is one of the closest to the ideal reference curve and was used to prepare the first doughs.
The doughs were designed by defining the quantities of each raw material to be included in the mixture according to the optimization approach [43]. The amount of PC was 15.79% by weight on a dry basis, and the aggregates were distributed according to the directions of the designed particle size curve, which identified the use of 50% CS, 30% SWS, and 20% QLD.
The change in the mechanical properties of the compound as a function of the percentage of W added to the mixture was evaluated.
The percentage of water to be added was defined experimentally through tests to define the minimum amounts needed to ensure that the mixture was well mixed.
These showed that the percentage by weight of the dry weight of W can range from a maximum of 13% to a minimum of 10.78% (Table 4).
Table 4.
Doses of doughs containing three different percentages of W.
The mixes were prepared by manually mixing the dry materials, then wet mixing with water spray, amalgamating, and then placing them in the appropriate molds. Compaction was then performed, according to the results of the stress–strain cycles, by applying a force of 56.74 kN to the ram, resulting in an average surface tension of 43 MPa. At the end of the compaction process, the specimen was removed from the mold and placed in a humidity-controlled chamber for 28 days to cure (100%) according to UNI EN 12390-2:2019 [54].
At the end of the curing period, the specimens were subjected to compressive yield strength tests according to UNI EN 772-1:2015 [55], water absorption tests according to UNI EN 772-11:2011 [56], and the density and Young’s modulus were calculated. Optical microscopy observations (reflected polarized light) were also carried out to evaluate the microstructure of the samples.
2.3.2. Inert Two-Component Mixtures
The design of the mixture involved the use of two aggregates such as CS of appropriate granulometry with respect to the identified grain size spindle and SWS as the fine material. The same production process was employed (Figure 11).
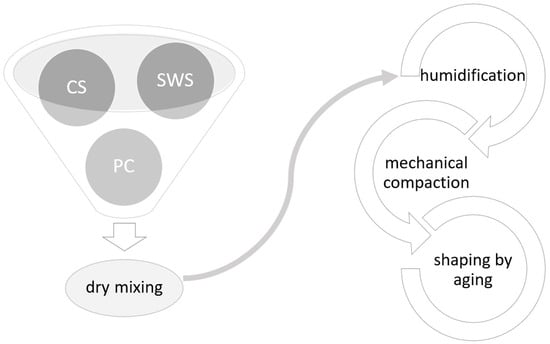
Figure 11.
Flow chart of the production process with raw material identification.
Particle size curves were constructed analogous to the previous ones in terms of the component percentages. The composition that best approximated the ideal reference curve was then determined, which was to use 50% by weight of the total aggregates of SWS and 50% of CS.
For the design of the mixtures, the quantities of each material to be included in the compound were defined. In this case, the variation in the mechanical properties when the amount of PC was inserted was studied, so, starting from the mixtures previously made, the amount of W was kept fixed at 13.69% by weight on a dry weight basis, and the percentage of PC was varied (Table 5).
Table 5.
Dosages of doughs containing different percentages of PC.
The percentage of W, which was slightly higher than the maximum percentage used in previous doughs, was determined via further testing to verify the workability of the dough. These tests were necessary because the raw materials in the dough had changed, in particular the amount of SWS present, which is a finer material than QLD; therefore, a slightly higher amount of W was required to be kneaded.
The amount of PC was varied from a maximum of 13.64% to a minimum of 8.3% by weight on a dry basis, which is the ideal percentage as specified by Hyperbrick. The mixes were made by hand mixing the dry materials, then moistened and kneaded to the consistency of moist earth and then placed in special cylindrical molds. Compaction was then performed by applying a force of 80 kN to the piston, resulting in an average surface tension of 42.97 MPa. At the end of the compaction process, the specimens were removed from the mold and placed in a chamber at a constant temperature of 70 °C and completely immersed in water for 7 days for accelerated curing.
At the end of the curing period, the density of the specimens was calculated, and their compressive strength was then tested according to UNI EN 772-1:2015 [55].
3. Results and Discussion
3.1. Inert Three-Component Mixtures
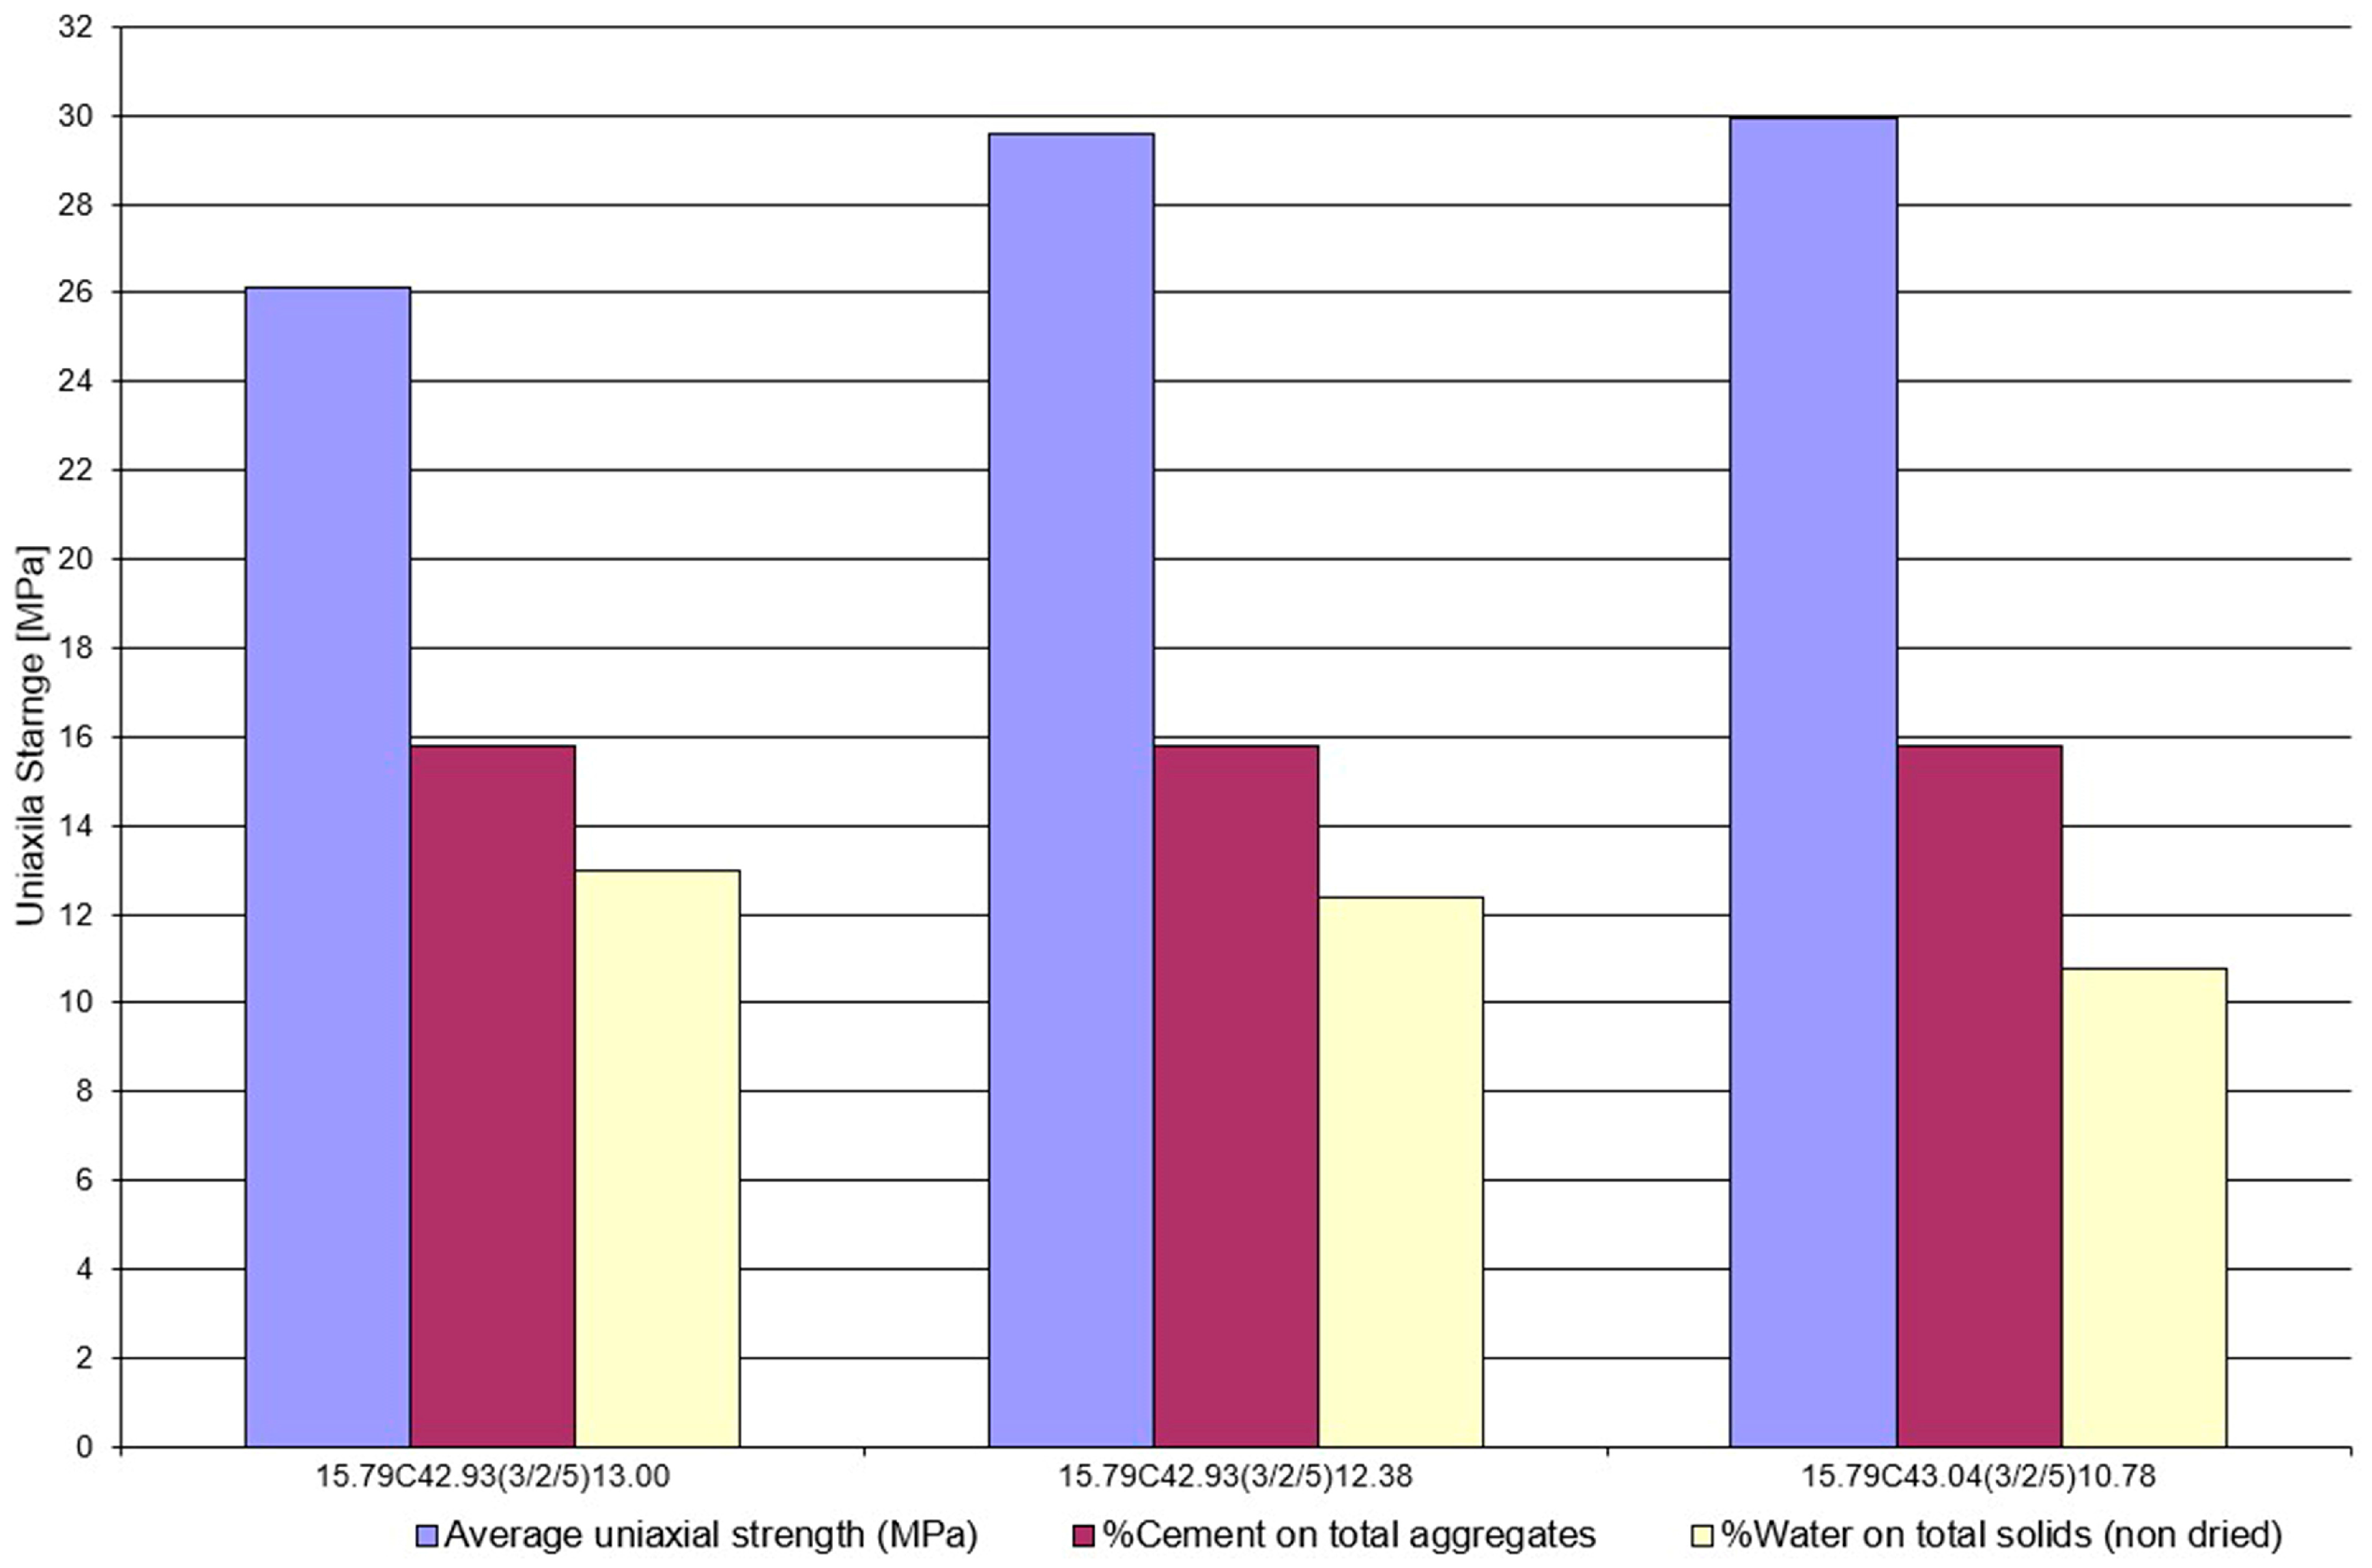
Table 6 shows the test results of the compressive strength and water absorption tests. It shows that the composites had an average density of 2.13 g/cm3, an average Young’s modulus of 1.48 GPa, and a water absorption rate of 10.05%.
Table 6.
Inert Three-Component Mixtures. Design parameters and averages of performed test results.
Figure 12 shows how the strengths vary as the amount of water added to the mix changes, and specifically how the strength values, which are all very high, increase as the percentage of water present decreases.

Figure 12.
Variation in mechanical strength for the same amount of cement and as the percentage of water changes.
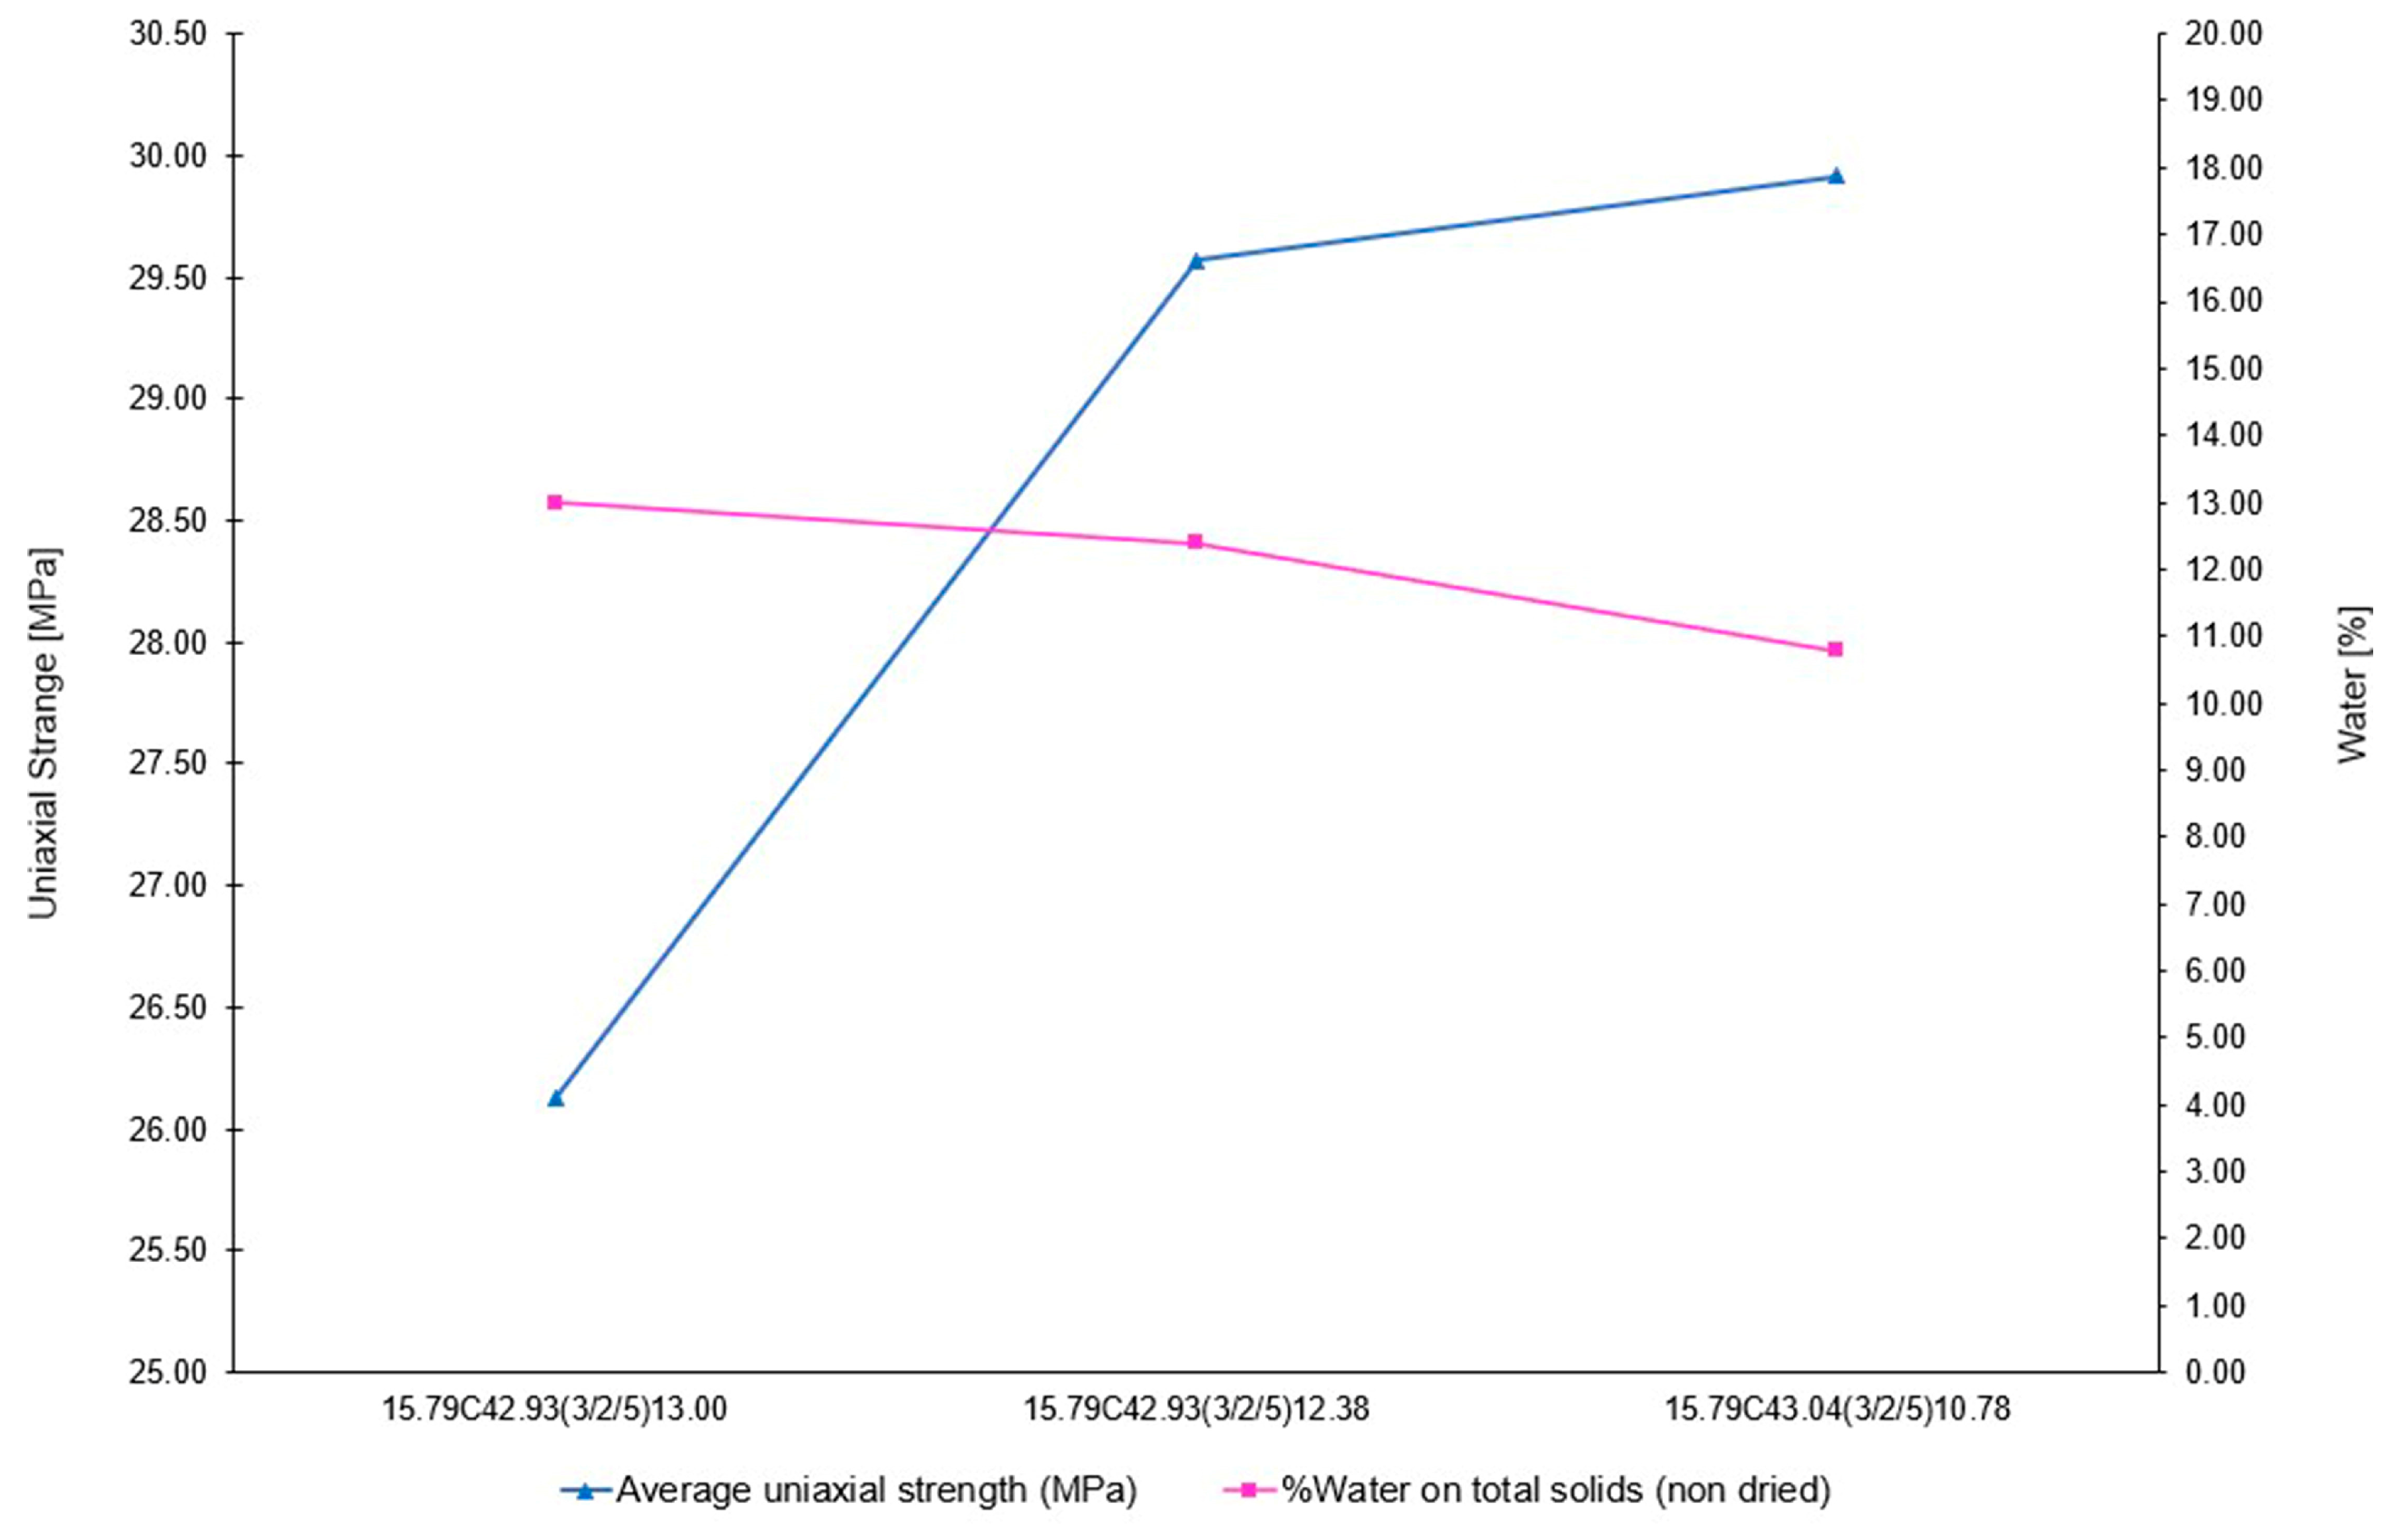
In particular (Figure 13), it is interesting to see how a decrease in water ranging from 13% to 12.38% (relative decrease of 0.62%) resulted in a notable increase in the compressive strength from 26.12 MPa to 29.57 MPa (relative increase of 11.67%), while for a subsequent decrease that changes the percentage of water from 12.38% to 10.78% (relative decrease of 1.6%), the increase in compressive strength is much lower in percentage terms, going from 29.57 MPa to 29.92 MPa (relative increase of 1.17%), which suggests a stabilization of the value, making further decreases in water, which would be detrimental to the workability of the mix, insignificant in terms of improving the compressive strength.
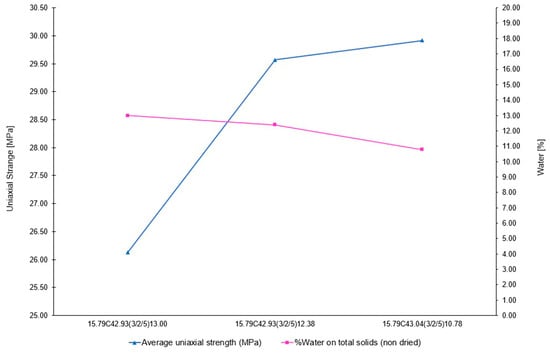
Figure 13.
Change in compressive strength in relation to percentage of water present.
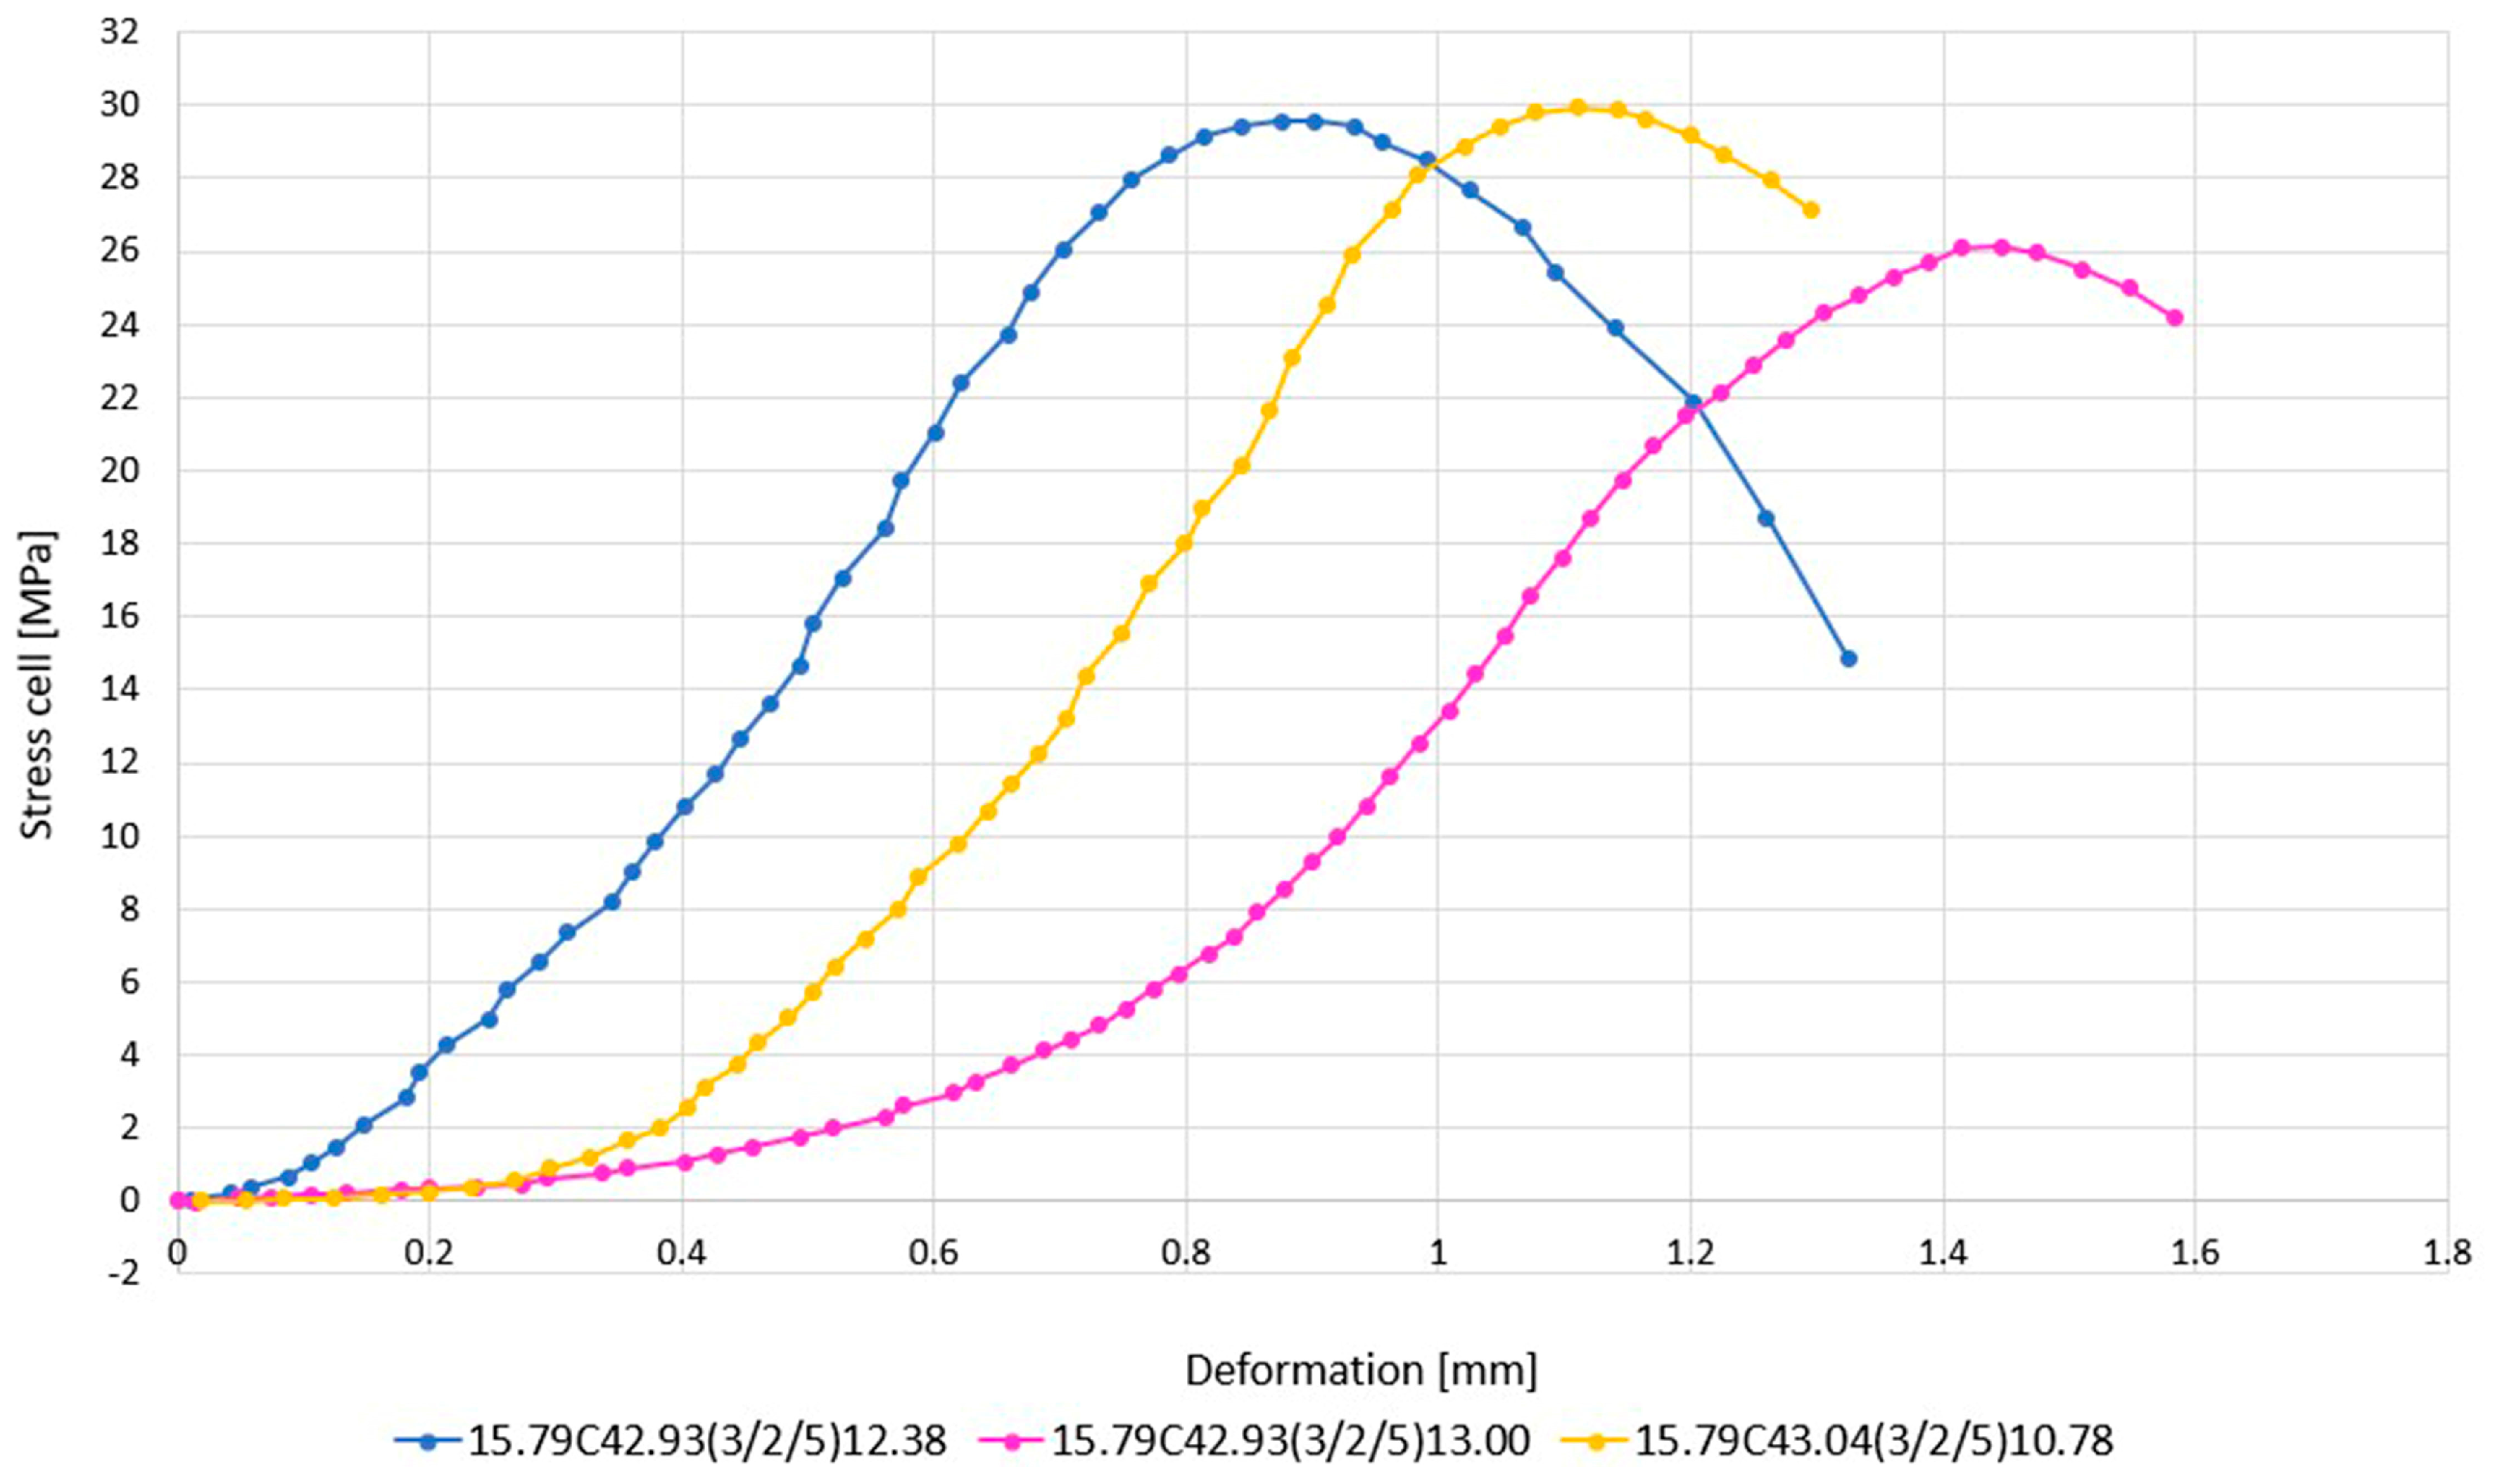
The analysis of the stress–strain curves (Figure 14) shows that all the compounds underwent a significant amount of deformation prior to failure. The mix with a higher water content underwent additional compaction, which was quite significant, before it began to resist compressive stresses. This behavior can be attributed to an additional step of expulsion of the free water still present in the mix that is not required for the stechiometric reaction of the cement (the water required for the stoichiometric reaction is equal to 25% of the cement weight).
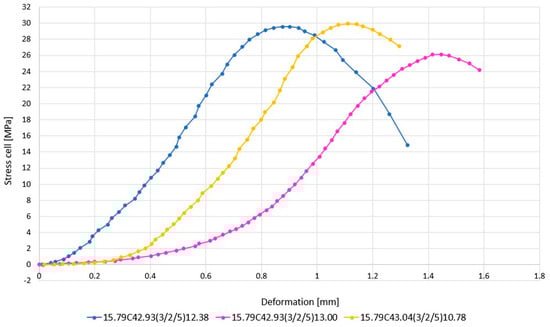
Figure 14.
Stress–strain curves for the three different doughs tested.
Based on the compressive strength and density values, a comparison was made with the classification of concretes from UNI EN 206:2021 [57] and NTC 2018 [58].
This allowed evaluating which mixtures can be considered lightweight concretes (LC) (800 kg/m3 ≤ ρ ≤ 2000 kg/m3) and non-lightweight concretes (NLC) (ρ > 2000 kg/m3), as well as structural concretes (SC) (Rck,cube ≥ 15 MPa) and non-structural concretes (NSC) (Rck,cube < 15 MPa). In particular, it can be seen that all three mixtures fell under non-lightweight concrete (NLC) and structural concrete (SC).
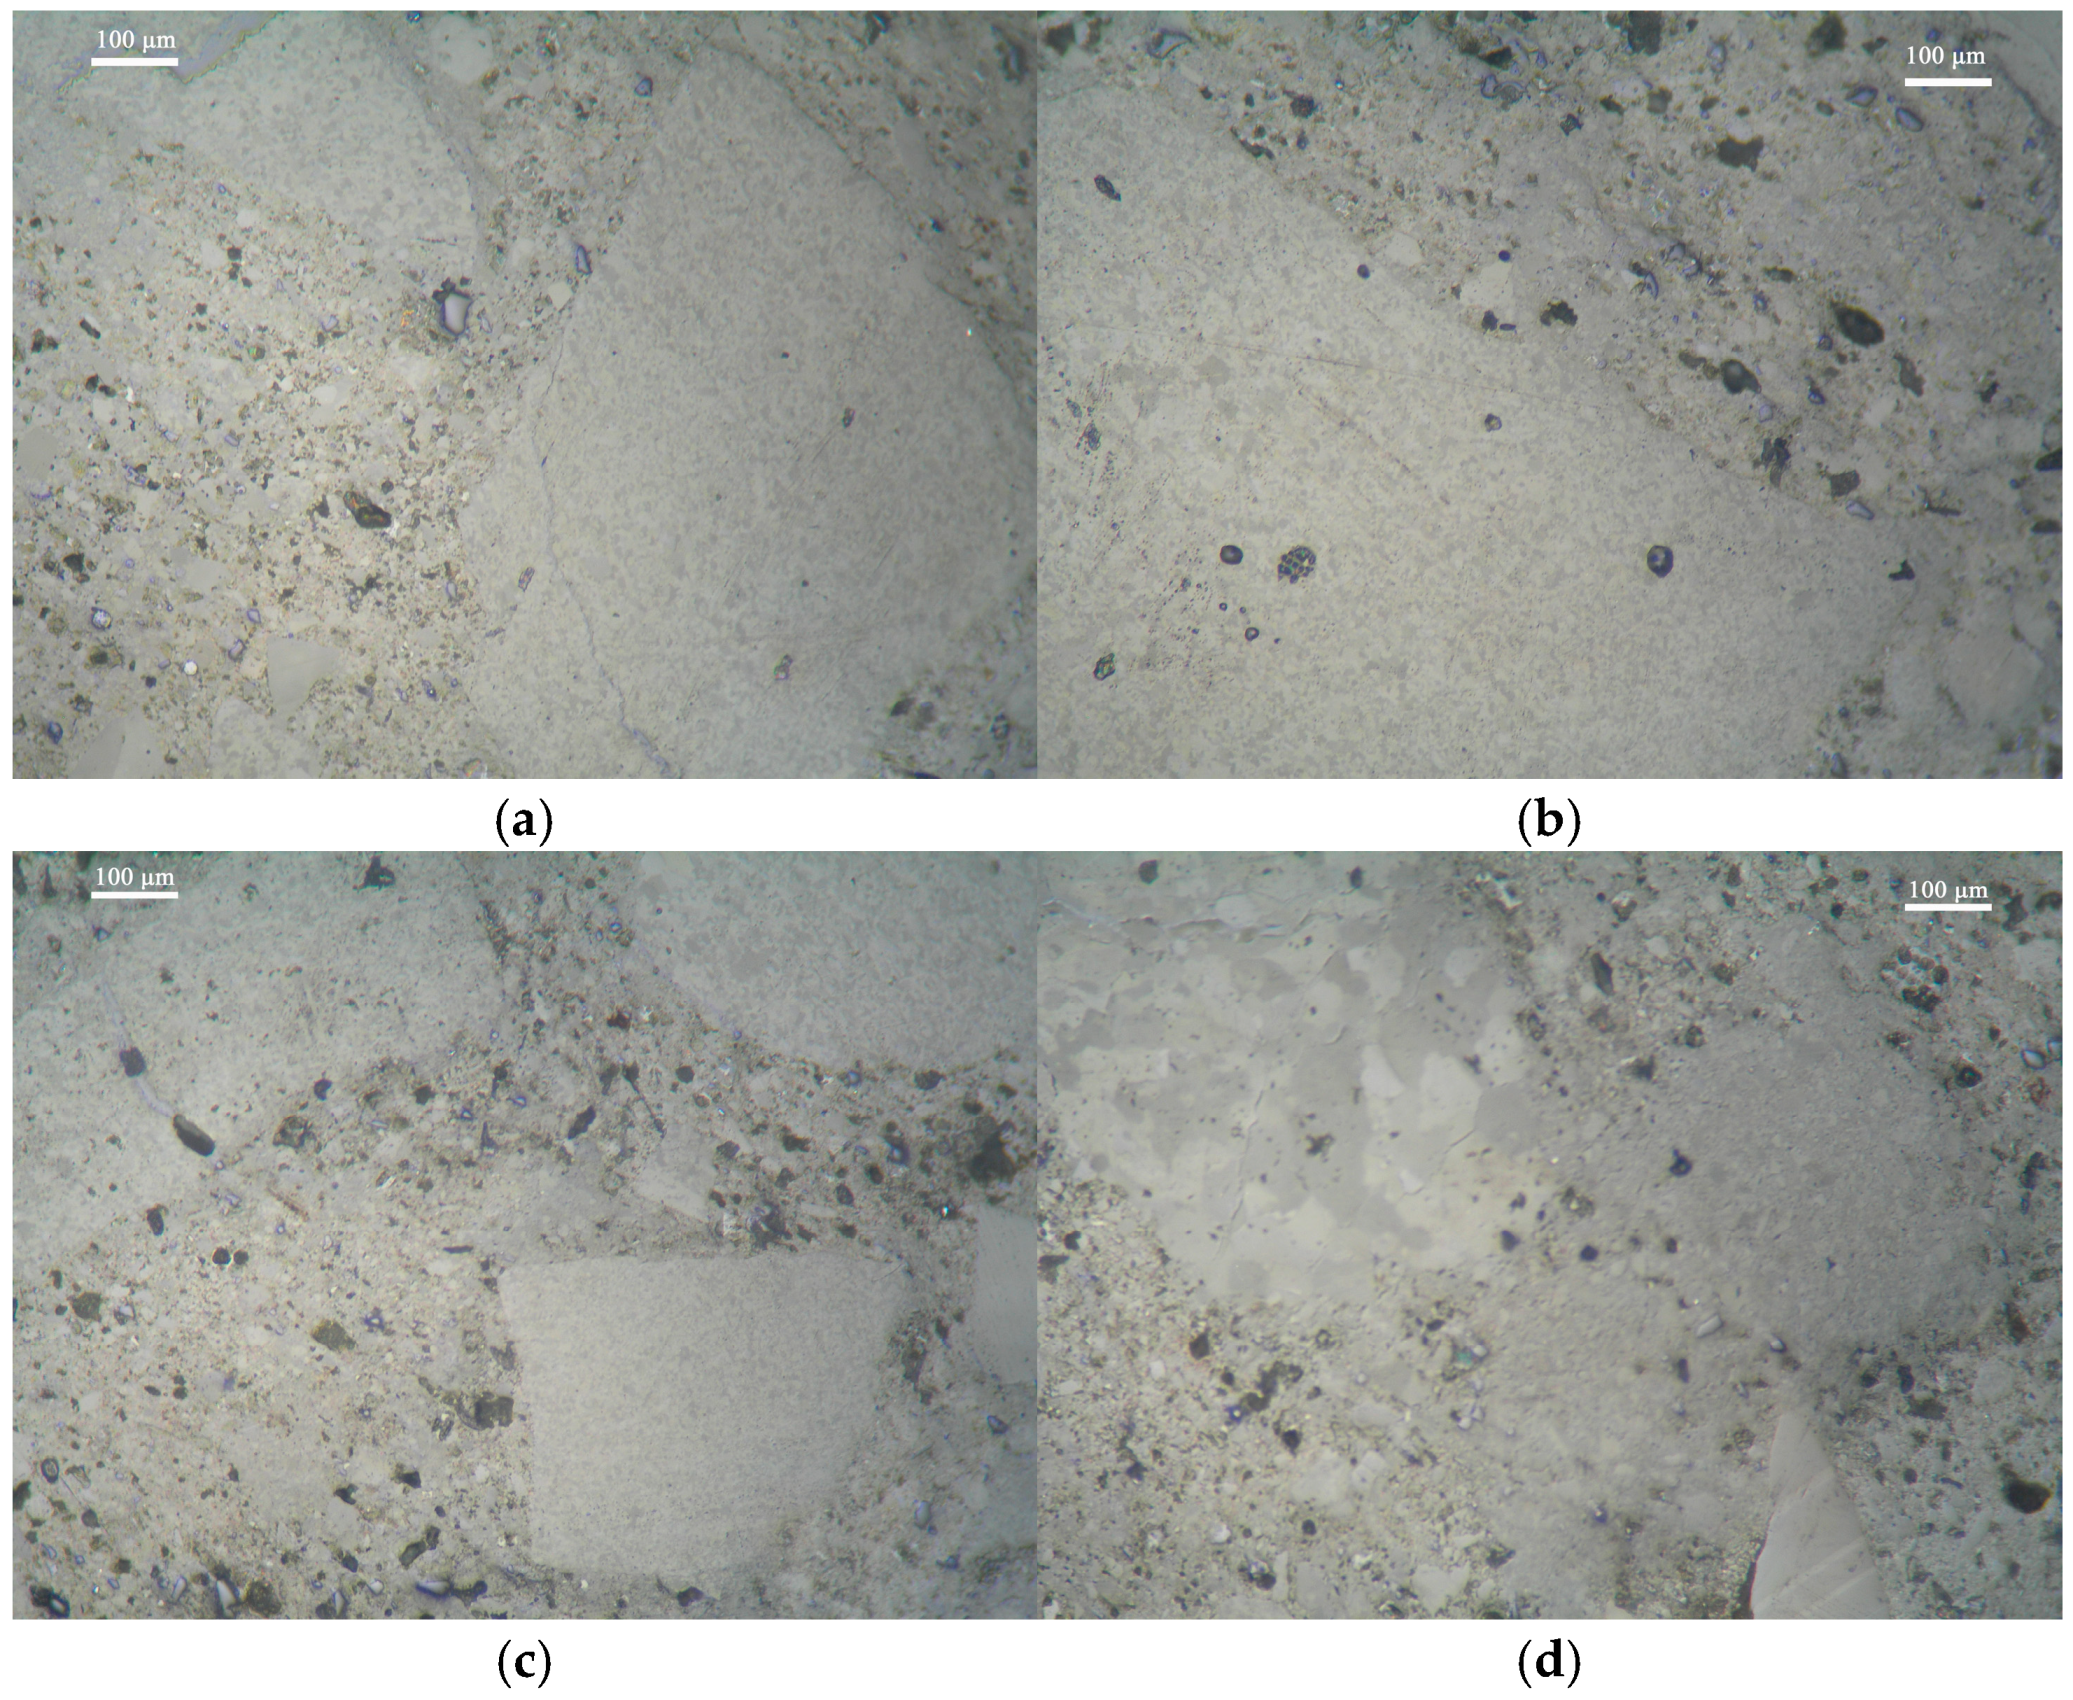
An initial observation of these slurries was made under a polarized light microscope. A thin section were prepared by cutting the specimens in different directions; then, they were bonded with resin, cut, and polished in sections suitable for examination using a polarized microscope in reflected light. The observations were carried out in both parallel and crossed Nicols (polarizing filters) for better determination of the mineralogical constituents. The following were observed: calcite big grains, cement phases, fine calcite grains, and voids.
The images in Figure 15 show that there are no voids or continuous solutions between the sand grains with larger sizes and the PC and SWS slurries with comparable grain sizes, indicating an excellent degree of compaction and cohesion between the materials. The number of voids present is very limited, and they are typically less than 30 μm in size. In addition, the voids do not appear to be interconnected, and therefore, the presence of capillaries causing the priming capability of a material is not apparent.
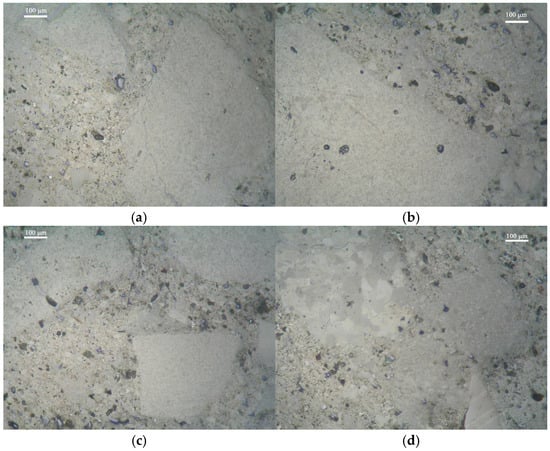
Figure 15.
Polarized light microscope images. (a,b) 15.79C42.93(3/2/5)13.00 specimen; (c) 15.79C42.93(3/2/5)12.38 specimen; (d) 15.79C43.04(3/2/5)10.78 specimen.
3.2. Inert Two-Component Mixtures
Table 7 shows the compressive strength test results. It shows that the compounds had an average density of 2.16 g/cm3.
Table 7.
Inert Two-Component Mixtures. Design parameters and averages of test results performed.
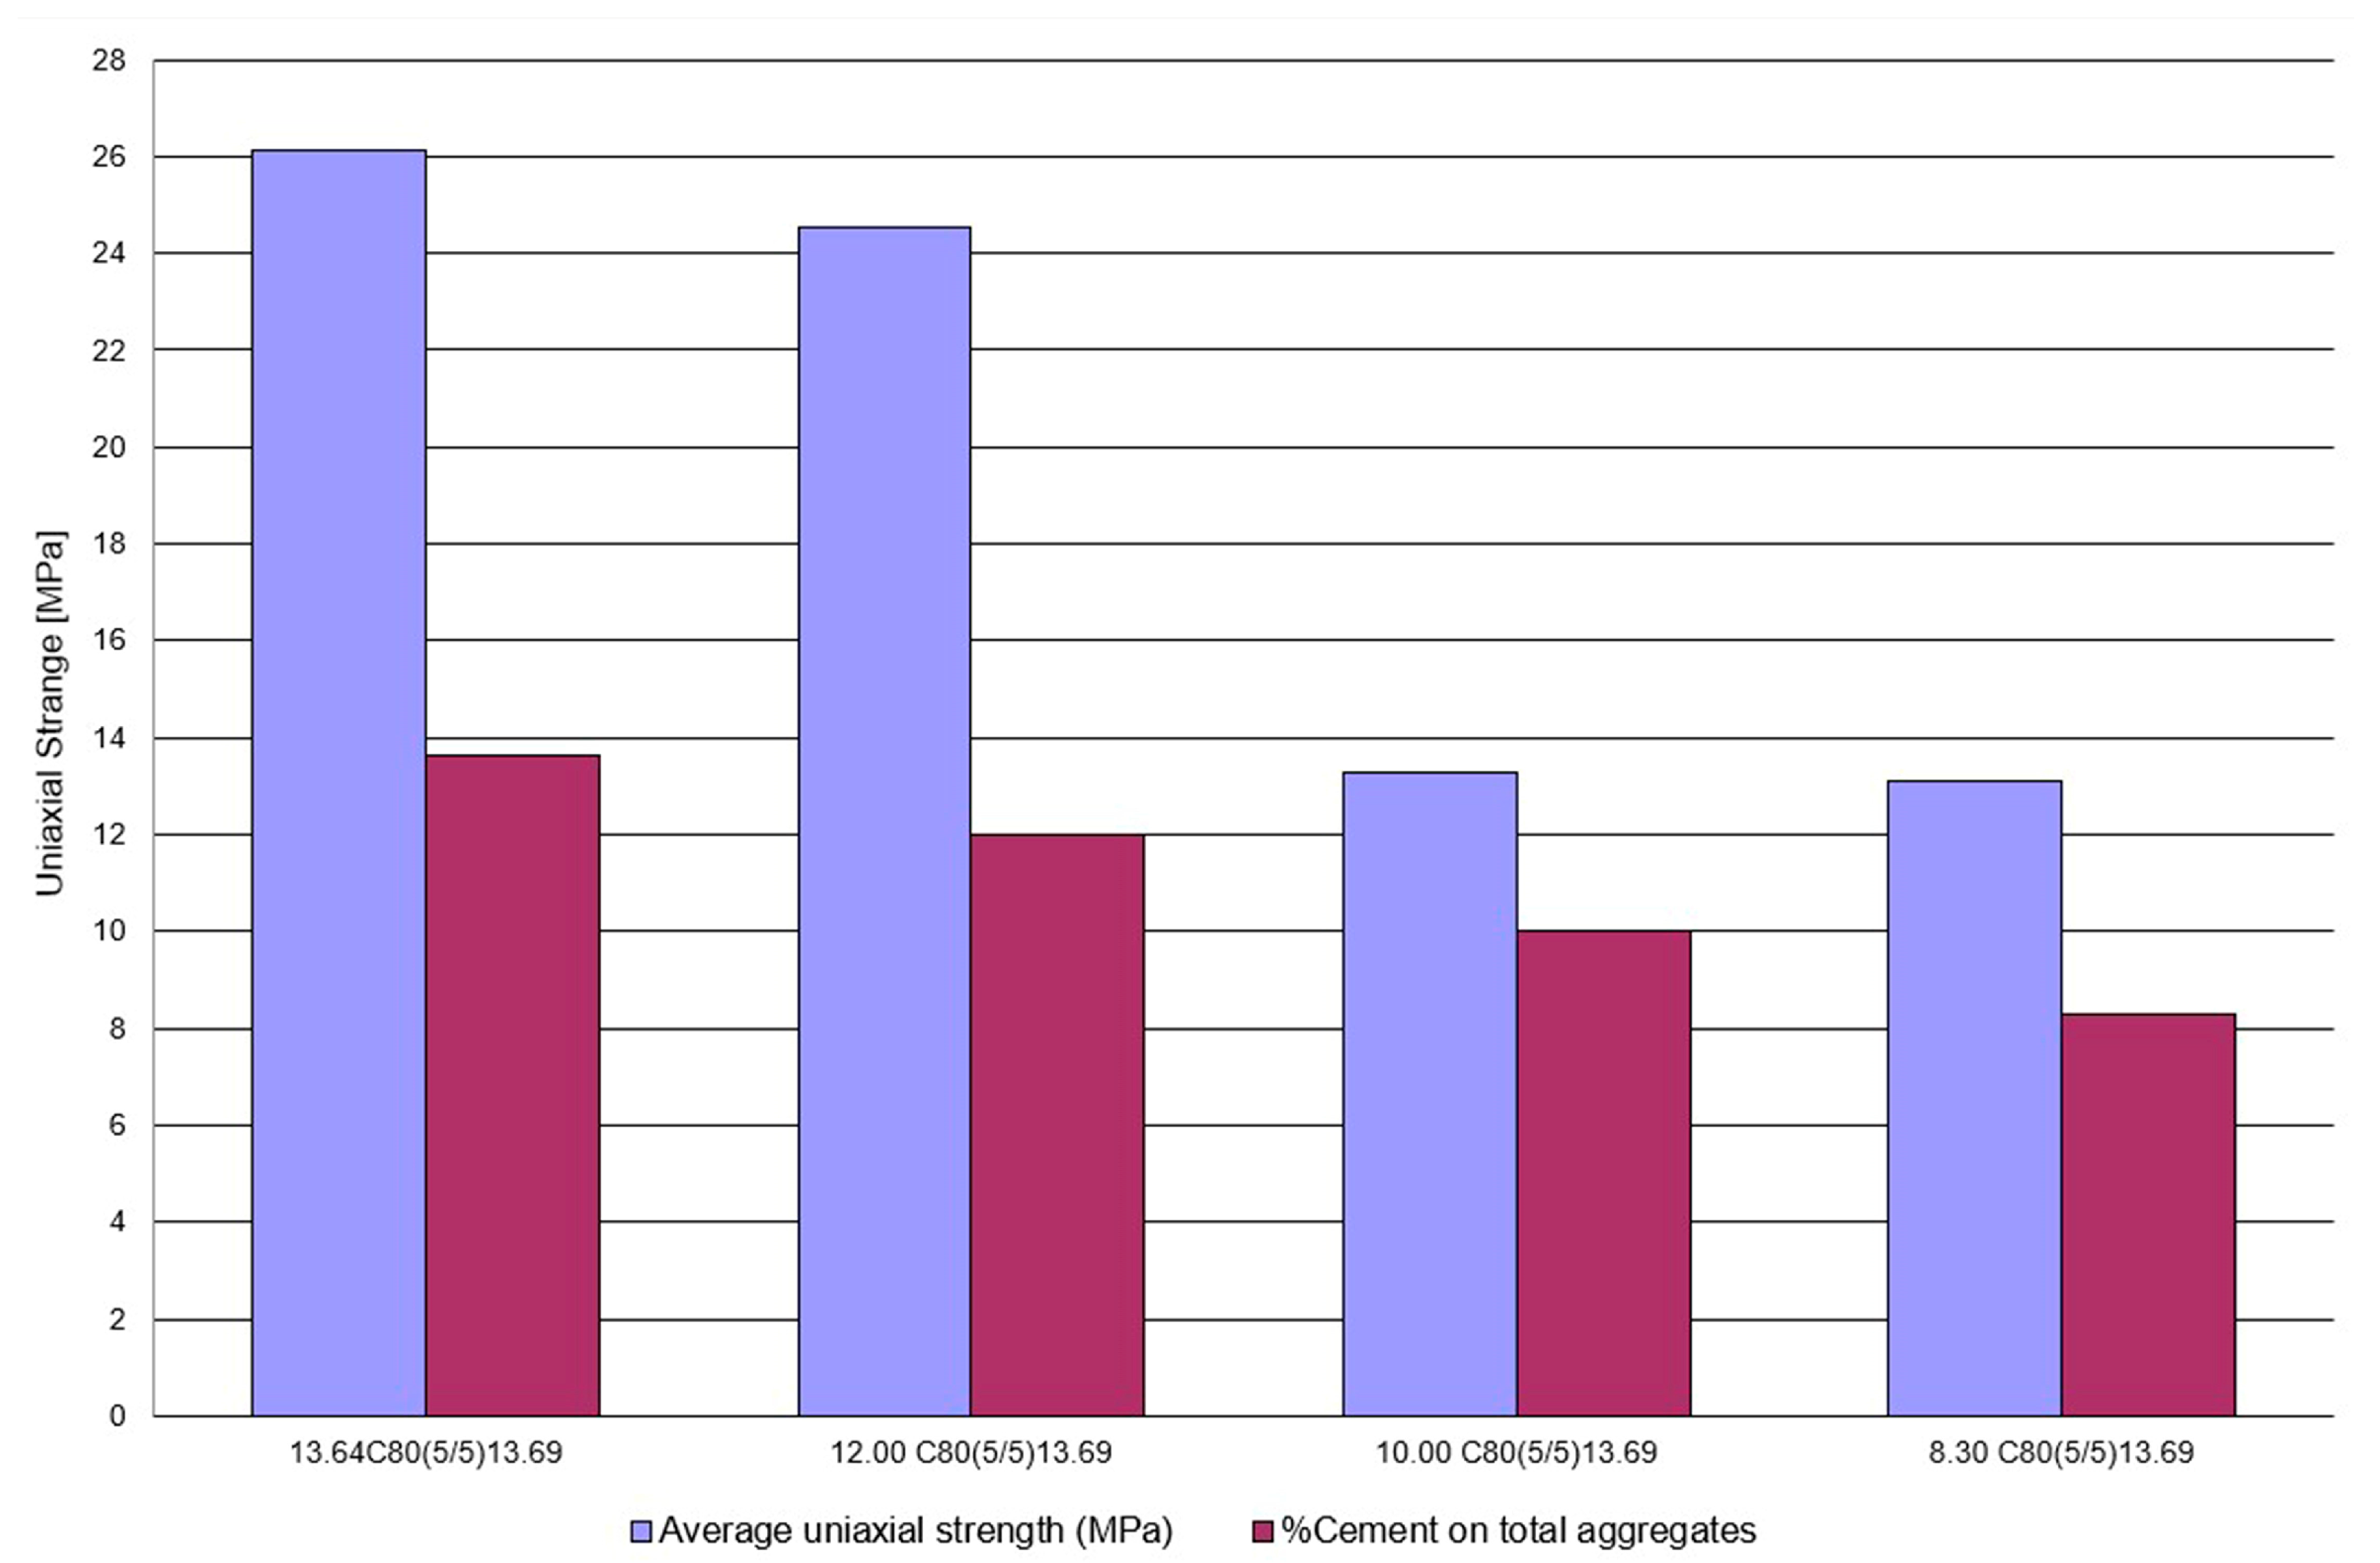
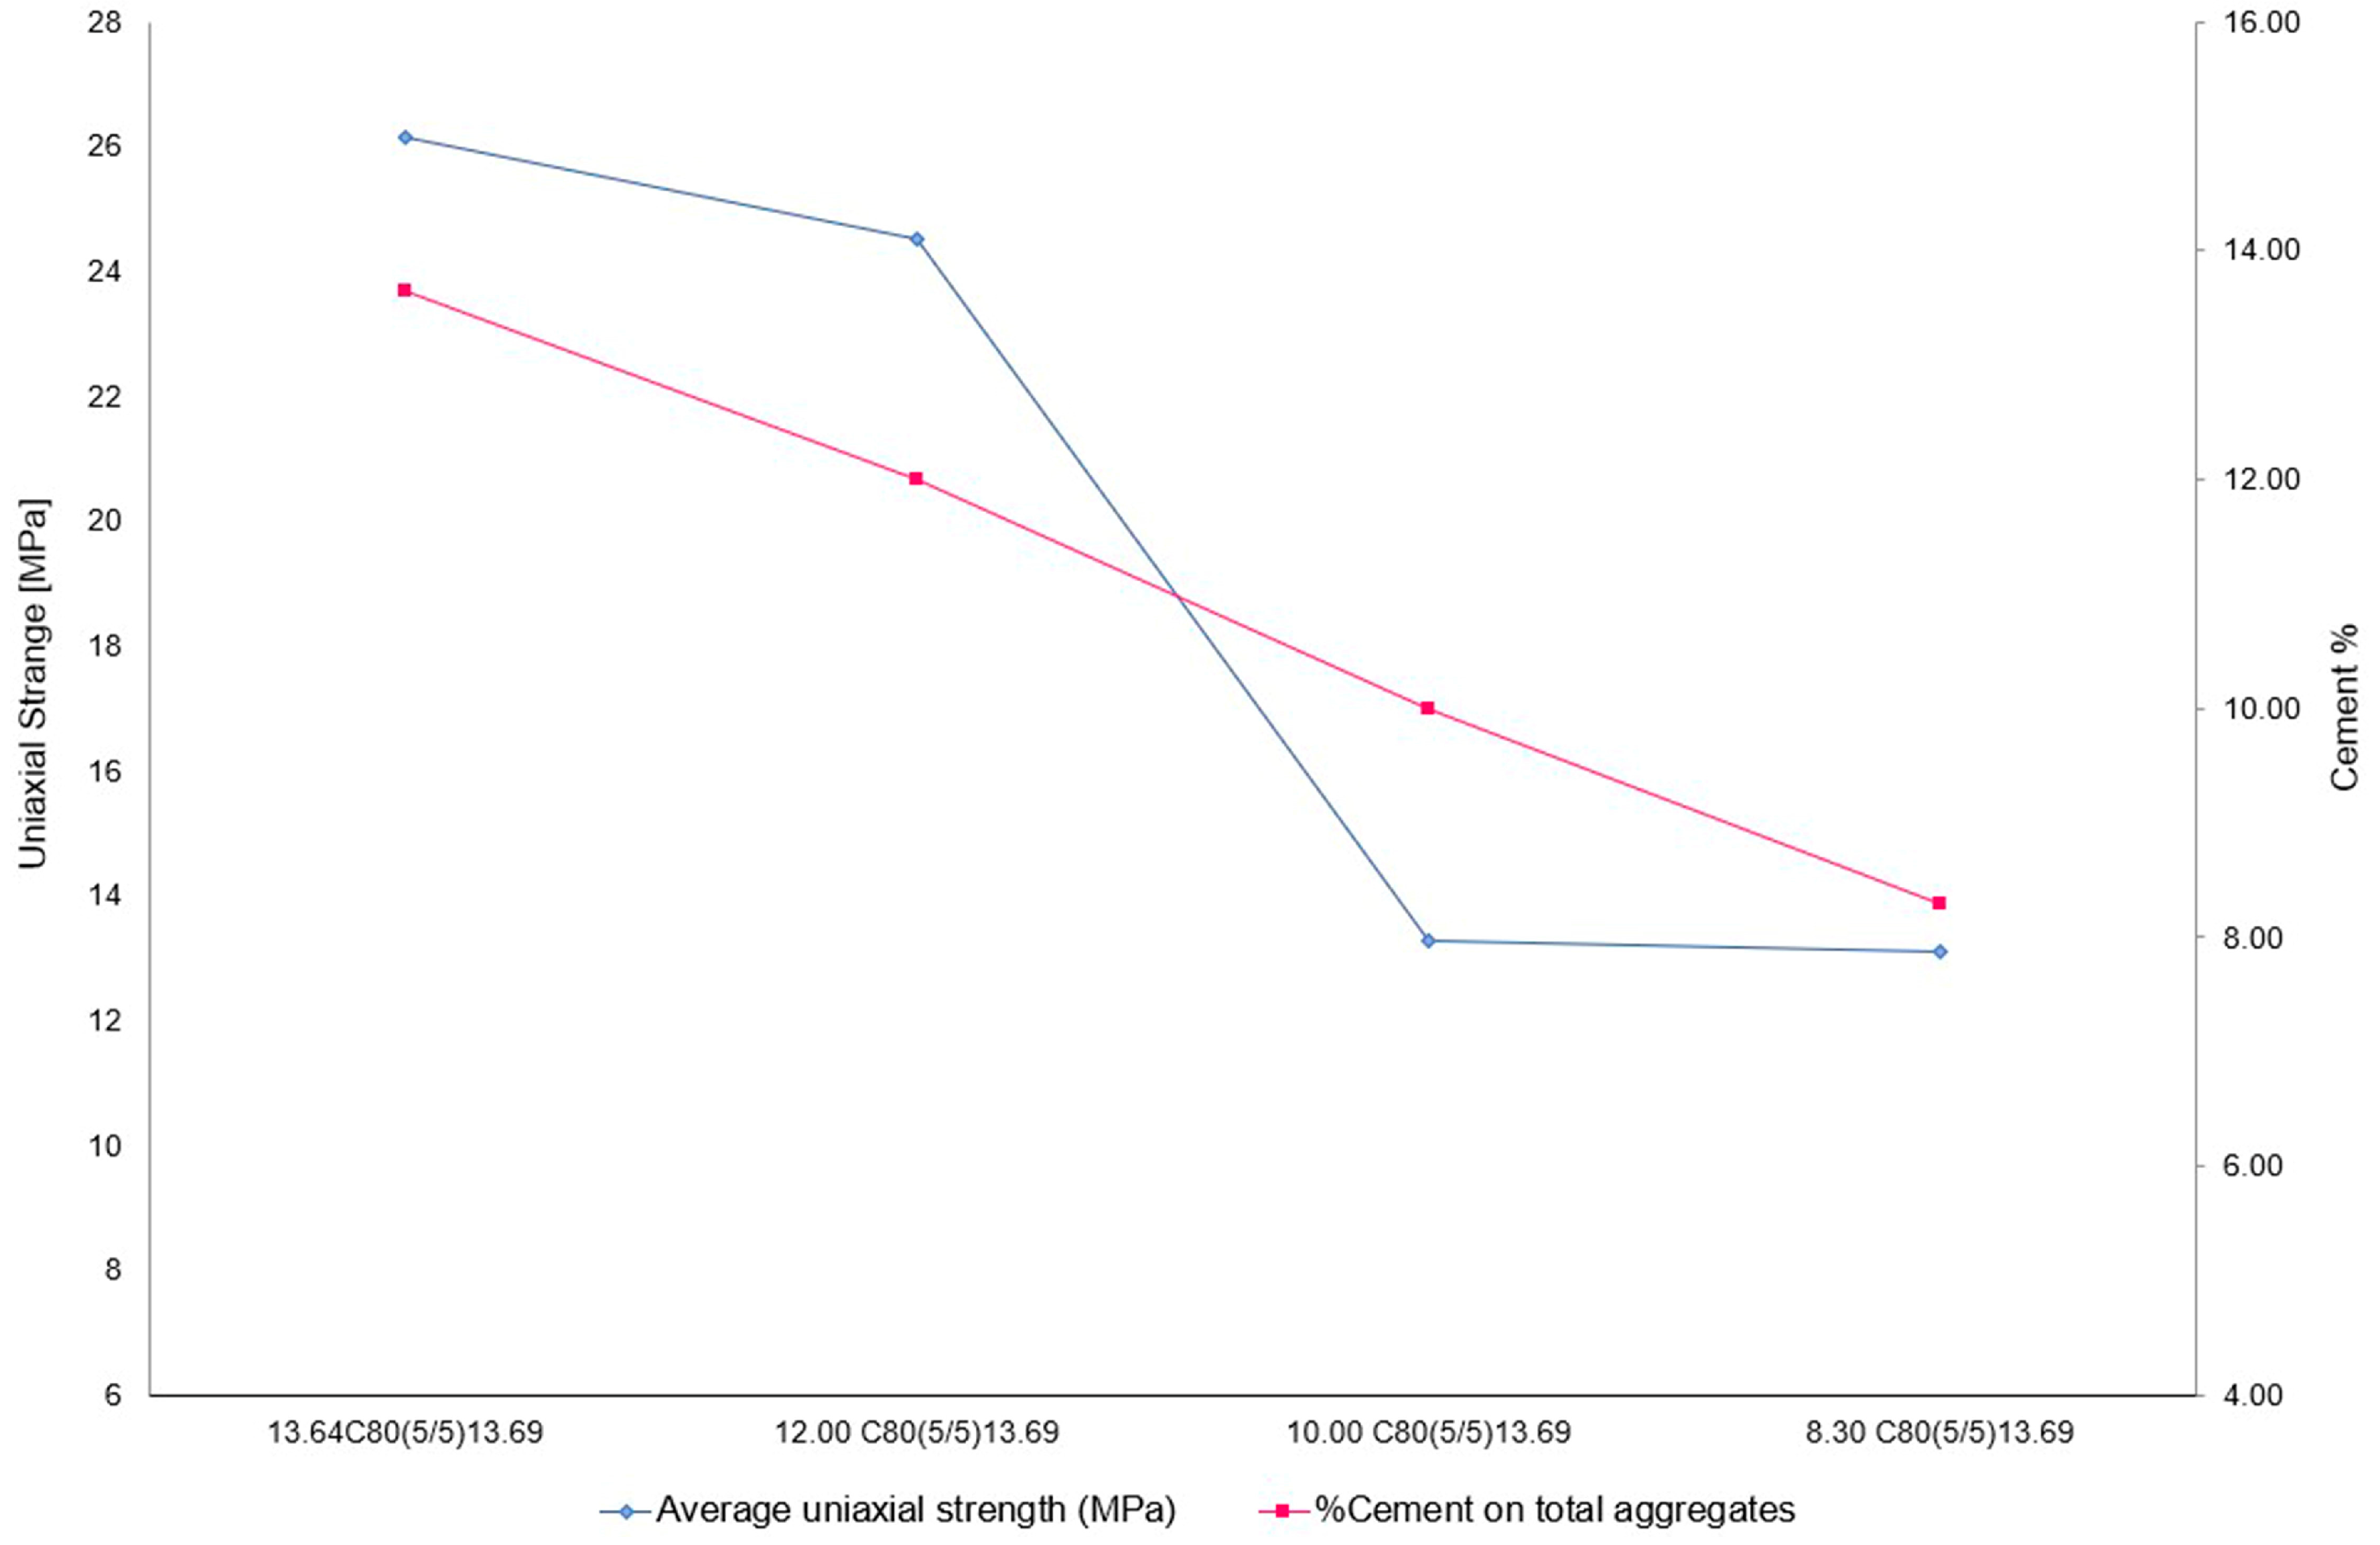
Figure 16 shows the results of the compressive strength tests. It can be seen, as expected, that the strength values, which are still high, decrease as the percentage of cement present decreases.

Figure 16.
Variation in mechanical strength as cement content changes.
In particular, it can be seen that the decrease in strength appears to be rather gradual, but that when going from a cement content of 12.00% to one of 10.00%, there is a sharp regression of the same (Figure 17). More specifically, going from a cement content of 13.64% to one of 12.00% (relative decrease of 1.64%) has a decrease in compressive strength from 26.13 MPa to 24.53 MPa (relative increase of 6.12%); while for a subsequent decrease that takes the percentage of cement from 12.00% to 10.00% (relative decrease of 2.00%), the compressive strength drops sharply from 24.53 MPa to 13.28 MPa (relative decrease of 44.80%). The subsequent decrease in cement from 10.00% to 8.3% (relative decrease of 1.7%) leads to a decrease in mechanical strength, which again becomes less significant from 13.28 MPa to 13.12 MPa (relative decrease of 1.2%).
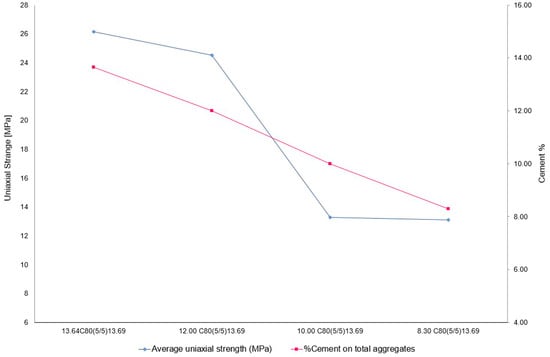
Figure 17.
Change in compressive strength in relation to percentage of cement present.
In this case, the comparison with the classification of concretes from UNI EN 206:2021 [51] and NTC 2018 [52] shows that all four mixes are classified as non-lightweight concrete (NLC) and that the mix 13.64C80(5/5)13.69 and 12.00 C80(5/5)13.69 are classified as structural concrete (SC), while the mixes with the lowest percentage of PC are classified as non-structural concrete (NSC).
This behavior needs to be studied further, because at first glance it may appear to be an anomaly due to possible defects in the dough mixing technique, which was performed manually. Further testing is therefore required to verify whether this sharp jump in performance is precisely due to an anomaly in the preparation of the mixture, or whether it is a repetitive behavior, and thus identify a limit beyond which the performance changes by an order of magnitude.
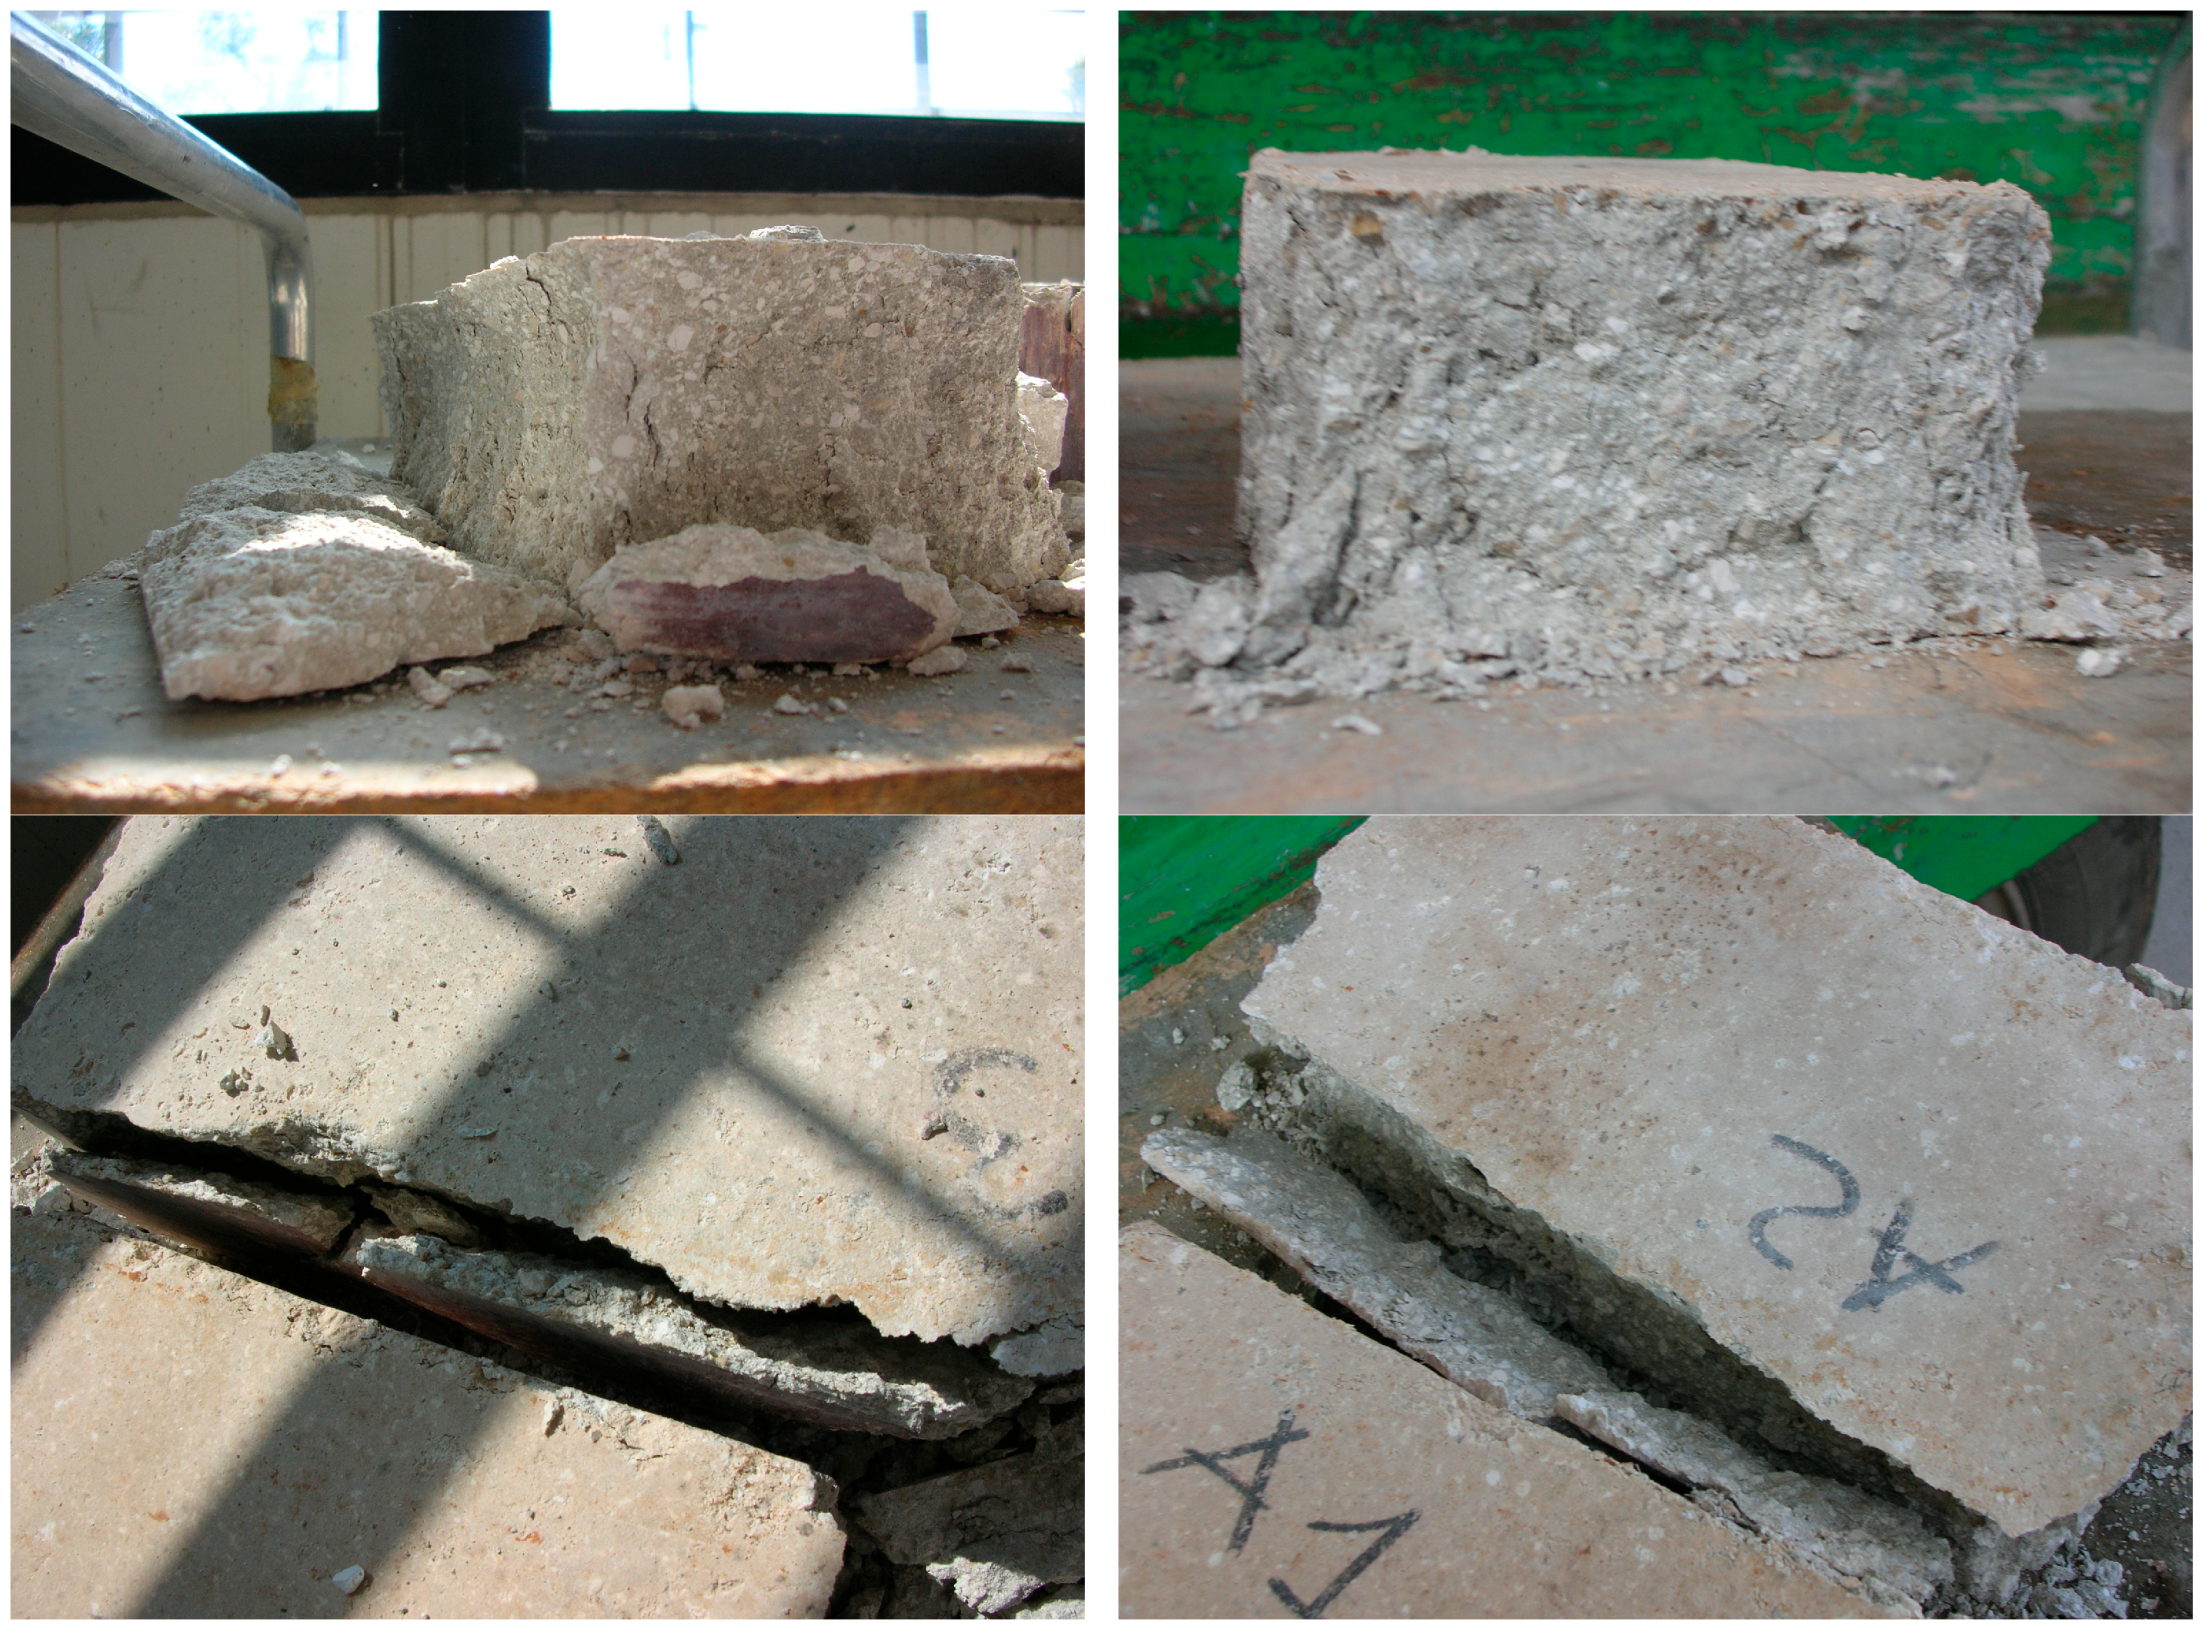
The analysis of the failure mechanism of the specimens (Figure 18) is interesting, showing the classic hourglass pattern typical of concrete specimens, even in the mixes containing the least amount of PC.
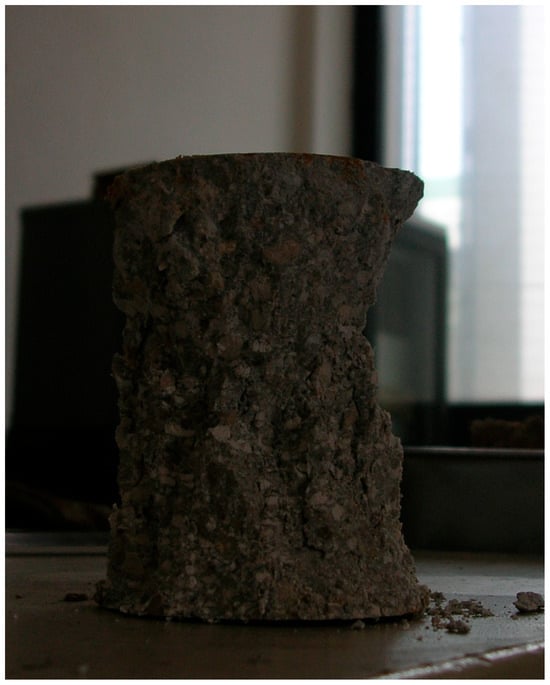
Figure 18.
Cylindrical specimen after fracture.
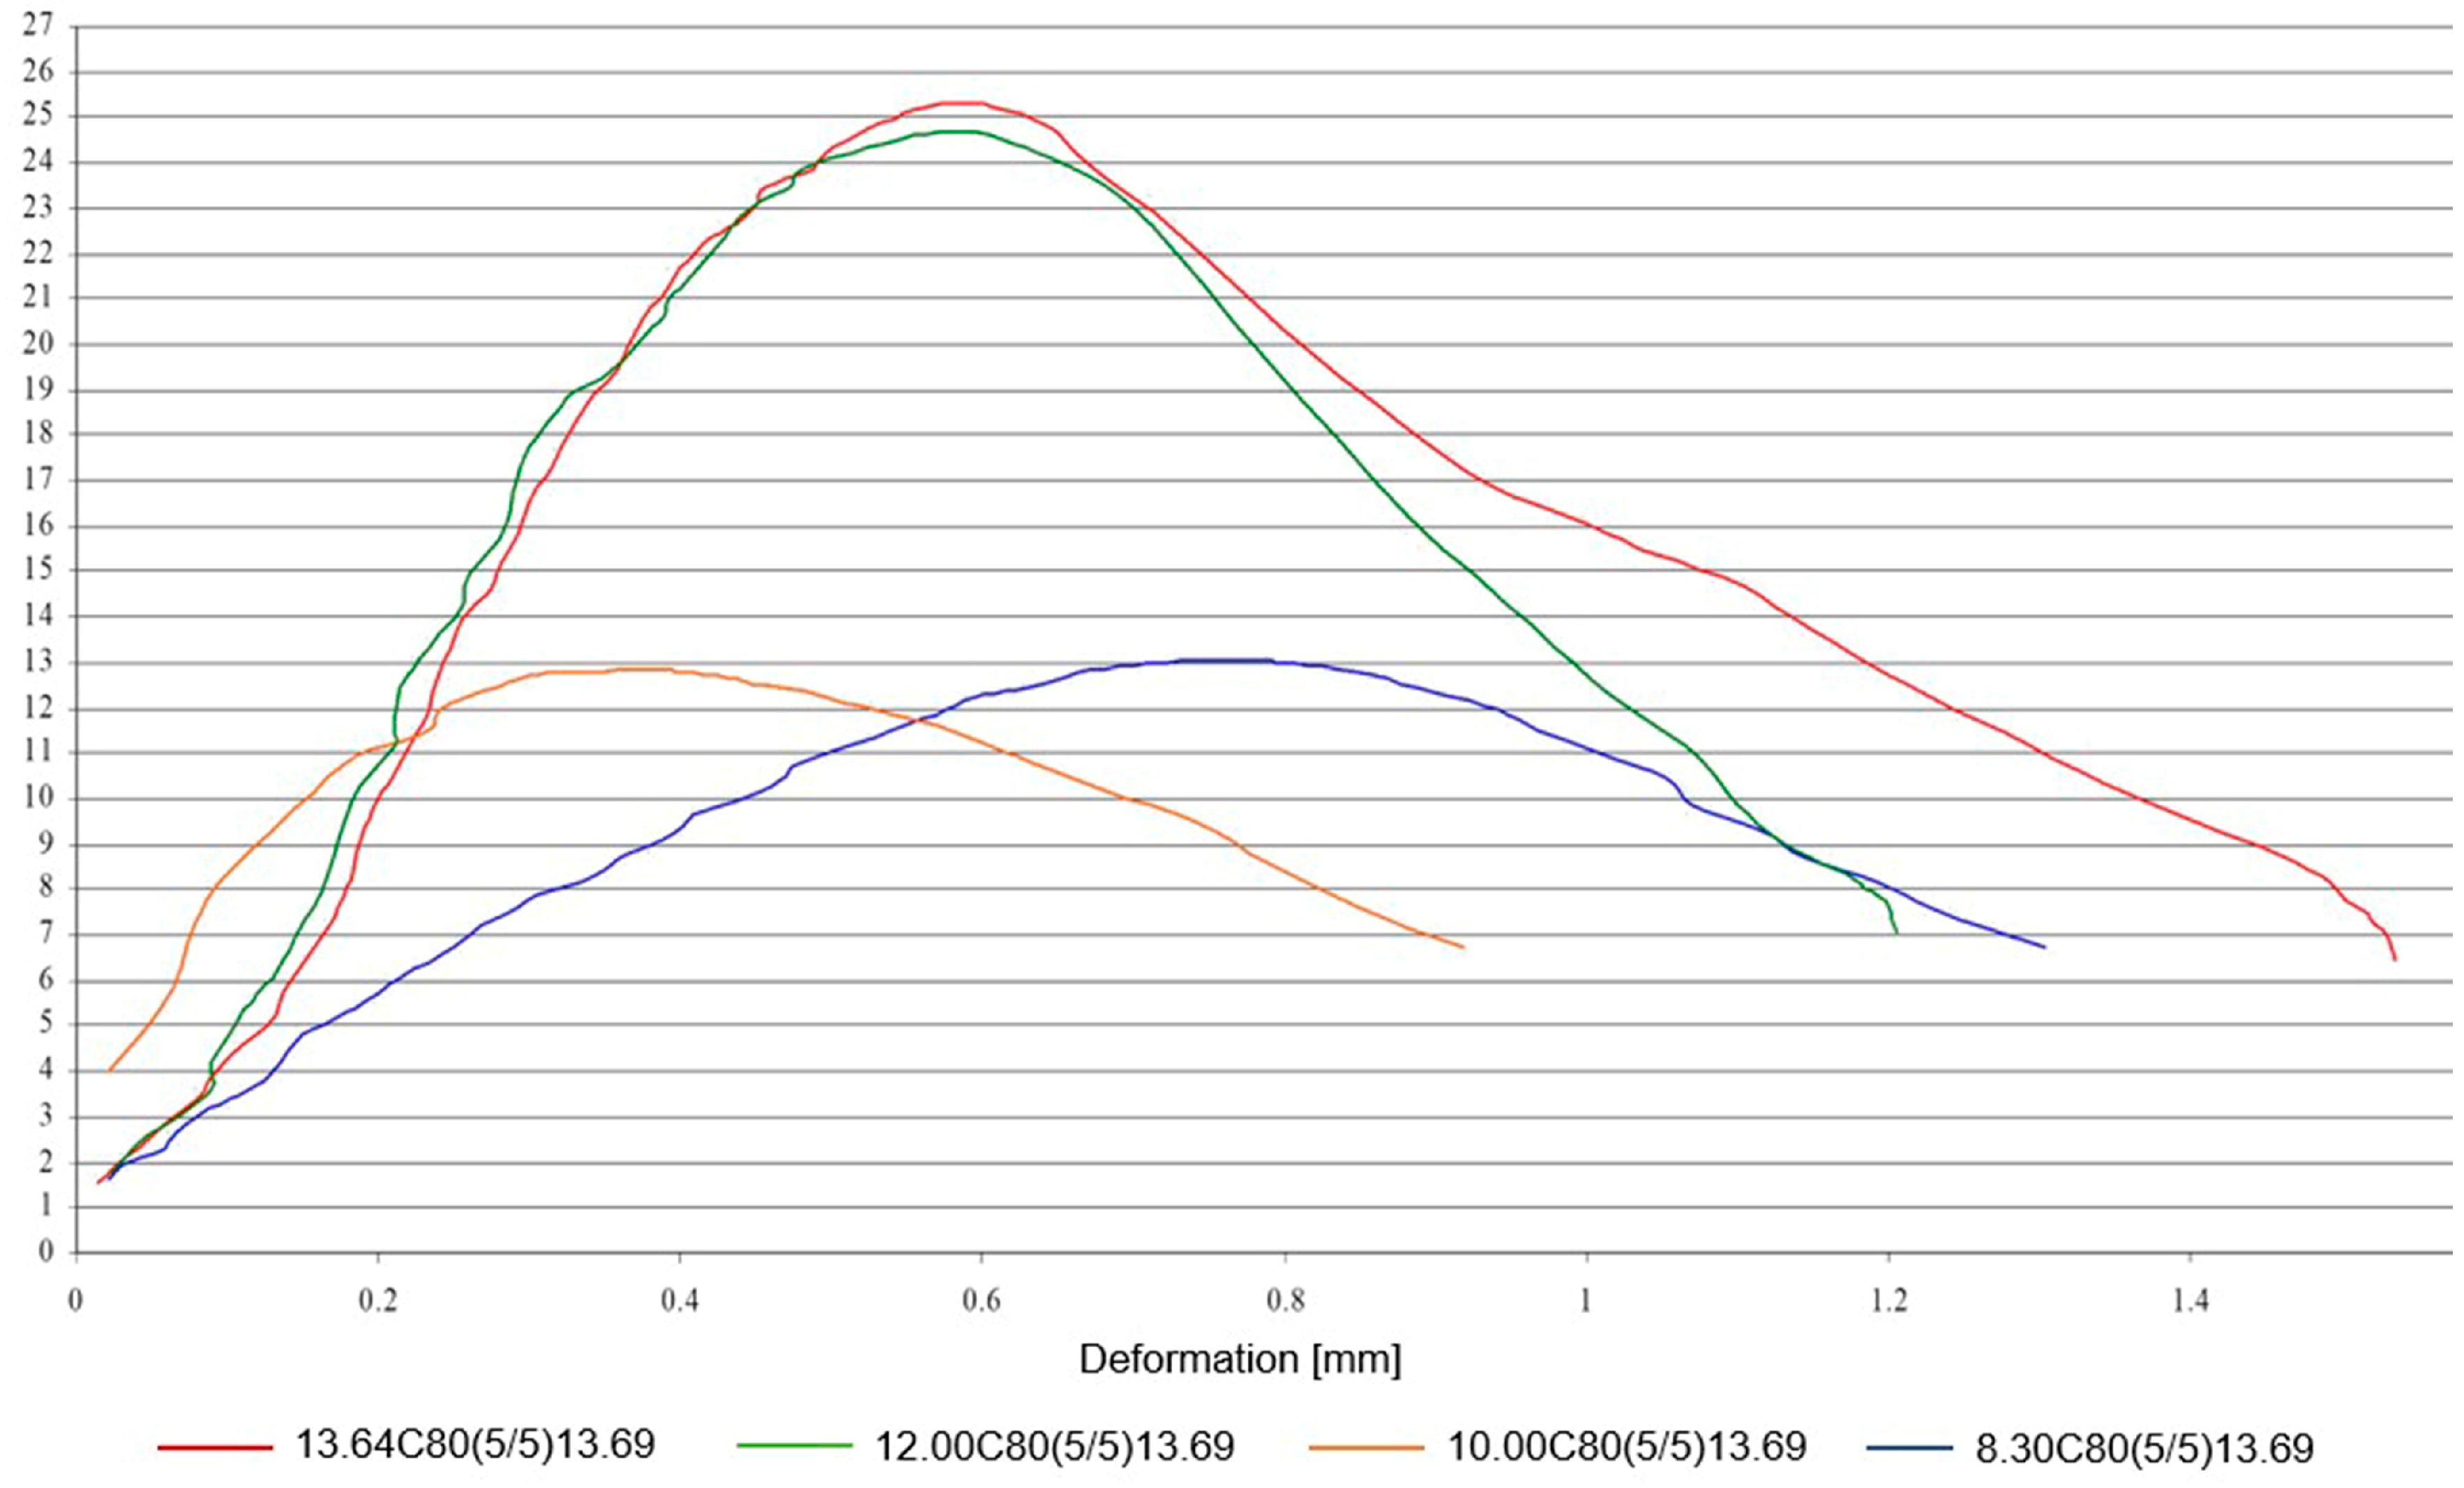
Finally, the analysis of the stress–strain curves (Figure 19) shows that all the slurries showed a considerable amount of deformation before failure, and that the slurries containing higher amounts of SWS underwent a significant increase in their plastic behavior due to the further reduction in the inherent brittleness of the cement.
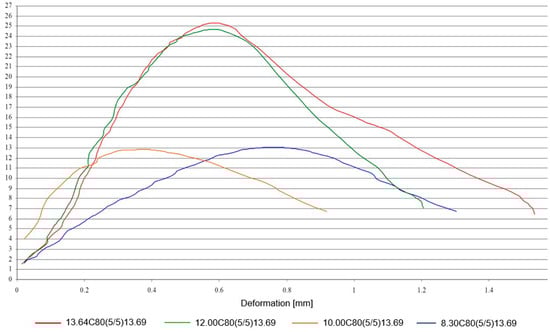
Figure 19.
Stress–strain curves for the different doughs tested.
Brick
Commercially sized blocks were made to test the mechanical properties as the size of the specimens changed. Therefore, the previous production process was repeated, and the 13.64C80(5/5)13.69 mixture containing CS and SWS was selected.
Three specimens were prepared as described in Table 8 and placed in 20 × 15 cm rectangular molds with a height of 10 cm equipped with a pressing plate on the entire exposed surface (Figure 20).
Table 8.
Mixture dosages and compaction tension.
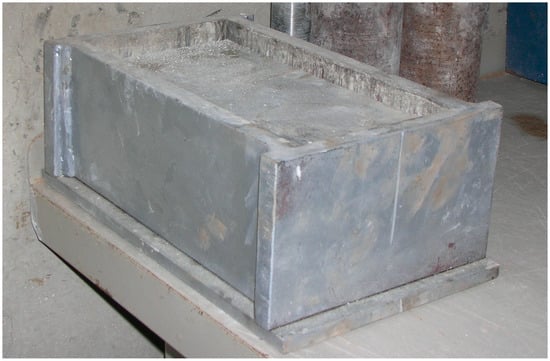
Figure 20.
Rectangular formwork with upper pressing plate.
During the compaction phase, variations in the applied pressures were necessary. In fact, given the considerable difference in the surface area between the cylindrical specimens and the block (24.79 cm2 for the cylinders and 300 cm2 for the block), to exert a surface tension on the block similar to that exerted on the cylinders would have required the application of a remarkably high pressure of about 975.6 kN.
We then proceeded with compression by stopping the pressure at 145 kN, a value indicated by Hyperbrick (Table 8).
At the end of the compaction process, the specimens were removed from the mold and placed in an accelerated curing chamber at a constant temperature of 70 °C for 7 days, completely immersed in water.
At the end of the curing period, the specimens were taken out (Figure 21), and their density, which was about 1.95 g/cm3, was calculated, as well as the volume loss due to compaction, which resulted in a reduction in the block height from 10 cm of the formwork to about 7 cm.
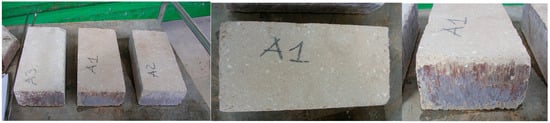
Figure 21.
The blocks after maturation.
The blocks were tested for compressive strength according to UNI EN 772-1:2002 (Figure 22), and the results (Table 9) show an average strength of 13.15 MPa, as expected, lower than that recorded for the same mixture placed in cylindrical specimens subjected to higher compaction.
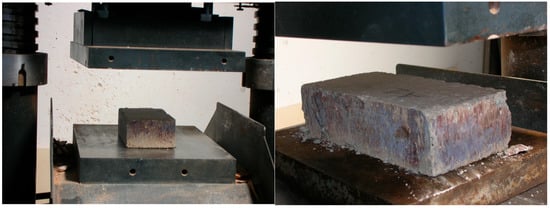
Figure 22.
The blocks during the compressive strength test.
Table 9.
Design parameters and averages of performed test results.
The analysis of the failure mechanism of the specimens (Figure 23) showed failure surfaces according to the indirect hyperboloid. In addition, the surface that failed along all four sides of the block had very small thicknesses compared to the surface of the entire specimen, while the core of the specimen remained intact and compact.
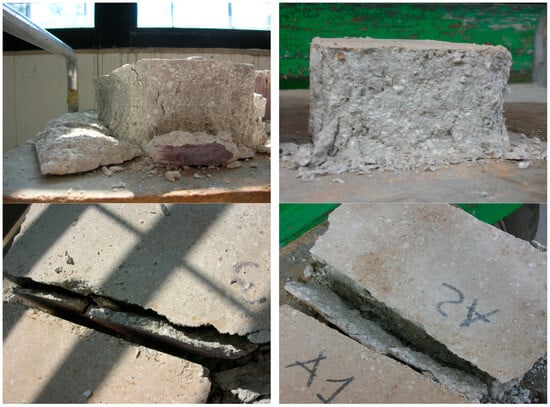
Figure 23.
Mechanisms of block failure.
In order to evaluate the mechanical strengths found in relation to the possible uses of the product, we referred to the ASTM-C90 [59] and the current Italian regulations [60].
In relation to the ASTM standard, it can be seen that each of the samples met the specifications for compressive strength (>12.4 MPa). The Italian standards define the minimum values of the characteristic compressive strength of artificial elements for load-bearing masonry (solid or semi-solid elements) for structures in seismic zones as follows:
- Characteristic breaking strength in the direction perpendicular to the load-bearing direction, in the plane of wall development should be not less than 5 MPa.;
- Characteristic breaking strength in the load-bearing direction should be not less than 1.5 Mpa.
Comparisons were then made with the strengths of some commercially available products used for load bearing, natural and artificial masonry, such as stone, tuff, and solid blocks of autoclaved concrete (Table 10).
Table 10.
Characteristic mechanical strengths of stone, Apulian tuff, and concrete blocks for load-bearing masonry in seismic zones in commerce.
It can be seen that the compressive strengths of both the three-component and two-component aggregates, as well as of the blocks, were well above both the minimum values required by the regulations and the characteristic strengths of natural materials, except, of course, for stone, as well as the minimum values declared by the manufacturers of the various artificial materials for load-bearing masonry in seismic zones.
4. Conclusions
This study investigated the possibility of producing cement-based compounds for the production of building elements using SWS and, in particular, artificial stone. Following the characterization of these wastes, the purpose and design guidelines were defined, as well as the flowchart of the production process, which includes after-powder mixing, hydration, and subsequent compaction prior to maturation. After defining the water and cement dosage ranges, the reference particle size melt, and the ideal particle size curve, the aggregates were tested to determine the degree of compaction of the materials.
The first experimental activity involved a mixture containing three types of aggregates whose grain size curve best approximated the ideal theoretical curve based on which the change in compressive strength as the amount of water added to the mixture varied.
Having determined the optimum amount of water in relation to the corresponding compressive strength, we proceeded to design the optimum mix using two types of aggregates and evaluated the change in mechanical strength of the mix as the SWS increased, even when replacing the cement.
The results indicated the following findings:
The potential of waste materials from stone processing is high and, in particular, they can be extensively reused and returned to the production cycle of building materials;
The production of artificial stone and mortar allows the use of significant amounts of waste materials (40% on a dry basis is the average contained in the mixtures);
The designed and tested materials contained very low amounts of both water (13% on a dry basis) and cement (10% on a dry basis on average), which benefits the product economy;
The designed and tested artificial stone mixes had excellent compressive strength (29.9 N/mm2 to 13.12 N/mm2), and the values found far exceeded the minimum values required by the standards for structural blocks;
The mechanical strengths are much higher than materials commonly used for load-bearing masonry (except stone);
The increased SWS in the mixes resulted in reduced brittleness due to the presence of cement, resulting in large deformation margins before failure;
The initial observation under a polarized optical microscope showed that the slurries were very cohesive, with little presence of voids, which were of a limited size. The material did not show the formation of canaliculi that could cause the same priming;
The proposed manufacturing processes are simple, inexpensive, and based on technologies already used in industry.
However, further investigation is needed into the possible methods for drying SWS to remove any residual aqueous fraction, and kneading and forming/compacting techniques to make them industrializable. The results proved to be extremely interesting, as they provide a comprehensive overview of the potential of compounds produced according to the identified processes, and showed excellent properties for use as building elements in construction.
Further studies should be conducted through further research on the following: water absorption, thermal properties, vapor permeability, fire resistance, and durability through accelerated aging tests. It is also important to conduct LCA analysis and define the performance characteristics of reused products through comparative analysis between recycled products and competing raw materials, and evaluate the technical-energetic-environmental efficiency of the transformation processes.
Author Contributions
Conceptualization, A.S., F.F. (Francesco Fabbrocino) and F.F. (Fabio Fatiguso); methodology, A.S.; testing procedure, A.S.; discussion of results, A.S.; validation, A.S. and F.F. (Fabio Fatiguso); writing—original draft preparation, A.S.; writing—review and editing, A.S. and F.F. (Francesco Fabbrocino); supervision, F.F. (Francesco Fabbrocino) and F.F. (Fabio Fatiguso). All authors have read and agreed to the published version of the manuscript.
Funding
This research received no external funding.
Institutional Review Board Statement
Not applicable.
Informed Consent Statement
Not applicable.
Data Availability Statement
The original contributions presented in the study are included in the article, further inquiries can be directed to the corresponding authors.
Conflicts of Interest
The authors declare no conflicts of interest.
References
- Vieira, C.S.; Pereira, P.M.; de Lurdes Lopes, M. Recycled Construction and Demolition Wastes as filling material for geosynthetic reinforced structures. Interface properties. J. Clean. Prod. 2016, 167, 398–413. [Google Scholar] [CrossRef]
- Seco, A.; Omer, J.; Marcelino, S.; Espuelas, S.; Prieto, E. Sustainable unfired bricks manufacturing from construction and demolition wastes. Constr. Build. Mater. 2018, 167, 154–165. [Google Scholar] [CrossRef]
- Bassani, M.; Tefa, L.; Russo, A.; Palmero, P. Alkali-activation of recycled construction and demolition waste aggregate with no added binder. Constr. Build. Mater. 2019, 205, 398–413. [Google Scholar] [CrossRef]
- Contreras-Llanes, M.; Romero, M.; Gázquez, M.J.; Bolívar, J.P. Recycled Aggregates from Construction and Demolition Waste in the Manufacture of Urban Pavements. Materials 2021, 14, 6605. [Google Scholar] [CrossRef] [PubMed]
- Ali, H.A.; Zhang, B.; Xiao, C.; Zhao, B.; Xuan, D.; Poon, C.S. Valorization of fine recycled C&D aggregate and incinerator bottom ash for the preparation of controlled low-strength material (CLSM). Clean. Waste Syst. 2022, 3, 100061. [Google Scholar] [CrossRef]
- Hidalgo, C.; Carvajal, G.; Hincapie, A.; Muñoz, F.; Hernández, M. Ground Improvement by Construction and Demolition Waste (CDW) Soil Mixture Replacement. Buildings 2023, 13, 779. [Google Scholar] [CrossRef]
- Liu, G.; Luo, X.; Zhang, Y.; Li, H. Predicting fatigue damage growth in cement-treated base layer built with construction and demolition waste. Constr. Build. Mater. 2023, 406, 133371. [Google Scholar] [CrossRef]
- Gedik, A. A review on the evaluation of the potential utilization of construction and demolition waste in hot mix asphalt pavements. Resour. Conserv. Recycl. 2020, 161, 104956. [Google Scholar] [CrossRef]
- Buildings and Construction. European Commission. Available online: https://single-market-economy.ec.europa.eu/industry/sustainability/buildings-and-construction_en (accessed on 14 February 2025).
- Zhai, W.; Ding, J.; An, X.; Wang, Z. An optimization model of sand and gravel mining quantity considering healthy ecosystem in Yangtze River, China. J. Clean. Prod. 2020, 242, 118385. [Google Scholar] [CrossRef]
- Miller, S.A.; Moore, F.C. Climate and health damages from global concrete production. Nat. Clim. Chang. 2020, 10, 439–443. [Google Scholar] [CrossRef]
- Scioti, A.; Bernardo, G.; Mecca, I.; Fatiguso, F. Characterization of Stone Waste Sludge and Preliminary Investigation on Green Materials Based on Traditional Lime Putty for Sustainable Construction. Sustainability 2024, 16, 9173. [Google Scholar] [CrossRef]
- Almeida, N.; Branco, F.; Santos, J.R. Recycling of stone slurry in industrial activities: Application to concrete mixtures. Build. Environ. 2007, 42, 810–819. [Google Scholar] [CrossRef]
- Assi, L.N.; Carter, K.; Deaver, E.; Ziehl, P. Review of availability of source materials for geopolymer/sustainable concrete. J. Clean. Prod. 2020, 263, 121477. [Google Scholar] [CrossRef]
- Van Deventer, J.S.J.; Provis, J.L.; Duxson, P. Technical and commercial progress in the adoption of geopolymer cement. Miner. Eng. 2012, 29, 89–104. [Google Scholar] [CrossRef]
- Petruzzelli, D.; Petrella, M.; Boghetich, G.; Calabrese, P.; Petruzzelli, V.; Petrella, A. Neutralization of acidic wastewater by the use of waste limestone from the marble industry. mechanistic aspects and mass transfer phenomena of the acid-base reaction at the liquid-solid interface. Ind. Eng. Chem. Res. 2009, 48, 399–405. [Google Scholar] [CrossRef]
- Al-Zboon, K.K. Recycling of stone cutting waste for heavy metals removal. J. Solid. Waste Technol. Manag. 2018, 44, 356–360. [Google Scholar] [CrossRef]
- Regione Lazio—Direzione Regionale Ambiente. Osservatorio Ambientale Centrale Termoelettrica ENEL di Civitavecchia Torrevaldaliga Nord—Rapporto 2010. Available online: https://www.arpalazio.it/documents/20124/78596/AMB_PBL_Rapporto_Osservatorio_Ambientale_2010.pdf (accessed on 18 March 2024).
- ENEL. Dichiarazione Ambientale Anni 2021–2024 Centrale Termoelettrica ‘Andrea Palladio’ di Fusina (VE) Via dei Cantieri, 5 Fusina (VE). Available online: https://corporate.enel.it/content/dam/enel-corporate/progetti/documenti/impianti-emas---termoelettrici/fusina/Dichiarazione_Ambientale_Aggiornamento_2023.pdf (accessed on 18 March 2024).
- ENEL—Divisione Generazione ed Energy Management Unità di Business della Spezia. Relazione Tecnica dei Processi Produttivi—Centrale Eugenio Montale della Spezia. Available online: https://va.mite.gov.it/File/Documento/252005 (accessed on 18 March 2024).
- Marvila, M.T.; de Azevedo, A.R.G.; Alexandre, J.; Colorado, H.; Pereira Antunes, M.L.; Vieira, C.M.F. Circular economy in cementitious ceramics: Replacement of hydrated lime with a stoichiometric balanced combination of clay and marble waste. Int. J. Appl. Ceram. Technol. 2021, 18, 192–202. [Google Scholar] [CrossRef]
- Ma, B.; Wang, J.; Tan, H.; Li, X.; Cai, L.; Zhou, Y.; Chu, Z. Utilization of waste marble powder in cement-based materials by incorporating nano silica. Constr. Build. Mater. 2019, 211, 139–149. [Google Scholar] [CrossRef]
- Aydin, E.; Arel, H.Ş. High-volume marble substitution in cement-paste: Towards a better sustainability. J. Clean Prod. 2019, 237, 117801. [Google Scholar] [CrossRef]
- Mashaly, A.O.; Shalaby, B.N.; Rashwan, M.A. Performance of mortar and concrete incorporating granite sludge as cement replacement. Constr. Build. Mater. 2018, 169, 800–818. [Google Scholar] [CrossRef]
- Alabsy, M.T.; Gouda, M.M.; Abbas, M.I.; Al-Balawi, S.M.; El-Khatib, A.M. Enhancing the Gamma-Radiation-Shielding Properties of Gypsum–Lime–Waste Marble Mortars by Incorporating Micro- and Nano-PbO Particles. Materials 2023, 16, 1577. [Google Scholar] [CrossRef] [PubMed]
- Paes, A.L.; Alexandre, J.; Xavier, G.D.C.; Monteiro, S.N.; de Azevedo, A.R.G. Feasibility Analysis of Mortar Development with Ornamental Rock Waste for Coating Application by Mechanized Projection. Sustainability 2022, 14, 5101. [Google Scholar] [CrossRef]
- Benjeddou, O.; Alyousef, R.; Mohammadhosseini, H.; Soussi, C.; Khadimallah, M.A.; Alabduljabbar, H.; Tahir, M.M. Utilisation of waste marble powder as low-cost cementing materials in the production of mortar. J. Build. Eng. 2020, 32, 101642. [Google Scholar] [CrossRef]
- Megna, B.; Badagliacco, D.; Sanfilippo, C.; Valenza, A. Physical and mechanical properties of sustainable hydraulic mortar based on marble slurry with waste glass. Recycling 2021, 6, 37. [Google Scholar] [CrossRef]
- Kore, S.D.; Vyas, A.; Vyas, A.K. Behavior of Concrete Using Marble Waste as Coarse Aggregate. Available online: https://www.researchgate.net/publication/292149384 (accessed on 19 March 2025).
- Kore, S.D.; Vyas, A.; Vyas, A.K. Cost Effective Design of Sustainable Concrete Using Marble Waste as Coarse Aggregate. 2016. Available online: https://www.researchgate.net/publication/312128403 (accessed on 19 March 2025).
- Ahmad, J.; Manan, A.; Ali, A.; Ihsan, T.; Zaid, O.; Ullah, R. Effects of Partially and Totally Substitution of Marble Waste as a Fine Aggregate on Workability and Mechanical Performance of Concrete. J. Civ. Environ. Eng. 2020, 10, 1–6. [Google Scholar] [CrossRef]
- Nagaraj, H.B.; Anand, K.V.; Devaraj, N.C. Utilization of granite sludge in the preparation of durable compressed stabilized earth blocks. MOJ Civil. Eng. 2018, 4, 237–243. [Google Scholar] [CrossRef]
- Ahmed, S.; Khitab, A.; Mehmood, K.; Tayyab, S. Green non-load bearing concrete blocks incorporating industrial wastes. SN Appl. Sci. 2020, 2, 266. [Google Scholar] [CrossRef]
- Al-Joulani, N.M.A. Sustainable Utilization of Stone Slurry Waste in the West Bank. In Geo-Frontiers 2011; American Society of Civil Engineers: Reston, VA, USA, 2011; pp. 1345–1354. [Google Scholar] [CrossRef]
- Baccaro, A.; Scioti, A.; Bruno, S.; Mecca, I.; Fatiguso, F. Eco-Friendly Materials and Products from the Waste Derived from the Processing of Apricena Stone: State of the Art and New Employment Prospects. In International Conference of Ar. Tec. (Scientific Society of Architectural Engineering); Springer Nature: Cham, Switzerland, 2025; pp. 50–67. [Google Scholar] [CrossRef]
- Nayak, S.K.; Satapathy, A.; Mantry, S. Use of waste marble and granite dust in structural applications: A review. J. Build. Eng. 2022, 46, 103742. [Google Scholar] [CrossRef]
- Kore, S.D.; Vyas, A.K.; Kabeer, K.S.A. A brief review on sustainable utilisation of marble waste in concrete. Int. J. Sustain. Eng. 2020, 13, 264–279. [Google Scholar] [CrossRef]
- Venkatesh, K.; Jeelani, S.H.; Bano, S.; Ganapathy, C.P.; Impa, K.A.; Ramya, H.N. Investigating compressive strength of building blocks for varying content of marble dust and rice husk. Mater. Today Proc. 2022, 69, 1229–1232. [Google Scholar] [CrossRef]
- Betancourt-Chávez, J.R.; González-Lozano, M.A.; Rentería-Soto, J. Brick made of marble waste, a sustainable proposal. Rev. Int. Contam. Ambiental 2023, 39, 617–626. [Google Scholar] [CrossRef]
- Hojamberdiev, M.; Eminov, A.; Xu, Y. Utilization of muscovite granite waste in the manufacture of ceramic tiles. Ceram. Int. 2011, 37, 871–876. [Google Scholar] [CrossRef]
- Xing, F.; He, X.; Zhu, C.; Zhang, Y.; Wang, Y.; Dong, B.; Fang, G. Design and characterization of carbonate-stone-powder-based foam concrete. Constr. Build Mater. 2024, 418, 135315. [Google Scholar] [CrossRef]
- Galetakis, M.; Raka, S. Utilization of limestone dust for artificial stone production: An experimental approach. Miner. Eng. 2004, 17, 355–357. [Google Scholar] [CrossRef]
- Galetakis, M.; Alevizos, G.; Leventakis, K. Evaluation of fine limestone quarry by-products, for the production of building elements—An experimental approach. Constr. Build. Mater. 2012, 26, 122–130. [Google Scholar] [CrossRef]
- Albina, S.; Mariella, D.F.; Fabio, F. Production of artificial stones between 1800 and 1900: A patent review. In Rehabend 2024 Euro-American Congress Construction Phathology, Rehabilitation Tecnology and Heritage Management; University of Cantabria (UC): Santander, Spain, 2024; pp. 1379–1388. ISBN 978-84-09-58989-0. [Google Scholar]
- UNI EN 197-1:2011; Cement. Part 1: Composition, Specification and Conformity Criteria for Common Cements. Available online: https://store.uni.com/uni-en-197-1-2011 (accessed on 15 February 2025).
- UNI EN 1008:2003; Mixing Water for Concrete. Specification for Sampling, Testing and Assessing the Suitability of Water, Including Water Recovered from Processes in the Concrete Industry, as Mixing Water for Concrete. Available online: https://store.uni.com/uni-en-1008-2003 (accessed on 15 February 2025).
- CEN EN 196-1; CEN Standard Sand According to EN 196-1. Available online: https://www.normensand.de/en/products/cen-standard-sand-en-196-1/ (accessed on 15 February 2025).
- N. 186 Decreto 5 Aprile 2006. Regolamento Recante Modifiche al Decreto Ministeriale 5 Febbraio 1998 «Individuazione dei Rifiuti Non Pericolosi Sottoposti Alle Procedure Semplificate di Recupero, ai Sensi Degli Articoli 31 e 33 del Decreto Legislativo 5 Febbraio 1997, n. 22. Available online: https://www.gazzettaufficiale.it/eli/id/2006/05/19/006G0202/sg (accessed on 23 January 2025).
- Hyperbrick Website. Hyperbrick—Contruction Economique Dans le Monde. Available online: http://www.hyperbrick.com/ (accessed on 15 February 2025).
- Hyperbrick. Hyperbrick Marmoor. Available online: http://www.hyperbrick.com/esmateri.htm (accessed on 15 February 2025).
- Hyperbrick. Hyperbrick Matieres Premieres. Available online: http://www.hyperbrick.com/0132-801.pdf (accessed on 15 February 2025).
- Hyperbrick. Hyperbrick Study of Sub-Soils. Available online: http://www.hyperbrick.com/0167-202.pdf (accessed on 15 February 2025).
- Hyperbrick. Hyperbrick Granulomerie. Available online: http://www.hyperbrick.com/0098-600.pdf (accessed on 15 February 2025).
- UNI EN 12390-2:2019; Testing Hardened Concrete. Making and Curing Specimens for Strength Tests. Available online: https://store.uni.com/uni-en-12390-2-2019 (accessed on 24 April 2025).
- UNI EN 772-1:2015; Metodi di Prova per Elementi Per Muratura—Parte 1: Determinazione Della Resistenza a Compressione. Available online: https://store.uni.com/uni-en-772-1-2015 (accessed on 15 February 2025).
- UNI EN 772-11:2011; Metodi di Prova per Elementi per Muratura—Parte 11: Determinazione Dell’assorbimento D’acqua Degli Elementi per Muratura di Calcestruzzo, di Calcestruzzo Aerato Autoclavato, di Materiale Lapideo Agglomerato e Naturale Dovuto alla Capillarità ed al Tasso Iniziale di Assorbimento D’acqua Degli Elementi per Muratura di Laterizio. Available online: https://store.uni.com/uni-en-772-11-2011 (accessed on 15 February 2025).
- UNI EN 206:2021; Concrete—Specification, Performance, Production and Conformity. Available online: https://store.uni.com/uni-en-206-2021 (accessed on 24 April 2025).
- NTC 2018; Italian Technical Normative for Construction. Available online: https://www.gazzettaufficiale.it/eli/id/2018/2/20/18A00716/sg (accessed on 24 April 2025).
- ASTM-C90; Standard Specification for Dry-Cast Loadbearing Concrete Masonry Units. Available online: https://store.astm.org/standards/c90 (accessed on 24 April 2025).
- OPCM 3431 del 3/5/05; Testo Integrato Dell’allegato 2—Edifici—All’ordinanza 3274 Come Modificato dall’OPCM 3431 del 3/5/05 1 Norme Tecniche Per Il Progetto, la Valutazione E L’adeguamento Sismico Degli Edifici. Available online: http://zonesismiche.mi.ingv.it/documenti/ordinanza_3431-all2-edifici.pdf (accessed on 15 February 2025).


Disclaimer/Publisher’s Note: The statements, opinions and data contained in all publications are solely those of the individual author(s) and contributor(s) and not of MDPI and/or the editor(s). MDPI and/or the editor(s) disclaim responsibility for any injury to people or property resulting from any ideas, methods, instructions or products referred to in the content. |
© 2025 by the authors. Licensee MDPI, Basel, Switzerland. This article is an open access article distributed under the terms and conditions of the Creative Commons Attribution (CC BY) license (https://creativecommons.org/licenses/by/4.0/).