Article

An Integrated New Product Development Evaluation Model in an Interval Type-2 Fuzzy Environment for PLM Strategy Setting

by
Sanja Puzović
1,
Jasmina Vesić Vasović
1,*,
Danijela Tadić
2 and
Dragan D. Milanović
3
1
Faculty of Technical Sciences Čačak, University of Kragujevac, 32000 Čačak, Serbia
2
Faculty of Engineering, University of Kragujevac, 34000 Kragujevac, Serbia
3
Faculty of Mechanical Engineering, University of Belgrade, 11000 Belgrade, Serbia
*
Author to whom correspondence should be addressed.
Appl. Sci. 2025, 15(9), 5025; https://doi.org/10.3390/app15095025
Submission received: 19 March 2025 / Revised: 28 April 2025 / Accepted: 29 April 2025 / Published: 30 April 2025
(This article belongs to the Special Issue Applications of Fuzzy Systems and Fuzzy Decision Making)

Abstract

:
Product Lifecycle Management (PLM) provides a paradigmatic model that enables companies to operate more effectively in the face of shorter product lifecycles, global networking, and increasing complexity. However, despite strengthening the PLM initiative, companies still struggle to implement this concept. The limited results of current PLM implementations often stem from a lack of unique indicators or consistent methodologies that help companies prioritize their implementation efforts. This article proposes an approach to set a PLM strategy, focusing on enhancing company innovation potential by introducing a structured methodology capable of (i) capturing latent needs based on the normative-contingent New Product Development (NPD) evaluation model and (ii) quantifying the influence of various PLM functional aspects on NPD capability. The proposed methodology is based on the Quality Function Deployment (QFD) method, modified to overcome the limitations of the conventional approach, employing the Analytic Hierarchy Process (AHP) for prioritizing request attributes and the Evaluation based on Distance from Average Solution (EDAS) method for quality attribute importance ranking. Motivated by the arbitrary and vague nature of the decision-making environment in the PLM implementation projects, which introduces uncertainties that could be effectively managed by fuzzy logic, the study introduces Interval Type-2 Fuzzy Sets (IT2FSs) to minimize ambiguity and inconsistency in expressing and modeling preferences. The main study contribution pertains to generating quantitative and objective guidelines for adequately grounding a PLM strategy from the perspective of enhancing the company’s innovation potential. The findings of this study ultimately contribute to establishing an optimal model of the PLM concept implementation process, tailored to specific company requirements. Finally, an empirical case study demonstrates the effectiveness and practicality of the proposed approach.

1. Introduction

Over the past few decades, globalization and rapid technological advancements have significantly transformed the business landscape, creating the context in which product information has become a vital strategic resource and a central cohesive factor for organizations. Today’s companies encounter increasingly shorter product lifecycles with reduced net margins, which obligate them to control core processes through suitable methodologies to effectively leverage their knowledge. This can only be accomplished by utilizing integrated solutions that, more than the vertical IT stand-alone tools, provide the collaborative features necessary to support data sharing throughout the entire product lifecycle [1]. This integration might be enabled by embracing Product Lifecycle Management (PLM), a technology-driven business approach that integrates all functions and operations across the product lifecycle through product information, transforming the organization into a synergistic totality that functions flexibly.
PLM is defined as a concept for the integrated management of information that defines both the product as a central element to aggregate enterprise information, and the lifecycle as a new time dimension for information integration and analysis [2]. This understanding, however, oversimplifies the true essence of PLM. Namely, PLM embodies a complex and multi-layered phenomenon that incorporates a strategic approach, advanced IT solutions, and business practices.
Various conceptualizations of PLM that come from definitions and broader theoretical insights found in academic literature and in other professional publications imply that PLM is perceived as a business paradigm; IT-based business model; systemic approach to business performance improvement; IT-supported concept of product information management in an integrated, coordinated and controlled manner; product lifecycle knowledge management system [2,3,4,5,6]. The heterogeneity in these conceptualizations does not indicate contradictions in the way PLM is interpreted; but rather, it underscores the multifaceted essence of this phenomenon.
Initially established to enhance operational efficiency and cost control by managing engineering information tied to product definition more effectively, PLM has evolved technologically and conceptually over time, growing into a sustainable corporate strategy for integrated product lifecycle management. Moreover, PLM has provided a paradigmatic model that has enabled companies, in the face of increasingly shorter product lifecycles, global networking, and increasingly complex products and production systems, to operate more effectively and efficiently.
All this elucidates the increasing interest in PLM among academia and industry alike. Namely, the PLM market is currently one of the fastest expanding in the IT industry; its value, measured through investments in PLM technologies in 2024, as indicated by the CIMdata [7] report, reached US$72.6, accompanied by a growth rate of 9%. This growth trend is expected to persist, attributable to the expansion of the smart connected product manufacturing trend and Industry 4.0 initiatives, which are currently regarded as the primary catalysts of the PLM development.
Notwithstanding the strengthening of PLM initiatives across various industries, driven by the operational and strategic enhancements provided by PLM, companies are still struggling to implement and mature PLM. Moreover, Singh et al. [8] report a dramatically low success rate of launched PLM initiatives, estimating that approximately 70% of PLM implementation projects fail to meet management’s expectations, while the business value of implemented PLM technologies is questionable in most companies.
It should be noted that the problem of implementing PLM extends beyond simply introducing a software layer that integrates isolated information silos, addressing interoperability issues and achieving overall coherence among the information within the PLM environment, but rather requires significant business changes, including optimizing the operating model, revising organizational systems and mechanisms, and, moreover, shifting the management paradigm. These factors render the implementation process an extensive and challenging endeavor, both organizationally and technically, requiring substantial resource mobilization and involving multiple change initiatives across various levels, from strategic to individual employee knowledge and competencies. This has necessitated placing the implementation of PLM within specific contextual frameworks and applying structured, methodologically supported approaches.
Unlike high-risk, one-time PLM implementation projects that rely on radical reengineering and abrupt reorganizations, this article promotes an iterative implementation approach that gradually integrates specific PLM functional aspects into a coherent, software-supported PLM environment. To effectively operationalize this approach, it is critical to set an optimal implementation strategy. Despite the tendency to place PLM implementation within a specific conceptual framework, the implementation strategy should not be considered a generic category; rather, it must be customized to align with the specific needs of the company.
Additionally, it is important to note that, currently, PLM is being mostly established as part of broader initiatives for business transformation, with a primary emphasis on enhancing the innovation potential of enterprises. This stems from the fact that under the rapid technological development and global networking that are in force, innovations are becoming a crucial factor for company sustainable competitiveness and long-term growth, making the establishment of strategic initiatives to strengthen innovation potential a priority for today’s enterprises. This requires companies to establish a PLM competence development model that will effectively support the continuous development of their New Product Development (NPD) capabilities.
Given the relevance of this issue, we formulate the following research question: How can companies effectively establish their PLM strategy with an emphasis on enhancing innovation potential?
Despite extensive scientific and applied research focused on improving the PLM implementation, recent results reveal that these attempts have failed to establish a methodology that would effectively support the PLM implementation process, with regard to the foregoing requirements.
Several issues remain open to academia. This refers, among other things, to the following:
  • Existing implementation methodologies do not provide explicit guidelines for PLM strategy setting. This introduces subjectivity in selecting PLM functional aspects to implement and how to prioritize them, increasing the risk of failure.
  • There is an absence of a specific indicator, consistent methodology, or approach that will assist companies in understanding implementation priorities, making it difficult to align the PLM implementation process with their specific needs.
  • A rigorous scientific methodology that would allow companies to understand how different PLM functional domains influence NPD capabilities is a missing aspect of current scientific contributions.
These open issues drive the rationale of this research.
The research is predicated on the assumption that evaluating an organization’s NPD capabilities could provide a basis for identifying the company’s latent needs, in alignment with the PLM strategy’s orientation toward enhancing innovation potential, and thus introducing a new perspective in setting the PLM implementation strategy compared to previously established methodologies.
Specifically, this paper endeavors to contribute to overcoming the above-mentioned gaps by first providing a methodology capable of capturing the company’s latent needs related to NPD process optimization. Second, it introduces a systematic approach to setting a PLM strategy from the perspective of enhancing innovation potential. Hence, a novel methodological approach has been conceived and proposed to systematically analyze the NPD process, identify priority areas for focusing improvement efforts, and map them with specific PLM functional aspects.
Then, at the second stage, the tool development was carried out. The methodological approach adopted is composed of the integration of Analytic Hierarchy Process (AHP), Quality Function Deployment (QFD), and Evaluation based on Distance from Average Solution (EDAS) models under the Interval Type-2 Fuzzy (IT2F) environment.
The PLM implementation process is impacted by various conditions that can be characterized as uncertain and vague; simultaneously, unpredictable events may occur that are not easily controlled. In this context, accurately predicting the exact values of variables involved in PLM implementation problems is difficult, and their previous values are not reliable for future use. Thus, the conventional quantitative and qualitative models struggle to maintain accuracy and reliability. The introduction of fuzzy set theory has facilitated the description of uncertainties, making it a suitable tool for addressing these issues.
The rest of the paper is structured as follows. Section 2 reviews the research literature and defines the research framework, consisting of the research objectives, scope, and the research design. Then, the new integrated QFD approach, which combines IT2F sets, AHP, and EDAS methods, is developed in Section 3. Section 4 reports the methodology’s application in a real case study to validate its relevance and evaluate its effectiveness. Finally, Section 5 drives to a conclusive discussion on both the academic and practical relevance of this work while also highlighting future research opportunities.

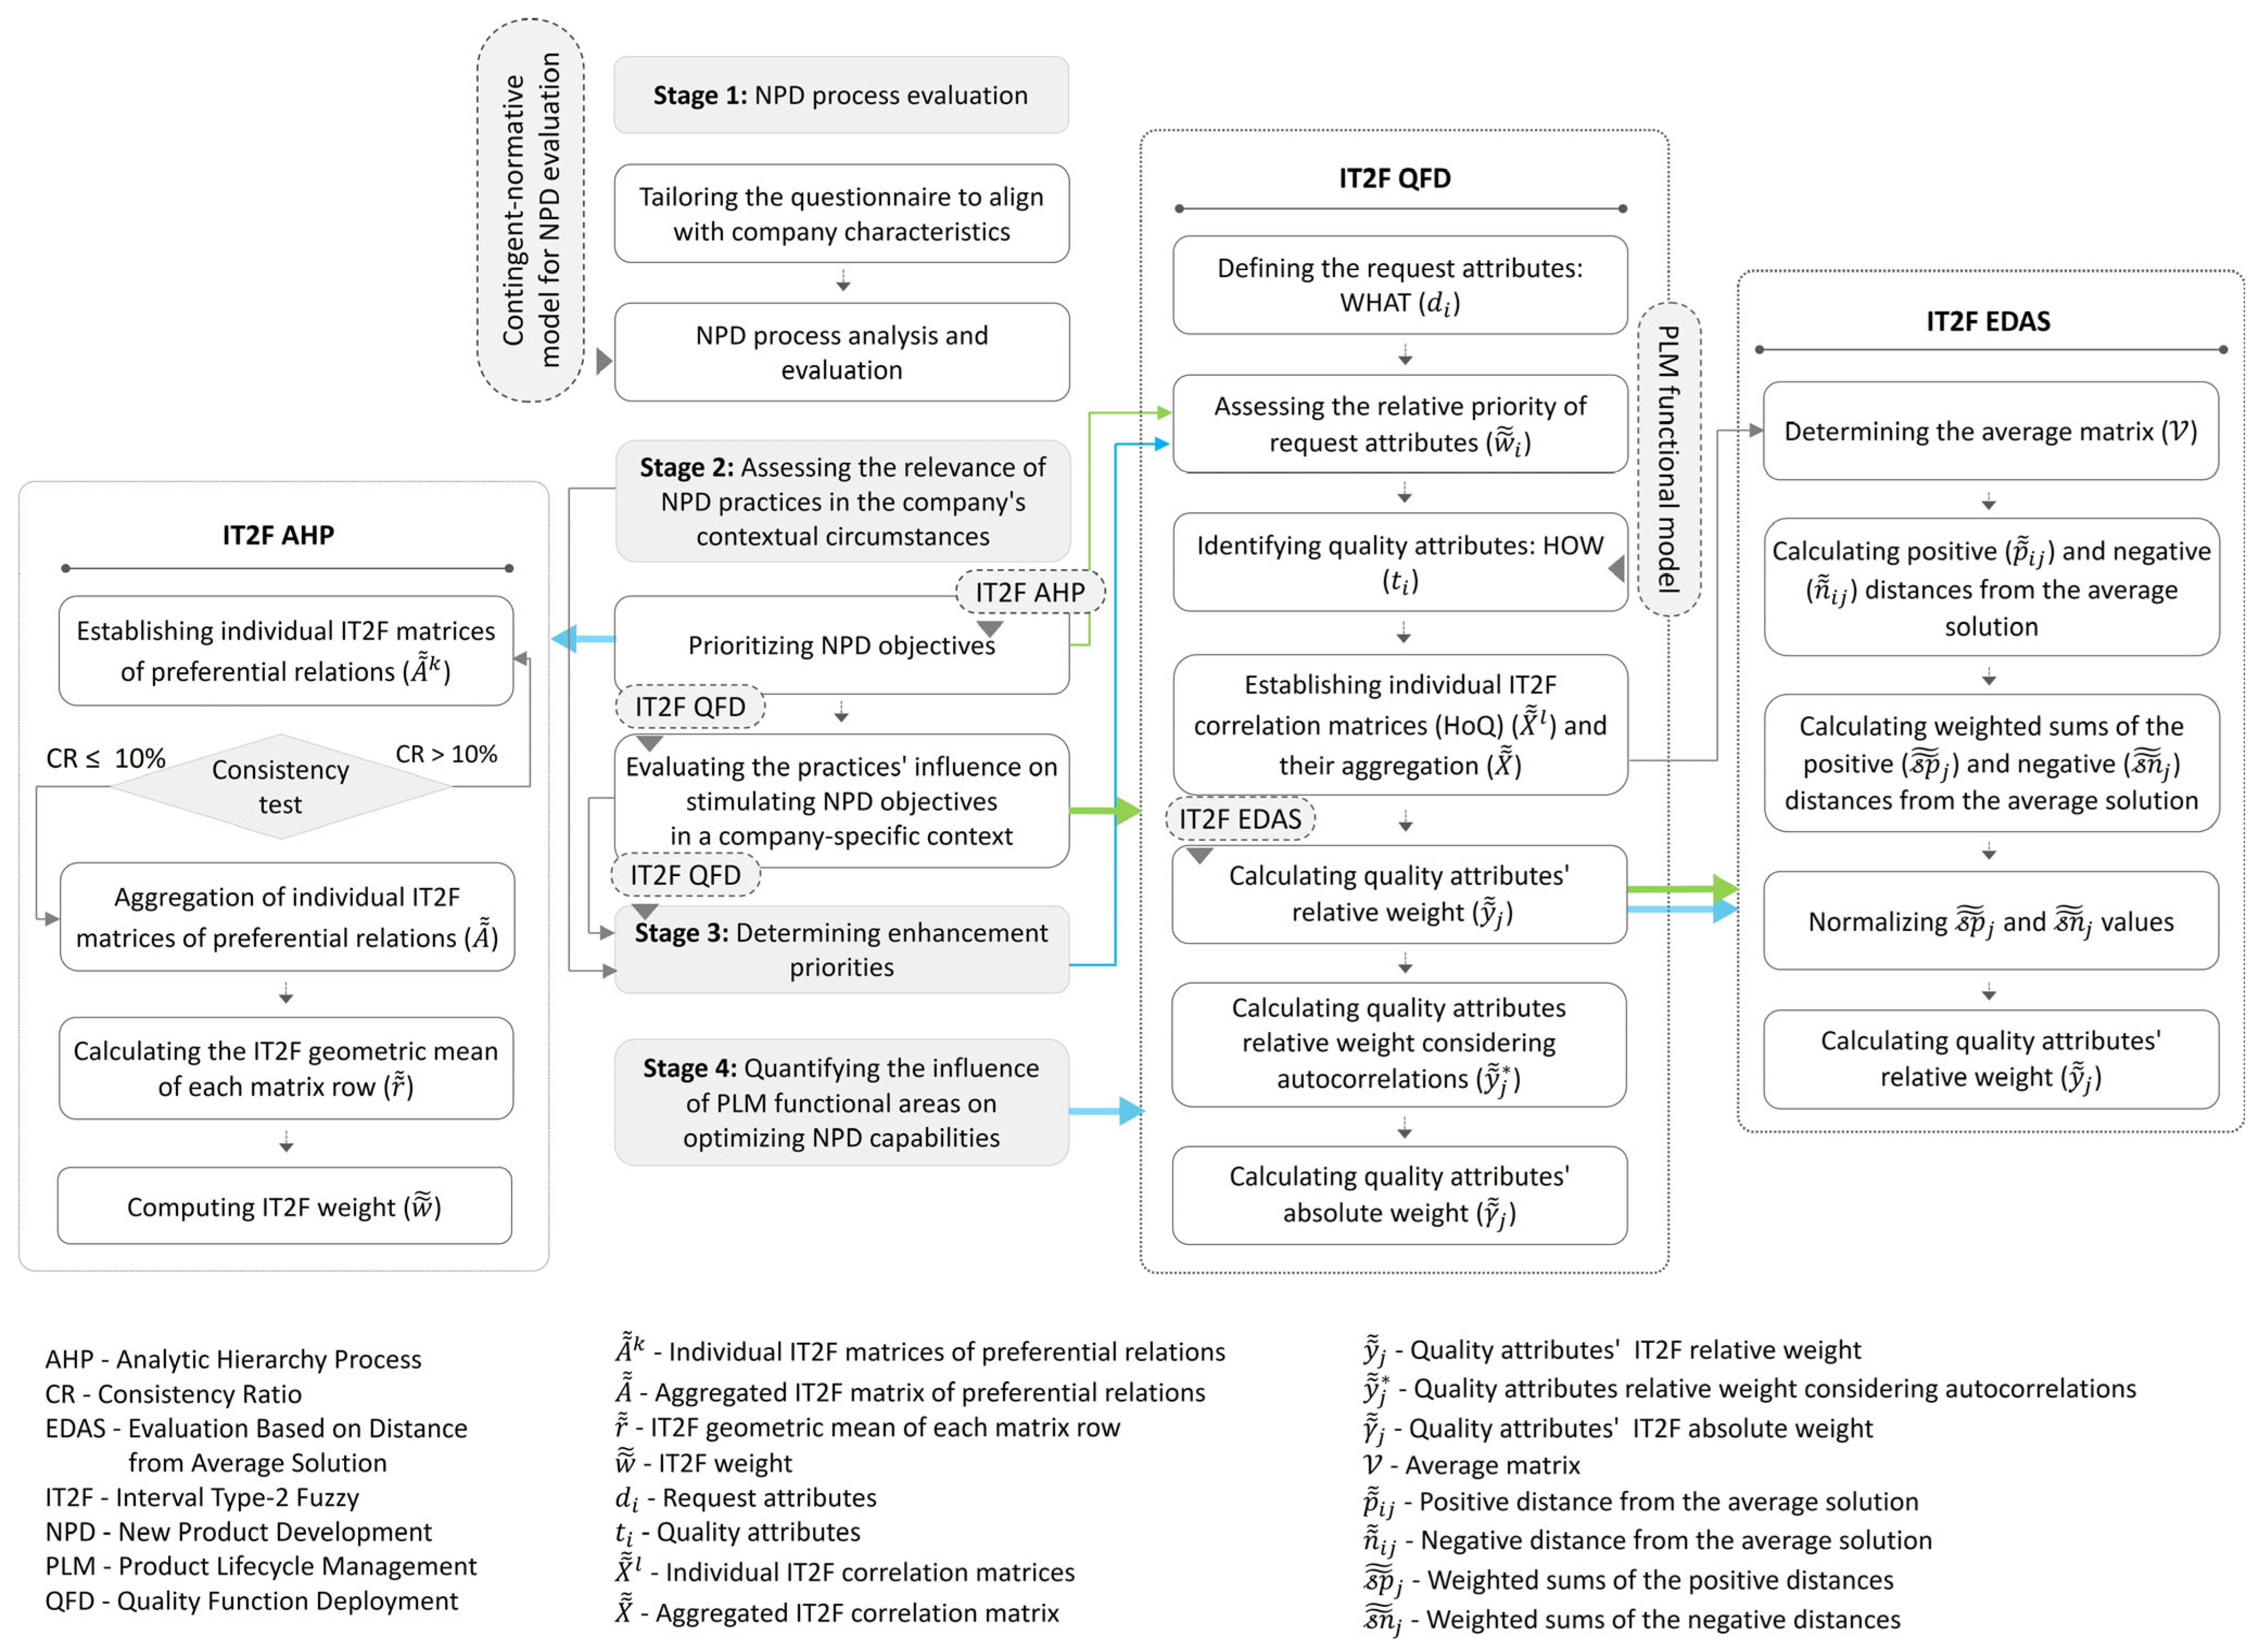
2. Research Framework

This section defines the research framework consisting of the research objectives, scope, and the research design.
The paper introduces a methodology designed to set and adequately ground a PLM strategy for companies aiming to enhance their innovation potential. The research aims to provide a context that helps companies comprehend the priorities of PLM implementation efforts, offering objective guidelines for setting a PLM strategy. Achieving this requires a robust scientific methodology capable of capturing the latent needs related to NPD optimization and mapping them with specific PLM functional aspects. It is important to note that this approach is not intended to generate explicit instructions for future PLM implementation activities, but its use is expected to aid companies in prioritizing implementation efforts from the perspective of enhancing NPD capabilities.
The NPD capabilities in this research are understood as a set of distinct company competencies, which, acting in a mutually synergistic manner, create conditions for product development and commercialization in a way that ensures high levels of production/economic/market product performance and encourages the efficiency and effectiveness of the product development process.
There are several earlier approaches to developing a PLM implementation project roadmap in which a focus has been made on the NPD processes. For instance, Vezzetti et al. [9] introduced a methodology designed to quantify the impact of PLM features on a company’s New Product Introduction (NPI) processes. This approach involves formalizing the NPI process, identifying its strengths and weaknesses, and assessing the needs of stakeholders involved in NPI. The identified requirements are then linked to the PLM features to evaluate the benefits that could result from adopting the PLM strategy. Dunne [10] established a method to evaluate the readiness of the new product development process for integrating product data management. The methodology was intended to identify and evaluate the PDM functionalities and practices that would most effectively support an organization’s specific business needs. Similar to the Capability Maturity Model (CMM), the proposed model measures NPD maturity through five maturity stages: ad hoc, repeatable, characterized, manageable, and optimizing. Sassanelli et al. [11] introduced a methodology designed to set a PLM project roadmap for companies seeking to adopt digitization. The methodology is aimed at assessing the maturity level of manufacturing industries in integrating digital technologies throughout their value-adding processes, with a special focus on the NPD process. This methodology integrates assessment models (DREAMY and CLIMB) and analytical techniques (MyWaste and MyTime). It focuses on readiness and maturity regarding digitization and design practices, alongside waste reduction and ongoing improvement rooted in lean theory.
Starting from the research objectives and the theory observation results, the concept of the methodology is developed. The proposed methodological framework (Figure 1) integrates the following:
  • Reference PLM functional model;
  • A mechanism for mapping a company’s latent needs related to NPD process optimization;
  • A methodology for quantifying the impact of PLM functional aspects on NPD capabilities.
Figure 1. Methodological framework.
Applsci 15 05025 g001
The paper introduces a theoretical model that defines the functional scope of PLM, systematizing specific areas of PLM competency development. The model provides a reference frame for defining the PLM strategy scope, which can be adapted for application in different contexts.
Also, the paper’s contribution is the introduction of a normative-contingent NPD evaluation model grounded in best practice frameworks. Based on prevalent theoretical insights from the literature and supported by contributions from experts, the model maps and categorizes the practices to foster successful product development, using them as benchmark standards. In addition, proceeding from the premise that the influence of different management and engineering practices on the NPD efficiency and effectiveness variables is context-dependent, the concept of evaluation is based on the principles of coherence, which entails examining the relevance of reference practices within the organization’s specific context. This way, companies can become more aware of their NPD weaknesses and the improvements needed in their processes. Once these needs are mapped, they are correlated with PLM features using the QFD method, which aims to prioritize the PLM function. The suggested QFD-based approach enables companies to quantify how PLM functional aspects influence their NPD capabilities. Finally, these insights provide guidance for setting PLM strategy and allow companies to align the PLM functional model to its needs, including dedicated functionalities instead of standard ones.
The paper introduces a modified QFD approach designed to overcome the limitations of the conventional model. First, an AHP-based request attribute-prioritizing phase is built to generate reliable and consistent weights. Then, the phase of prioritizing quality attributes is proposed based on the EDAS method to provide a more precise priority ranking.
The proposed methodology employs mathematical models under the IT2F, enabling effective modeling of the inherent vagueness and ambiguities associated with human cognitive processes, such as the inability to express perceptions or knowledge about a phenomenon in an absolutely precise manner, especially in insufficiently defined or overly complex situations, along with the inconsistencies in human reasoning and uncertainties in judgment.
The following subsections detail the individual approaches that this methodological framework is based on.
Compared to existing implementation models focused on PLM’s strategic alignment with organizational goals, the approach established in this study introduces certain novelties.
For instance, Myung [12] developed a PLM reference model comprising twelve functional blocks. The priority of integrating these blocks into the company’s PLM strategy is based on an evaluation of the current implementation status, which involves reviewing the tools and systems currently in use. However, the proposed approach does not consider all relevant aspects necessary for a proper understanding of business needs and their priorities. Schuh et al. [2] introduced a process-oriented framework that supports the implementation of PLM. The centerpiece of the framework consists of a set of reference business process models oriented to the lifecycle; the processes to be implemented can be selected, taking into account the company’s goals and expected benefits. However, the authors do not offer a systematic method for establishing weighting factors as relative measures to prioritize PLM processes. The model introduced by Arnold et al. [13] identifies PLM functional blocks as specific topics that are sequentially addressed throughout the PLM implementation. The decision regarding which functional blocks to address in the subsequent stages of the evolutionary implementation process relies on their perceived value to the enterprise, emphasizing areas with the highest potential for enhancement. The model practical applicability is limited by the complexity of the approach. Vezzetti et al. [9] introduced a methodology designed to evaluate the impact of PLM features on a company’s NPI processes. This approach involves assessing the requirements of stakeholders involved in NPI; the identified requirements are then linked to the PLM features to evaluate the benefits that could result from adopting the PLM strategy. Fani et al. [14] proposed a framework aimed at identifying a PLM implementation roadmap. The proposed approach is focused on mapping the needs of key users involved in product lifecycle management and on identifying the main PLM functionalities that address those needs. These studies concentrate on PLM implementation models specifically for the textile industry, resulting in a lack of general applicability.
The proposed model’s main contributions, compared to previously established ones, include the following:
  • The proposed approach introduces a new perspective on PLM strategy setting, based on considering the impact on a company’s innovation potential that could result from adopting PLM.
  • It provides a systematic methodology for prioritizing implementation efforts.
  • The proposed framework has been developed to include clear and quantitative guidelines for PLM strategy setting in real scenarios.
  • The model is generic, making it suitable for application across various industrial contexts.

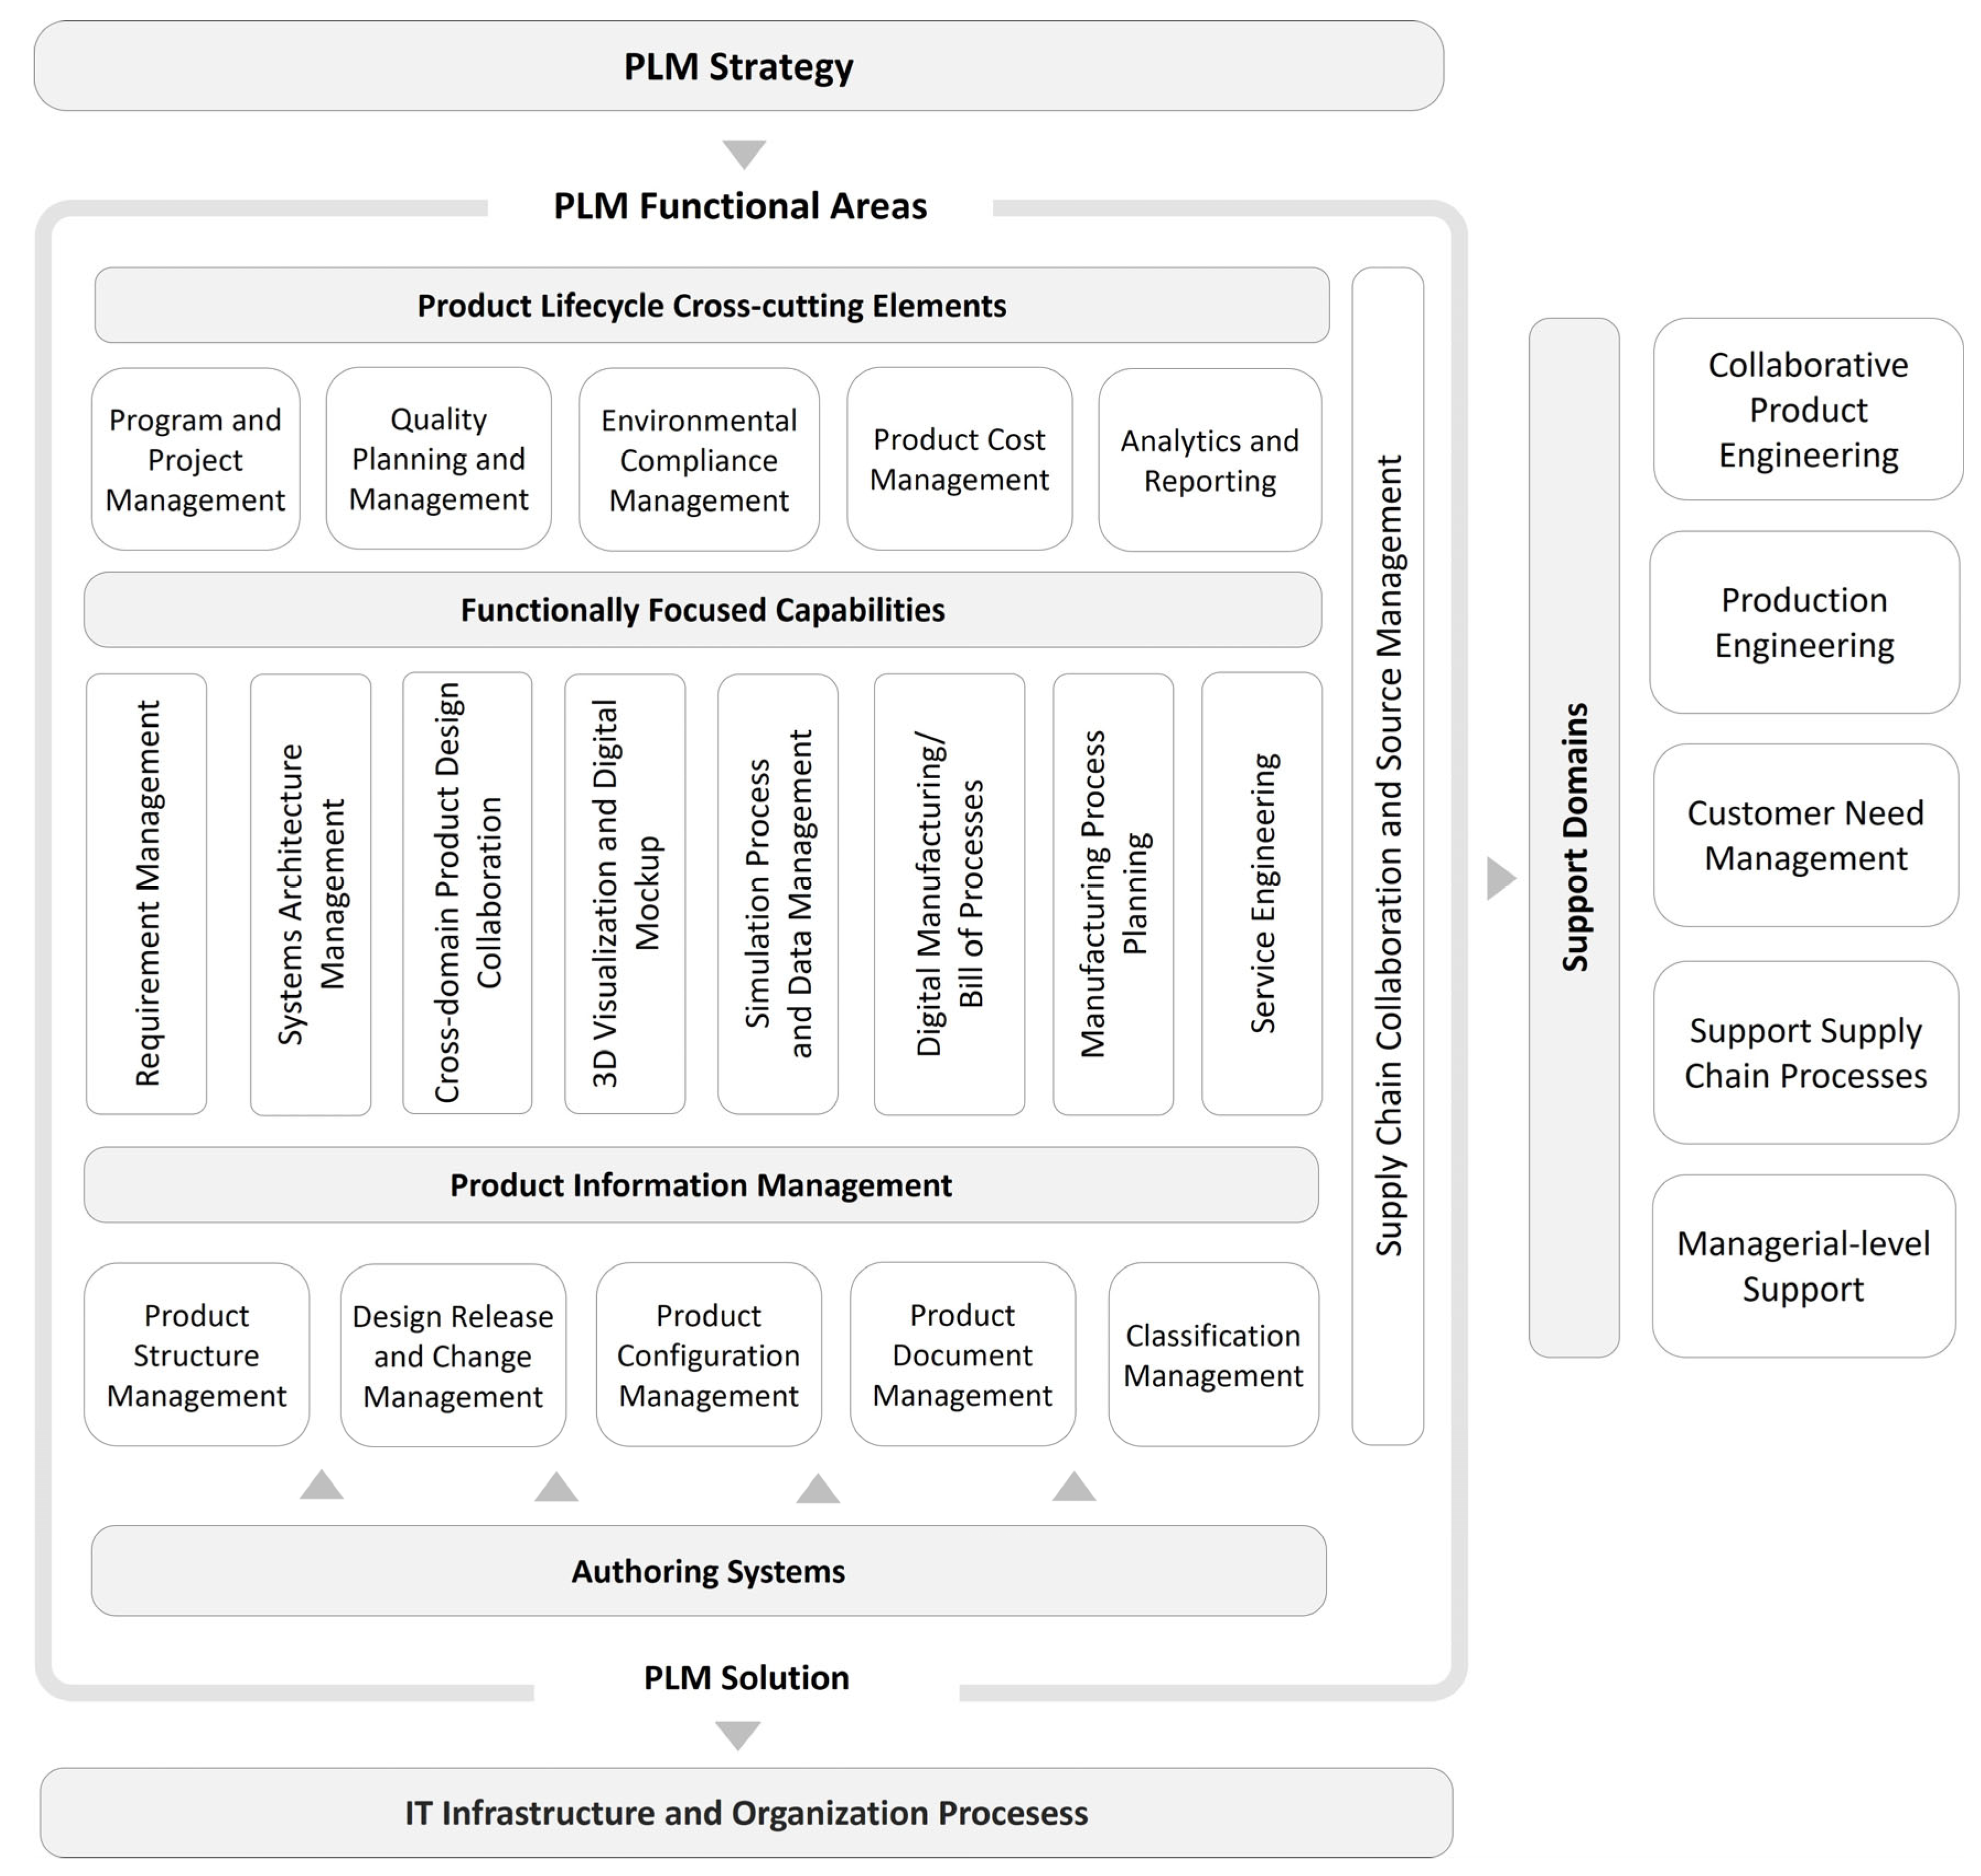
2.1. PLM Functional Model

Relying on established conceptualizations of PLM and the current status of its technological and conceptual evolution, a PLM theoretical framework (Figure 2) is defined that provides a comprehensive overview of PLM functional domains, which are in the context of this research regarded as partial aspects of holistic PLM or as specific areas for developing PLM competencies.
The model emerged as a result of the systematization of business domains that need to be integrated and effectively coordinated through PLM to ensure a cohesive and comprehensive approach to managing the product lifecycle, including the following: (1) product information management, (2) collaborative product engineering, (3) process planning, (4) customer needs management, (5) supply chain processes support, including support at the managerial level.
The model structures the total functional scope of PLM into four main areas.
  • Product information management: access and use product definition information and maintain its integrity throughout the product lifecycle;
  • Functionally focused capabilities: designed to address the specific needs of product information management at different stages of the product lifecycle;
  • Cross-cutting elements that permeate various product lifecycle processes;
  • Functional domain of collaboration in the interorganizational supply chain.
It should be noted that PLM processes are not subject to any particular standard; therefore, PLM configuration must be adapted to the company’s specific needs and business circumstances, taking into account various situational variables. In that context, the model intends to point to the comprehensive functional domain of PLM, thereby projecting its idealistic vision; simultaneously, it provides a reference frame for defining the PLM strategy scope, pointing to the need to adapt the reference model for its application in different contexts, including dedicated functionalities aligned to company needs instead of standard ones.

2.2. Normative-Contingent Model of NPD Process Evaluation

This section provides an overview of existing NPD evaluation models, highlighting their main peculiarities; secondly, literature on NPD critical success factors is analyzed; lastly, the research methodology adopted to develop the NPD evaluation model is presented, detailing the model’s concept and structure.

2.2.1. A Literature Review on NPD Evaluation Methodologies

So far, different methods have been proposed in the literature to aid practitioners in evaluating their NPD processes. These methods are mostly provided in the form of generic self-evaluation models, intended to identify symptoms indicating process inefficiencies and to diagnose the causes.
Panizzolo et al. [15] categorize current NPD evaluation methods based on two main criteria. The first focuses on evaluation logic, encompassing conformism (comparison with established normative requirements), coherence (evaluation of compliance with regulatory norms while considering the specific context), and estimates based on explicit modeling of cause-and-effect relationships. The second criterion considers the abstraction level of the knowledge base (the extent to which the evaluation concept can exclude subjectivism). Following these criteria, Panizzolo et al. [15] deduce that the majority of NPD evaluation models exhibit the features of (1) paradigmatic models: assessment of alignment with requirements that are articulated more as paradigms than as normative standards, which entails a high level of subjectivity; (2) normative models that aim to measure compliance with normative standards and establish specific comparison parameters; however, they overlook the importance of the contextual relevance of assessment norms; (3) normative-contingent models that adjust the reference assessment norms according to differing situational variables.
The Table 1 provides an overview of NPD process evaluation models; the given overview should not be perceived as exhaustive, since it encompasses only those models pertinent to this research context.
One of the notable approaches to the NPD process evaluation is grounding in the concept of maturity, which is characterized by the level of competencies and the sophistication or capability within a particular domain, as per a specified set of criteria [27].
Assessment of the NPD process maturity serves as a good reference point for evaluating the organization’s NPD capability and setting up improvement initiatives.
The literature recognizes several NPD maturity models, most of which are based on the Capability Maturity Model Integration (CMMI) [18]. Though initially established in the field of software engineering, this concept has since evolved and extended its reach beyond its initial domain. Models within the CMMI framework (SECM [19]; IPD-CMM [20], etc.) establish a set of objectives and competencies that must be cultivated across various domains (e.g., project management, process management, engineering processes, and support processes) and also provide structured and rather rigid evaluation procedures.
However, most NPD maturity models focus on isolated evaluation aspects, such as product engineering. Examples encompass models aimed at evaluating compliance with simultaneous engineering practices and principles, including SEAssessment [21]; PACE [22]; BEACON [23]; and SEGAPAN [24].
Rossi et al. [25] proposed the MyWaste model, which introduces a procedure that can be recursively applied to continuously improve the NPD process through the analysis and elimination of waste and criticalities, resulting in improved performance of the entire development process. The approach embodies the lean principle of striving for perfection through continuous improvement efforts, while the MyTime [25] model is intended to identify issues within NPD process based on analyzing the time allocated to design and testing activities, knowledge recovery, creating specifications and documentation, and coordinating the participants involved, among other aspects.
In recent years, there has been a substantial rise in the use of normative models grounded in best practice frameworks for NPD, which serve as benchmarks for attaining optimal practice standards. Kahn et al. [29] describe the concept of best practice as a method or approach that yields the most favorable outcomes when compared to all other acknowledged forms of action. These models offer a framework that helps companies assess the progress of the NPD process by comparing it to the standard levels of sophistication in utilizing specific routines, methods, or techniques declared as best practices.
A notable model in this category was created by Kahn et al. [30]. It pinpoints crucial dimensions that organizations need to excel in for successful NPD management systems, such as proactive market research, process formalization, and strategic orientation. Evaluations are performed based on a specific set of characteristics that detail the spectrum of sophistication, varying from basic to optimal practices. Barczak and Kahn [31] developed an updated version of this model that includes aspects of organizational culture and project management. They also highlight the importance of considering benchmark practices within an industry-specific context.
Included in this group are the Product Innovation Management (PIM) scorecard [26], intended to monitor progress in the continuous improvement of innovation processes, and the New Product Introduction (NPI) self-assessment model [27], which utilizes the Hoshin–Kanri principles and focuses on the company’s core strengths.
While they are thought to greatly endorse NPD process optimization efforts, current scientific discussions often question their real-world effectiveness. The primary focus of these debates is whether NPD best practices can be generalized across various contexts, which constitutes the foundational premise for most models in this category. The discourse also pertains to evaluating the relevance of these practices concerning the contexts in which they are implemented [15,29,31]. Assuming that NPD best practice standards cannot be regarded as universal categories, approaches that contextualize these standards within the company’s specific context are considered to be more appropriate.

2.2.2. Critical Success Factors in New Product Development

The analysis of Critical Success Factors (CSFs) in NPD is based on empirical studies that identify the key determinants influencing the performance of these processes. It should be noted that the review excludes studies examining the influence of so-called soft aspects, such as organizational culture, human factors, or idea-generation practices, since the practices they imply are outside the scope of this research. Moreover, this overview should not be considered exhaustive for all NPD CSFs but rather as a synthesis of insights gathered from a thorough literature review.
Henard and Szimanski [32] categorize the factors behind NPD success into four main groups: product, process, strategy, and market factors, emphasizing among them a unique value proposition and product innovation alongside marketing and technological synergy, as well as cross-functional cooperation. Chen et al. [33] emphasize process formalization, concurrent implementation, internal integration, and learning as pivotal predictors of the velocity of product development. Research conducted by Barczak et al. [31], Kahn et al. [29], and Cooper [34] identifies the effective management of cross-functional interactions and the development of mechanisms for internal integration and synchronization of different sources of knowledge as the most critical success factors in new product development.
The authors also emphasize factors such as the capacity to acquire and integrate external competencies, accentuating the importance of knowledge diffusion mechanisms within inter-organizational frameworks. Additionally, most studies in this field recognize that formal, well-structured processes are crucial for enhancing the efficiency of NPD. However, in contrast to the traditional sequential approach with a system of decision gates to control product evolution throughout the development process, authors today promote less rigid and iterative methods. In this regard, authors emphasize the necessity of reevaluating the principles of the highly linear Stage-Gate model, suggesting that it should be adapted to better fit the characteristics of innovation projects and the associated risks.
Chang and Taylor [35] assert that a product’s definition, grounded in thorough market research and preliminary techno-economic analyses, ensures its commercial viability. Also, involving customers from the early stages of the development process fosters alignment with their preferences and improves the ability to anticipate their future needs. Sjoerdsma and van Weele [36] identify a positive correlation between effective supply chain integration and innovation performance, highlighting the significance of choosing the right suppliers, developing mechanisms for knowledge transfer, and enhancing collaborative competencies to foster more effective supplier integration in product development processes. Knudsen et al. [37] argue that portfolio management, grounded in formally defined policies and procedures, is imperative for attaining an optimal combination of NPD projects in alignment with the company’s available resources and strategic priorities. The need for a rapid response to changing requirements from various internal groups, along with the potential for meeting those needs, necessitates the establishment of a systematic, interdisciplinary change management process that includes identifying and revising requirements to validate changes, as well as coordinating across different domains in a globally distributed value chain, which is a crucial factor for NPD success in today’s industrial contexts.

2.2.3. The Proposed Methodological Approach to NPD Process Evaluation

The proposed NPD evaluation model is grounded in the so-called NPD best practices framework. The model proceeds from the premise that the company’s NPD capabilities are accumulated through the implementation of effective practices during product development. The research conducted by Marzi et al. [38] substantiates the perspective that degree of adherence to best practice standards is a significant predictor of an organization’s innovation potential. Rossi and Terzi [28] argue that the choice of engineering and design practices to be implemented during product development profoundly influences the success or failure of innovation processes. Similarly, Markham and Lee [39] affirm through their research that the selection of management and engineering practices in product development has a substantial influence on efficiency variables (time and cost), as well as on the effectiveness of these processes (quality and innovation). This assertion is substantiated by the research conducted by Knudsen et al. [37], which demonstrates that organizations that exhibit superior performance in new product development are more inclined to adopt and implement practices declared as the best within the respective domain.
Best practice frameworks are predicated upon identifying, classifying, and verifying approaches, methods, and activities that are regarded as exemplary practices for attaining superior performance in new product development processes. These frameworks provide companies with a mechanism to evaluate the development status of their NPD processes by using best practices as reference points. It should be emphasized that these frameworks do not furnish operational guidelines for implementing improvement programs or reference performance metrics.
In the context of this research, the term best practice refers to a set of approaches, methods, or activities that have proven effective in attaining desired performance in new product development and launch [29]. In other words, best practices are routines that possess the potential to generate greater efficiency and effectiveness compared to other known ways of acting.
Following the context and scope of the model application discussed in the previous sections, the model’s structure has been developed along with the operational measures.
The proposed model maps specific perspectives of the organization’s NPD capability, the optimization of which ensures the development and long-term sustainability of a company’s innovation potential. The model’s development is supported by a research approach involving analyzing and synthesizing relevant bibliographic sources, such as theoretical frameworks, case studies, and reviews that identify CSFs for NPD (refer to Section 2.2.1). As a result, 16 perspectives have been identified (refer to Figure 3). These perspectives were adopted as evaluation dimensions that form the first model level.
At the subsequent level, the model maps best practice standards related to the specific perspectives; this level indicates potential areas for enhancement in NPD processes. The characterizations of NPD practices were deduced from theoretical considerations about the influence of various management and engineering approaches, methods, and techniques on enhancing the efficiency and effectiveness of the NPD process. Based on this and on a series of focus groups conducted with experts, the prevalent best practices have been identified.
The focus groups consisted of university professors specializing in engineering management and practitioners from manufacturing companies. In total, eight university professors and twelve practitioners participated. The practitioners’ professional backgrounds were closely related to the analyzed field, with positions ranging from project managers to R&D directors. All experts had at least five years of experience in their respective roles. The expert focus groups were conducted in three phases of model establishment; specifically, the experts’ suggestions and feedback were used during the development, refinement, and validation of the model’s final version. Each focus group included six to twelve experts and was facilitated by a moderator. The contributions of the discussions held during the focus groups have been paramount in that they highlighted some NPD practices recognized as best in practice but not included in any existing classifications in the literature.
This process ultimately resulted in the framework that collects and categorizes 26 total product development best practices. The evaluation model is designed as a self-evaluation questionnaire based on the established best practice framework, with each question examining one of the practices (examples can be found in Figure 3). Each question is scored on a linguistic scale (refer to Table 2) that reflects the company’s effectiveness in applying NPD practices. Since the evaluation process relies on the perceptions held by representatives of personalized knowledge and experience, which are often grounded in approximate reasoning and imprecise or ambiguous data, these perceptions are often unable to be fully articulated or directly and analytically explained. Given this, in the context of the proposed model, the linguistically expressed preferences are regarded as vague and, as such, are mathematically described using IT2TrNs, which facilitates the modeling of vague linguistic variables with approximate accuracy.
It is important to note that the research does not aim to establish a holistic framework that provides a comprehensive characterization of best NPD practices. Additionally, this model does not intend to assess an organization’s maturity in mastering specific NPD management and engineering practices across all relevant domains. Instead, it exclusively identifies those practices whose implementation can be supported by a PLM approach, thereby constraining its applicability to specific research contexts.
The universality of best practices is the basic premise for diagnostic procedures found in most extant models of this type. However, Nicolas et al. [40] contend that there is no uniform approach to attaining NPD excellence. In support of this claim, numerous authors [15,29,31] question the assumption that best practices in NPD can be generalized across different contextual circumstances. Despite the highly suggestive best practices frameworks, the authors are more inclined to assume that practices labeled as best cannot be regarded as universally effective under all circumstances. The influence of a certain practice on stimulating the efficiency and effectiveness of the NPD process is contingent upon various situational variables, including the industrial context, product complexity, and characteristics of the organizational environment. Additionally, Ahmad et al. [41] assert that the selection of practices in product development ought to reflect the project’s specific characteristics, such as whether it entails radical or incremental innovation. Furthermore, Echeveste et al. [42] argue that cultural factors and economic system features affect a practice’s appropriateness. Moreover, the conclusions drawn about how different practices affect NPD process performance mainly stem from case studies of specific companies, making them non-generalizable.
All of this substantiates the thesis that NPD best practices are inherently contextual, and their relevance depends on specific circumstances. Therefore, they must be considered depending on context.
Considering the above, the evaluation process is based on the principles of coherence, which entails examining the relevance of reference practices within the organization’s specific context. The model proceeds from the premise that the relevance of reference NPD practices is contingent upon the company’s NPD strategy, which is reflected in the company’s commitment to the specific NPD objectives. Consequently, the relevance of an NPD practice in the company’s context is evaluated based on the following:
  • The relative priorities of NPD objectives (reduced development cycle; higher-quality products; reduced expenses; and elevated degree of innovation). The prioritization process is based on the Buckley’s AHP method under the IT2F environment;
  • The practices’ influence on stimulating specific NPD objectives in the company’s contextual circumstances (considering the situational variables such as industry context, company scale, product complexity, production strategies, nature and complexity of the market interactions, etc.). The analysis employs the modified QFD approach integrating IT2F logic to deal with vague evaluation information alongside the EDAS method to yield more precise NPD practice relative priority rankings. The proposed QFD analytic process correlates NPD practices with NPD objectives, using their weight coefficients derived from the AHP-based prioritization process.
The model provides practitioners with the possibility to self-assess their processes as support to their improvement initiatives and benchmark against what is declared a best practice standard. The evaluation results reveal potential areas for enhancement—domains exhibiting low compliance with best practice standards, as well as their priorities ascertained on the basis of enhancement potential within a domain and the relevance of NPD practices in a company-specific context.

3. Materials and Methods

3.1. The Utilization of Fuzzy Logic in Multi-Criteria Decision-Making

Over the past few decades, the utilization of fuzzy logic in Multi-Criteria Decision-Making (MCDM) has significantly increased, attributable to its capacity to address issues of uncertainty and inconsistency in expressing and modeling preferences in contexts involving estimated values or uncertain information. Furthermore, fuzzy logic is appropriate for uncertain or approximate reasoning, particularly in systems with a mathematical model that is difficult to derive [43].
The most common approach to fuzzification in MCDM problems is based on type-1 fuzzy sets, allowing membership within an interval defined by two real values. This facilitates adaptation to the ambiguities and uncertainties inherent in expressing preferences. Alternative approaches are also being utilized, which expand the membership function’s scope compared to the conventional form, enabling enhanced flexibility. Examples include Pythagorean fuzzy sets [43,44], intuitionistic hesitant fuzzy sets [45], interval-valued spherical fuzzy sets [46,47], trapezoidal bipolar fuzzy sets [48], and q-rung orthopair fuzzy sets [49,50].

The Concept of Interval Type-2 Fuzzy Logic

Type-2 fuzzy sets are extensions of type-1 fuzzy sets and are represented by an interval-based trapezoidal membership function. This provides a significantly greater degree of flexibility, making them more competent for modeling ambiguities, which, as mentioned by Mendel and John [51], primarily stem from the following:
  • The meaning of linguistic terms can be ambiguous (people perceive the meaning of these expressions in various ways);
  • The measures that activate type-1 fuzzy logic can be ambiguous;
  • The data used to set parameters in type-1 fuzzy logic systems can also be ambiguous.
Kahraman et al. [52] attribute this to their normal, convex, and continuous membership function.
Zadeh [53] introduces IT2F sets as an alternative to conventional fuzzy sets, allowing for improved handling of uncertainties related to an element’s membership owing to their inherently fuzzy membership function [54]. In addition, the simplicity of its mathematical model renders it suitable for practical applications. Considering these advantages, various MCDM methods have been integrated under IT2F sets to bring up much more convenient models of decision-making problems where uncertainty is dominant; as Aleksic and Tadic [55] conclude, the trend in this research is expected to remain stable in the future.
For instance, Puzovic et al. [56] employed the integral AHP/PROMETHEE (Preference Ranking Organization Method for Enrichment Evaluation) model in the IT2F environment for open innovation partner evaluation. In a similar context, Vesic Vasovic et al. [57] employed the AHP method, incorporating IT2F logic to prioritize criteria. Dorfeshan et al. [58] developed the IT2F decision methodology based on MULTIMORA (MULTIplicative form of Multi-Objective Optimization by Ratio Analysis), MOOSRA (Multi-Objective Optimization by Ratio Analysis), and TPOP (Technique of Precise Order Preference) for selecting the project-critical path. Meanwhile, Wu et al. [59] presented an IT2FPROMETHEE-based framework for investment decisions for a compressed air energy storage project. Yilmaz et al. [60] proposed a consensus framework for evaluating dispute resolution alternatives in international law based on an IVT2FTOPSIS (Technique for Order Performance by Similarity to Ideal Solution) approach. Below, some concepts and the arithmetical operations of this type of fuzzy set are defined.
Definition 1.
A fuzzy number ( A ~ ~ ) defined by a type-2 membership function  μ A ~ ~ x , u can be interpreted as follows:
A ~ ~ = x , u , μ A ~ ~ x , u x X ,   u J x 0,1 , 0 μ A ~ ~ x , u 1
This can also be stated as follows:
A ~ ~ = x X u J x μ A ~ ~ x , u ( x , u ) , J x 0,1
Definition 2.
If μ A ~ ~ x , u = 1  holds, then  A ~ ~  can be defined as an Interval Type-2 Fuzzy (IT2F) number, as detailed in (3 and 4).
A ~ ~ = x X u J x 1 ( x , u ) ,   J x 0,1
A ~ ~ i = A ~ i U , A ~ i L = a i 1 U , a i 2 U , a i 3 U , a i 4 U ; H 1 A ~ i U , H 2 A ~ i U a i 1 L , a i 2 L , a i 3 L , a i 4 L ; H 1 A ~ i L , H 2 A ~ i L
where variables  a i 1 U , a i 2 U , a i 3 U , a i 4 U , a i 1 L , a i 2 L , a i 3 L , a i 4 L  represent the reference points of the IT2F trapezoidal number (IT2TrFN)  A ~ ~ i , which is visually interpreted in Figure 4. Here,  H j A ~ i U ,  where    1 j 2  indicates the value of the element  a j j + 1 U  in the upper trapezoidal membership function ( A ~ i U ), and  H j A ~ i L ,  where  1 j 2  denotes the value of the element  a j ( j + 1 ) L  in the lower trapezoidal membership function ( A ~ i L ).
Let us introduce A ~ ~ 1 = A ~ 1 U , A ~ 1 L and A ~ ~ 2 = A ~ 2 U , A ~ 2 L , two IT2TrFNs, then the arithmetic fuzzy computations can be stated as follows:
Definition 3.
The addition operation is defined as in Equation (5).
A ~ ~ 1 A ~ ~ 2 = A ~ 1 U , A ~ 1 L A ~ 2 U , A ~ 2 L = a 11 U + a 21 U ,   a 12 U + a 22 U ,   a 13 U + a 23 U ,   a 14 U + a 24 U ; m i n H 1 A ~ 1 U , H 1 A ~ 2 U , min H 2 A ~ 1 U , H 2 A ~ 2 U a 11 L + a 21 L ,   a 12 L + a 22 L ,   a 13 L + a 23 L ,   a 14 L + a 24 L ; m i n H 1 A ~ 1 L , H 1 A ~ 2 L , min H 2 A ~ 1 L , H 2 A ~ 2 L
Definition 4.
The subtraction operation between is defined as in Equation (6).
A ~ ~ 1 A ~ ~ 2 = A ~ 1 U , A ~ 1 L A ~ 2 U , A ~ 2 L = a 11 U a 21 U ,   a 12 U a 22 U ,   a 13 U a 23 U ,   a 14 U a 24 U ; m i n H 1 A ~ 1 U , H 1 A ~ 2 U , min H 2 A ~ 1 U , H 2 A ~ 2 U , a 11 L a 21 L ,   a 12 L a 22 L ,   a 13 L a 23 L ,   a 14 L a 24 L ; m i n H 1 A ~ 1 L , H 1 A ~ 2 L , min H 2 A ~ 1 L , H 2 A ~ 2 L
Definition 5.
The multiplication operation is defined as in Equation (7).
A ~ ~ 1 A ~ ~ 2 = A ~ 1 U , A ~ 1 L A ~ 2 U , A ~ 2 L = a 11 U · a 21 U ,   a 12 U · a 22 U ,   a 13 U · a 23 U ,   a 14 U · a 24 U ; m i n H 1 A ~ 1 U , H 1 A ~ 2 U , min H 2 A ~ 1 U , H 2 A ~ 2 U , a 11 L · a 21 L ,   a 12 L · a 22 L ,   a 13 L · a 23 L ,   a 14 L · a 24 L ; m i n H 1 A ~ 1 L , H 1 A ~ 2 L , min H 2 A ~ 1 L , H 2 A ~ 2 L
Definition 6.
The arithmetic operation between crisp value  s  and an IT2FN  A ~ ~ 1  is defined as in Equation (8).
s A ~ ~ 1 = s A ~ 1 U , A ~ 1 L = s · a 11 U , s · a 12 U , s · a 13 U , s · a 14 U ; H 1 A ~ 1 U , H 2 A ~ 1 U , s · a 11 L , s · a 12 L , s · a 13 L , s · a 14 L ; H 1 A ~ 1 L , H 2 A ~ 1 L

3.2. IT2FAHP Model

The Analytic Hierarchy Process (AHP) is one of the most widely utilized utility-based MCDM methods. It stands out for its intuitiveness and simplicity; moreover, it is based on a systematic and flexible procedure, which explains its wide applicability across various contexts. Nonetheless, the conventional AHP method exhibits certain weaknesses that limit its applicability in contexts where the facts of the decision-making problem are ambiguous or vague. Namely, the AHP process’s outcome is contingent upon subjective decision-makers’ perceptions [61,62]; this introduces certain uncertainties, as decision-makers frequently base their preferences on data that are imprecise and ambiguous. Additionally, decision-making processes are frequently marked by numerous conflicting criteria, making it challenging to fully comprehend their interrelationships, which leads to inconsistencies in evaluations. Although modeling preferences using linguistic variables is recommended as an approach consistent with human cognition, Deng [63] cautions against overlooking the uncertainties that may occur when translating these linguistically expressed preferences onto a numerical rating scale.
Instead of the conventional application of AHP, this approach suggests employing uncertainty theory, enabling better modeling of the vagueness inherent in linguistically articulated preferences. The AHP method under a fuzzy environment was initially introduced by Van Laarhoven and Pedrycz [64]; so far, several fuzzy adaptations have emerged, such as the fuzzy geometric mean method [65], the fuzzy extent analysis method [66], the fuzzy preference programming method [67], and the fuzzy least-squares method [68]. These models show differences in the shape of the fuzzy set membership function. Furthermore, variations exist in how priorities are derived from fuzzy preference relations and in the defuzzification process of the resulting outcomes.
This study introduces a modified Buckley’s [65] AHP model. The proposed model generates priorities from the preference relations through the geometric mean method and utilizes IT2TrNs to mathematically describe imprecise linguistic preferences.
Step 1: The initial phase in the proposed prioritization process involves establishing the IT2F matrix of preferential relations A ~ ~ = a ~ ~ i j n × n :
A ~ ~ = 1 a ~ ~ 12 a ~ ~ 21 1 a ~ ~ 1 n a ~ ~ 2 n a ~ ~ n 1 a ~ ~ n 2 1 = 1 a ~ ~ 12 1 a ~ ~ 12 1 a ~ ~ 1 n a ~ ~ 2 n 1 a ~ ~ 1 n 1 a ~ ~ 2 n 1
The matrix elements ( a ~ ~ i j ) indicate the preference of attribute i over attribute j . These preferences stem from the experts’ subjective perceptions, articulated through linguistic categorizations, and then modeled mathematically using IT2TrNs in accordance with the scale outlined in the Table 3.
The matrix of preferential relations A ~ ~ is reciprocal, hence the following:
a ~ ~ i j = 1 a ~ ~ j i
As a ~ ~ i j is given in the form of an IT2TrFN:
a ~ ~ = a 11 U , a 12 U , a 13 U , a 14 U ; H 1 a U , H 2 a U a 11 L , a 12 L , a 13 L , a 14 L ; H 1 a L , H 2 a L
its reciprocal can be expressed as follows:
1 a ~ ~ = 1 a 14 U ; 1 a 13 U ; 1 a 12 U ; 1 a 11 U ; H 1 a U , H 2 a U 1 a 14 L ; 1 a 13 L ; 1 a 12 L ; 1 a 11 L ; H 1 a L , H 2 a L
Step 2: Whenever the prioritizing relies on the preferences of multiple experts ( K ), K individual fuzzy preference relations matrices are established; these matrices can be aggregated using the geometric mean method as outlined in Equations (13) and (14), where a ~ ~ i j k denotes the i j preference expressed by the k t h expert ( k = 1,2 , , K ).
a ~ ~ i j = k = 1 K a ~ ~ i j k 1 K = a ~ ~ i j 1 a ~ ~ i j 2 a ~ ~ i j K 1 K
a ~ ~ i j K = a i j 1 U K , a i j 2 U , K a i j 3 U K , a i j 4   U K ; H 1 U a i j ; H 2 U a i j a i j 1 L K , a i j 2 L , K a i j 3 L K , a i j 4   L K ; H 1 L a i j ; H 2 L a i j
Step 3: Generating weight coefficients from the IT2F matrix of preferential relationships involves calculating the IT2F geometric mean ( r ~ ~ i ) for each prioritization attribute ( i = 1,2 , , n ) (15).
r ~ ~ i = i = 1 n a ~ ~ i j 1 n = a ~ ~ i 1 a ~ ~ i 2 a ~ ~ i n 1 n
Step 4: The attributes’ IT2F weights ( w ~ ~ i ) can be obtained from the values of r ~ ~ i using the following equation:
w ~ ~ i = r ~ ~ i r ~ ~ 1 r ~ ~ i r ~ ~ n 1
Defuzzification of IT2F weights ( w ~ ~ i ) can be executed following the procedure outlined in (17). Here, the values w o 1,2 , 3,4 denote the arithmetic mean of the upper and lower bounds of the IT2F weight ( w ~ ~ i ).
w i = x u x d x u x d x = w o 1 · w o 2 + w o 3 · w o 4 + 1 3 w o 4 w o 3 2 1 3 w o 2 w o 1 2 w o 1 w o 2 + w o 3 + w o 4

3.3. The QFD Technique, Conventional Model Limitations, Optimization Strategies, and Emerging Areas of Application

The Quality Function Deployment (QFD) technique was originally created by Akao [69] as a systematic tool for planning and product development, enabling the explicit definition of customer requirements, the so-called voice of customers, and their conversion into measurable product and process characteristics [70,71,72]. Additionally, it systematically evaluates the proposed product or process capabilities concerning their effectiveness in meeting identified customer needs [73].
QFD introduced innovation to conventional product planning approaches in two ways. Firstly, it has allowed the customer’s perspective to be adequately considered. Secondly, the QFD procedure necessitates the involvement of interdisciplinary expertise, enabling product planning and design and process planning to provide a coherent response to customer requirements [52,69].
QFD provides a systematic approach to meeting current and anticipated customer demands and expectations while also facilitating operational decisions across various stages of product development. As a result, QFD allows for proactive addressing of quality issues, promotes more cost-effective production, and fosters simultaneous engineering, ultimately leading to improved overall product and process performance. Jaiswal [74] highlights the key benefits of QFD, which include focusing on customer needs from early product development stages, the identification of crucial elements for product and process development, and maintaining consistency in product engineering and process planning.
The House of Quality (HoQ) [75] is an essential tool for implementing the QFD process. It documents all analytical procedures involved in QFD execution and serves as a conceptual map, enabling inter-functional planning and communication [76]. This includes identifying customer requirements (WHAT); transforming them into quality attributes (HOW) as intended responses to the values expected by users; discovering and modeling correlations between quality and requirement attributes; and prioritizing quality attributes based on their effectiveness in meeting the specified requirements while considering detected autocorrelations.
Today, QFD extends beyond conventional applications owing to its adaptability to a wide range of contexts. The principles of QFD analysis, originally used to translate user requirements into engineering product characteristics, are now being effectively utilized to tackle numerous engineering issues. Table 4 presents insights from an extensive literature review, illustrating the potential uses of the QFD method across various fields.
Despite offering many advantages, the conventional QFD model faces criticisms due to limitations that hinder its effectiveness and potential applications. Jaiswal [74] highlights crucial optimization areas, addressing the main weaknesses of the conventional QFD concept, which consist of the following:
  • Advancements in the initial phases of the QFD process, focusing on creating new models to assess input data in the HoQ matrix;
  • Improving QFD analysis efficiency by combining it with various quality engineering methods, such as competitive analysis and relation matrix creation;
  • Eliminating common weaknesses inherent in the QFD process, including ambiguities and vagueness in requirement expressions, requirement conflicts, and similar issues.
The conventional QFD analytical process faces several inherent limitations, primarily concerning expressing the experts’ uncertain assessments, weighting request attributes, and prioritizing quality attributes, namely the following:
  • The importance rank of the attributes is determined by using a simple weighted averaging technique that can lead to biased ranking results;
  • The relative importance of the request attributes heavily relies on the preference information provided by the customers; however, obtaining these weights may be difficult due to time pressure and the customers’ limited knowledge and experience;
  • The QFD analytical process models input variables through linguistic characterizations. Following the conventional concept, these variables are treated as precise and mapped onto a numerical scale with crisp values. However, the correlation assessments rely on subjective perceptions of representatives of personalized knowledge for a specific domain, which are based on their intuition, personal experiences, and insights, leading to uncertainties regarding subjective preferences, making it difficult to precisely articulate or analytically describe them. Moreover, there is hesitation in the assessment arising from a limited comprehension of the problem being considered, including other uncertainties related to human cognition, such as inconsistencies, and more. Given the considerations noted, the variables in the QFD analytical process ought to be treated as ambiguous.
Despite the prevailing contemporary scientific discourse that highlights the shortcomings of its conventional model, QFD remains the preeminent methodology in its initial fields of application. Furthermore, the framework has experienced several methodological and conceptual modifications, reflecting the maturation of the approaches employed in its implementation.
Specifically, QFD has evolved into a flexible methodological framework that can be adapted, expanded, or integrated with other methodologies and approaches to address the constraints of its conventional concept, improve the efficiency of the QFD analytic process, and, crucially, extend beyond conventional application domains. The literature outlines several methodological improvements to the conventional QFD approach, an exhaustive review of which is presented in the Table 5.
Motivated by previous discussions, this paper introduces several QFD methodological enhancements. Specifically, it aims to construct a hybrid QFD model integrated with the IT2F set, AHP, and EDAS methods to overcome the shortcomings of the conventional QFD model. More specifically:
  • The paper integrates uncertainty theory into the conventional QFD analytic process, allowing for handling ambiguous linguistic variables with approximate accuracy. In this context, the IT2TrNs are employed to model the input data of the QFD analytic process.
  • The paper proposes an AHP-based request attribute prioritizing phase, aiming to facilitate a more systematic and objective evaluation of their relative significance.
  • The prioritization of quality attributes is approached as an MCDM issue, instead of relying on simplistic weighted average techniques. In this context, the proposed QFD process incorporates the IT2FEDAS method yielding a more precise priority ranking.

3.4. EDAS Method

The Evaluation based on Distance from Average Solution (EDAS) method was proposed by Keshavarz Ghorabaee et al. [107]. The method defines the desirability of the alternative by examining the distance from the average solution, considering both positive and negative deviations, contrasting with earlier methods based on compromise ranking, such as VIKOR (Visekriterijumsko Kompromisno Rangiranje) and TOPSIS, which measure deviations from an ideal solution. The EDAS method integrates average solutions by addressing the intangibility of decision-makers and the uncertainty inherent in the decision-making context. Additionally, it might prove useful for evaluating conflicting attributes [108].
The EDAS method shows considerable applicability across various domains, including engineering, social, ecological, and economic issues, spanning a wide range of application areas. It is mainly employed as part of integral MCDM frameworks. For instance, Ecer [109] employs a fuzzy AHP-EDAS integrated model to select third-party logistics (3PL) providers, while U-Dominic et al. [110] introduced the combination of IF, DEcision MAking Trial and Evaluation Laboratory (DEMATEL), and EDAS methods for analyzing barriers in reverse logistics. Asante et al. [111] developed the Multi-Objective Optimization by Ratio Analysis plus the full MULTIplicative form (MULTIMOORA)–EDAS integrated model aimed at examining the obstacles in adopting renewable energy sources. Schitea et al. [112] presented the Weighted Aggregates Sum Product Assessment (WASPAS)–COmplex PRoportional Assessment (COPRAS)–EDAS model for selecting locations for hydrogen mobility collection. Akram et al. [113] integrated the CRiteria Importance Through Intercriteria Correlation (CRITIC) and LPF EDAS methods to address the issue of industrial solid waste management. Zhan et al. [114] proposed a PROMETHEE-EDAS model incorporating Covering-based Variable Precision Fuzzy Rough Set (CVPFRS).
The literature shows a growing trend of studies focused on improving the conventional EDAS model to address some of its inherent limitations. In this context Torkayesh et al. [115] proposed several approaches, including integrating system dynamics and simulation modeling for more reliable solutions, especially in complex decision-making structures; incorporating the concept of stratification to consider uncertainties in decision-making; and applying various normalization techniques within the EDAS process, among others.
These studies specifically address the issue of vagueness and ambiguity inherent in decision-making problems. In this context, multiple models that effectively incorporate various forms of fuzzy logic into the EDAS process have been established, including q-rung orthopair fuzzy [49], spherical fuzzy sets [46], Pythagorean probabilistic hesitant fuzzy [116], trapezoidal bipolar fuzzy [117], interval-valued intuitionistic fuzzy [118], and interval-valued Pythagorean fuzzy [119].
This paper proposes integrating IT2F theory into the conventional EDAS model to effectively address vagueness and ambiguities in preferences. This model has been utilized in only a handful of published studies. Initially introduced by Ghorabae et al. [120], it was subsequently implemented as a part of the supplier selection methodology framework, which considers both environmental and economic factors [121]. Demircan and Tunc [122] employed the IT2FEDAS model as an integral part of the service-level improvement methodology for public transportation, while Tengyu and Xiuli [123] adopted the same model for the selection of a cloud service scheme for new electric vehicles.

3.5. Modified QFD Process

This section introduces a modified QFD approach (Figure 5), designed to enhance the QFD analytic process’s efficiency by overcoming the limitations inherent in its conventional model. The proposed QFD approach incorporates IT2F logic for the mathematical modeling of vague linguistic variables, while the EDAS method is adopted to determine the importance prioritization of quality attributes.
The proposed QFD process includes the following steps:
  • Step 1: Defining the request attributes: WHAT ( d i )
  • Step 2: Assessing the relative priority of the request attributes ( w ~ ~ i )
  • Step 3: Identifying potential responses to requests—quality attributes: HOW ( t j )
  • Step 4: Establishing individual IT2F relation matrices: HoQ ( X ~ ~ l = ( x ~ ~ i j l ) m × n ); deriving the aggregated IT2F HoQ matrix ( X ~ ~ = ( x ~ ~ i j ) m × n )
  • Step 5: Calculating quality attributes’ importance weight ( y ~ ~ j ):
    • Step 5.1: Establishing average matrix ( V = v ~ ~ i m × 1 )
    • Step 5.2: Calculating positive ( p ~ ~ i j ) and negative ( n ~ ~ i j ) distances from the average solution ( v ~ ~ i )
    • Step 5.3: Calculating weighted sums of the positive ( s p ~ ~ j ) and negative ( s n ~ ~ j ) distances from the average solution ( v ~ ~ i )
    • Step 5.4: Normalizing values s p ~ ~ j and s n ~ ~ j
    • Step 5.5: Calculating quality attributes’ relative weight ( y ~ ~ j )
    • Step 6: Calculating quality attributes’ relative weight considering autocorrelations ( y ~ ~ j )
    • Step 7: Computing quality attributes’ absolute weight t j − ( γ ~ ~ j )
The detailed procedure of the proposed QFD approach is depicted below.
Step 1: Defining the request attributes (WHAT). Let us assume that the QFD analytical process includes m request attributes denoted as d i ( i = 1,2 , , m )
Step 2: Assessing the relative priority of the request attributes w ~ ~ i w ~ ~ 1 , w ~ ~ 2 , , w ~ ~ m . These priorities represent the IT2F relative weights obtained by the previously introduced IT2FAHP process.
Step 3: Identifying the quality attributes (HOW). Let us assume that the QFD analytical process includes n quality attributes denoted as t j ( j = 1,2 , , n ) .
Step 4: Assume that L experts e l ( l = 1,2 , , L ) are participating to evaluate the relationship between the n quality attributes and the m request attributes. Let x ~ ~ i j l be the ratings provided by the l t h expert for the j t h attribute t with respect to the i t h requirement d . The correlation ratings for all discovered d i t j relations offered by l t h expert create an individual relation matrix X ~ ~ l = ( x ~ ~ i j l ) m × n . Here,  x ~ ~ i j l is an IT2TrFN derived according to the linguistic characterization used to describe correlation ratings as presented in Table 2.
An aggregated IT2F relation matrix X ~ ~ = ( x ~ ~ i j ) m × n (19) is created by consolidating correlation ratings gathered from the experts ( ( x ~ ~ i j l ) m × n ) according to Equation (18).
x ~ ~ i j = l = 1 L x ~ ~ i j l L
X ~ ~ = ( x ~ ~ i j ) m × n =     t 1 t 2 t n d 1 d 2 d m x ~ ~ 11 x ~ ~ 12 x ~ ~ 21 x ~ ~ 22 x ~ ~ 1 n x ~ ~ 2 n x ~ ~ m 1 x ~ ~ m 2 x ~ ~ m n
Step 5: The relative weights of the attribute t j , derived from the d i t j relations ( x ~ ~ i j ), are determined using the EDAS method as detailed in the procedure below.
Step 5.1: The initial step involves constructing the average matrix V = v ~ ~ i m × 1 derived from the relation matrix ( X ~ ~ ); the elements of this matrix ( v ~ ~ i ) represent the average solutions with respect to each request attribute, as defined in (20).
v ~ ~ i = 1 n j = 1 n x ~ ~ i j
Step 5.2: The matrices of positive distance from average solution (PDA) and negative distance from average solution (NDA) are established according to the (21) and (22).
P D A = p ~ ~ i j m × n
N D A = n ~ ~ i j m × n
The p ~ ~ i j denotes the positive distance, while n ~ ~ i j indicates the negative distance of the j t h quality attribute from the average solution in terms of the i t h request attribute. In typical multi-criteria decision-making problems, these values are determined depending on the nature of the criteria, as detailed in (23) and (24); here, B represents the set of BENEFIT criteria, and N represents the set of COST criteria.
p ~ ~ i j = z x ~ ~ i j v ~ ~ i S v ~ ~ i i f i B z v ~ ~ i x ~ ~ i j S v ~ ~ i i f i N
n ~ ~ i j = z v ~ ~ i x ~ ~ i j S v ~ ~ i i f i B z x ~ ~ i j v ~ ~ i S v ~ ~ i i f i N
where S A ~ ~ denotes the defuzzified value of the IT2TrFN A ~ ~ = A ~ U , A ~ L , as defined in (4). The defuzzification process follows Equation (25).
S A ~ ~ = 1 2 a 1 U + 1 + H 1 ( A ~ U ) · a 2 U + 1 + H 2 ( A ~ U ) · a 3 U + a 4 U 4 + H 1 ( A ~ U ) + H 2 ( A ~ U ) a 1 L + 1 + H 1 ( A ~ L ) · a 2 L + 1 + H 2 ( A ~ L ) a 3 L + a 4 L 4 + H 1 ( A ~ L ) + H 2 ( A ~ L )
A function z A ~ ~ (26) is introduced to facilitate the comparison of the IT2TrFN A ~ ~ = A ~ U , A ~ L to a zero value ( 0 ~ ~ = ( 0,0 , 0,0 ; 1,1 ) ( 0,0 , 0,0 ; 1,1 ) ) and to determine the maximum value.
z A ~ ~ = A ~ ~ i f S ( A ~ ~ ) > 0 0 ~ ~ i f S ( A ~ ~ ) 0
Step 5.3: The weighted sums of positive ( s p ~ ~ j ) and negative ( s n ~ ~ j ) distances for all attributes are defined as follows:
s p ~ ~ j = i = 1 m w ~ ~ i p ~ ~ i j , j = 1,2 , , n
s n ~ ~ j = i = 1 m w ~ ~ i n ~ ~ i j , j = 1,2 , , n
Step 5.4: The subsequent step entails normalizing the values s p ~ ~ j and s n ~ ~ j , performed based on the following equations:
n p ~ ~ j = s p ~ ~ j max j S s p ~ ~ j , j = 1,2 , , n
n n ~ ~ j = 1 s n ~ ~ j max j S s n ~ ~ j , j = 1,2 , , n
Step 5.5: Based on these values, the relative importance of the quality attributes t j ( y ~ ~ j ) is established, in accordance with Equation (31).
y ~ ~ j = 1 2 n p ~ ~ j n n ~ ~ j , j = 1,2 , , n
Step 6: Additionally, the relative weights of the attributes t j can be defined by taking their autocorrelations into account, utilizing the generic positions from the correlation matrix ( μ ~ ~ k j , j , k = 1,2 , , n ; j k ). According to Tang et al. [124], μ ~ ~ k j represents the incremental change in the achievement level of the j t h attribute t when the k t h attribute t unitarily increases. In this context, we can define the relative weight of an attribute t j as follows:
y ~ ~ j = y ~ ~ j k = 1 n μ ~ ~ k j y ~ ~ k
Step 7: The absolute attribute weights ( γ ~ ~ j ) are determined through the normalization process in accordance with Equation (33).
γ ~ ~ j = y ~ ~ j j = 1 n y ~ ~ j

4. Case Study

This section presents the methodology’s application in a company that produces household appliances. The company specializes in producing water heaters, and its portfolio encompasses hydrophobic vessels, expansion vessels for floor heating systems, sanitary water, etc.
Using a real case as an example, the proposed methodology is explained, its results are shown, and its effectiveness is tested, as is presented in the following sections.
An interdisciplinary team of analysts was involved to go through the proposed model. The team consolidates contributions of company employees, analysts with expertise in the domain of PLM implementation, and representatives from the academic community, enabling the inclusion of all relevant expertise.

4.1. Stage 1: NPD Process Evaluation

4.1.1. Tailoring the Questionnaire to Align with Company Characteristics

After a thorough discussion of the questionnaire structure with company representatives, the questionnaire underwent a revision. The amended version of the questionnaire excludes practices related to establishing product development frameworks that enable mass customization, the establishment of product customization support mechanisms, and the necessary engagement of consumers during the product realization phase. It was concluded that the industrial context, company product concept, production strategies, and prevailing consumer preferences preclude the need for implementing such practices.

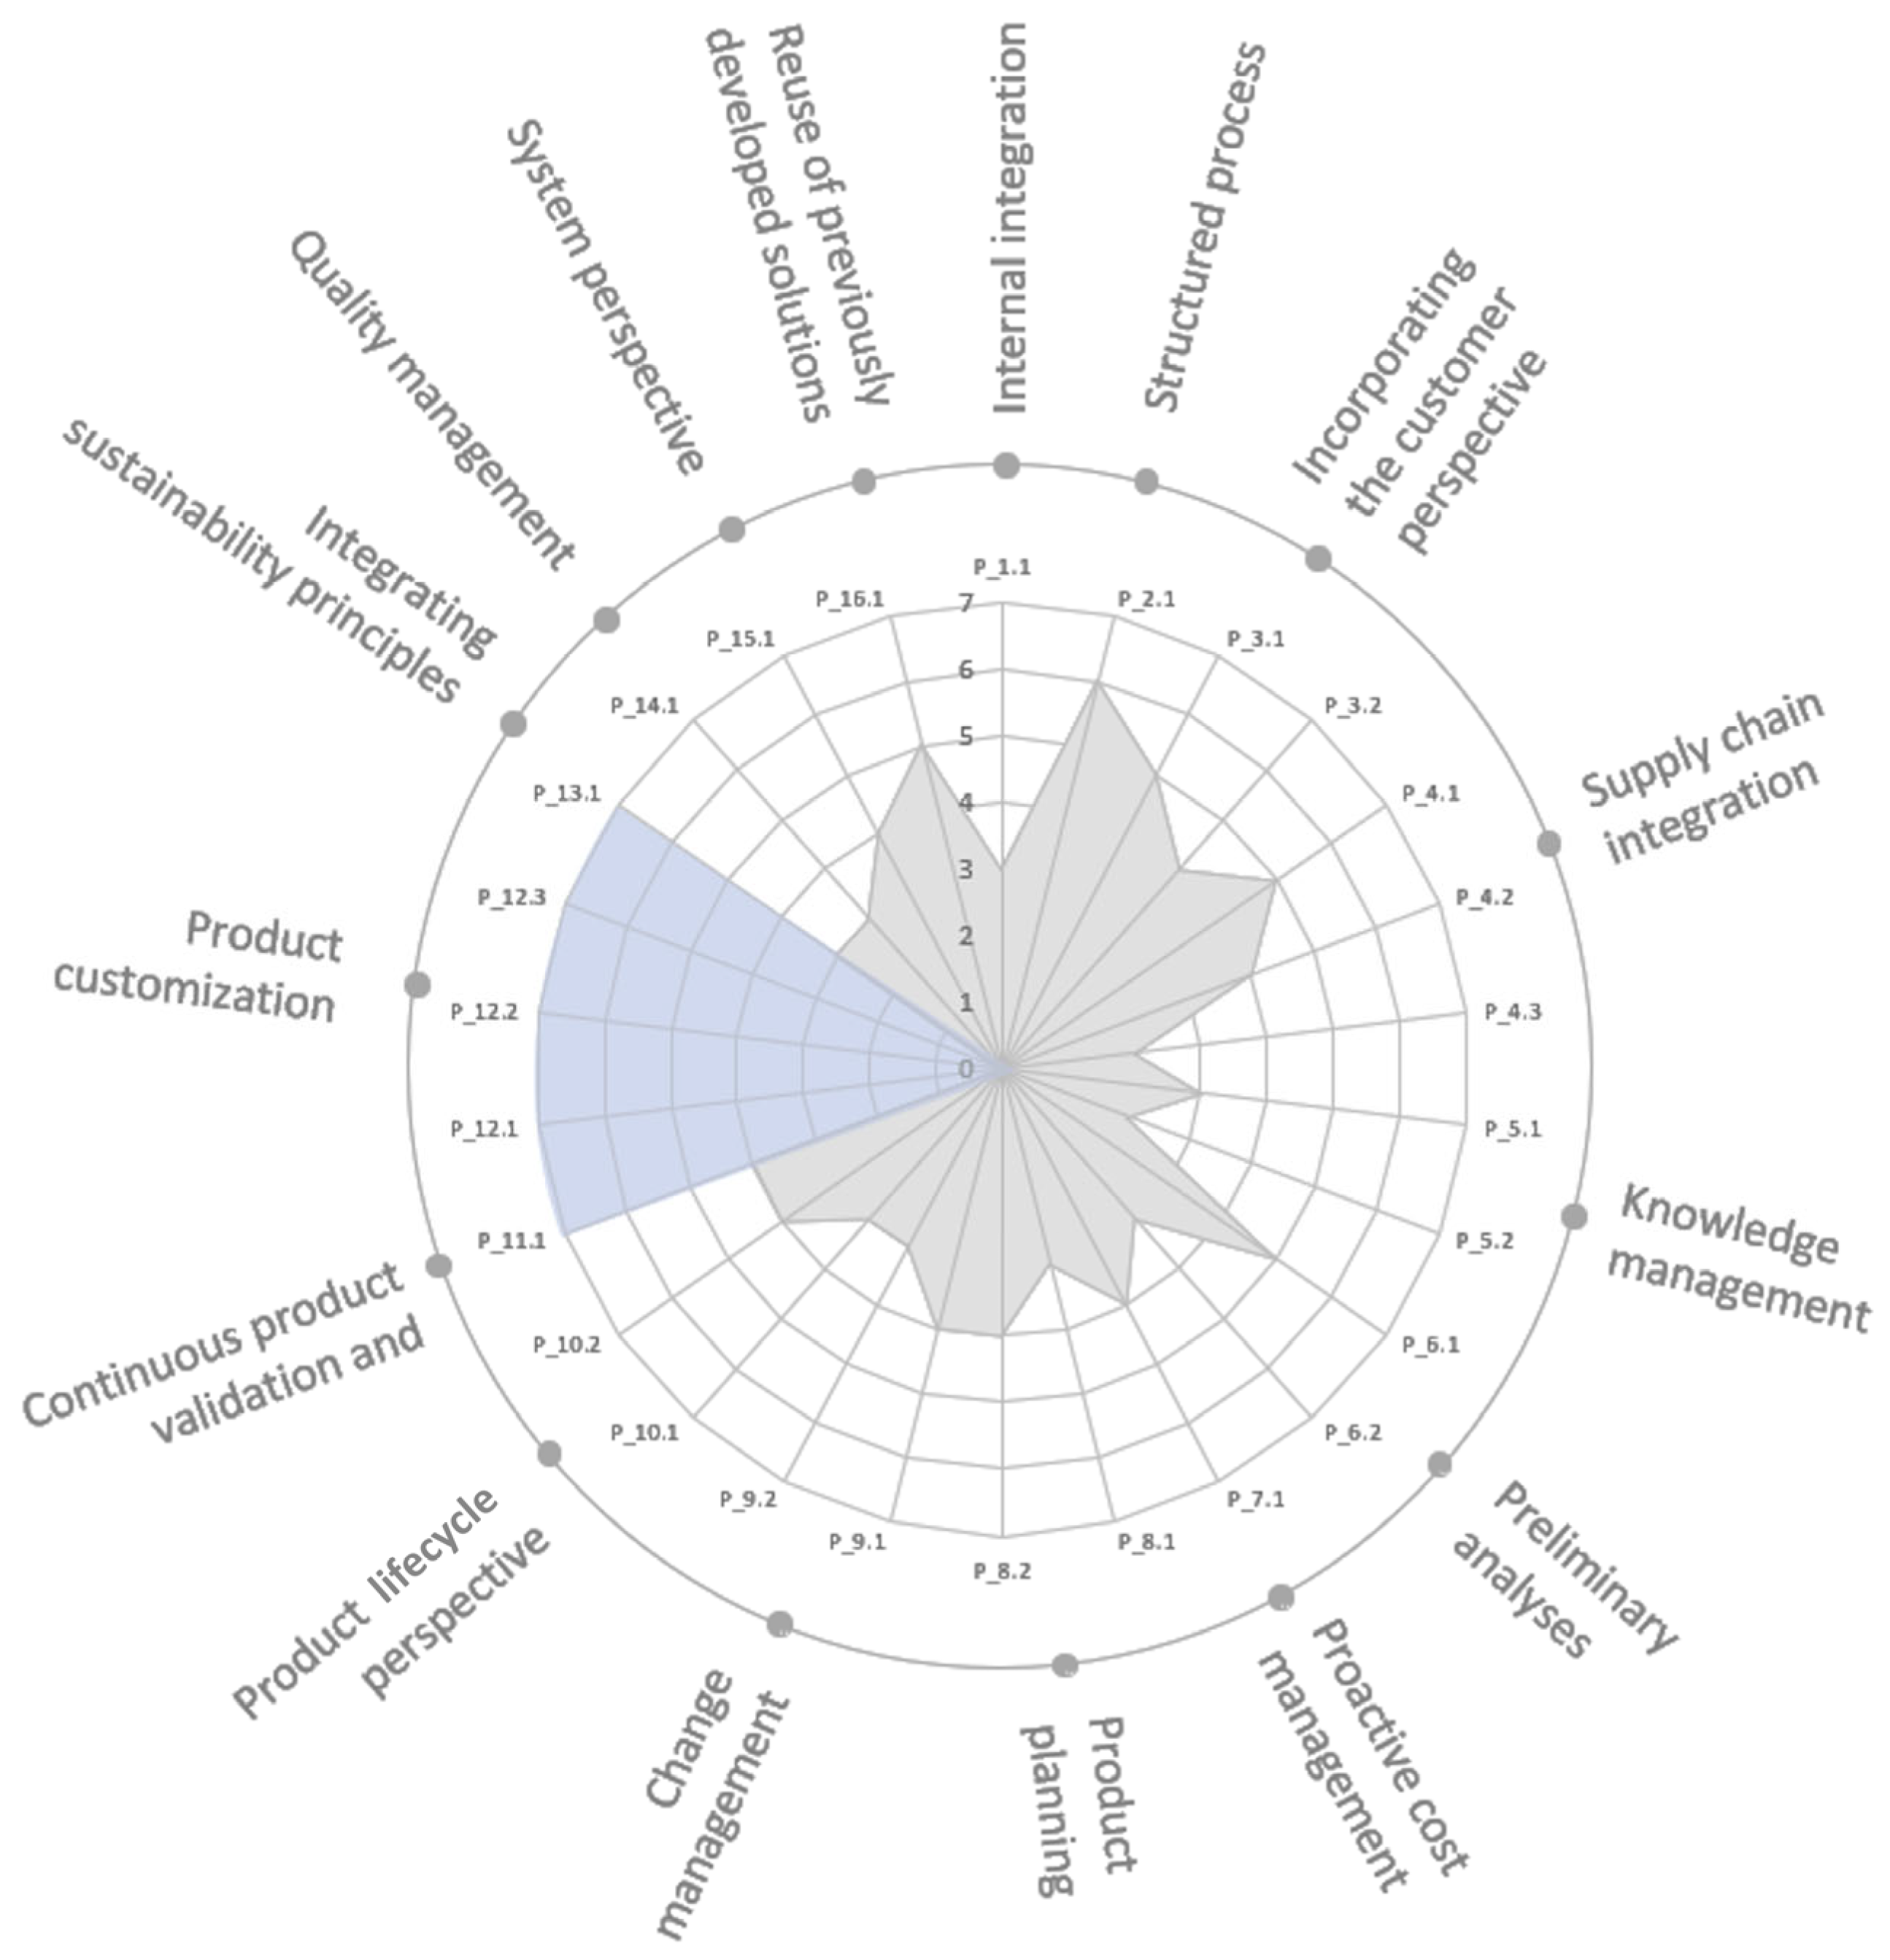
4.1.2. NPD Process Analysis and Evaluation

The evaluation process includes mapping the company’s work routines based on data acquired from a series of semi-structured interviews with relevant information holders, involving employees mainly from the system engineering, R&D, and production divisions.
During the case study, ten interviews were conducted with key informants identified in the initial meeting (e.g., head of production engineering, head of R&D, chief information officer, etc.). Regarding the sampling strategy, informants had key responsibilities in the new product development processes. Interviews were conducted face-to-face and remotely, each lasting between one and two hours. In the first step, only informants with a broad perspective were interviewed, and in the following steps, with the aim of gaining deeper insights into the problems discovered, we identified additional, more specialized informants. This process continued until the additional data produced only minimal new information. To ensure rigorous processing, all interviews were recorded, anonymized, transcribed, and consolidated into a case study database.
Along with interviews, other evidence sources were explored. Examining archival records and artifacts provided further insight into the issues at hand; data were additionally collected through participatory observations during visits to the company.
The collected data were analyzed by researchers to interpret and structure them.
Subsequently, the analysts assessed the compliance of the company’s work routines with managerial and engineering approaches, methods, and concepts declared as best practice standards for the specific domain, which were sublimated through the characterizations presented in the model. The estimations were modeled by linguistic variables, in accordance with the scale provided in Table 2. Figure 6 visually represents the evaluation findings, the blue area refers to NPD practices that were excluded after tailoring the questionnaire to align with company characteristics. The findings are briefly discussed below.
Enhancement potential was measured by the gap between the currently applied practice in a certain domain and the best practices standard (disparity between the assigned compliance rate and the highest level of sophistication on the evaluation scale, i.e., between corresponding IT2F values). The results can be found in Table 10.
Among the domains exhibiting low compliance with best practice standards are knowledge management, supply chain integration, integrating sustainability principles, and internal integration. Some of the main issues detected through NPD evaluation are briefly reported below.
Namely, the company encounters issues regarding knowledge formalization and dissemination. Beyond basic IT tools, no sophisticated methods exist for storing, accumulating, and disseminating knowledge; moreover, knowledge is mostly not codified through systematic mechanisms, resulting in it remaining tacit among individuals. Moreover, knowledge continues to be fragmented in isolated silos, primarily due to the low interoperability of the existing systems. Additionally, there are no effective mechanisms for identifying and effectively assimilating potentially valuable knowledge from external sources into product development processes intended for knowledge reconfiguration and commercialization.
Concerning the supply chain integration, there is a lack of effective inter-organizational coordination mechanisms that enable consistent exchanges of up-to-date information, knowledge transfer, effective cooperation, and synchronized processes with suppliers. For instance, suppliers are not provided real-time access to relevant product development data (Bill of Materials (BOM), Computer-Aided Design (CAD) data, requirements, or engineering change records); consequently, they often operate with inconsistent or outdated data, which causes delays and expensive redesigns. Additionally, the company struggles to manage a variety of systems across suppliers, resulting in inefficiencies and added complexity in supply chain management. Moreover, the company is incapable of directly intervening in or tracing suppliers’ activities to improve their performance and competencies.
The lack of systematic approaches that support the effective integration of sustainability principles into product and process engineering from the early stages to optimize resource use, improve energy efficiency, control environmental impact, and develop strategies that facilitate the closing of material flow loops should also be noted. This includes approaches like Lifecycle Assessment (LCA) or other technical tools for assessing the product’s environmental impact.
Even though the NPD process is intended to be cross-functional, the business units involved in product development more or less function as isolated silos. This is accompanied by difficulties coordinating cross-functional interactions, including issues with knowledge transfer or maintaining consistent information synchronization.

4.2. Stage 2: Assessing the Relevance of NPD Practices in the Company’s Contextual Circumstances

Proceeding from the premise that the influence of different management and engineering practices on the NPD efficiency and effectiveness variables is context-dependent, the model assesses the relevance of practices in two phases: first, prioritizing NPD objectives, and second, assessing how these practices influence the stimulation of NPD objectives.

4.2.1. The Prioritization of NPD Objectives

This step is carried out using Buckley’s [65] AHP method under the IT2F environment. The five employees from the systems engineering, R&D, production, and quality divisions were invited to participate in the prioritization process.
After being introduced to the decision-making problem, participants were requested to articulate their perceptions concerning the company’s commitment to the following NPD objectives: NPD_Obj1—reduced development cycle; NPD_Obj2—higher-quality products; NPD_Obj2—reduced expenses; and NPD_Obj4—elevated degree of innovation.
The participants articulated their perceptions as preferential relations, modeled by linguistic characterizations that are mathematically described using IT2F logic (refer to Table 3). As a result, five individual IT2F matrices of preferential relations ( A ~ ~ k = a ~ ~ k i j n × n , k = 1 , , K ) (9) were established; here, K denotes the total number of participants involved in the prioritization process. A consistency test was performed to detect and eliminate eventual inconsistencies in the estimates, following the procedure outlined by Saaty [125]. The test results indicate that all individual preference relation matrices are inconsistent within acceptable limits ( C R k < 10 % ).
This was followed by the consolidation of individual preferences ( a ~ ~ i j k ) and the creation of an IT2F aggregate matrix of preference relations (9). Subsequently, the IT2F geometric mean ( r ~ ~ i ) was computed for each row of the matrix ( A ~ ~ ) following Equation (15), and from these values, the IT2F weight vectors ( w ~ ~ i ) of the NPD objectives were derived according to (16). The findings are summarized in Table 6.
The prioritization results indicate that the company’s NPD strategy mainly focuses on creating higher-quality products (enhanced product compliance with customer demands, industry standards, and environmental regulations), with other NPD objectives (reduced development cycle, reduced expenses, and elevated degree of innovation) given roughly equal importance.

4.2.2. Evaluating the Practices’ Influence on Stimulating NPD Objectives

Evaluating the practices’ influence on stimulating NPD objectives in a company-specific context relies on the modified QFD approach. The proposed QFD analytic process correlates NPD practices ( t j ) systematized within the NPD evaluation model (Figure 3) with NPD objectives ( d i ) . Weight coefficients derived from the earlier AHP-based prioritization process are utilized as a relative importance of the NPD objectives ( w ~ ~ i ).
A QFD team comprised of company employees from the R&D, commercial, and production divisions was convened to assess the correlation degrees between reference NPD practices and NPD objectives. QFD experts were invited to discuss the potential influence of reference NPD practices ( t j ) on stimulating NPD objectives ( d i ) within specific company contexts, drawing on their specialized backgrounds. Each discovered t j d i correlation was assigned a linguistic characterization, following the scale outlined in Table 2. These linguistic variables were then mathematically described using the IT2F according to the same scale. Correlation ratings gathered from the QFD team were consolidated according to Equation (18); the resulting aggregated relation matrix between NPD practices and NPD objectives ( X ~ ~ ) can be found in Table 7.
Subsequently, the EDAS method under the IT2F was used to prioritize the NPD practices, following the procedure detailed below. The average matrix ( V = v ~ ~ i m × 1 ) was derived from the aggregated relation matrix (Table 8) established during the initial QFD phase in accordance with Equation (20).
Based on the average matrix and Equations (21) and (22), the positive ( p ~ ~ i j ) and negative ( n ~ ~ i j ) distances ( x ~ ~ i j ) from the average solution ( v ~ ~ i ) were computed for each NPD practice ( t j ). This was followed by computing the weighted sum of positive and negative distances ( s p ~ ~ j and s n ~ ~ j ) (27) and (28) and normalized values of them ( n p ~ ~ j and n n ~ ~ j ) using Equations (29) and (30).
Finally, the relative IT2F weight ( y ~ ~ j ) of each NPD practice was calculated, according to Equation (31). The findings are summarized in Table 9. The conducted QFD analytical process did not analyze the autocorrelations of NPD practices (quality attributes).
The resulting relative weights indicate the relevance of a specific NPD practice in the company-specific context and serve as input for the next step of the analysis.
This section exploits the QFD analysis results to provide insights into the relevance of NPD practices within the company’s specific context. Considering the rank provided by the EDAS, it is possible to discern the most essential NPD practices that the company should implement to bolster its NPD capabilities. Thanks to the findings coming from the EDAS process, it is possible to deduce that the NPD practices that exhibit the most significant influence on simulating the company’s NPD objectives are related to the following:
  • Establishing effective mechanisms for coordinating cross-functional interactions, supporting efficient knowledge transfer, exchanging and continuously synchronizing information, and fostering open cross-functional interactive communication in product development processes.
  • Consideration of the whole product lifecycle during product development by incorporating issues related to manufacturability, costs, material use, assembly, usability, maintainability, testability, and disposal suitability from the early stages of the process (e.g., applying Design for Manufacturing (DFM), Design for Assembly (DFA), and other Design for Excellence (DFX) principles).
  • Establishing a systematic interdisciplinary process of engineering change (engineering change request review and formal approval, engineering change orders, and documenting); establishing effective mechanisms that enable coordination of changes across different domains, change traceability, and promote cross-discipline involvement.
In fact, the abovementioned NPD practice shows the highest relative importance in terms of supporting the company’s NPD strategy.

4.3. Stage 3: Determining Enhancement Priorities

Going ahead with the analysis of the findings derived from the QFD analysis, it is possible to evaluate what the priority improvement domains are. The enhancement priorities are determined based on (1) the relevance of NPD practices within the company’s specific context and (2) the enhancement potential estimated during the phase labeled as the NPD process analysis and evaluation phase. The findings are shown in Table 10.
These findings highlight that the essential areas for implementing improvement initiatives to enhance the company’s NPD performance refer to practices labeled as P_1.1, P_10.1, P_5.1, P_14.1, etc. This includes internal integration with a focus on establishing better cross-functional coordination mechanisms, etc. Additionally, adopting a product lifecycle perspective is critical, meaning considering the entire product lifecycle during product development. This also necessitates setting up efficient mechanisms for integrated product knowledge management and fostering the reuse of previously accumulated knowledge, alongside establishing processes for planning, managing, and continuously improving quality from the early phases of product development.
These priorities are determined based on (1) the findings from the previous QFD analysis, which assess the relevance of NPD practices within the company’s specific context, and (2) the enhancement potential estimated during the phase labeled as the NPD process analysis and evaluation phase. The results are shown in Table 10.

4.4. Stage 4: Quantifying the Influence of PLM Functional Areas on Optimizing NPD Capabilities

The modified QFD approach is employed to analyze the influence of PLM functional aspects on the company’s NPD capabilities. The proposed QFD analytic process correlates the PLM functional aspects ( t j ) defined within the PLM reference functional model (Figure 2) with the reference NPD practices ( d i ), systematized within the NPD evaluation model (Figure 3).
A QFD team comprised of three types of professional experts was convened to assess the relationship degrees to which PLM functional aspects support the implementation of NPD practices in company-specific contexts including the following:
  • Company employees with a profound understanding of internal processes, contextual circumstances, and the company’s PLM initiative objectives—five experts;
  • Experts with specialized knowledge and practical experience in PLM implementation—three experts;
  • Representatives from the academic community: university professors with expertise in relevant scientific fields—four experts.
Linguistic correlation ratings gathered from the QFD team are mathematically described using IT2F logic ( x ~ ~ i j l ) (refer to Table 2) and then aggregated using Equation (18).
As the NPD practices’ relative weights ( w ~ ~ i ), QFD analysis considers the enhancement priorities determined within the previously step.
The IT2FEDAS method is employed to determine the weight vector ( y ~ ~ j ) of the PLM functional aspects. This procedure is analogous to the one detailed in the previous step. The findings are summarized in Table 11.
The QFD analysis allows for an evaluation of the global impact of each PLM functional aspect on the company’s NPD process, based on which it is possible to determine the relative priorities of PLM implementation efforts. These insights can be considered significant for setting PLM strategy from the perspective of bolstering innovation potential.
For instance, by analyzing the rankings provided by EDAS, we can conclude that the key functional aspects the PLM strategy should encompass are Cross-domain Product Design Collaboration, Product Structure Management, and Design Release and Change Management. These aspects significantly impact the company’s NPD capabilities, indicating that integrating them into the PLM strategy could greatly enhance NPD performance. For instance, Cross-domain Product Design Collaboration (ECAD, MCAD, and Software Development Management) enables the formation of a single, secure source of multi-domain product data through the comprehensive integration of mechanical, electrical, and software data. This integration empowers multi-domain design teams to collaborate more effectively across concurrent design environments, from requirements to design (mechanical, electrical, and software) to validation and verification. It aids them in understanding the complex relationships and dependencies among components across all product configurations, assessing the cross-domain impact of product changes, and enhancing the traceability of cross-domain requirements. Consequently, it enhances engineering efficiencies, supports concurrent engineering, and minimizes errors and warranty costs. At the same time, it reduces the time needed to implement engineering changes and develop new design variants and configurations, ultimately shortening the overall time to market. On the other hand, Design Release and Change Management empowers companies to create, review, and release changes to the product definition and disseminate them across the enterprise, streamlining these activities with strict controls and full traceability. It enhances visibility and associativity, ensuring that all changes are documented and that NPD stakeholders have access to the most up-to-date product definition information. Additionally, it promotes multi-domain involvement, allowing cross-functional teams to remain aligned during new product development. Integrated with PLM, these solutions allow for reviewing changes in context with all components or documents linked to the product to ensure compliance standards are met. This can enhance ECO performance, accelerate reviews, reduce errors and delays, and provide other benefits, ultimately shortening the overall time to market. Product Structure Management, which is usually based on BOM solutions, integrates the entire product design into a single system encompassing all components, assemblies, and related documents. Moreover, PLM-based BOM provides an automated way to synchronize the diverse information sources needed to secure BOM data from all design domains, ensuring it remains current and accurate. In addition, BOM links engineering changes, providing a strong, transparent foundation for the product record. This way, BOM maintains a single source of truth for the product’s data while allowing NPD participants across various engineering domains to create and manage product information unique to their discipline. This offers valuable insights for decision-making and helps reduce design errors, quality issues, scrapping, and reworking.

5. Discussion

From an academic perspective, the study led to the establishment of a systematic and integrated methodology for setting and adequately grounding a PLM strategy for companies aiming to enhance their innovation potential. The proposed framework has been designed to include quantitative and objective guidelines for PLM implementations, whereby the main focus has been on mapping the company’s specific needs. The research was predicated on the assumption that evaluating an organization’s NPD capabilities could provide a basis for identifying the company’s latent needs, in alignment with the PLM strategy’s orientation toward enhancing innovation potential. Hence, a novel methodological approach has been conceived and proposed to analyze the NPD process systematically, identify priority areas for focusing improvement efforts, and map them with specific PLM functional aspects.
The proposed methodology employs a QFD analytic process enhanced by MCMD methods. Moreover, since accurately predicting the exact values of variables existing in PLM implementation problems is difficult due to various sources of uncertainties and vagueness, the proposed methodology incorporates IT2F sets as a suitable tool for addressing these issues.
The key contributions of this study are highlighted below:
  • A new PLM functional model is established, providing a reference frame for defining the scope of the PLM strategy, emphasizing the need to adapt the reference model for application in specific contexts, including dedicated functionalities aligned to company needs instead of standard ones.
  • A new normative-contingent NPD evaluation model is established, grounded in best practice frameworks, providing a consistent methodology capable of capturing the company’s latent needs related to enhancing NPD capabilities. Proceeding from the premise that using product development best practices is context-dependent, the evaluation model introduces the principles of coherence, considering NPD practices’ relative importance by evaluating how well they align with the company’s NPD strategy. Based on the findings of NPD evaluations, companies become aware of the gap between the actual and best practices available to be used. These insights are significant for comprehending where to focus enhancement initiatives to bolster the company’s NPD performance.
  • A QFD-based methodology is proposed to quantify the impact of specific PLM functional aspects on NPD capability, assisting companies in understanding their implementation priorities. In this way, they could gain objective guidance for establishing a PLM competence development model that effectively supports the continuous improvement of their NPD capabilities. This also could lead to reducing the implementation failure risk by including dedicated PLM functionalities instead of standard ones.
From a theoretical perspective, the proposed QFD model is proved to be advantageous in the following aspects:
  • The quality attribute prioritization phase relies on the EDAS method instead of employing a straightforward weighted averaging technique, allowing more precise quality attribute-relative priority rankings.
  • The Buckley’s AHP model is used to prioritize the request attributes, which could yield more consistent and reliable importance degrees.
  • The use of IT2F sets provides a simple representation of qualitative concepts that can describe vagueness and ambiguities with less information loss.
The NPD evaluation findings highlight that the key areas for implementing improvement initiatives to enhance the company’s NPD performance include (i) internal integration with a focus on establishing better cross-functional coordination mechanisms, etc.; (ii) adopting a product lifecycle perspective during product development; (iii) setting up efficient mechanisms for integrated product knowledge management and fostering the reuse of previously accumulated knowledge; and (iv) establishing processes for planning, managing, and continuously improving quality from the early phases of product development.
By correlating NPD optimization areas with PLM features based on QFD analysis, the global impact of each PLM functional aspect on the company’s NPD capabilities is determined, indicating the implementation efforts priorities. According to the QFD ranks, PLM functional aspects are sorted based on their level of importance as follows: Pr.Str.Mng > Pr.Conf.Mng > Cross-dom.Pr.Desgn.Col > Desig.Rel.Chan.Mng > 3D Vis.Dig.Mock > Sys.Arch.Mng > Sim.Proc.Dat.Mng > Suppl.Ch.Sour.Mng > Req.Mng > Dig.Manuf > Progr.Proj.Mng > Qual.Pl.Mng > Class.Mng > Pr.Doc.Mng > Manuf.Proc.Plan > Envir.Comp.Mng > Serv.Eng > Prod.Cost.Mng > Anal.Rep
Analyzing the rankings from the QFD process reveals that the PLM functional aspects most influential on the company’s NPD process performance are Cross-domain Product Design Collaboration, Product Structure Management, and Design Release and Change Management. These insights can be considered significant for identifying and evaluating the PLM functional domains that would most effectively support an organization’s needs related to NPD process optimization, offering objective guidelines for setting PLM strategy from the perspective of enhancing innovation potential.
However, this study has several limitations, including (i) the subjective assessments of experts that may affect the accuracy of the input data; (ii) the AHP method does not account for potential interdependencies among NPD objectives; (iii) the empirical analysis is based on a single company case; and (iv) the complexity of the approach may hinder its practical applicability.
Future research could focus on (i) employing methods that examine the relationships between NPD objectives; (ii) using alternative approaches for mathematically modeling vague linguistic variables in QFD analysis; (iii) conducting empirical research to evaluate how widely the identified NPD best practices are adopted in the industry and to assess the level of NPD capabilities achieved by companies; (iv) validating the model through various cases in other industries; and (v) developing adequate software solution to facilitate the application of the developed approach.

6. Conclusions

The study provided a systematic and integrated methodology for setting and adequately grounding a PLM strategy for companies aiming to enhance their innovation potential. The proposed approach provides a systematic methodology for prioritizing implementation efforts as a ground for PLM strategy setting, introducing a new perspective that considers the potential impact on a company’s NPD capabilities resulting from the adoption of PLM. In that context, the proposed framework provides (i) a PLM functional model as a reference frame for defining the PLM strategy scope; (ii) a mechanism for mapping a company’s latent needs related to optimizing the NPD process; and (iii) a methodology for quantifying the impact of PLM functional aspects on NPD capabilities. The proposed methodology provides clear and quantitative guidelines for PLM strategy setting in real scenarios. Furthermore, the model is generic, making it suitable for application across various industrial contexts.
Employing MCDM methods alongside QFD analysis provides an approach capable of addressing the complex and unstructured nature of the problem at hand. Extending their conventional concepts with fuzzy set theory improves the approach’s rationality under uncertainties, facilitating the description of the vagueness and ambiguities inherent in PLM implementation processes.

Author Contributions

Conceptualization, S.P., J.V.V., D.T. and D.D.M.; methodology, S.P., J.V.V., D.T. and D.D.M.; validation, S.P., J.V.V., D.T. and D.D.M.; formal analysis, S.P., J.V.V., D.T. and D.D.M.; investigation, S.P., J.V.V., D.T. and D.D.M.; data curation, S.P., J.V.V., D.T. and D.D.M.; writing—original draft preparation, S.P., J.V.V., D.T. and D.D.M.; writing—review and editing, S.P., J.V.V., D.T. and D.D.M.; supervision, J.V.V. All authors have read and agreed to the published version of the manuscript.

Funding

This work was supported by the Ministry of Science, Technological Development and Innovation of the Republic of Serbia, under Grant 451-03-137/2025-03/200132 with University of Kragujevac—Faculty of Technical Sciences Čačak.

Institutional Review Board Statement

Not applicable.

Informed Consent Statement

Not applicable.

Data Availability Statement

The raw data supporting the conclusions of this article will be made available by the authors on request.

Conflicts of Interest

The authors declare no conflicts of interest.

References

  1. Bandinelli, R.; Terzi, S. An Exploratory Study on Product Lifecycle Management in the Fashion Chain: Evidences from the Italian Leather Luxury Industry. In Fashion Supply Chain Management: Industry and Business Analysis; IGI Global Scientific Publishing: Hershey, PA, USA, 2012. [Google Scholar]
  2. Schuh, G.; Rozenfeld, H.; Assmus, D.; Zancul, E. Process Oriented Framework to Support PLM Implementation. Comput. Ind. 2008, 59, 210–218. [Google Scholar] [CrossRef]
  3. Stark, J. Product Lifecycle Management: 21st Century Paradigm for Product Realisation; Springer: London, UK, 2015. [Google Scholar]
  4. Immonen, A.; Saaksvuori, A. Product Lifecycle Management; Springer Science & Business Media: Cham, Switzerland, 2013. [Google Scholar]
  5. CIMdata. Product Lifecycle Management: Empowering the Future of Business; CIMdata: Ann Arbor, MI, USA, 2002. [Google Scholar]
  6. Ma, Y.; Fuh, J. Product Lifecycle Modelling, Analysis and Management. Comput. Ind. 2008, 59, 107–109. [Google Scholar] [CrossRef]
  7. CIMdata. Market Analysis Results. PLM Market & Industry Forum; CIMdata: Ann Arbor, MI, USA, 2024. [Google Scholar]
  8. Singh, S.; Misra, S.C.; Kumar, S. Institutionalization of Product Lifecycle Management in Manufacturing Firms. IEEE Trans. Eng. Manag. 2021, 70, 3465–3480. [Google Scholar] [CrossRef]
  9. Vezzetti, E.; Alemanni, M.; Macheda, J. Supporting Product Development in the Textile Industry Through the Use of a Product Lifecycle Management Approach: A Preliminary Set of Guidelines. Int. J. Adv. Manuf. Technol. 2015, 79, 1493–1504. [Google Scholar] [CrossRef]
  10. Dunne, K. PDM Implementation Methodology. RapidPDM Consortium Documented Implementation Methodology, Including Implementation Planning Model, RapidPDM Consortium (ESPRIT Project 26892). 2001.
  11. Sassanelli, C.; Rossi, M.; Terzi, S. Evaluating the Smart Maturity of Manufacturing Companies along the Product Development Process to Set a PLM Project Roadmap. Int. J. Prod. Lifecycle Manag. 2020, 12, 185–209. [Google Scholar] [CrossRef]
  12. Myung, S. Master Data Management in PLM for the Enterprise Scope. In Product Lifecycle Management in the Era of Internet of Things: 12th IFIP WG 5.1 International Conference, PLM 2015; Springer International Publishing: Cham, Switzerland, 2012. [Google Scholar]
  13. Arnold, V.; Dettmering, H.; Engel, T.; Karcher, A. Product Lifecycle Management Beherrschen: Ein Anwenderhandbuch für den Mittelstand; Springer: Berlin/Heidelberg, Germany, 2011. [Google Scholar]
  14. Fani, V.; Falchi, C.; Bindi, B.; Bandinelli, R. Implementation framework for PLM: A case study in the fashion industry. J. Adv. Manuf. Technol. 2021, 113, 435–448. [Google Scholar] [CrossRef]
  15. Panizzolo, R.; Biazzo, S.; Garengo, P. New Product Development Assessment: Towards a Normative-Contingent Audit. Benchmarking Int. J. 2010, 17, 173–194. [Google Scholar] [CrossRef]
  16. McQuater, R.E.; Peters, A.J.; Dale, B.G.; Spring, M.; Rogerson, J.H.; Rooney, E.M. The Management and Organisational Context of New Product Development: Diagnosis and Self-Assessment. Int. J. Prod. Econ. 1998, 55, 121–131. [Google Scholar] [CrossRef]
  17. Chiesa, V.; Coughlan, P.; Voss, C.A. Development of a Technical Innovation Audit. J. Prod. Innov. Manag. 1996, 13, 105–136. [Google Scholar] [CrossRef]
  18. SEI. Software CMM, Version 2.0 (Draft C); Software Engineering Institute: Pittsburgh, PA, USA, 1997. [Google Scholar]
  19. EIA. Systems Engineering Capability Model (EIA/IS-731); Electronic Industries Alliance: Washington, DC, USA, 1998. [Google Scholar]
  20. EPIC; SEI. Integrated Product Development Capability Maturity Model, Draft Version 0.98; Enterprise Process Improvement Collaboration and Software Engineering Institute, Carnegie Mellon University: Pittsburgh, PA, USA, 1997. [Google Scholar]
  21. Carter, D.E.; Baker, B.S. CE, Concurrent Engineering: The Product Development Environment for the 1990s; Addison Wesley Publishing Company: Boston, MA, USA, 1992. [Google Scholar]
  22. Pawar, K.S.; Thoben, K.D.; Oehlmann, R. The Development of a Conceptual Model and a Knowledge Platform for Concurrent Engineering. In Proceedings of the Concurrent Engineering Conference, Washington, DC, USA, 23–25 August 1995. [Google Scholar]
  23. Anumba, C.; Kamara, J.M.; Cutting-Decelle, A.F. Concurrent Engineering in Construction Projects; Routledge: Oxford, UK, 2007. [Google Scholar]
  24. Van Landeghem, H.; Dewilde, H. A simultaneous engineering benchmarking tool. In Proceedings of the 2nd International Conference on Concurrent Engineering and Electronic Design Automation, Bournemouth, UK, 7–8 April 1994. [Google Scholar]
  25. Rossi, M.; Taisch, M.; Terzi, S. Lean Product Development: A Five-Steps Methodology for Continuous Improvement. In Proceedings of the 2012 18th International ICE Conference on Engineering, Technology and Innovation, Munich, Germany, 18–20 June 2012. [Google Scholar]
  26. Cormican, K.; O’Sullivan, D. Auditing Best Practice for Effective Product Innovation Management. Technovation 2004, 24, 819–829. [Google Scholar] [CrossRef]
  27. Tennant, C.; Roberts, P. The Creation and Application of a Self-Assessment Process for New Product Introduction. Int. J. Proj. Manag. 2003, 21, 77–87. [Google Scholar] [CrossRef]
  28. Rossi, M.; Terzi, S. CLIMB: Maturity Assessment Model for Design and Engineering Processes. Int. J. Prod. Lifecycle Manag. 2017, 10, 20–43. [Google Scholar] [CrossRef]
  29. Kahn, K.B.; Barczak, G.; Nicholas, J.; Ledwith, A.; Perks, H. An Examination of New Product Development Best Practice. J. Prod. Innov. Manag. 2012, 29, 180–192. [Google Scholar] [CrossRef]
  30. Kahn, K.B.; Barczak, G.; Moss, R. Perspective: Establishing an NPD Best Practices Framework. J. Prod. Innov. Manag. 2006, 23, 106–116. [Google Scholar] [CrossRef]
  31. Barczak, G.; Kahn, K.B. Identifying New Product Development Best Practice. Bus. Horiz. 2012, 55, 293–305. [Google Scholar] [CrossRef]
  32. Henard, D.H.; Szymanski, D.M. Why Some New Products are More Successful than Others. J. Mark. Res. 2001, 38, 362–375. [Google Scholar] [CrossRef]
  33. Chen, J.; Damanpour, F.; Reilly, R.R. Understanding Antecedents of New Product Development Speed: A Meta-Analysis. J. Oper. Manag. Res. 2010, 28, 17–33. [Google Scholar] [CrossRef]
  34. Cooper, R.G. The Drivers of Success in New-Product Development. Ind. Mark. Manag. 2019, 76, 36–47. [Google Scholar] [CrossRef]
  35. Chang, W.; Taylor, S.A. The effectiveness of customer participation in new product development: A meta-analysis. J. Mark. 2016, 80, 47–64. [Google Scholar] [CrossRef]
  36. Sjoerdsma, M.; van Weele, A.J. Managing Supplier Relationships in a New Product Development Context. J. Purch. Supply Manag. 2015, 21, 192–203. [Google Scholar] [CrossRef]
  37. Knudsen, M.P.; Von Zedtwitz, M.; Griffin, A.; Barczak, G. Best Practices in New Product Development and Innovation: Results from PDMA’s 2021 Global Survey. J. Prod. Innov. Manag. 2023, 40, 257–275. [Google Scholar] [CrossRef]
  38. Marzi, G.; Ciampi, F.; Dalli, D.; Dabic, M. New Product Development During the Last Ten Years: The Ongoing Debate and Future Avenues. IEEE Trans. Eng. Manag. 2020, 68, 330–344. [Google Scholar] [CrossRef]
  39. Markham, S.K.; Lee, H. Product Development and Management Association’s 2012 Comparative Performance Assessment Study. J. Prod. Innov. Manag. 2013, 30, 408–429. [Google Scholar] [CrossRef]
  40. Nicholas, J.; Ledwith, A.; Perks, H. New Product Development Best Practice in SME and Large Organisations: Theory vs. Practice. Eur. J. Innov. Manag. 2011, 14, 227–251. [Google Scholar] [CrossRef]
  41. Ahmad, S.; Mallick, D.N.; Schroeder, R.G. New Product Development: Impact of Project Characteristics and Development Practices on Performance. J. Prod. Innov. Manag. 2013, 30, 331–348. [Google Scholar] [CrossRef]
  42. Echeveste, M.E.S.; Rozenfeld, H.; Fettermann, D.D.C. Customizing Practices based on the Frequency of Problems in New Product Development Process. Concurr. Eng. 2017, 25, 245–261. [Google Scholar] [CrossRef]
  43. Buyukozkan, G.; Gocer, F. A Novel Approach Integrating AHP and COPRAS under Pythagorean Fuzzy Sets for Digital Supply Chain Partner Selection. IEEE Trans. Eng. Manag. 2019, 68, 1486–1503. [Google Scholar] [CrossRef]
  44. Huang, C.; Lin, M.; Xu, Z. Pythagorean Fuzzy MULTIMOORA Method based on Distance Measure and Score Function: Its Application in Multicriteria Decision Making Process. Knowl. Inf. Syst. 2020, 62, 4373–4406. [Google Scholar] [CrossRef]
  45. Joshi, D.; Kumar, S. Interval-Valued Intuitionistic Hesitant Fuzzy Choquet Integral based TOPSIS Method for Multi-Criteria Group Decision Making. Eur. J. Oper. Res. 2016, 248, 183–191. [Google Scholar] [CrossRef]
  46. Garg, H.; Sharaf, I.M. A New Spherical Aggregation Function with the Concept of Spherical Fuzzy Difference for Spherical Fuzzy EDAS and its Application to Industrial Robot Selection. Comput. Appl. Math. 2022, 41, 212. [Google Scholar] [CrossRef]
  47. Omerali, M.; Kaya, T. Product Lifecycle Management Application Selection Framework based on Interval-Valued Spherical Fuzzy COPRAS. J. Intell. Fuzzy Syst. 2022, 42, 425–438. [Google Scholar] [CrossRef]
  48. Ezhilarasan, N.; Felix, A. Bipolar Trapezoidal Fuzzy ARAS Method to Identify the Tuberculosis Comorbidities. In Micro-Electronics and Telecommunication Engineering: Proceedings of 6th ICMETE; Springer Nature: Singapore, 2023. [Google Scholar]
  49. Li, Z.; Wei, G.; Wang, R.; Wu, J.; Wei, C.; Wei, Y. EDAS Method for Multiple Attribute Group Decision Making under Q-rung Orthopair Fuzzy Environment. Technol. Econ. Dev. Econ. 2020, 26, 86–102. [Google Scholar] [CrossRef]
  50. Riaz, M.; Farid, H.M.A.; Shakeel, H.M.; Almalki, Y. Modernizing Energy Efficiency Improvement with Q-Rung Orthopair Fuzzy MULTIMOORA Approach. IEEE Access 2022, 10, 74931–74947. [Google Scholar] [CrossRef]
  51. Mendel, J.M.; John, R.B. Type-2 Fuzzy Sets Made Simple. IEEE Trans. Fuzzy Syst. 2002, 10, 117–127. [Google Scholar] [CrossRef]
  52. Kahraman, C.; Ertay, T.; Büyüközkan, G. A Fuzzy Optimization Model for QFD Planning Process Using Analytic Network Approach. Eur. J. Oper. Res. 2006, 171, 390–411. [Google Scholar] [CrossRef]
  53. Zadeh, L.A. The Concept of a Linguistic Variable and its Application to Approximate Reasoning—II. Inf. Sci. 1975, 8, 301–357. [Google Scholar] [CrossRef]
  54. Mendel, J.M.; John, R.I.; Liu, F. Interval Type-2 Fuzzy Logic Systems Made Simple. IEEE Trans. Fuzzy Syst. 2006, 14, 808–821. [Google Scholar] [CrossRef]
  55. Aleksic, A.; Tadić, D. Industrial and Management Applications of Type-2 Multi-Attribute Decision-Making Techniques Extended with Type-2 Fuzzy Sets from 2013 to 2022. Mathematics 2023, 11, 2249. [Google Scholar] [CrossRef]
  56. Puzovic, S.; Vesic Vasovic, J.; Milanovic, D.D.; Paunovic, V. A Hybrid Fuzzy MCDM Approach to Open Innovation Partner Evaluation. Mathematics 2023, 11, 3168. [Google Scholar] [CrossRef]
  57. Vesic Vasovic, J.; Puzovic, S.; Paunovic, V. Selection of Partners in Collaborative Technological R&D Projects: An Approach to Criteria Prioritization. In Operational Research in the Era of Digital Transformation and Business Analytics: BALCOR 2020; Springer Proceedings in Business and Economics; Springer: Cham, Switzerland, 2023; pp. 77–87. [Google Scholar]
  58. Dorfeshan, Y.; Mousavi, S.M.; Mohagheghi, V.; Vahdani, B. Selecting Project-Critical Path by a New Interval Type-2 Fuzzy Decision Methodology Based on MULTIMOORA, MOOSRA and TPOP Methods. Comput. Ind. Eng. 2018, 120, 160–178. [Google Scholar] [CrossRef]
  59. Wu, Y.; Zhang, T.; Yi, L. Internal type-2 Trapezoidal Fuzzy Sets-PROMETHEE-II Based Investment Decision Framework of Compressed Air Energy Storage Project in China under the Perspective of Different Investors. J. Energy Storage 2020, 30, 101548. [Google Scholar] [CrossRef]
  60. Yilmaz, I.; Ecemis Yilmaz, H.K. A Consensus Framework for Evaluating Dispute Resolution Alternatives in International Law Using an Interval-Valued Type-2 Fuzzy TOPSIS Approach. Appl. Sci. 2024, 14, 11046. [Google Scholar] [CrossRef]
  61. Kabir, G.; Hasin, M.A.A.A. Evaluation of Customer Oriented Success Factors in Mobile Commerce Using Fuzzy AHP. J. Ind. Eng. Manag. 2011, 4, 361–386. [Google Scholar] [CrossRef]
  62. Chan, F.T.; Kumar, N.; Tiwari, M.K.; Lau, H.C.; Choy, K. Global Supplier Selection: A Fuzzy-AHP Approach. Int. J. Prod. Res. 2008, 46, 3825–3857. [Google Scholar] [CrossRef]
  63. Deng, H. Multicriteria Analysis with Fuzzy Pairwise Comparison. Int. J. Approx. Reason. 1999, 21, 215–231. [Google Scholar] [CrossRef]
  64. Van Laarhoven, P.J.; Pedrycz, W. A Fuzzy Extension of Saaty’s Priority Theory. Fuzzy Sets Syst. 1983, 11, 229–241. [Google Scholar] [CrossRef]
  65. Buckley, J.J. Fuzzy Hierarchical Analysis. Fuzzy Sets Syst. 1985, 17, 233–247. [Google Scholar] [CrossRef]
  66. Chang, D.Y. Applications of the Extent Analysis Method on Fuzzy AHP. Eur. J. Oper. Res. 1996, 95, 649–655. [Google Scholar] [CrossRef]
  67. Mikhailov, L. Deriving Priorities from Fuzzy Pairwise Comparison Judgements. Fuzzy Sets Syst. 2003, 134, 365–385. [Google Scholar] [CrossRef]
  68. Xu, R. Fuzzy Least-squares Priority Method in the Analytic Hierarchy Process. Fuzzy Sets Syst. 2000, 112, 395–404. [Google Scholar] [CrossRef]
  69. Akao, Y. QFD: Integrating Customer Requirements into Product Design; Productivity Press: Cambridge, MA, USA, 1990. [Google Scholar]
  70. Büyüközkan, G.; Çifçi, G. An Integrated QFD Framework with Multiple Formatted and Incomplete Preferences: A Sustainable Supply Chain Application. Appl. Soft Comput. 2013, 13, 3931–3941. [Google Scholar] [CrossRef]
  71. Yazdani, M.; Hashemkhani Zolfani, S.; Zavadskas, E.K. New Integration of MCDM Methods and QFD in the Selection of Green Suppliers. J. Bus. Econ. 2016, 17, 1097–1113. [Google Scholar] [CrossRef]
  72. Liu, H.C.; Shi, H.; Li, Z.; Duan, C.Y. An Integrated Behavior Decision-Making Approach for Large Group Quality Function Deployment. Inf. Sci. 2022, 582, 334–348. [Google Scholar] [CrossRef]
  73. Cohen, L. Quality Function Deployment: How to Make QFD Work for You; AddisonWesley: Reading, MA, USA, 1995. [Google Scholar]
  74. Jaiswal, E.S. A Case Study on Quality Function Deployment (QFD). J. Mech. Eng. Sci. 2012, 3, 27–35. [Google Scholar] [CrossRef]
  75. Hauser, J.R.; Clausing, D. The House of Qualify; Harvard Business Review: Brighton, MA, USA, 1988. [Google Scholar]
  76. Shen, Y.C.; Chen, P.S.; Wang, C.H. A Study of Enterprise Resource Planning (ERP) System Performance Measurement Using the Quantitative Balanced Scorecard Approach. Comput. Ind. 2016, 75, 127–139. [Google Scholar] [CrossRef]
  77. Zarei, M.; Fakhrzad, M.B.; Paghaleh, M.J. Food Supply Chain Leanness Using a Developed QFD Model. J. Food Eng. 2011, 102, 25–33. [Google Scholar] [CrossRef]
  78. Bottani, E.; Rizzi, A. Strategic Management of Logistics Service: A Fuzzy QFD Approach. Int. J. Prod. Econ. 2006, 103, 585–599. [Google Scholar] [CrossRef]
  79. Torkayesh, A.E.; Yazdani, M.; Ribeiro-Soriano, D. Analysis of Industry 4.0 Implementation in Mobility Sector: An Integrated Approach based on QFD, BWM, and Stratified Combined Compromise Solution under Fuzzy Environment. J. Ind. Inf. Integr. 2022, 30, 100406. [Google Scholar] [CrossRef]
  80. Efe, B.; Efe, Ö.F. Quality Function Deployment based Failure Mode and Effect Analysis Approach for Risk Evaluation. Neural Comput. Appl. 2021, 33, 10159–10174. [Google Scholar] [CrossRef]
  81. Yazdani, M.; Chatterjee, P.; Zavadskas, E.K.; Zolfani, S.H. Integrated QFD-MCDM Framework for Green Supplier Selection. J. Clean. Prod. 2017, 142, 3728–3740. [Google Scholar] [CrossRef]
  82. Jia, G.Z.; Bai, M. An Approach for Manufacturing Strategy Development based on Fuzzy-QFD. Comput. Ind. Eng. 2011, 60, 445–454. [Google Scholar] [CrossRef]
  83. Ahmadzadeh, A.; Sheikh Aboumasoudi, A.; Shahin, A.; Teimouri, H. Developing a QFD Model for Prioritizing the CSFs of ERP Based on the Enablers of Organizational Agility. Benchmarking Int. J. 2021, 28, 1164–1185. [Google Scholar] [CrossRef]
  84. Wang, C.; Zhang, J.; Liu, D.; Cai, Y.; Gu, Q. An AI-Powered Product Identity Form Design Method Based on Shape Grammar and Kansei Engineering: Integrating Midjourney and Grey-AHP-QFD. Appl. Sci. 2024, 14, 7444. [Google Scholar] [CrossRef]
  85. Li, W.; Yüksel, S.; Dinçer, H. Understanding the Financial Innovation Priorities for Renewable Energy Investors via QFD-based Picture Fuzzy and Rough Numbers. Fin. Tech. 2022, 8, 67. [Google Scholar] [CrossRef]
  86. Onar, S.Ç.; Büyüközkan, G.; Öztayşi, B.; Kahraman, C. A New Hesitant Fuzzy QFD Approach: Application to Computer Workstation Selection. Appl. Soft Comput. 2016, 46, 1–16. [Google Scholar] [CrossRef]
  87. Dhumras, H.; Bajaj, R.K. On Assembly Robotic Design Evaluation Problem Using Enhanced Quality Function Deployment with q-Rung Orthopair Fuzzy Set Theoretic Environment. J. Inf. Sci. Eng. 2023, 39, 623–636. [Google Scholar]
  88. Nie, R.X.; Tian, Z.P.; Kwai Sang, C.; Wang, J.Q. Implementing Healthcare Service Quality Enhancement Using a Cloud-Support QFD Model Integrated with TODIM Method and Linguistic Distribution Assessments. J. Oper. Res. Soc. 2022, 73, 207–229. [Google Scholar] [CrossRef]
  89. Yu, L.; Wang, L.; Bao, Y. Technical Attributes Ratings in Fuzzy QFD by Integrating Interval-Valued Intuitionistic Fuzzy Sets and Choquet Integral. Soft Comput. 2018, 22, 2015–2024. [Google Scholar] [CrossRef]
  90. Haktanır, E.; Kahraman, C. A Novel Interval-Valued Pythagorean Fuzzy QFD Method and its Application to Solar Photovoltaic Technology Development. Comput. Ind. Eng. 2019, 132, 361–372. [Google Scholar] [CrossRef]
  91. Shi, H.; Mao, L.X.; Li, K.; Wang, X.H.; Liu, H.C. Engineering Characteristics Prioritization in Quality Function Deployment Using an Improved ORESTE Method with Double Hierarchy Hesitant Linguistic Information. Sustainability 2022, 14, 9771. [Google Scholar] [CrossRef]
  92. Xu, X.G.; Zhang, L.; Mao, L.X.; Li, K. New Approach for Quality Function Deployment Using an Extended CoCoSo Method with Spherical. Fuzzy Sets Syst. 2022, 10, 253. [Google Scholar] [CrossRef]
  93. Wu, S.M.; You, X.Y.; Liu, H.C.; Wang, L.E. Improving Quality Function Deployment Analysis with the Cloud MULTIMOORA Method. Int. Trans. Oper. Res. 2020, 27, 1600–1621. [Google Scholar] [CrossRef]
  94. Mao, L.X.; Liu, R.; Mou, X.; Liu, H.C. New Approach for Quality Function Deployment Using Linguistic Z-Numbers and EDAS Method. Informatica 2021, 32, 565–582. [Google Scholar] [CrossRef]
  95. Wu, X.; Liao, H. An Approach to Quality Function Deployment based on Probabilistic Linguistic Term Sets and ORESTE Method for Multi-Expert Multi-Criteria Decision Making. Inf. Fusion 2018, 43, 13–26. [Google Scholar] [CrossRef]
  96. Kürüm Varolgüneş, F.; Canan, F.; del Río-Rama, M.D.L.C.; Oliveira, C. Design of a Thermal Hotel based on AHP-QFD Methodology. Water 2021, 13, 2109. [Google Scholar] [CrossRef]
  97. Tavana, M.; Yazdani, M.; Di Caprio, D. An Application of an Integrated ANP–QFD Framework for Sustainable Supplier Selection. Int. J. Logist-Res. Appl. 2017, 20, 254–275. [Google Scholar] [CrossRef]
  98. Bouchereau, V.; Rowlands, H. Methods and Techniques to Help Quality Function Deployment (QFD). Benchmarking Int. J. 2000, 7, 8–20. [Google Scholar] [CrossRef]
  99. Lee, Y.C.; Sheu, L.C.; Tsou, Y.G. Quality Function Deployment Implementation based on Fuzzy Kano Model: An Application in PLM System. Comput. Ind. Eng. 2008, 55, 48–63. [Google Scholar] [CrossRef]
  100. Ji, P.; Jin, J.; Wang, T.; Chen, Y. Quantification and Integration of Kano’s Model into QFD for Optimising Product Design. Int. J. Prod. Res. 2014, 52, 6335–6348. [Google Scholar] [CrossRef]
  101. He, L.; Wu, Z.; Xiang, W.; Goh, M.; Xu, Z.; Song, W.; Wu, X. A Novel Kano-QFD-DEMATEL Approach to Optimise the Risk Resilience Solution for Sustainable Supply Chain. Int. J. Prod. Res. 2021, 59, 1714–1735. [Google Scholar] [CrossRef]
  102. He, L.; Song, W.; Wu, Z.; Xu, Z.; Zheng, M.; Ming, X. Quantification and Integration of an Improved Kano Model into QFD Based on Multi-Population Adaptive Genetic Algorithm. Comput. Ind. Eng. 2017, 114, 183–194. [Google Scholar] [CrossRef]
  103. Bolar, A.A.; Tesfamariam, S.; Sadiq, R. Framework for Prioritizing Infrastructure User Expectations Using Quality Function Deployment (QFD). Int. J. Sustain. Built Environ. 2017, 6, 16–29. [Google Scholar] [CrossRef]
  104. Fung, R.Y.; Chen, Y.; Tang, J. Estimating the Functional Relationships for Quality Function Deployment under Uncertainties. Fuzzy Sets Syst. 2006, 157, 98–120. [Google Scholar] [CrossRef]
  105. Chin, K.S.; Wang, Y.M.; Yang, J.B.; Poon, K.K.G. An Evidential Reasoning based Approach for Quality Function Deployment under Uncertainty. Expert Syst. Appl. 2009, 36, 5684–5694. [Google Scholar] [CrossRef]
  106. Wang, L.; Yu, L.; Ni, Z. A Novel IVIF QFD Considering Both the Correlations of Customer Requirements and the Ranking Uncertainty of Technical Attributes. Soft Comput. 2022, 26, 4199–4213. [Google Scholar] [CrossRef]
  107. Keshavarz Ghorabaee, M.; Zavadskas, E.K.; Olfat, L.; Turskis, Z. Multi-Criteria Inventory Classification Using a New Method of Evaluation Based on Distance from Average Solution (EDAS). Informatica 2015, 26, 435–451. [Google Scholar] [CrossRef]
  108. Zhang, S.; Gao, H.; Wei, G.; Wei, Y.; Wei, C. Evaluation based on Distance from Average Solution Method for Multiple Criteria Group Decision Making under Picture 2-tuple Linguistic Environment. Mathematics 2019, 7, 243. [Google Scholar] [CrossRef]
  109. Ecer, F. Third-Party Logistics (3PLs) Provider Selection via Fuzzy AHP and EDAS Integrated Model. Technol. Econ. Dev. Econ. 2018, 24, 615–634. [Google Scholar] [CrossRef]
  110. U-Dominic, C.M.; Orji, I.J.; Okwu, M. Analyzing the Barriers to Reverse Logistics (RL) Implementation: A Hybrid Model based on IF-DEMATEL-EDAS. Sustainability 2021, 13, 10876. [Google Scholar] [CrossRef]
  111. Asante, D.; He, Z.; Adjei, N.O.; Asante, B. Exploring the Barriers to Renewable Energy Adoption Utilising MULTIMOORA-EDAS Method. Energy Policy 2020, 142, 111479. [Google Scholar] [CrossRef]
  112. Schitea, D.; Deveci, M.; Iordache, M.; Bilgili, K.; Akyurt, I.Z.; Iordache, I. Hydrogen Mobility Roll-Up Site Selection Using Intuitionistic Fuzzy Sets Based WASPAS, COPRAS and EDAS. Int. J. Hydrogen Energy 2019, 44, 8585–8600. [Google Scholar] [CrossRef]
  113. Akram, M.; Ramzan, N.; Deveci, M. Linguistic Pythagorean Fuzzy CRITIC-EDAS method for Multiple-Attribute Group Decision Analysis. Eng. Appl. Artif. Intell. 2023, 119, 105777. [Google Scholar] [CrossRef]
  114. Zhan, J.; Jiang, H.; Yao, Y. Covering-based Variable Precision Fuzzy Rough Sets with PROMETHEE-EDAS methods. Inf. Sci. 2020, 538, 314–336. [Google Scholar] [CrossRef]
  115. Torkayesh, A.E.; Deveci, M.; Karagoz, S.; Antucheviciene, J. A State-of-the-Art Survey of Evaluation Based on Distance from Average Solution (EDAS): Developments and Applications. Expert Syst. Appl. 2023, 221, 119724. [Google Scholar] [CrossRef]
  116. Batool, A.; Toyama, K.; Veinot, T.; Fatima, B.; Naseem, M. Detecting data falsification by front-line development workers: A Case Study of Vaccination in Pakistan. In Proceedings of the 2021 CHI Conference on Human Factors in Computing Systems, Yokohama, Japan, 8–13 May 2021. [Google Scholar]
  117. Ekmen-Özçelik, S.; Gedik-Balay, İ. Gender of Top Manager and Firm Innovation Performance. Int. J. Econ. Bus. Res. 2022, 24, 116–144. [Google Scholar] [CrossRef]
  118. Kahraman, C.; Keshavarz Ghorabaee, M.; Zavadskas, E.K.; Cevik Onar, S.; Yazdani, M.; Oztaysi, B. Intuitionistic Fuzzy EDAS Method: An Application to Solid Waste Disposal Site Selection. J. Environ. Eng. Landsc. Manag. 2017, 25, 1–12. [Google Scholar] [CrossRef]
  119. Yanmaz, O.; Turgut, Y.; Can, E.N.; Kahraman, C. Interval-Valued Pythagorean Fuzzy EDAS Method: An Application to Car Selection Problem. J. Intell. Fuzzy Syst. 2020, 38, 4061–4077. [Google Scholar] [CrossRef]
  120. Ghorabaee, M.K.; Amiri, M.; Zavadskas, E.K.; Turskis, Z. Multi-Criteria Group Decision-Making Using an Extended EDAS Method with Interval Type-2 Fuzzy Sets. Econ. Manag. 2017, 10, 48–68. [Google Scholar] [CrossRef]
  121. Ghorabaee, M.K.; Amiri, M.; Zavadskas, E.K.; Turskis, Z.; Antucheviciene, J. A New Multi-Criteria Model Based on Interval Type-2 Fuzzy Sets and EDAS Method for Supplier Evaluation and Order Allocation with Environmental Considerations. Comput. Ind. Eng. 2017, 112, 156–174. [Google Scholar] [CrossRef]
  122. Demircan, M.L.; Tunc, S. A Proposed Service Level Improvement Methodology for Public Transportation Using Interval Type-2 Fuzzy EDAS Based on Customer Satisfaction Data. In Intelligent and Fuzzy Techniques in Big Data Analytics and Decision Making: Proceedings of the INFUS 2019 Conference, Istanbul, Turkey, 23–25 July 2019; Springer International Publishing: Cham, Switzerland, 2020. [Google Scholar]
  123. Jin, T.; Geng, X. Multi-attribute Decision Making Method based on Interval Type-2 Fuzzy EDAS. J. Ind. Eng. 2023, 26, 91. [Google Scholar]
  124. Tang, J.; Fung, R.Y.; Xu, B.; Wang, D. A New Approach to Quality Function Deployment Planning with Financial Consideration. Comput. Oper. Res. 2002, 29, 1447–1463. [Google Scholar] [CrossRef]
  125. Saaty, T.L. The Analytic Hierarchy Process; McGraw-Hill: New York, NY, USA, 1980. [Google Scholar]
Figure 2. PLM functional model.
Applsci 15 05025 g002
Figure 3. NPD evaluation model.
Applsci 15 05025 g003
Figure 4. Membership function of an IT2TrFN.
Applsci 15 05025 g004
Figure 5. IT2FQFD evaluation.
Applsci 15 05025 g005
Figure 6. NPD process evaluation results.
Applsci 15 05025 g006
Table 1. Methodological framework for NPD evaluation.
Methodological FrameworkReferences
New product development self-assessment[16]
Innovation scorecard[17]
Capability Maturity Model for Software (SW-CMM)[18]
Simultaneous Engineering Capability Model (SECM)[19]
Integrated Product Development Capability Maturity Model (IPD-CMM)[20]
SEAssessment[21]
Practical Approach to Concurrent Engineering (PACE) [22]
BEnchmarking and readiness Assessment for CONcurrent engineering in construction (BEACON) [23]
Simultaneous Engineering GAP ANalysis (SEGAPAN) [24]
MyWaste[25]
MyTime[25]
Product Innovation Management (PIM) scorecard [26]
New Product Introduction (NPI) self-assessment [27]
CLIMB [28]
Table 2. Linguistic variables and corresponding IT2TrFNs.
Linguistic VariablesIT2TrNs
Very low(0,0,0,0.1;1,1) (0,0,0,0.05;0.9,0.9)
Low(0,0.1,0.15,0.3;1,1) (0.05,0.1,0.15,0.2;0.9,0.9)
Medium low(0.1,0.3,0.35,0.5;1,1) (0.2,0.3,0.35,0.4;0.9,0.9)
Medium(0.3,0.5;0.55,0.7;1,1) (0.4,0.5,0.55,0.6;0.9,0.9)
Medium high(0.5,0.7,0.75,0.9;1,1) (0.6,0.7,0.75,0.8;0.9,0.9)
High(0.7,0.85,0.9,1;1,1) (0.8,0.85,0.9,0.95;0.9,0.9)
Very high(0.9,1,1,1;1,1) (0.95,1,1,1;0.9,0.9)
Table 3. Linguistic variables and corresponding IT2TrFNs utilized in the AHP process.
Linguistic VariablesIT2TrFNs
Absolutely Strong (AS)(7,8,9,9;1,1) (7.2,8.2,8.8,9;0.8,0.8)
Very Strong (VS)(5,6,8,9;1,1) (5.2,6.2,7.8,8.8;0.8,0.8)
Fairly Strong (FS)(3,4,6,7;1,1) (3.2,4.2,5.8,6.8;0.8,0.8)
Slightly Strong (SS)(1,2,4,5;1,1) (1.2,2.2,3.8,4.8;0.8,0.8)
Exactly Equal (EE)(1,1,1,1;1,1) (1,1,1,1;1,1)
Table 4. The application of QFD principles in various engineering issues.
Application AreaReferences
Linking LAs and LEs to identify sustainable LEs that can be effectively applied increase the leanness of food industry supply chains.[77]
Determining sustainable strategies to improve the efficiency and effectiveness of logistics processes.[78]
Development of an integrated decision support system to facilitate technology adoption in the transport/mobility division within the context of Industry 4.0, combining QFD, BWM, and S-CoCoSo methods.[79]
Optimizing the FMEA method in analyzing the relationship between failure modes and their causes; additionally, the model introduces a novel perspective for analyzing correlative variables as linguistic terms using a Bayesian network.[80]
Developing a cohesive decision-making model that combines DEMATEL, QFD, and COPRAS for supplier selection, considering multiple requirements and criteria pertaining to environmental performance. This model evaluates the correlation between supplier selection criteria and customer needs.[81]
Establishing a relationship between competitive factors and decision categories in production, encompassing both structural and infrastructural aspects across different stages of devising a production strategy.[82]
Prioritization of critical success factors in the ERP implementation, emphasizing the drivers of organizational agility.[83]
Product identity form design based on shape grammar and Kansei engineering (integrating Midjourney and Grey-AHP-QFD)[84]
Analytic Hierarchy Process: AHP; Best–Worst Method: BWM; COmbined COmpromise SOlution: CoCoSo; COmplex PRoportional Assessment: COPRAS; DEcision-MAking Trial and Evaluation Laboratory: DEMATEL; Enterprise Resource Planning: ERP; Failure Mode and Effect Analysis: FMEA; Lean Attributes: LAs; Lean Enablers: LEs.
Table 5. Overview of methodological improvements to the conventional QFD approach.
Improvement DomainsUsed ConceptReferences
Enhanced modeling of the vagueness and ambiguities inherent in the QFD process using uncertainty theories.Picture fuzzy[85]
HFLTS[86]
Q-ROF[87]
Linguistic distribution assessment[88]
IVIF[89]
IVPF[90]
IT2F[80]
DHHLTS[91]
Spherical fuzzy sets[92]
A more systematic assessment of the relationship between requirement attributes and quality attributes; the derivation of accurate and objective quality attributes’ relative priorities.TODIM[88]
C-MULTIMOORA[93]
EDAS[94]
ORESTE[95]
CoCoSo[92]
Systematic and objective prioritization of the relative importance of requirements’ attributes.BWM[92]
AHP[96]
ANP[97]
DEMATEL[92]
Creating the intelligent system effect to address some of the weaknesses inherent to the QFD approach (ambiguity in VOC, ill-defined strength of relationship, complex and large HoQ, etc.).Artificial neural networks
Fuzzy logic
Taguchi
[98]
Enhanced classification of customer demand attributes; improved subjective language scales in Kano’s two-dimensional attributes.Fuzzy Kano[99]
Examining the nature of customer demands and enhancing their classification; incorporating the results into the QFD analytic process using optimization methods.Kano and nonlinear integer programming model[100]
Kano, DEMATEL, and nonlinear programming[101]
Kano and MPAGA[102]
Evaluating user expectations by using the probabilities of focal areas that are of interest to the user, based on sustainability parameters, as hidden factors.Hidden Markov model[103]
Assessment of functional relationships under uncertainty.Asymmetric fuzzy linear regression[104]
The synthesis of different types of information generated during the QFD analytic process; enhanced accuracy in prioritizing design requirements.Evidential Reasoning[105]
Reflecting on individuals’ attitudes toward risk; analyzing the correlation between customer demands; determining the relative weights of quality attributes by maximizing the utility of the development team and minimizing team discord.IVIF sets, continuous ordered weighted averaging aggregation operator, K-additive measures, Choquet integral and mixed-integer programming[106]
Analytic Hierarchy Process: AHP; Analytic Network Process: ANP; Best–Worst Method: BWM; Cloud Multi-Objective Optimization by Ratio Analysis plus the full MULTIplicative form: C-MULTIMOORA; COmbined COmpromise SOlution: CoCoSo; DEcision-MAking Trial and Evaluation Laboratory: DEMATEL; Double-Hierarchy Hesitant Linguistic Term Sets: DHHLTS; Evaluation based on Distance from Average Solution: EDAS; Hesitant Fuzzy Linguistic Term Set: HFLTS; Interval Type-2 Fuzzy: IT2F; interval-valued intuitionistic fuzzy: IVIF; interval-valued Pythagorean fuzzy: IVPF; Multi-Population Adaptive Genetic Algorithm: MPAGA; Organísation, rangement et Synthèse de données relationnelles: ORESTE; q-rung orthopair fuzzy: Q-ROF; TOmada de Decisão Interativa e Multicritério: TODIM; voice of customer: VOC.
Table 6. The results of the NPD objectives prioritization.
NPD ObjectiveIT2F NPD Objectives Geometric Means ( r ~ ~ y )IT2F NPD Objectives Weight ( w ~ ~ j )Non-Fuzzy
Weights ( w j )
NPD_Obj1Reduced development cycle(0.45,0.48,0.56,0.64;1.1)
(0.45,0.48,0.55,0.62;0.8,0.8)
(0.113,0.104,0.1,0.104;1.1)
(0.111,0.103,0.1,0.103;0.8,0.8)
0.1052
NPD_Obj2Higher-quality products(2.22,2.6,3.19,3.43;1.1)
(2.3,2.67,3.13,3.38;0.8,0.8)
(0.556,0.569,0.572,0.556;1.1)
(0.559,0.571,0.572,0.56;0.8,0.8)
0.5652
NPD_Obj3Reduced expenses(0.6,0.67,0.78,0.84;1.1)
(0.62,0.68,0.76,0.82;0.8,0.8)
(0.151,0.146,0.139,0.136;1.1)
(0.15,0.145,0.14,0.137;0.8,0.8)
0.1430
NPD_Obj4Elevated degree of innovation(0.72,0.82,1.06,1.26;1.1)
(0.74,0.84,1.03,1.21;0.8,0.8)
(0.181,0.18,0.189,0.204;1.1)
(0.18,0.18,0.188,0.2;0.8,0.8)
0.1884
Table 7. IT2F relation matrix.
NPD PracticeNPD_Obj1NPD_Obj2NPD_Obj3NPD_Obj_4
P_1.1(0.83,0.95,0.97,1;1,1) (0.9,0.95,0.97,0.98;0.9,0.9)(0.83,0.95,0.97,1;1,1)
(0.9,0.95,0.97,0.98;0.9,0.9)
(0.7,0.85,0.9,1;1,1)
(0.8,0.85,0.9,0.95;0.9,0.9)
(0.57,0.75,0.8,0.93;1,1)
(0.67,0.75,0.8,0.85;0.9,0.9)
P_2.1(0.63,0.8,0.85,0.97;1,1)
(0.73,0.8,0.85,0.9;0.9,0.9)
(0.23,0.43,0.48,0.63;1,1)
(0.33,0.43,0.48,0.53;0.9,0.9)
(0.63,0.8,0.85,0.97;1,1)
(0.73,0.8,0.85,0.9;0.9,0.9)
(0.07,0.23,0.28,0.43;1,1)
(0.15,0.23,0.28,0.33;0.9,0.9)
P_3.1(0.43,0.63,0.68,0.83;1,1)
(0.53,0.63,0.68,0.73;0.9,0.9)
(0.57,0.75,0.8,0.93;1,1)
(0.67,0.75,0.8,0.85;0.9,0.9)
(0.3,0.5,0.55,0.7;1,1)
(0.4,0.5,0.55,0.6;0.9,0.9)
(0.43,0.62,0.67,0.8;1,1)
(0.53,0.62,0.67,0.72;0.9,0.9)
P_3.2(0.3,0.5,0.55,0.7;1,1)
(0.4,0.5,0.55,0.6;0.9,0.9)
(0.7,0.85,0.9,1;1,1)
(0.8,0.85,0.9,0.95;0.9,0.9)
(0.23,0.43,0.48,0.63;1,1)
(0.33,0.43,0.48,0.53;0.9,0.9)
(0.63,0.8,0.85,0.97;1,1)
(0.73,0.8,0.85,0.9;0.9,0.9)
P_4.1(0.3,0.5,0.55,0.7;1,1)
(0.4,0.5,0.55,0.6;0.9,0.9)
(0.5,0.7,0.75,0.9;1,1)
(0.6,0.7,0.75,0.8;0.9,0.9)
(0.5,0.7,0.75,0.9;1,1)
(0.6,0.7,0.75,0.8;0.9,0.9)
(0.07,0.23,0.28,0.43;1,1)
(0.15,0.23,0.28,0.33;0.9,0.9)
P_4.2(0.5,0.7,0.75,0.9;1,1)
(0.6,0.7,0.75,0.8;0.9,0.9)
(0.7,0.85,0.9,1;1,1)
(0.8,0.85,0.9,0.95;0.9,0.9)
(0.37,0.57,0.62,0.77;1,1)
(0.47,0.57,0.62,0.67;0.9,0.9)
(0.5,0.7,0.75,0.9;1,1)
(0.6,0.7,0.75,0.8;0.9,0.9)
P_4.3(0.23,0.43,0.48,0.63;1,1)
(0.33,0.43,0.48,0.53;0.9,0.9)
(0.43,0.63,0.68,0.83;1,1)
(0.53,0.63,0.68,0.73;0.9,0.9)
(0.23,0.43,0.48,0.63;1,1)
(0.33,0.43,0.48,0.53;0.9,0.9)
(0.07,0.23,0.28,0.43;1,1)
(0.15,0.23,0.28,0.33;0.9,0.9)
P_5.1(0.7,0.85,0.9,1;1,1)
(0.8,0.85,0.9,0.95;0.9,0.9)
(0.7,0.85,0.9,1;1,1)
(0.8,0.85,0.9,0.95;0.9,0.9)
(0.43,0.63,0.68,0.83;1,1)
(0.53,0.63,0.68,0.73;0.9,0.9)
(0.43,0.63,0.68,0.83;1,1)
(0.53,0.63,0.68,0.73;0.9,0.9)
P_5.2(0.23,0.43,0.48,0.63;1,1)
(0.33,0.43,0.48,0.53;0.9,0.9)
(0.3,0.5,0.55,0.7;1,1)
(0.4,0.5,0.55,0.6;0.9,0.9)
(0.43,0.63,0.68,0.83;1,1)
(0.53,0.63,0.68,0.73;0.9,0.9)
(0.37,0.57,0.62,0.77;1,1)
(0.47,0.57,0.62,0.67;0.9,0.9)
P_6.1(0.63,0.8,0.85,0.97;1,1)
(0.73,0.8,0.85,0.9;0.9,0.9)
(0.63,0.8,0.85,0.97;1,1)
(0.73,0.8,0.85,0.9;0.9,0.9)
(0.5,0.68,0.73,0.87;1,1)
(0.6,0.68,0.73,0.78;0.9,0.9)
(0.37,0.57,0.62,0.77;1,1)
(0.47,0.57,0.62,0.67;0.9,0.9)
P_6.2(0.57,0.75,0.8,0.93;1,1)
(0.67,0.75,0.8,0.85;0.9,0.9)
(0.57,0.73,0.78,0.9;1,1)
(0.67,0.73,0.78,0.83;0.9,0.9)
(0.63,0.78,0.82,0.9;1,1)
(0.72,0.78,0.82,0.85;0.9,0.9)
(0.5,0.7,0.75,0.9;1,1)
(0.6,0.7,0.75,0.8;0.9,0.9)
P_7.1(0.17,0.37,0.42,0.57;1,1)
(0.27,0.37,0.42,0.47;0.9,0.9)
(0.23,0.43,0.48,0.63;1,1)
(0.33,0.43,0.48,0.53;0.9,0.9)
(0.57,0.75,0.8,0.93;1,1)
(0.67,0.75,0.8,0.85;0.9,0.9)
(0.13,0.3,0.35,0.5;1,1)
(0.22,0.3,0.35,0.4;0.9,0.9)
P_8.1(0.23,0.43,0.48,0.63;1,1)
(0.33,0.43,0.48,0.53;0.9,0.9)
(0.3,0.5,0.55,0.7;1,1)
(0.4,0.5,0.55,0.6;0.9,0.9)
(0.37,0.57,0.62,0.77;1,1)
(0.47,0.57,0.62,0.67;0.9,0.9)
(0.23,0.43,0.48,0.63;1,1)
(0.33,0.43,0.48,0.53;0.9,0.9)
P_8.2(0.43,0.63,0.68,0.83;1,1)
(0.53,0.63,0.68,0.73;0.9,0.9)
(0.77,0.9,0.93,1;1,1)
(0.85,0.9,0.93,0.97;0.9,0.9)
(0.57,0.75,0.8,0.93;1,1)
(0.67,0.75,0.8,0.85;0.9,0.9)
(0.5,0.7,0.75,0.9;1,1)
(0.6,0.7,0.75,0.8;0.9,0.9)
P_9.1(0.77,0.9,0.93;1,1),1
(0.85,0.9,0.93,0.97;0.9,0.9)
(0.7,0.85,0.88,0.97;1,1)
(0.78,0.85,0.88,0.92;0.9,0.9)
(0.77,0.9,0.93,1;1,1)
(0.85,0.9,0.93,0.97;0.9,0.9)
(0.5,0.68,0.73,0.87;1,1)
(0.6,0.68,0.73,0.78;0.9,0.9)
P_9.2(0.5,0.7,0.75,0.9;1,1)
(0.6,0.7,0.75,0.8;0.9,0.9)
(0.7,0.85,0.9,1;1,1)
(0.8,0.85,0.9,0.95;0.9,0.9)
(0.63,0.8,0.85,0.97;1,1)
(0.73,0.8,0.85,0.9;0.9,0.9)
(0.23,0.43,0.48,0.63;1,1)
(0.33,0.43,0.48,0.53;0.9,0.9)
P_10.1(0.5,0.7,0.75,0.9;1,1)
(0.6,0.7,0.75,0.8;0.9,0.9)
(0.9,1,1,1;1,1)
(0.95,1,1,1;0.9,0.9)
(0.77,0.9,0.93,1;1,1)
(0.85,0.9,0.93,0.97;0.9,0.9)
(0.5,0.7,0.75,0.9;1,1)
(0.6,0.7,0.75,0.8;0.9,0.9)
P_10.2(0.9,1,1,1;1,1)
(0.95,1,1,1;0.9,0.9)
(0.7,0.85,0.9,1;1,1)
(0.8,0.85,0.9,0.95;0.9,0.9)
(0.63,0.8,0.85,0.97;1,1)
(0.73,0.8,0.85,0.9;0.9,0.9)
(0.3,0.5,0.55,0.7;1,1)
(0.4,0.5,0.55,0.6;0.9,0.9)
P_11.1(0.43,0.63,0.68,0.83;1,1)
(0.53,0.63,0.68,0.73;0.9,0.9)
(0.83,0.95,0.97,1;1,1)
(0.9,0.95,0.97,0.98;0.9,0.9)
(0.7,0.85,0.9,1;1,1)
(0.8,0.85,0.9,0.95;0.9,0.9)
(0.3,0.5,0.55,0.7;1,1)
(0.4,0.5,0.55,0.6;0.9,0.9)
P_13.1(0.3,0.5,0.55,0.7;1,1)
(0.4,0.5,0.55,0.6;0.9,0.9)
(0.57,0.73,0.78,0.9,1,1
(0.67,0.73,0.78,0.83;0.9,0.9)
(0.23,0.43,0.48,0.63;1,1)
(0.33,0.43,0.48,0.53;0.9,0.9)
(0.3,0.5,0.55,0.7;1,1)
(0.4,0.5,0.55,0.6;0.9,0.9)
P_14.1(0.37,0.57,0.62,0.77;1,1)
(0.47,0.57,0.62,0.67;0.9,0.9)
(0.9,1,1,1;1,1)
(0.95,1,1,1;0.9,0.9)
(0.5,0.7,0.75,0.9;1,1)
(0.6,0.7,0.75,0.8;0.9,0.9)
(0.17,0.37,0.42,0.57;1,1)
(0.27,0.37,0.42,0.47;0.9,0.9)
P_15.1(0.5,0.7,0.75,0.9;1,1)
(0.6,0.7,0.75,0.8;0.9,0.9)
(0.77,0.9,0.92,0.97;1,1)
(0.83,0.9,0.92,0.93;0.9,0.9)
(0.43,0.63,0.68,0.83;1,1)
(0.53,0.63,0.68,0.73;0.9,0.9)
(0.5,0.7,0.75,0.9;1,1)
(0.6,0.7,0.75,0.8;0.9,0.9)
P_16.1(0.9,1,1,1;1,1)
(0.95,1,1,1;0.9,0.9)
(0.63,0.8,0.85,0.97;1,1)
(0.73,0.8,0.85,0.9;0.9,0.9)
(0.77,0.9,0.93,1;1,1)
(0.85,0.9,0.93,0.97;0.9,0.9)
(0.17,0.37,0.42,0.57;1,1)
(0.27,0.37,0.42,0.47;0.9,0.9)
Table 8. IT2F average matrix.
NPD ObjectiveAverage Solution ( v ~ ~ i )
NPD_Obj1Reduced development cycle(0.4942,0.6732,0.7167,0.8391;1,1)
(0.5877,0.6732,0.7167,0.7601;0.9,0.9)
NPD_Obj2Higher-quality products(0.6159,0.7746,0.8145,0.9130;1,1)
(0.7058,0.7746,0.8145,0.8543;0.9,0.9)
NPD_Obj3Reduced expenses(0.5174,0.6957,0.7428,0.8681;1,1)
(0.6145,0.6957,0.7428,0.7899;0.9,0.9)
NPD_Obj4Elevated degree of innovation(0.3406,0.5312,0.5812,0.7275;1,1)
(0.4377,0.5312,0.5812,0.6312;0.9,0.9)
Table 9. The weighted sum of distances, and the appraisal scores (NPD practice relative importance).
NPD Practice s p ~ ~ j s n ~ ~ j NPD   Practice   Relative   Importance   y ~ ~ j Non - Fuzzy   y j
P_1.1(0.322,0.272,0.253,0.188;1,1)
(0.303,0.272,0.253,0.236;0.8,0.8)
(0,0,0,0;1,1)
(0,0,0,0;0.8,0.8)
(1.114,1.019,0.982,0.857;1,1)
(1.076,1.018,0.982,0.949;0.8,0.8)
0.9995
P_2.1(0.047,0.041,0.04,0.038;1,1)
(0.049,0.04,0.04,0.042;0.8,0.8)
(0.36,0.345,0.343,0.307;1,1)
(0.359,0.345,0.343,0.337;0.8,0.8)
(0.099,0.107,0.108,0.153;1,1)
(0.102,0.105,0.109,0.12;0.8,0.8)
0.1146
P_3.1(0.031,0.028,0.03,0.027;1,1)
(0.031,0.028,0.029,0.031;0.8,0.8)
(0.004,−0.01,−0.019,−0.041;1,1)
(−0.004,−0.01,−0.019,−0.028;0.8,0.8)
(0.552,0.567,0.582,0.608;1,1)
(0.565,0.567,0.581,0.598;0.8,0.8)
0.5781
P_3.2(0.156,0.143,0.155,0.150;1,1)
(0.164,0.143,0.154,0.166;0.8,0.8)
(0.092,0.08,0.075,0.066;1,1)
(0.09,0.08,0.075,0.073;0.8,0.8)
(0.671,0.662,0.693,0.697;1,1)
(0.69,0.664,0.691,0.717;0.8,0.8)
0.6853
P_4.1(−0.004,0.001,0.001,0.006;1,1)
(−0.003,0.001,0.001,0.002;0.8,0.8)
(0.204,0.178,0.174,0.140;1,1)
(0.20,0.178,0.173,0.171;0.8,0.8)
(0.215,0.259,0.265,0.321;1,1)
(0.221,0.259,0.266,0.27;0.8,0.8)
0.2587
P_4.2(0.113,0.114,0.125,0.135;1,1)
(0.122,0.114,0.125,0.136;0.8,0.8)
(0.032,0.027,0.025,0.019;1,1)
(0.031,0.026,0.025,0.024;0.8,0.8)
(0.671,0.681,0.705,0.73;1,1)
(0.69,0.681,0.704,0.726;0.8,0.8)
0.1062
P_4.3(0,0,0,0;1,1)
(0,0,0,0;0.8,0.8)
(0.322,0.29,0.283,0.242;1,1)
(0.317,0.29,0.282,0.278;0.8,0.8)
(0.06,0.104,0.114,0.17;1,1)
(0.067,0.104,0.115,0.121;0.8,0.8)
0.1062
P_5.1(0.124,0.115,0.124,0.125;1,1)
(0.133,0.115,0.124,0.134;0.8,0.8)
(0.018,0.013,0.012,0.007;1,1)
(0.017,0.013,0.012,0.011;0.8,0.8)
(0.711,0.701,0.721,0.729;1,1)
(0.729,0.701,0.72,0.74;0.8,0.8)
0.7187
P_5.2(0.009,0.012,0.012,0.015;1,1)
(0.01,0.012,0.012,0.013;0.8,0.8)
(0.284,0.248,0.238,0.188;1,1)
(0.275,0.248,0.238,0.226;0.8,0.8)
(0.129,0.184,0.199,0.271;1,1)
(0.142,0.184,0.198,0.216;0.8,0.8)
0.1902
P_6.1(0.044,0.049,0.058,0.072;1,1)
(0.053,0.049,0.057,0.066;0.8,0.8)
(0.004,0.003,0.002,0;1,1)
(0.003,0.003,0.002,0.001;0.8,0.8)
(0.578,0.59,0.607,0.636;1,1)
(0.596,0.59,0.607,0.625;0.8,0.8)
0.6044
P_6.2(0.089,0.085,0.085,0.085;1,1)
(0.088,0.085,0.084,0.087;0.8,0.8)
(0.035,0.03,0.023,0.009;1,1)
(0.028,0.03,0.023,0.015;0.8,0.8)
(0.622,0.621,0.631,0.648;1,1)
(0.629,0.621,0.63,0.644;0.8,0.8)
0.6315
P_7.1(0.01,0.011,0.011,0.012;1,1)
(0.011,0.011,0.011,0.012;0.8,0.8)
(0.392,0.369,0.364,0.324;1,1)
(0.389,0.37,0.364,0.357;0.8,0.8)
(−0.015,0.017,0.024,0.082;1,1)
(−0.01,0.017,0.025,0.035;0.8,0.8)
0.0221
P_8.1(0,0,0,0;1,1)
(0,0,0,0;0.8,0.8)
(0.333,0.294,0.284,0.236;1,1)
(0.324,0.294,0.285,0.274;0.8,0.8)
(0.045,0.099,0.112,0.178;1,1)
(0.058,0.099,0.112,0.125;0.8,0.8)
0.1030
P_8.2(0.169,0.157,0.156,0.138;1,1)
(0.167,0.158,0.155,0.153;0.8,0.8)
(0.01,0.006,0.005,0.001;1,1)
(0.009,0.006,0.005,0.004;0.8,0.8)
(0.809,0.791,0.79,0.762;1,1)
(0.806,0.792,0.789,0.786;0.8,0.8)
0.7906
P_9.1(0.209,0.181,0.171,0.139;1,1)
(0.20,0.181,0.171,0.165;0.8,0.8)
(0,0,0,0;1,1)
(0,0,0,0;0.8,0.8)
(0.899,0.844,0.826,0.765;1,1)
(0.881,0.844,0.826,0.814;0.8,0.8)
0.8380
P_9.2(0.085,0.08,0.088,0.089;1,1)
(0.094,0.08,0.088,0.095;0.8,0.8)
(0.035,0.032,0.034,0.035;1,1)
(0.034,0.032,0.033,0.036;0.8,0.8)
(0.613,0.609,0.621,0.622;1,1)
(0.632,0.609,0.622,0.633;0.8,0.8)
0.6193
P_10.1(0.307,0.265,0.235,0.160;1,1)
(0.278,0.265,0.235,0.205;0.8,0.8)
(0,0,0,0;1,1)
(0,0,0,0;0.8,0.8)
(1.084,1.004,0.948,0.805;1,1)
(1.03,1.004,0.947,0.891;0.8,0.8)
0.9619
P_10.2(0.151,0.126,0.124,0.105;1,1)
(0.15,0.125,0.125,0.125;0.8,0.8)
(0.013,0.01,0.011,0.010;1,1)
(0.012,0.01,0.011,0.011;0.8,0.8)
(0.769,0.725,0.722,0.685;1,1)
(0.769,0.724,0.723,0.723;0.8,0.8)
0.7320
P_11.1(0.192,0.159,0.141,0.087;1,1)
(0.177,0.159,0.142,0.123;0.8,0.8)
(0.023,0.016,0.016,0.011;1,1)
(0.021,0.016,0.016,0.015;0.8,0.8)
(0.834,0.78,0.748,0.65;1,1)
(0.808,0.78,0.748,0.712;0.8,0.8)
0.7562
P_13.1(0,0,0,0;1,1)
(0,0,0,0;0.8,0.8)
(0.14,0.12,0.108,0.085;1,1)
(0.13,0.12,0.109,0.10;0.8,0.8)
(0.308,0.336,0.352,0.384;1,1)
(0.323,0.336,0.352,0.364;0.8,0.8)
0.3445
P_14.1(0.197,0.164,0.136,0.067;1,1)
(0.17,0.164,0.136,0.106;0.8,0.8)
(0.078,0.07,0.071,0.071;1,1)
(0.076,0.07,0.071,0.074;0.8,0.8)
(0.768,0.716,0.662,0.532;1,1)
(0.721,0.717,0.663,0.6;0.8,0.8)
0.6694
P_15.1(0.16,0.15,0.137,0.111;1,1)
(0.146,0.15,0.137,0.124;0.8,0.8)
(0.018,0.013,0.012,0.007;1,1)
(0.017,0.013,0.012,0.011;0.8,0.8)
(0.78,0.769,0.746,0.703;1,1)
(0.754,0.769,0.745,0.721;0.8,0.8)
0.7471
P_16.1(0.132,0.11,0.104,0.087;1,1)
(0.128,0.109,0.105,0.102;0.8,0.8)
(0.057,0.054,0.057,0.060;1,1)
(0.056,0.054,0.056,0.06;0.8,0.8)
(0.673,0.636,0.621,0.585;1,1)
(0.666,0.634,0.622,0.613;0.8,0.8)
0.6320
Table 10. Enhancement potential and priorities.
NPD PracticeEnhancement PotentialNPD Practice Relative Importance Enhancement PrioritiesNon-Fuzzy
P_1.1(0.8,0.7,0.65,0.5;1,1)
(0.7,0.7,0.65,0.6;0.9,0.9)
(1.114,1.019,0.982,0.857;1,1)
(1.076,1.018,0.982,0.949;0.8,0.8)
(0.891,0.713,0.638,0.429;1,1)
(0.753,0.713,0.638,0.569;0.8,0.8)
0.6666
P_2.1(0.2,0.15,0.1,0.0;1,1)
(0.1,0.15,0.1,0.05;0.9,0.9)
(0.099,0.107,0.108,0.153;1,1)
(0.102,0.105,0.109,0.12;0.8,0.8)
(0.02,0.016,0.011,0;1,1)
(0.01,0.016,0.011,0.006;0.8,0.8)
0.0109
P_3.1(0.4,0.3,0.25,0.1;1,1)
(0.3,0.3,0.25,0.2;0.9,0.9)
(0.552,0.567,0.582,0.608;1,1)
(0.565,0.567,0.581,0.598;0.8,0.8)
(0.221,0.17,0.146,0.061;1,1)
(0.169,0.17,0.145,0.120;0.8,0.8)
0.1487
P_3.2(0.6,0.5,0.45,0.3;1,1)
(0.5,0.5,0.45,0.4;0.9,0.9)
(0.671,0.662,0.693,0.697;1,1)
(0.69,0.664,0.691,0.717;0.8,0.8)
(0.402,0.331,0.312,0.209;1,1)
(0.345,0.332,0.311,0.287;0.8,0.8)
0.3148
P_4.1(0.4,0.3,0.25,0.1;1,1)
(0.3,0.3,0.25,0.2;0.9,0.9)
(0.215,0.259,0.265,0.321;1,1)
(0.221,0.259,0.266,0.27;0.8,0.8)
(0.086,0.078,0.066,0.032;1,1)
(0.066,0.078,0.067,0.054;0.8,0.8)
0.0648
P_4.2(0.6,0.5,0.45,0.3;1,1)
(0.5,0.5,0.45,0.4;0.9,0.9)
(0.671,0.681,0.705,0.73;1,1)
(0.69,0.681,0.704,0.726;0.8,0.8)
(0.403,0.34,0.317,0.219;1,1)
(0.345,0.341,0.317,0.290;0.8,0.8)
0.3199
P_4.3(0.9,0.9,0.85,0.7;1,1)
(0.85,0.9,0.85,0.8;0.9,0.9)
(0.06,0.104,0.114,0.17;1,1)
(0.067,0.104,0.115,0.121;0.8,0.8)
(0.054,0.093,0.097,0.119;1,1)
(0.057,0.094,0.098,0.096;0.8,0.8)
0.0865
P_5.1(0.8,0.7,0.65,0.5;1,1)
(0.7,0.7,0.65,0.6;0.9,0.9)
(0.711,0.701,0.721,0.729;1,1)
(0.729,0.701,0.72,0.74;0.8,0.8)
(0.569,0.491,0.468,0.365;1,1)
(0.51,0.491,0.468,0.444;0.8,0.8)
0.4749
P_5.2(0.9,0.9,0.85,0.7;1,1)
(0.85,0.9,0.85,0.8;0.9,0.9)
(0.129,0.184,0.199,0.271;1,1)
(0.142,0.184,0.198,0.216;0.8,0.8)
(0.116,0.165,0.169,0.189;1,1)
(0.121,0.165,0.168,0.173;0.8,0.8)
0.1559
P_6.1(0.4,0.3,0.25,0.1;1,1)
(0.3,0.3,0.25,0.2;0.9,0.9)
(0.578,0.59,0.607,0.636;1,1)
(0.596,0.59,0.607,0.625;0.8,0.8)
(0.231,0.177,0.152,0.064;1,1)
(0.179,0.177,0.152,0.125;0.8,0.8)
0.1555
P_6.2(0.8,0.7,0.65,0.5;1,1)
(0.7,0.7,0.65,0.6;0.9,0.9)
(0.622,0.621,0.631,0.648;1,1)
(0.629,0.621,0.63,0.644;0.8,0.8)
(0.498,0.435,0.41,0.324;1,1)
(0.44,0.435,0.409,0.387;0.8,0.8)
0.4161
P_7.1(0.6,0.5,0.45,0.3;1,1)
(0.5,0.5,0.45,0.4;0.9,0.9)
(−0.015,0.017,0.024,0.082;1,1)
(−0.01,0.017,0.025,0.035;0.8,0.8)
(−0.009,0.009,0.011,0.025;1,1)
(−0.005,0.008,0.011,0.014;0.8,0.8)
0.0074
P_8.1(0.8,0.7,0.65,0.5;1,1)
(0.7,0.7,0.65,0.6;0.9,0.9)
(0.045,0.099,0.112,0.178;1,1)
(0.058,0.099,0.112,0.125;0.8,0.8)
(0.036,0.069,0.073,0.089;1,1)
(0.041,0.069,0.072,0.075;0.8,0.8)
0.0641
P_8.2(0.6,0.5,0.45,0.3;1,1)
(0.5,0.5,0.45,0.4;0.9,0.9)
(0.809,0.791,0.79,0.762;1,1)
(0.806,0.792,0.789,0.786;0.8,0.8)
(0.485,0.396,0.355,0.229;1,1)
(0.403,0.396,0.355,0.314;0.8,0.8)
0.3648
P_9.1(0.6,0.5,0.45,0.3;1,1)
(0.5,0.5,0.45,0.4;0.9,0.9)
(0.899,0.844,0.826,0.765;1,1)
(0.881,0.844,0.826,0.814;0.8,0.8)
(0.539,0.422,0.372,0.230;1,1)
(0.441,0.422,0.372,0.325;0.8,0.8)
0.3890
P_9.2(0.8,0.7,0.65,0.5;1,1)
(0.7,0.7,0.65,0.6;0.9,0.9)
(0.613,0.609,0.621,0.622;1,1)
(0.632,0.609,0.622,0.633;0.8,0.8)
(0.491,0.426,0.404,0.311;1,1)
(0.442,0.426,0.404,0.380;0.8,0.8)
0.4095
P_10.1(0.8,0.7,0.65,0.5;1,1)
(0.7,0.7,0.65,0.6;0.9,0.9)
(1.084,1.004,0.948,0.805;1,1)
(1.03,1.004,0.947,0.891;0.8,0.8)
(0.867,0.703,0.616,0.402;1,1)
(0.721,0.703,0.616,0.534;0.8,0.8)
0.6426
P_10.2(0.6,0.5,0.45,0.3;1,1)
(0.5,0.5,0.45,0.4;0.9,0.9)
(0.769,0.725,0.722,0.685;1,1)
(0.769,0.724,0.723,0.723;0.8,0.8)
(0.461,0.363,0.325,0.206;1,1)
(0.385,0.362,0.325,0.289;0.8,0.8)
0.3385
P_11.1(0.6,0.5,0.45,0.3;1,1)
(0.5,0.5,0.45,0.4;0.9,0.9)
(0.834,0.78,0.748,0.65;1,1)
(0.808,0.78,0.748,0.712;0.8,0.8)
(0.5,0.39,0.336,0.195;1,1)
(0.404,0.39,0.337,0.285;0.8,0.8)
0.3530
P_13.1(0.8,0.7,0.65,0.5;1,1)
(0.7,0.7,0.65,0.6;0.9,0.9)
(0.308,0.336,0.352,0.384;1,1)
(0.323,0.336,0.352,0.364;0.8,0.8)
(0.247,0.235,0.229,0.192;1,1)
(0.226,0.235,0.229,0.218;0.8,0.8)
0.2252
P_14.1(0.8,0.7,0.65,0.5;1,1)
(0.7,0.7,0.65,0.6;0.9,0.9)
(0.768,0.716,0.662,0.532;1,1)
(0.721,0.717,0.663,0.6;0.8,0.8)
(0.614,0.501,0.43,0.266;1,1)
(0.505,0.502,0.431,0.360;0.8,0.8)
0.4485
P_15.1(0.6,0.5,0.45,0.3;1,1)
(0.5,0.5,0.45,0.4;0.9,0.9)
(0.78,0.769,0.746,0.703;1,1)
(0.754,0.769,0.745,0.721;0.8,0.8)
(0.468,0.384,0.336,0.211;1,1)
(0.377,0.385,0.335,0.288;0.8,0.8)
0.3458
P_16.1(0.4,0.3,0.25,0.1;1,1)
(0.3,0.3,0.25,0.2;0.9,0.9)
(0.673,0.636,0.621,0.585;1,1)
(0.666,0.634,0.622,0.613;0.8,0.8)
(0.269,0.191,0.155,0.058;1,1)
(0.2,0.19,0.156,0.123;0.8,0.8)
0.1667
Table 11. The weighted sum of distances and the appraisal scores (PLM functional aspects’ relative importance).
PLM Functional Aspects’ Practice s p ~ ~ j s n ~ ~ j PLM   Functional   Aspects   Relative   Importance   y ~ ~ j Non - Fuzzy   y j
Pr.Str.Mng(2.857,3.005,2.831,2.123;1,1)
(2.761,3.005,2.831,2.632;0.8,0.8)
(0.175,0.063,0.04,−0.004;1,1)
(0.105,0.063,0.04,0.022;0.8,0.8)
(0.7048,0.7646,0.7571,0.7063;1,1)
(0.7239,0.7646,0.757,0.7452;0.8,0.8)
0.92231
Pr.Conf.Mng(0.78,1.49,1.582,1.529;1,1)
(1.067,1.491,1.58,1.627;0.8,0.8)
(1.429,0.922,0.733,0.294;1,1)
(1.087,0.923,0.733,0.566;0.8,0.8)
(−0.0044,0.2697,0.3552,0.5284;1,1)
(0.1623,0.2697,0.355,0.4273;0.8,0.8)
0.29175
Desig.Rel.Chan.Mng(2.847,2.998,2.856,2.075;1,1)
(2.779,2.998,2.855,2.670;0.8,0.8)
(0.095,0.085,0.075,0.035;1,1)
(0.08,0.085,0.075,0.064;0.8,0.8)
(0.7362,0.7548,0.745,0.6861;1,1)
(0.7358,0.7548,0.745,0.7316;0.8,0.8)
0.73401
Class.Mng(1.317,1.212,1.094,0.632;1,1)
(1.156,1.211,1.094,0.967;0.8,0.8)
(0.542,0.393,0.336,0.194;1,1)
(0.429,0.393,0.336,0.283;0.8,0.8)
(0.4072,0.4575,0.4694,0.4824;1,1)
(0.4374,0.4574,0.4695,0.4784;0.8,0.8)
0.45608
Pr.Doc.Mng(1.647,1.737,1.582,1.024;1,1)
(1.548,1.736,1.583,1.409;0.8,0.8)
(0.726,0.563,0.513,0.333;1,1)
(0.612,0.563,0.513,0.462;0.8,0.8)
(0.3643,0.4394,0.4447,0.4640;1,1)
(0.4012,0.4392,0.4448,0.4486;0.8,0.8)
0.42754
Req.Mng(3.761,4.901,4.832,3.787;1,1)
(4.018,4.905,4.827,4.636;0.8,0.8)
(0.844,0.795,0.769,0.626;1,1)
(0.791,0.794,0.769,0.743;0.8,0.8
(0.5206,0.6507,0.6543,0.6114;1,1)
(0.5668,0.6511,0.6541,0.6462;0.8,0.8)
0.60914
Sys.Arch.Mng(3.362,3.402,3.159,2.341;1,1)
(3.128,3.403,3.158,2.899;0.8,0.8)
(0.239,0.234,0.221,0.163;1,1)
(0.226,0.234,0.221,0.205;0.8,0.8)
(0.7274,0.7333,0.7153,0.6597;1,1)
(0.7099,0.7333,0.7153,0.6968;0.8,0.8)
0.70973
Cross-dom.Pr.Desgn.Col(5.262,5.471,5.218,4.357;1,1)
(4.941,5.472,5.219,4.923;0.8,0.8)
(−0.004,0.003,0.004,0.009;1,1)
(−0.002,0.003,0.004,0.005;0.8,0.8)
(1.0091,1.0265,1.0018,0.9167;1,1)
(0.9775,1.0267,1.0018,0.9729;0.8,0.8)
0.98921
Sim.Proc.Dat.Mng(3.297,3.596,3.433,2.685;1,1)
(3.211,3.597,3.432,3.227;0.8,0.8)
(0.654,0.405,0.336,0.163;1,1)
(0.494,0.405,0.335,0.275;0.8,0.8)
(0.5528,0.6827,0.6952,0.6930;1,1)
(0.6094,0.6829,0.6951,0.6998;0.8,0.8)
0.65711
Dig.Manuf(1.383,1.511,1.444,1.146;1,1)
(1.365,1.511,1.444,1.363;0.8,0.8)
(0.167,0.165,0.165,0.144;1,1)
(0.16,0.165,0.165,0.162;0.8,0.8)
(0.5658,0.5789,0.5725,0.5520;1,1)
(0.5669,0.5788,0.5726,0.5659;0.8,0.8)
0.56899
3D Vis.Dig.Mock(3.759,4.68,4.676,4.011;1,1)
(3.946,4.685,4.669,4.580;0.8,0.8)
(0.517,0.529,0.515,0.426;1,1)
(0.505,0.529,0.514,0.499;0.8,0.8)
(0.6531,0.737,0.7425,0.7143;1,1)
(0.6759,0.7375,0.7419,0.7396;0.8,0.8)
0.71145
Manuf.Proc.Plan(0.34,0.547,0.54,0.476;1,1)
(0.414,0.547,0.54,0.522;0.8,0.8)
(0.865,0.723,0.66,0.436;1,1)
(0.762,0.723,0.66,0.598;0.8,0.8)
(0.1819,0.2596,0.2844,0.3690;1,1)
(0.2307,0.2596,0.2846,0.3080;0.8,0.8)
0.27227
Serv.Eng(1.351,1.52,1.465,1.131;1,1)
(1.286,1.519,1.462,1.387;0.8,0.8)
(1.237,1.015,0.919,0.612;1,1)
(1.067,1.015,0.919,0.822;0.8,0.8)
(0.1289,0.235,0.2687,0.3611;1,1)
(0.1915,0.2348,0.2685,0.3003;0.8,0.8)
0.24790
Envir.Comp.Mng(0.885,1.064,1.026,0.860;1,1)
(0.896,1.065,1.026,0.970;0.8,0.8)
(1.093,0.922,0.834,0.530;1,1)
(0.939,0.922,0.834,0.743;0.8,0.8)
(0.142,0.2289,0.2606,0.3680;1,1)
(0.2056,0.2289,0.2606,0.2922;0.8,0.8)
0.24916
Suppl.Ch.Sour.Mng(2.122,2.793,2.808,2.922;1,1)
(2.137,2.796,2.811,2.776;0.8,0.8)
(0.535,0.366,0.302,0.136;1,1)
(0.425,0.366,0.302,0.244;0.8,0.8)
(0.4876,0.6209,0.6486,0.7267;1,1)
(0.534,0.6211,0.6488,0.6689;0.8,0.8)
0.61582
Qual.Pl.Mng(2.771,3.094,2.9,2.248;1,1)
(2.629,3.095,2.899,2.678;0.8,0.8)
(0.64,0.575,0.537,0.361;1,1)
(0.577,0.576,0.536,0.493;0.8,0.8)
(0.5077,0.5653,0.5621,0.5705;1,1)
(0.5198,0.5651,0.5624,0.5583;0.8,0.8)
0.54680
Anal.Rep(0.228,0.437,0.455,0.477;1,1)
(0.274,0.437,0.454,0.462;0.8,0.8)
(1.589,1.358,1.172,0.709;1,1)
(1.381,1.359,1.173,1.002;0.8,0.8)
(−0.1224,−0.0087,0.0684,0.2586;1,1)
(−0.0335,−0.009,0.068,0.1384;0.8,0.8)
0.04787
Progr.Proj.Mng(1.735,1.729,1.685,1.396;1,1)
(1.619,1.728,1.684,1.626;0.8,0.8)
(0.366,0.306,0.261,0.132;1,1)
(0.321,0.305,0.261,0.220;0.8,0.8)
(0.5192,0.5429,0.5569,0.5811;1,1)
(0.5259,0.5429,0.5567,0.5678;0.8,0.8)
0.54905
Prod.Cost.Mng(0.615,0.903,0.896,0.820;1,1)
(0.652,0.902,0.896,0.873;0.8,0.8)
(1.331,0.925,0.784,0.406;1,1)
(1.056,0.925,0.783,0.657;0.8,0.8)
(0.0196,0.2119,0.2686,0.4146;1,1)
(0.1346,0.2119,0.2688,0.3177;0.8,0.8)
0.22887
Disclaimer/Publisher’s Note: The statements, opinions and data contained in all publications are solely those of the individual author(s) and contributor(s) and not of MDPI and/or the editor(s). MDPI and/or the editor(s) disclaim responsibility for any injury to people or property resulting from any ideas, methods, instructions or products referred to in the content.

