Article

Comparative Life Cycle Assessment of Hydrogen Production via Biogas Reforming and Agricultural Residue Gasification

Department of Technologies and Installations for Waste Management, Faculty of Energy and Environmental Engineering, Silesian University of Technology, 44-100 Gliwice, Poland
*
Author to whom correspondence should be addressed.
Appl. Sci. 2025, 15(9), 5029; https://doi.org/10.3390/app15095029
Submission received: 20 March 2025 / Revised: 24 April 2025 / Accepted: 28 April 2025 / Published: 30 April 2025

Abstract

:
Hydrogen (H2) production from biomass has emerged as a promising alternative to fossil-based pathways, addressing the global demand for low-carbon energy solutions. This study compares the environmental impacts of two biomass-based H2 production processes, biogas reforming and agricultural residue gasification, through a life cycle assessment (LCA). Using real-world data from the literature, the analysis considered key system boundaries for each process, including biogas production, reforming, and infrastructure, for the former, and biomass cultivation, syngas generation, and offgas management, for the latter. Environmental impacts were evaluated using SimaPro software (Version 9.4) and the ReCiPe midpoint (H) method. The results revealed that biogas reforming emits approximately 5.047 kg CO2-eq per kg of H2, which is 4.89 times higher than the emissions from agricultural residue gasification (1.30 kg CO2-eq/kg H2), demonstrating the latter’s superior environmental performance. Gasification consumes fewer fossil resources (3.20 vs. 10.42 kg oil-eq) and poses significantly lower risks to human health (1.51 vs. 23.28 kg 1,4-DCB-eq). Gasification water consumption is markedly higher (5.37 compared to biogas reforming (0.041 m3/kg H2)), which is an important factor to consider for sustainability. These findings highlight gasification as a more sustainable H2 production method and emphasize its potential as an eco-friendly solution. To advance sustainability in energy systems, integrating socio-economic studies with LCA is recommended, alongside prioritizing agricultural residue gasification for hydrogen production.

1. Introduction

Energy resources are vital for meeting human needs and enhancing living standards; however, they can also result in significant environmental impacts over time [1]. We are living in a pivotal era that demands urgent action to address environmental and energy challenges on a global scale [2,3]. The limited availability of energy resources poses major challenges, while excessive consumption exacerbates global warming and environmental issues, such as air pollution, deforestation, ozone layer depletion, and radioactive emissions [4]. The global transition to sustainable energy systems has elevated hydrogen (H2) as a leading candidate for a clean energy carrier [5,6]. Due to its efficiency, high energy density, and zero direct emissions, hydrogen (H2) offers a major opportunity to decarbonize energy-intensive sectors, such as power generation, industry, and transportation [7]. Currently, over 50% of the global H2 is produced via steam methane reforming (SMR) of natural gas (NG), a process that heavily relies on fossil fuels and emits substantial greenhouse gases [8,9]. As concerns grow over fossil fuel depletion and climate change, sustainable hydrogen production becomes crucial, with bio-waste from food and agriculture serving as a plentiful and diverse feedstock [10].
Biogas reforming and gasification were selected for comparison among thermochemical hydrogen production methods due to their use of renewable feedstocks, varying energy demands, and differing carbon footprints. Both methods offer sustainable hydrogen production pathways in contrast to fossil fuel-based approaches, such as SMR, ATR, and POX [7]. Gasification and biogas reforming are more commercially viable and scalable than pyrolysis and hydrothermal gasification. Selecting these methods enables a meaningful life cycle assessment (LCA) comparison of environmental impacts, greenhouse gas emissions, and energy efficiency relevant to hydrogen economy planning. However, they differ in feedstock requirements, environmental effects, and process efficiency. While many studies have examined the energy performance of waste-to-hydrogen systems, comprehensive LCA remains limited.
Hajjaji et al. (2016) [11] performed an LCA on hydrogen production through biogas reforming, encompassing biogas production, reforming processes, and infrastructure factors. When contrasted with fossil-derived feedstocks, the investigation emphasized that biogas reforming represents a sustainable and environmentally friendly pathway for hydrogen production. Zhou et al. (2021) [12] evaluated the life cycle emissions of greenhouse gases associated with hydrogen and biomethane pathways within the European Union. The study showed that hydrogen production via biomass gasification processes can substantially decrease greenhouse gas emissions relative to conventional fossil-fuel-based approaches. Meena et al. (2024) [13] reviewed recent progress in producing biogas and biohydrogen from renewable energy sources, focusing on LCA and environmental impacts. They highlighted that biofuel production from waste materials provides an efficient method for generating renewable energy, simultaneously recycling valuable nutrients and minimizing waste. Marco Berardino (2019) [14] conducted an LCA and economic evaluation of a novel membrane reactor designed for hydrogen production from biogas. The findings indicated that the innovative system outperforms reference systems in scenarios where biogas is a limiting factor, attributed to its superior biogas conversion efficiency, which may replace more hydrogen generated from fossil fuels.
Biogas, a byproduct of the anaerobic digestion of organic waste, primarily consists of methane (CH4) and carbon dioxide (CO2). It is typically produced through the anaerobic digestion (AD) of organic materials, such as food waste, animal manure, sewage sludge, and crop residues. The AD process is considered beneficial as it utilizes waste streams, thereby reducing the environmental burden of organic waste disposal. However, the handling of digestate and the leakage of methane during biogas production can greatly increase greenhouse gas emissions, which may offset the environmental benefits [15,16,17]. Biogas reforming refers to the process of converting biogas into hydrogen through a series of chemical reactions [18]. Iulianelli et al. (2015, 2020) investigated biogas steam reforming using palladium-based membrane reactors and reported enhanced hydrogen production and separation efficiency [19,20]. Increased pressures, temperatures, and steam-to-methane ratios enhance recovery and conversion rates. Figure 1 shows the biogas reforming, which consists of three main steps: (1) synthesis gas (SG) generation, (2) the water–gas shift (WGS) reaction, and (3) hydrogen purification [21]. In the first stage, the steam–biogas mixture undergoes catalytic reforming to produce syngas, primarily composed of hydrogen, carbon dioxide, carbon monoxide, methane, and water vapor.
After the reformer, syngas (SG) is fed into a water–gas shift (WGS) reactor, where carbon monoxide (CO) combines with water (H2O) over a catalyst to produce hydrogen (H2) and carbon dioxide (CO2). This reaction is typically carried out in two stages: a lower temperature shift (LTS) reactor at 200–300 °C and a higher temperature shift (HTS) reactor at 300–400 °C [11]. Methane (CH4) reacts with steam (H2O) and carbon dioxide (CO2) to produce synthesis gas (SG), which contains hydrogen (H2), carbon monoxide (CO), carbon dioxide (CO2), methane (CH4), and water (H2O), among other components. The general equation for biogas reforming is presented in Equation (1).
BG   ( CH 4 + α H 2 O ( steam ) ) + β CO 2     SG   ( H 2 ,   CO ,   CO 2 ,   CH 4 ,   H 2 O ,   etc . )
where α and β are the stoichiometric coefficients of water and carbon dioxide, respectively. The main possible reactions in biogas reforming are steam methane reforming (SMR: Equation (2)), dry methane reforming (DMR: Equation (3)), and water–gas shift (WGS: Equation (4)).
Steam methane reforming (SMR): Methane reacts with steam to form carbon monoxide and hydrogen gas, with an enthalpy change of +206.11 kJ/mol:
CH 4 + H 2 O   CO + 3 H 2   Δ H 298 K ° = + 206.11   kJ / mol
Dry methane reforming (DMR): Methane from biogas reacts with carbon dioxide to form carbon monoxide and hydrogen, with an enthalpy change of +247.28 kJ/mol:
CH 4 + CO 2   2 CO + 2 H 2   Δ H 298 K ° = + 247.28   kJ / mol
Water–gas shift (WGS) reaction: Carbon monoxide reacts with steam to produce carbon dioxide and hydrogen, releasing −41.17 kJ/mol of energy:
CO + H 2 O   CO 2 + H 2   Δ H 298 K ° = 41.2   kJ / mol
Carbon formation reactions: During the process, a specific side reaction contributes to the creation of coke.
Boudouard reaction: Carbon monoxide decomposes into carbon dioxide and solid carbon (graphite), releasing −172.43 kJ/mol of energy (Equation (5)):
2 CO   CO 2 + C ( graphite )   Δ H 298 K ° = 172.43   kJ / mol
Methane decomposition: Methane breaks down into hydrogen gas and solid carbon (graphite), with an enthalpy change of +74.85 kJ/mol (Equation (6)):
CH 4   2 H 2 + C ( graphite )   Δ H 298 K ° = + 74.85   kJ / mol
CO reduction reaction: Carbon monoxide reacts with steam to form solid carbon (graphite), hydrogen gas, and carbon dioxide, releasing −131.26 kJ/mol of energy (Equation (7)):
CO + H 2 O   C ( graphite ) + H 2 + CO 2   Δ H 298 K ° = 131.26   kJ / mol
Finally, hydrogen purification can be performed by CO2 removal via pressure swing adsorption, chemical absorption, and methanation, or metallic membrane separation.
Biomass gasification (see Figure 2) presents a promising approach for generating hydrogen-rich synthetic gas (syngas), which can subsequently be refined to yield pure hydrogen [22,23]. Gasification benefits from the carbon neutrality of biomass, where CO2 emissions are offset by the carbon absorbed during plant growth. Gasification operates under sub-stoichiometric conditions, typically within an equivalence ratio (ER) range of 0.20 to 0.45.
The yield and composition of syngas depend on several variables, including the feedstock type, reactor design, and nature of gasifying agents, such as air, oxygen-enriched air, CO2, or steam [24]. Biomass gasification is gaining attention due to its adaptability in processing diverse feedstocks, including agricultural residues, wood waste, and refuse-derived fuels [25]. The environmental impact of gasification varies depending on feedstock characteristics, operational conditions, and pretreatment requirements [26,27].
LCA is a widely adopted methodology for evaluating potential environmental impacts and resource use throughout a product or system’s entire life cycle, from raw material extraction to end-of-life stages, as defined by SETAC and standardized under ISO 14040 [23]. Each stage of production, use, and disposal carries specific environmental implications, which are thoroughly captured by the LCA framework [12]. LCA helps enhance resource efficiency and identify potential environmental trade-offs, supporting informed policy development in the energy sector. The LCA method has been widely utilized in recent years to evaluate the environmental performance of bioenergy processes [28,29]. In reviewing the methodological aspects of the selected life cycle assessment (LCA) studies, several key software tools and approaches were identified, each offering distinct advantages and limitations. SimaPro, OpenLCA, and GaBi emerged as the most widely used LCA software platforms. SimaPro is renowned for its robustness and compatibility with a broad range of LCIA methods and the ecoinvent database, making it ideal for both academic and industrial research; however, it requires a paid license and has a steep learning curve. OpenLCA, in contrast, is open-source and user-friendly, allowing flexible modeling and integration with non-proprietary databases, though it may lack some advanced features and data compatibility. GaBi excels in industrial applications and offers high-quality proprietary datasets, especially for European contexts, but its limited transparency and licensing costs can pose challenges.
The reviewed studies utilized a mix of data types, secondary data, software simulations, and, in some cases, primary measurements. The background databases varied, with ecoinvent being the most common due to its comprehensive coverage and standardized structure, although different versions (e.g., 3.1 to 3.8) may influence consistency. GREET and the GaBi database were also used, offering advantages for regional specificity and industrial data, but they are limited in scope or accessibility.
Table 1 presents the methodological frameworks used in the studies reviewed, highlighting key parameters such as LCA software, data types, background databases, functional units (F.Us.), system boundaries, and LCIA methods. The background data sources predominantly included various versions of the ecoinvent database, GREET 2021, the GaBi database, and information from the literature. Across the reviewed studies, a consistent functional unit of 1 kg of hydrogen (H2) was applied, with some cases specifying additional parameters, such as purity levels and pressure conditions. All studies adopted cradle-to-gate system boundaries, ensuring a comparable system scope. In terms of impact assessment, a range of LCIA methods was applied, including ReCiPe (2016), IPCC 2013 GWP (100a), CML 2001, and EF 3.0 [21], although some studies did not explicitly report the method used. Overall, this methodological review reveals considerable variability in data sources and impact assessment tools, yet it demonstrates consistent application of system boundaries and functional unit definitions in hydrogen-related LCA studies.
Although extensive research has examined the environmental impacts of hydrogen production from biomass, there remains a notable gap in integrating socio-economic and techno-economic dimensions. Key cost indicators, such as CAPEX, OPEX, and LCOH, are often excluded. This limits the practical assessment of hydrogen technologies’ real-world sustainability. To address this, the present study performs a holistic sustainability assessment that combines environmental LCA with economic evaluation for two biomass-based hydrogen pathways: biogas reforming and agricultural residue gasification. Using a cradle-to-gate boundary and a functional unit of 1 kg H2, environmental impacts are assessed across 18 categories via SimaPro 9.4 and the ReCiPe Midpoint (H) method, drawing from the literature and Ecoinvent 3.1 data.
This study aims to compare the environmental and economic performance of both pathways. It hypothesizes that agricultural residue gasification will show environmental advantages due to its carbon-neutral feedstock, albeit with higher water use and capital costs. This integrated analysis provides insights for guiding sustainable hydrogen deployment across different regional contexts.

2. Materials and LCA Methodology

Simapro LCA software (version 9.4) was employed in this study, using its pre-configured default databases. The LCA was carried out following the LCA framework defined by the ISO 14040 standard (2006) for the life cycle inventory (LCI) phase. The literature suggests that uncontrolled methane emissions from biogas plants, primarily due to leakages, can account for approximately 2% of the total biogas produced [11]. Additionally, open-air lagoon storage of digestate is a notable source of emissions, releasing an estimated 4.465 kg of methane (CH4) and 0.115 kg of ammonia (NH3) per tonne of anaerobic digestion (AD) feedstock [39]. Furthermore, after the digestate is applied to land, an additional 0.677 kg of ammonia per tonne of AD feedstock is emitted [36]. For this study, the anaerobic digestion (AD) and biogas reforming plants were assumed to operate over a 20-year lifespan, with 8000 operational hours annually (equivalent to approximately 333 days per year under continuous operation). At the end of their operational lifespan, the infrastructure is decommissioned and dismantled.
Component materials, including steel, concrete, and catalysts, are managed through end-of-life pathways, such as landfilling, recycling, or incineration, with associated environmental impacts (e.g., landfill emissions, energy recovery from incineration) incorporated into the LCI. These assumptions align with circular economy principles and ISO 14044 standards, ensuring comprehensive accounting of material flows across the system’s lifetime. Data for this study were sourced from the Ecoinvent default database (version 3.1) [11,26], as integrated into Simapro 9.4. Construction material data were projected by scaling from a 300 m3 AD plant in the Ecoinvent database to an 800 m3 capacity AD system [11]. However, the construction material requirements (concrete, iron, aluminum, steel, etc.) for the reforming plant were adapted from Ref. [34]. This section outlines the methodological framework employed in this study, detailing the goal and scope definition, system boundaries, LCI data collection, and life cycle impact assessment (LCIA) methodology. The analysis followed the ISO 14040 and ISO 14044 standards for LCA.
According to ISO 14040–14044 standards [11], the methodological framework of LCA consists of four interconnected stages (Figure 3): (1) The goal and scope stage defines the objectives of the study, establishes the system boundaries (SBs), and identifies the functional unit (FU), which serves as a reference point for all input and output data. (2) In the life cycle inventory (LCI) stage, material and energy flows are quantified for each process within the SBs, and these flows are then estimated and distributed accordingly. (3) The life cycle impact assessment (LCIA) stage evaluates the potential environmental impacts based on the LCI results. (4) The final stage is interpretation, where the life cycle model is assessed to identify key issues using the LCI and LCIA results, check for consistency and completeness, and support decision-making and recommendations. LCA finds environmental hotspots in systems. It helps people find and choose production methods that might be more sustainable by looking at their effects on the environment [36]. The process involves evaluating various ecological factors, such as acidification potential, global warming potential, resource depletion potential, and eutrophication potential [12].

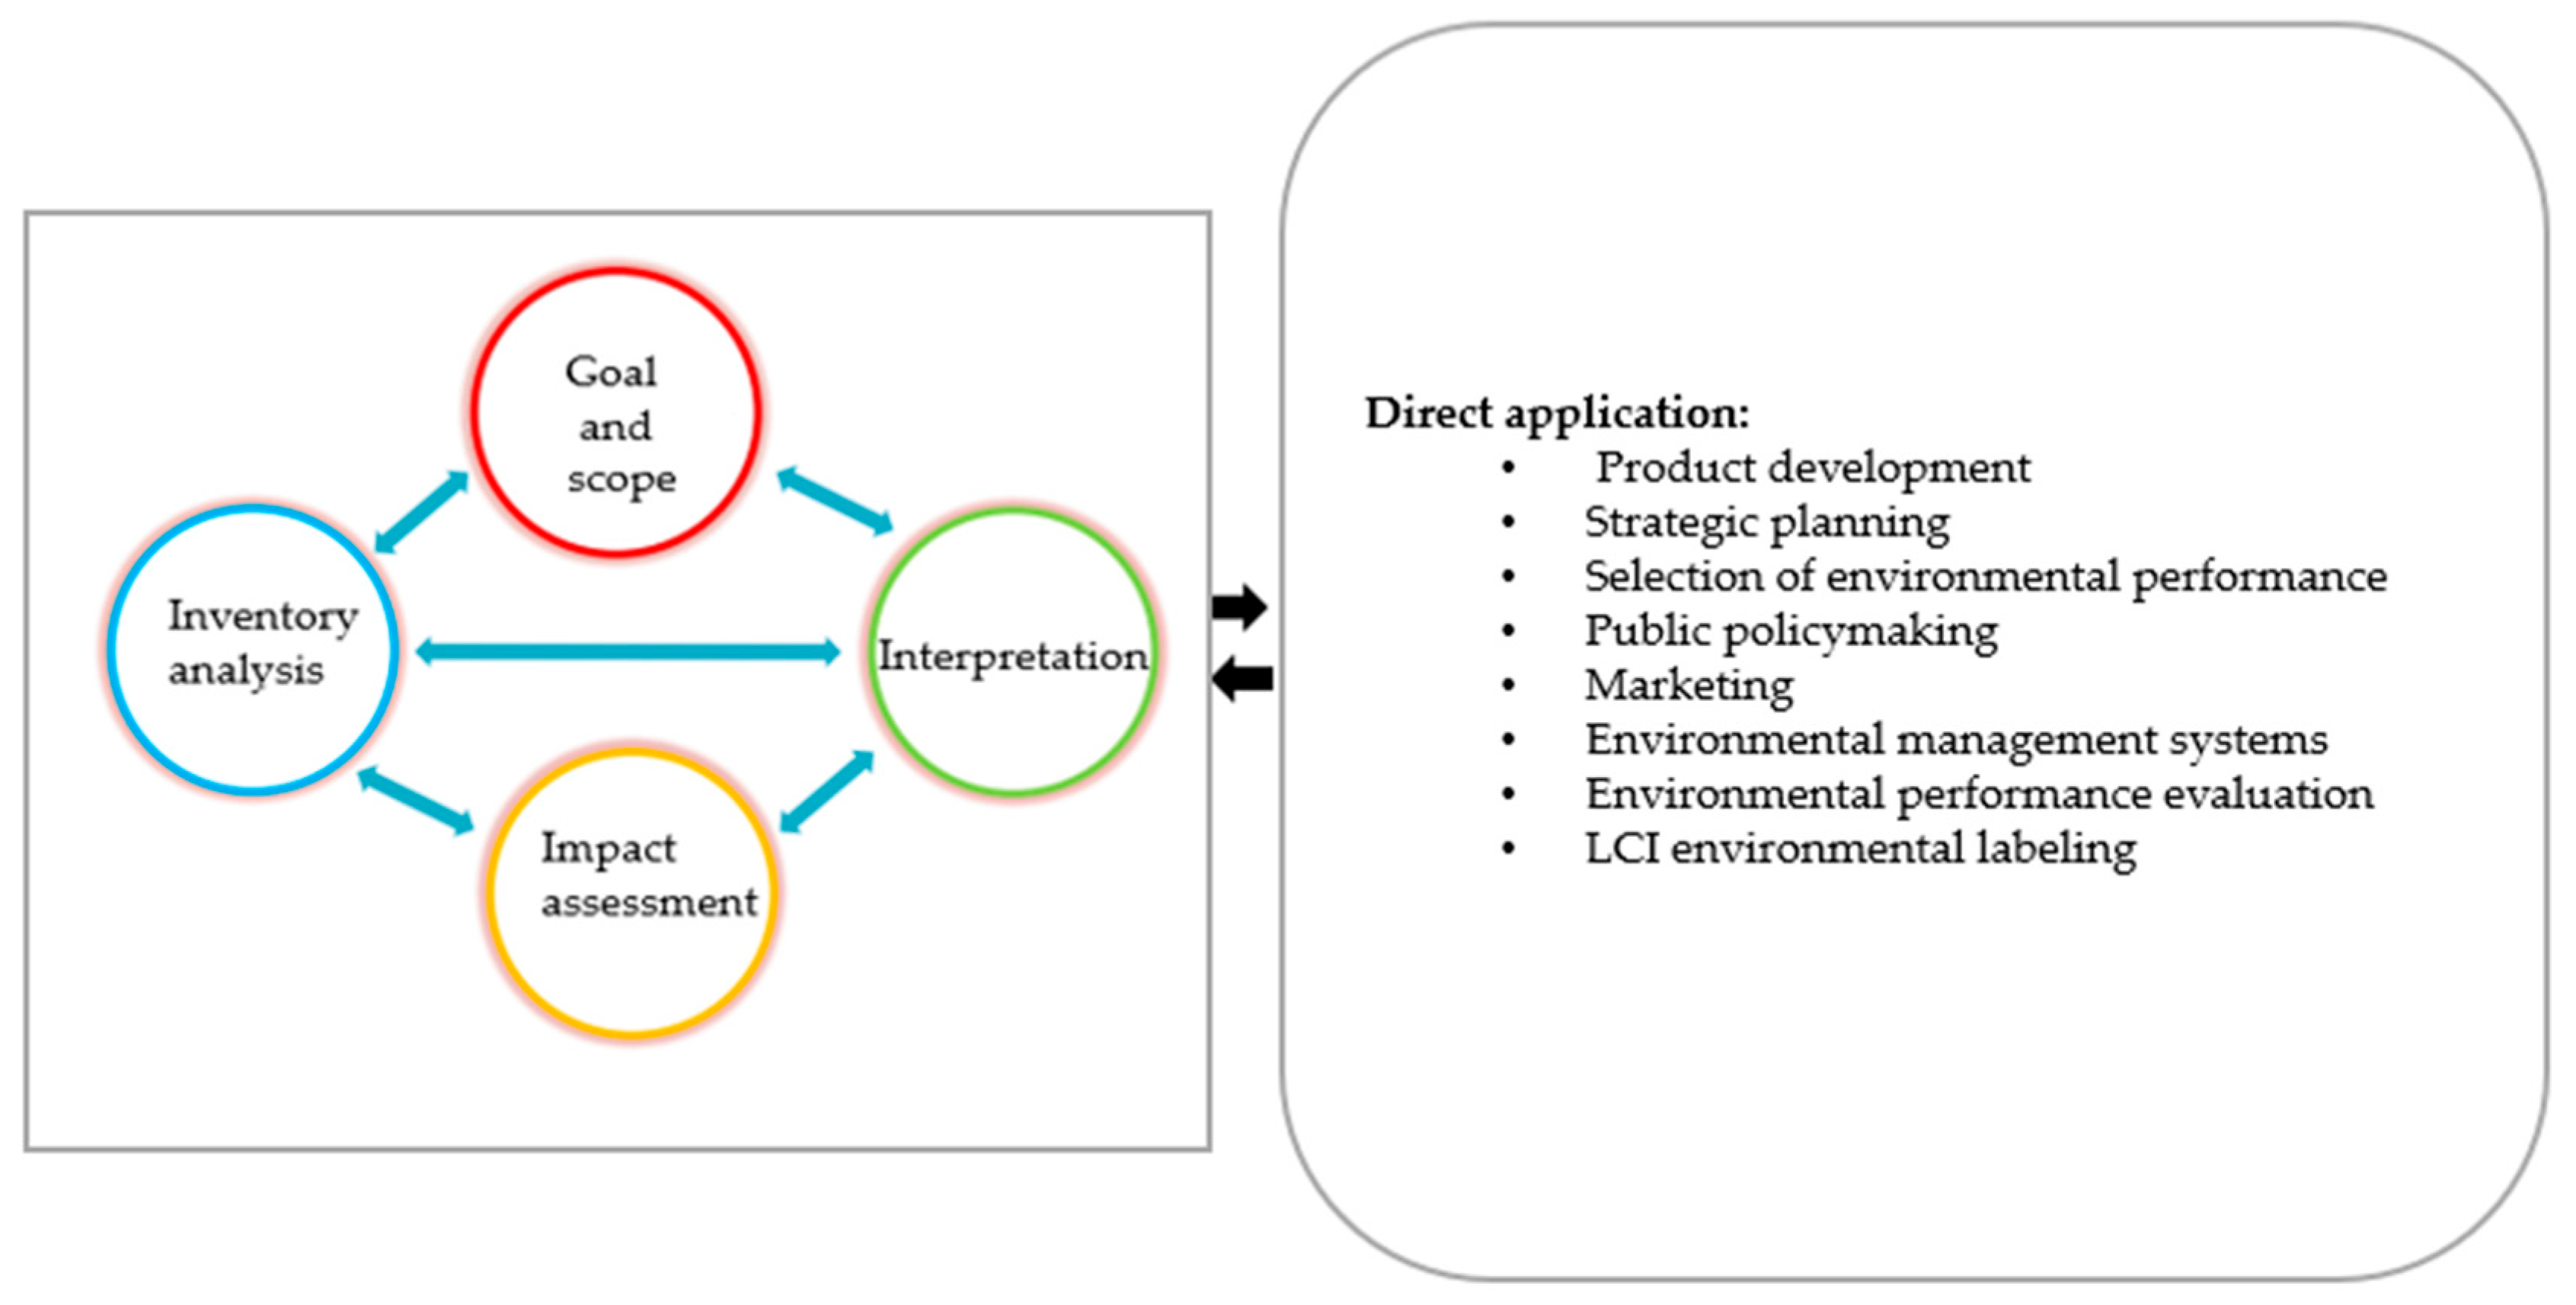
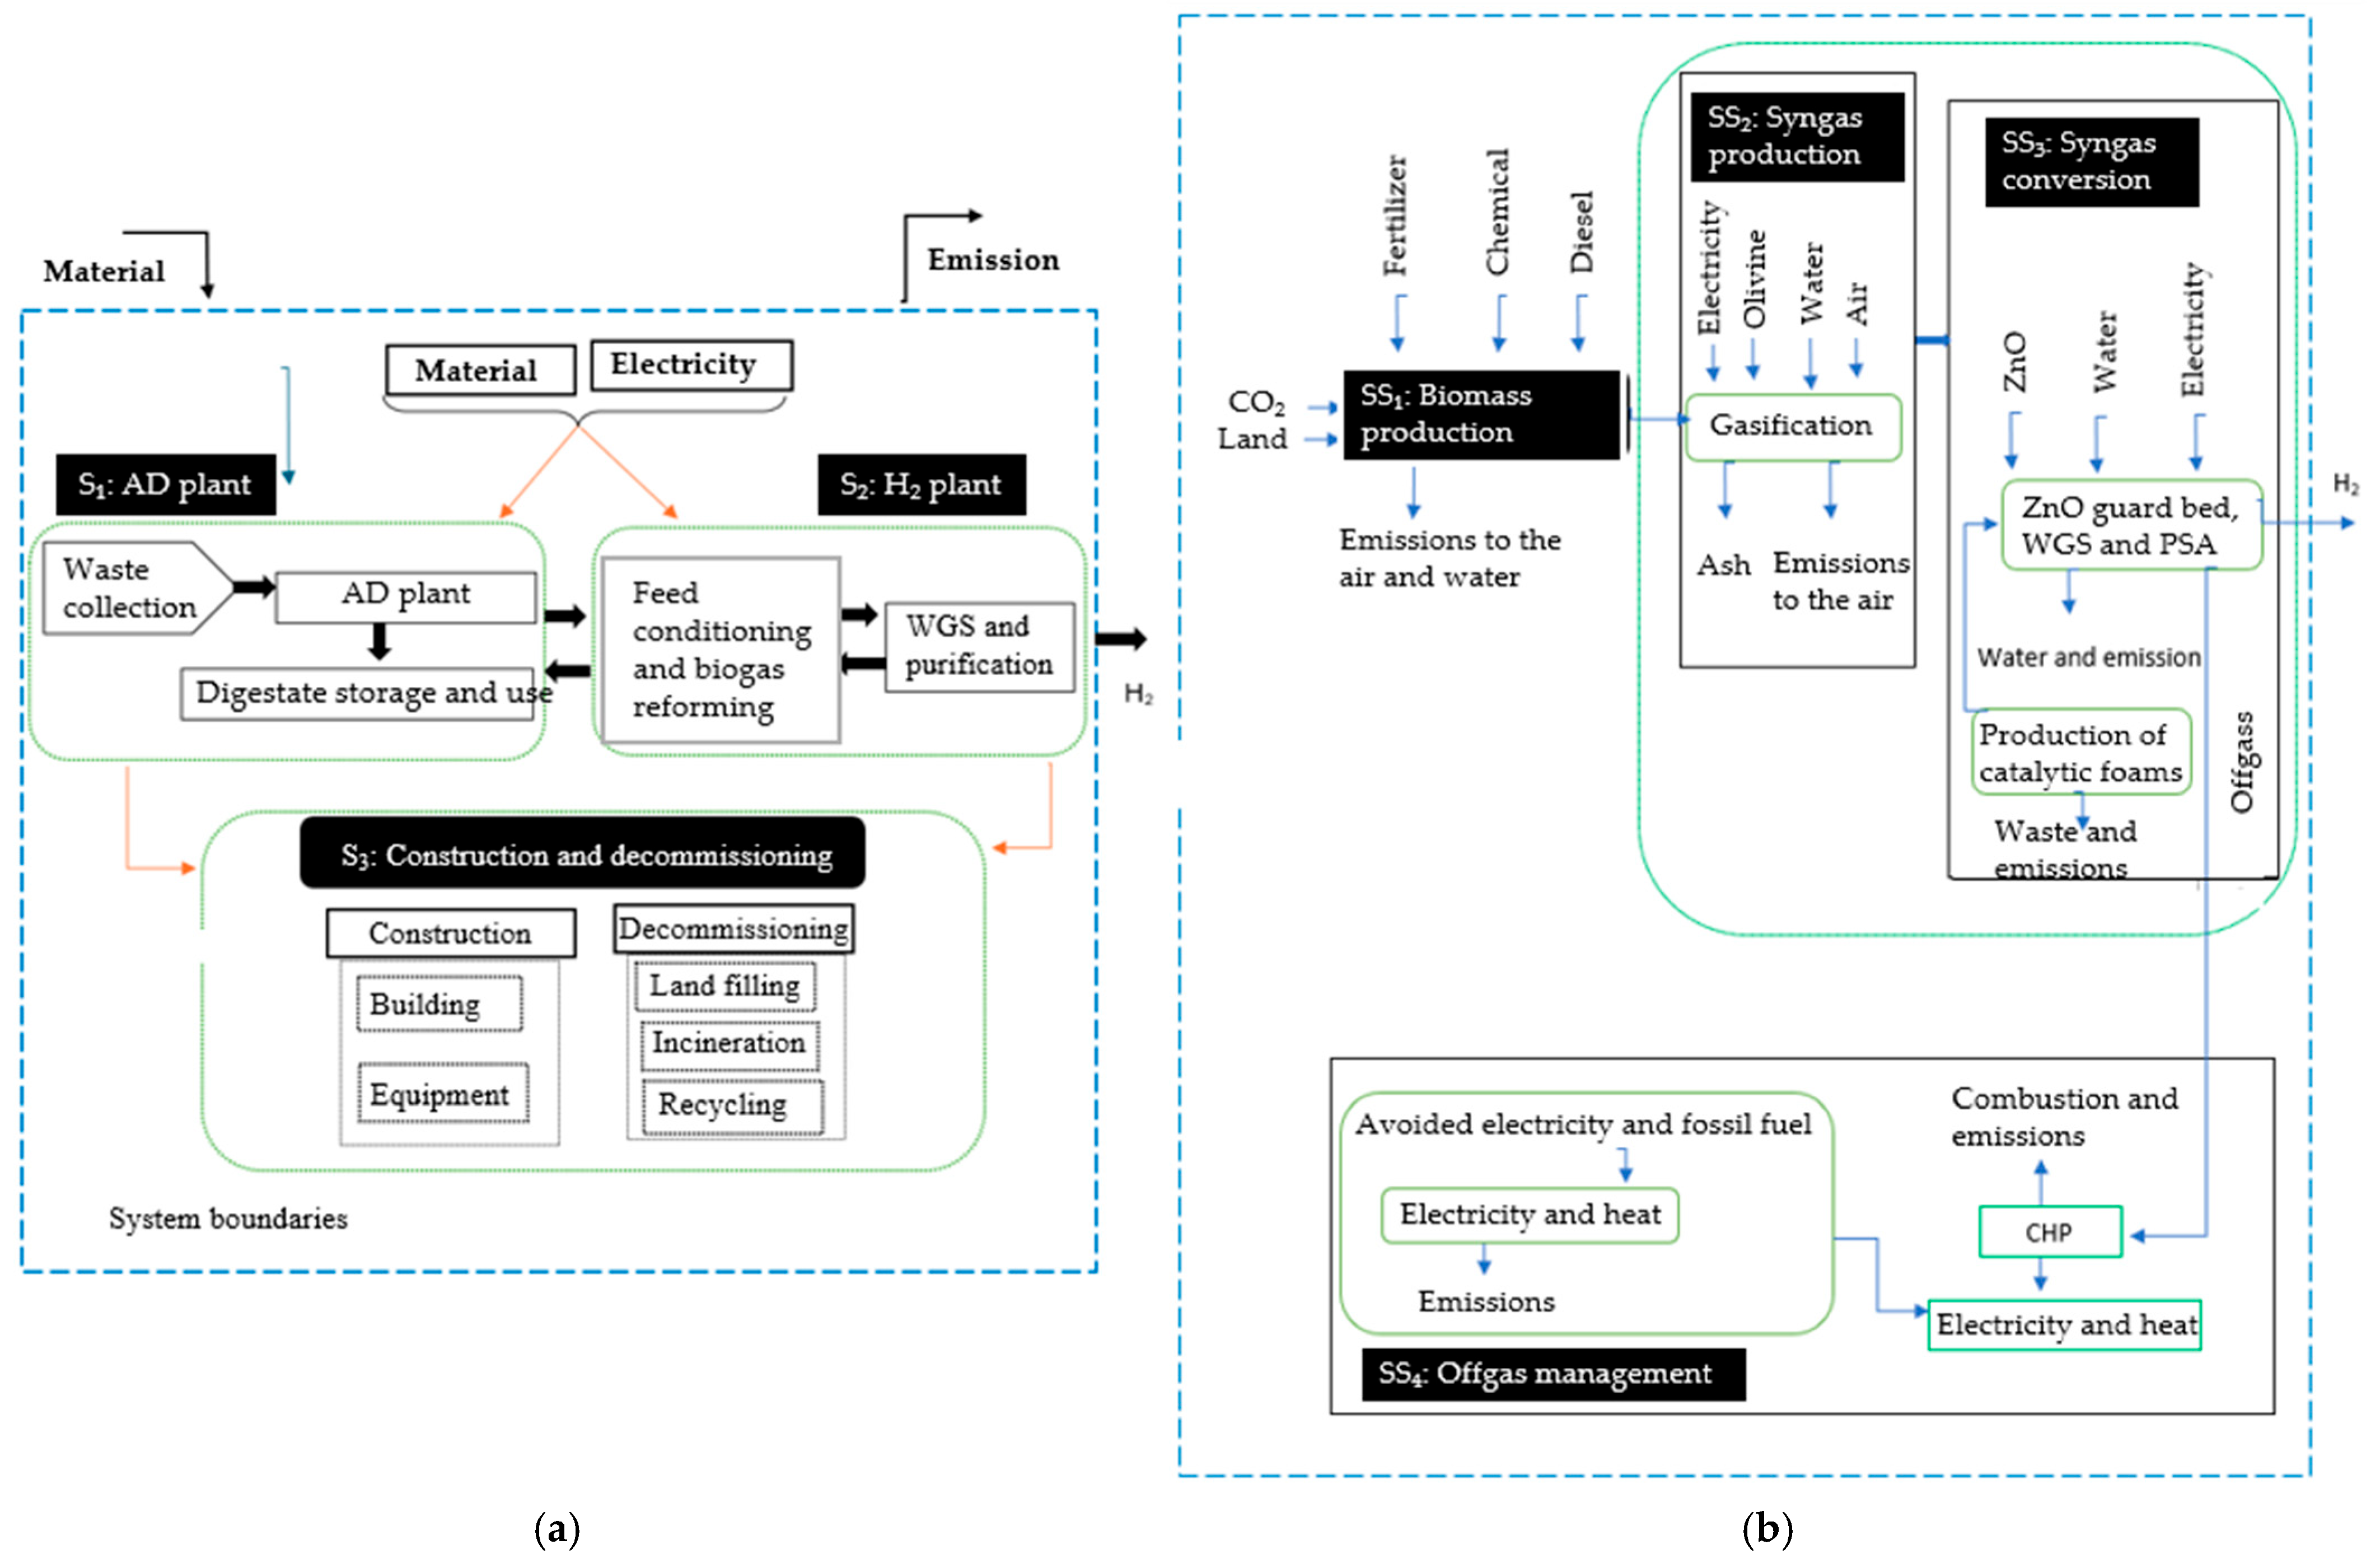
2.1. Goal and Scope Definition

The primary goal of this study was to compare the environmental impacts of hydrogen (H2) production through two biomass-based methods: biogas reforming and agricultural residue gasification. This comparative assessment aimed to determine the more sustainable H2 production pathway by focusing on GHG emissions and other environmental indicators. The functional unit selected for the LCA was 1 kg of H2 produced, which was the basis for quantifying inputs, outputs, and environmental impacts across both production systems.
The system boundaries for both H2 production pathways encompassed all processes involved in producing 1 kg of H2, as illustrated in Figure 4, which was adapted from [11]. The biogas reforming pathway includes three stages: AD plant (digester unit) (S₁), H2 plant (hydrogen production via the water–gas shift and a purification unit) (S2), and construction and decommissioning (S3). Organic waste is processed into biogas in S₁, which is then converted into high-purity hydrogen in S2, with infrastructure impacts accounted for in S3. Agricultural residue gasification consists of four subsystems: biomass production (SS1), syngas production (SS2), syngas conversion to hydrogen (SS3), and offgas management (SS4). SS1 involves residue collection with associated resource inputs and emissions, while SS2 and SS3 convert biomass into hydrogen through gasification and purification processes. SS4 manages offgases through combined heat and power generation, enhancing sustainability by recovering energy and reducing fossil fuel use.

2.2. Life Cycle Inventory (LCI) Analysis

The second phase of the LCA, referred to as life cycle inventory (LCI), involved the collection and quantification of all input and output flows that cross the system boundaries [26]. Table 2 presents the main inventory data for biogas production, detailing inputs from the technosphere and their associated material consumption, as well as outputs to both the technosphere and the environment. The anaerobic digestion (AD) plant operation utilizes various feedstocks, including manure (25.1 kg), waste maize silage (8.5 kg), fodder beet (8.5 kg), and cheese whey (8.5 kg), alongside an energy input of 4054.96 kJ. Additionally, construction materials, such as concrete (500.47 g), reinforced steel (18.1 g), and laminated timber (9.22 g), are required for the infrastructure. The outputs to the technosphere include biogas (7.18 Nm3) and digestate (42.82 kg), while avoided products, such as nitrogen (57.81 g), phosphorus (67.23 g), and potassium (179.8 g) fertilizers, are accounted for. The environmental emissions include biogenic CO2 (90.42 g), biogenic CH4 (284.19 g), and NH3 (40.45 g). In SimaPro, material flows were quantified based on Equation (8):
Total   material   flow   ( kg   or   MJ ) = Activity   Level   ( FU ) × Input / Output   per   FU
where
  • Activity Level (Functional Unit, FU) = 1 kg H2;
  • Input/Output per FU = amount of material or energy required or produced per FU (from the inventory data).
Table 2. Main inventory data for the production of biogas [44].
CategoryComponentAmountUnit
Inputs from the TechnosphereAD plant operation
Manure25.51kg
Waste maize silage8.5kg
Fodder beet8.5kg
Cheese whey8.5kg
Electricity4054.96kJ
Construction
Concrete500.47g
Reinforced steel18.9g
Chromium steel2.18g
Copper0.2g
Laminated timber9.22g
High-density polyethylene0.08g
High-impact polystyrene0.95g
Polyvinyl chloride0.13g
Synthetic rubber0.51g
Outputs to the TechnosphereBG (Biogas)7.18Nm3
Digestate42.82kg
Avoided ProductsFertilizer, as N57.81g
Fertilizer, as P67.23g
Fertilizer, as K179.84g
Outputs to the EnvironmentCO2, biogenic90.42g
CH4, biogenic284.19g
NH340.45g
Table 3 provides the main inventory data for hydrogen (H2) production through biogas reforming, detailing inputs from the technosphere, construction materials, equipment, and purification processes. The process involves the use of biogas (7.18 Nm3), water (7.5 kg), air (19.1 kg), and electricity (1995.28 kJ) for feed conditioning and reforming. Construction materials, such as concrete (227.9 g) and steel (72.81 g), contribute to infrastructure, while steel, aluminum, and various alloys are utilized for equipment and purification. The output to the technosphere includes hydrogen (1.0 kg), with biogenic CO2 emissions amounting to 13.43 kg. Similarly, Table 4 outlines the inventory data for hydrogen production from agricultural residue gasification, where rice husk (15.4 kg), diesel (2.5 × 10⁻³ kg), and water (0.248 kg) serve as primary inputs. Additional technosphere inputs include de-ionized water (0.209 kg) and zinc oxide (1.617 × 10⁻³ kg). The energy demand consists of electricity (0.19 kWh), with an avoided electricity production of 2.6 × 10⁻³ kWh. The process emits nitrogen oxide (1.76 g), carbon dioxide (biogenic) (1.78 kg), and water (0.15 kg) into the air, while emissions to the water include ash (1.63 kg) and hydrogen sulfide (58.5 g).

2.3. Life Cycle Impact Assessment (LCIA)

The aim of the life cycle impact assessment (LCIA) was to translate the LCI results into meaningful environmental impacts, particularly concerning the environment, natural resources, and human health. The concept of LCA encompasses various terms and concepts, with no universally accepted set of environmental impact categories. Commonly recognized categories include climate change, eutrophication, acidification, stratospheric ozone depletion, human toxicity, aquatic toxicity, fossil fuel depletion, water depletion, and land use.

2.4. Interpretation

The final step involved interpreting the inventory and impact assessment results in alignment with this study’s objectives. This step included summarizing the previous phases and formulating recommendations. Furthermore, two main LCA approaches were recognized: consequential LCA (cLCA) and attributional LCA (aLCA). The cLCA approach evaluates environmental implications based on marginal data, while the aLCA assesses average environmental impacts over a product’s life cycle.
The environmental impacts of the two hydrogen production pathways were evaluated and compared using the following impact categories: global warming potential (GWP), stratospheric ozone depletion (SOD), ionizing radiation (IR), Ozone Formation Human Health (OFHH), fine particulate matter formation (FPMF), Ozone Formation Terrestrial Ecosystems (OFTESs), terrestrial acidification (TA), freshwater eutrophication (FEW), marine eutrophication (ME), terrestrial ecotoxicity (TET), freshwater ecotoxicity (FWET), marine ecotoxicity (MET), human carcinogenic toxicity (HCT), human non-carcinogenic toxicity (HNCT), land use (LU), mineral resource scarcity (MRS), fossil resource scarcity (FRS), and water consumption (WC) [11].
The life cycle modeling and simulation were performed using SimaPro 9.4, utilizing background data from the Ecoinvent 3.1 database. Simulation runtimes ranged from 12 to 18 min per scenario, depending on the complexity of the impact categories considered. The energy consumption during the computational phase was estimated at approximately 0.04 to 0.06 kWh. Peak memory usage during the life cycle inventory processing and impact assessment reached approximately 2.4 GB, influenced by database size, scenario configurations, and iterative calculations. These figures reflect the moderate computational requirements of SimaPro-based LCA modeling, supporting its feasibility for academic and institutional use with standard computing resources.

3. Results and Discussion

3.1. LCA of Hydrogen Production

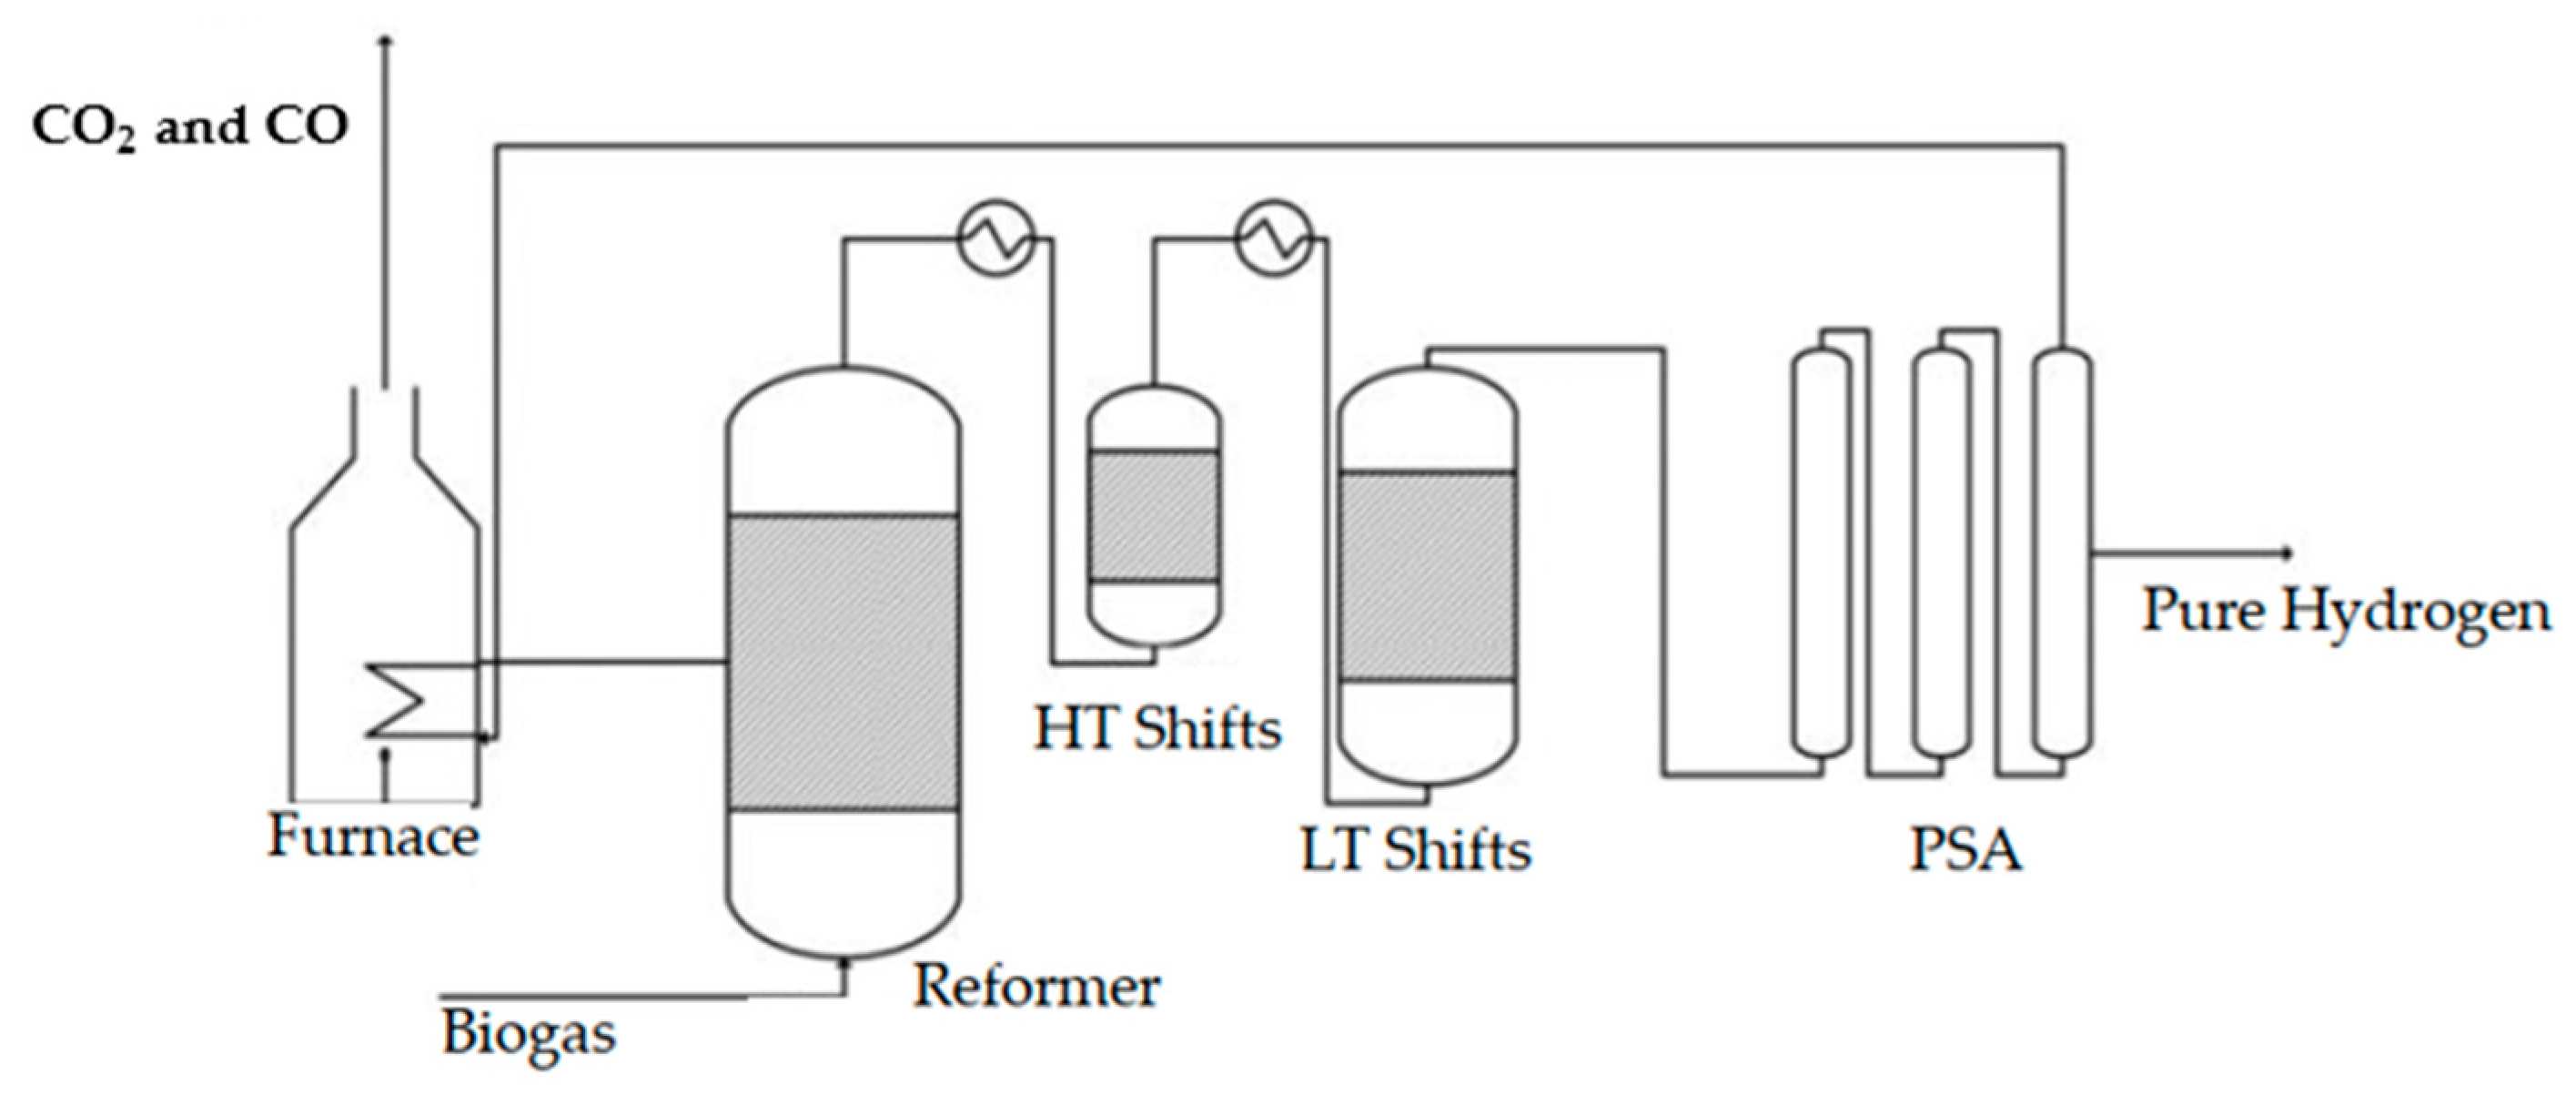
3.1.1. Biogas Reforming

Figure 5 illustrates the environmental impacts of producing 1 kg of hydrogen (H2) via biogas reforming across key categories. The anaerobic digestion (AD) plant, air, and electricity consumption are the primary contributors to global warming potential (GWP), accounting for approximately 95% of the total emissions (5.0471 kg CO2-eq/kg H2). This aligns with the energy-intensive nature of biogas reforming, driven by methane combustion and grid electricity reliance. The impacts on ozone depletion and ionizing radiation are predominantly influenced by electricity consumption, which aligns with previous research indicating that electricity derived from non-renewable sources significantly affects these categories. The AD plant and iron components also contribute significantly to the impacts on terrestrial ecosystems and human health. Material inputs, such as iron, nickel, and concrete, also play significant roles, contributing 18% to terrestrial ecotoxicity (33.44 kg 1,4-DCB eq) and 22% to mineral resource scarcity (0.1168 kg Cu eq). Freshwater eutrophication (0.0120 kg SO2 eq) and fine particulate matter formation (0.0243 kg PM2.5 eq) are primarily associated with AD plant operations. Water consumption remains relatively low (0.0485 m3/kg H2), mainly due to cooling, reforming reactions, and gas purification processes. The negative environmental effects of constructing and demolishing a biogas reforming and gasification facility are relatively insignificant. Operating the plant at a high capacity can further reduce environmental impacts. The evidence indicates that long-lived biogas plants have minimal environmental impact during construction and demolition. During plant operation, CH4 emissions from overpressure valves or leaks can significantly contribute to GHG emissions. Construction and demolition of the installations have minimal environmental impacts [21].
The dominance of AD plant operations and electricity in global warming potential (GWP) corroborates the findings of Zhang et al. (2020) [46], who identified biogas combustion and fossil-based energy inputs as critical emission sources. However, biogas reforming still exhibits a 40–60% lower GWP than steam methane reforming (SMR) due to renewable feedstock utilization (Hajjaji et al., 2016) [11]. The high ozone depletion and ionizing radiation impacts (0.3729 kBq Co-60 eq) reflect reliance on non-renewable electricity, consistent with Bareiß et al. (2019) [47], who emphasized grid dependency as a key drawback. Particulate emissions from biomass handling and iron components align with Valente et al. (2017) [48], who linked these to mechanical processing and catalyst use. Ecotoxicity from nickel and concrete mirrors Spath and Mann (2001) [49], who attributed heavy metal leaching to infrastructure and reforming catalysts. Despite lower land use (0.0358 m2 a crop eq) compared to electrolysis [50], optimizing renewable energy integration and material efficiency remains critical to mitigate trade-offs.

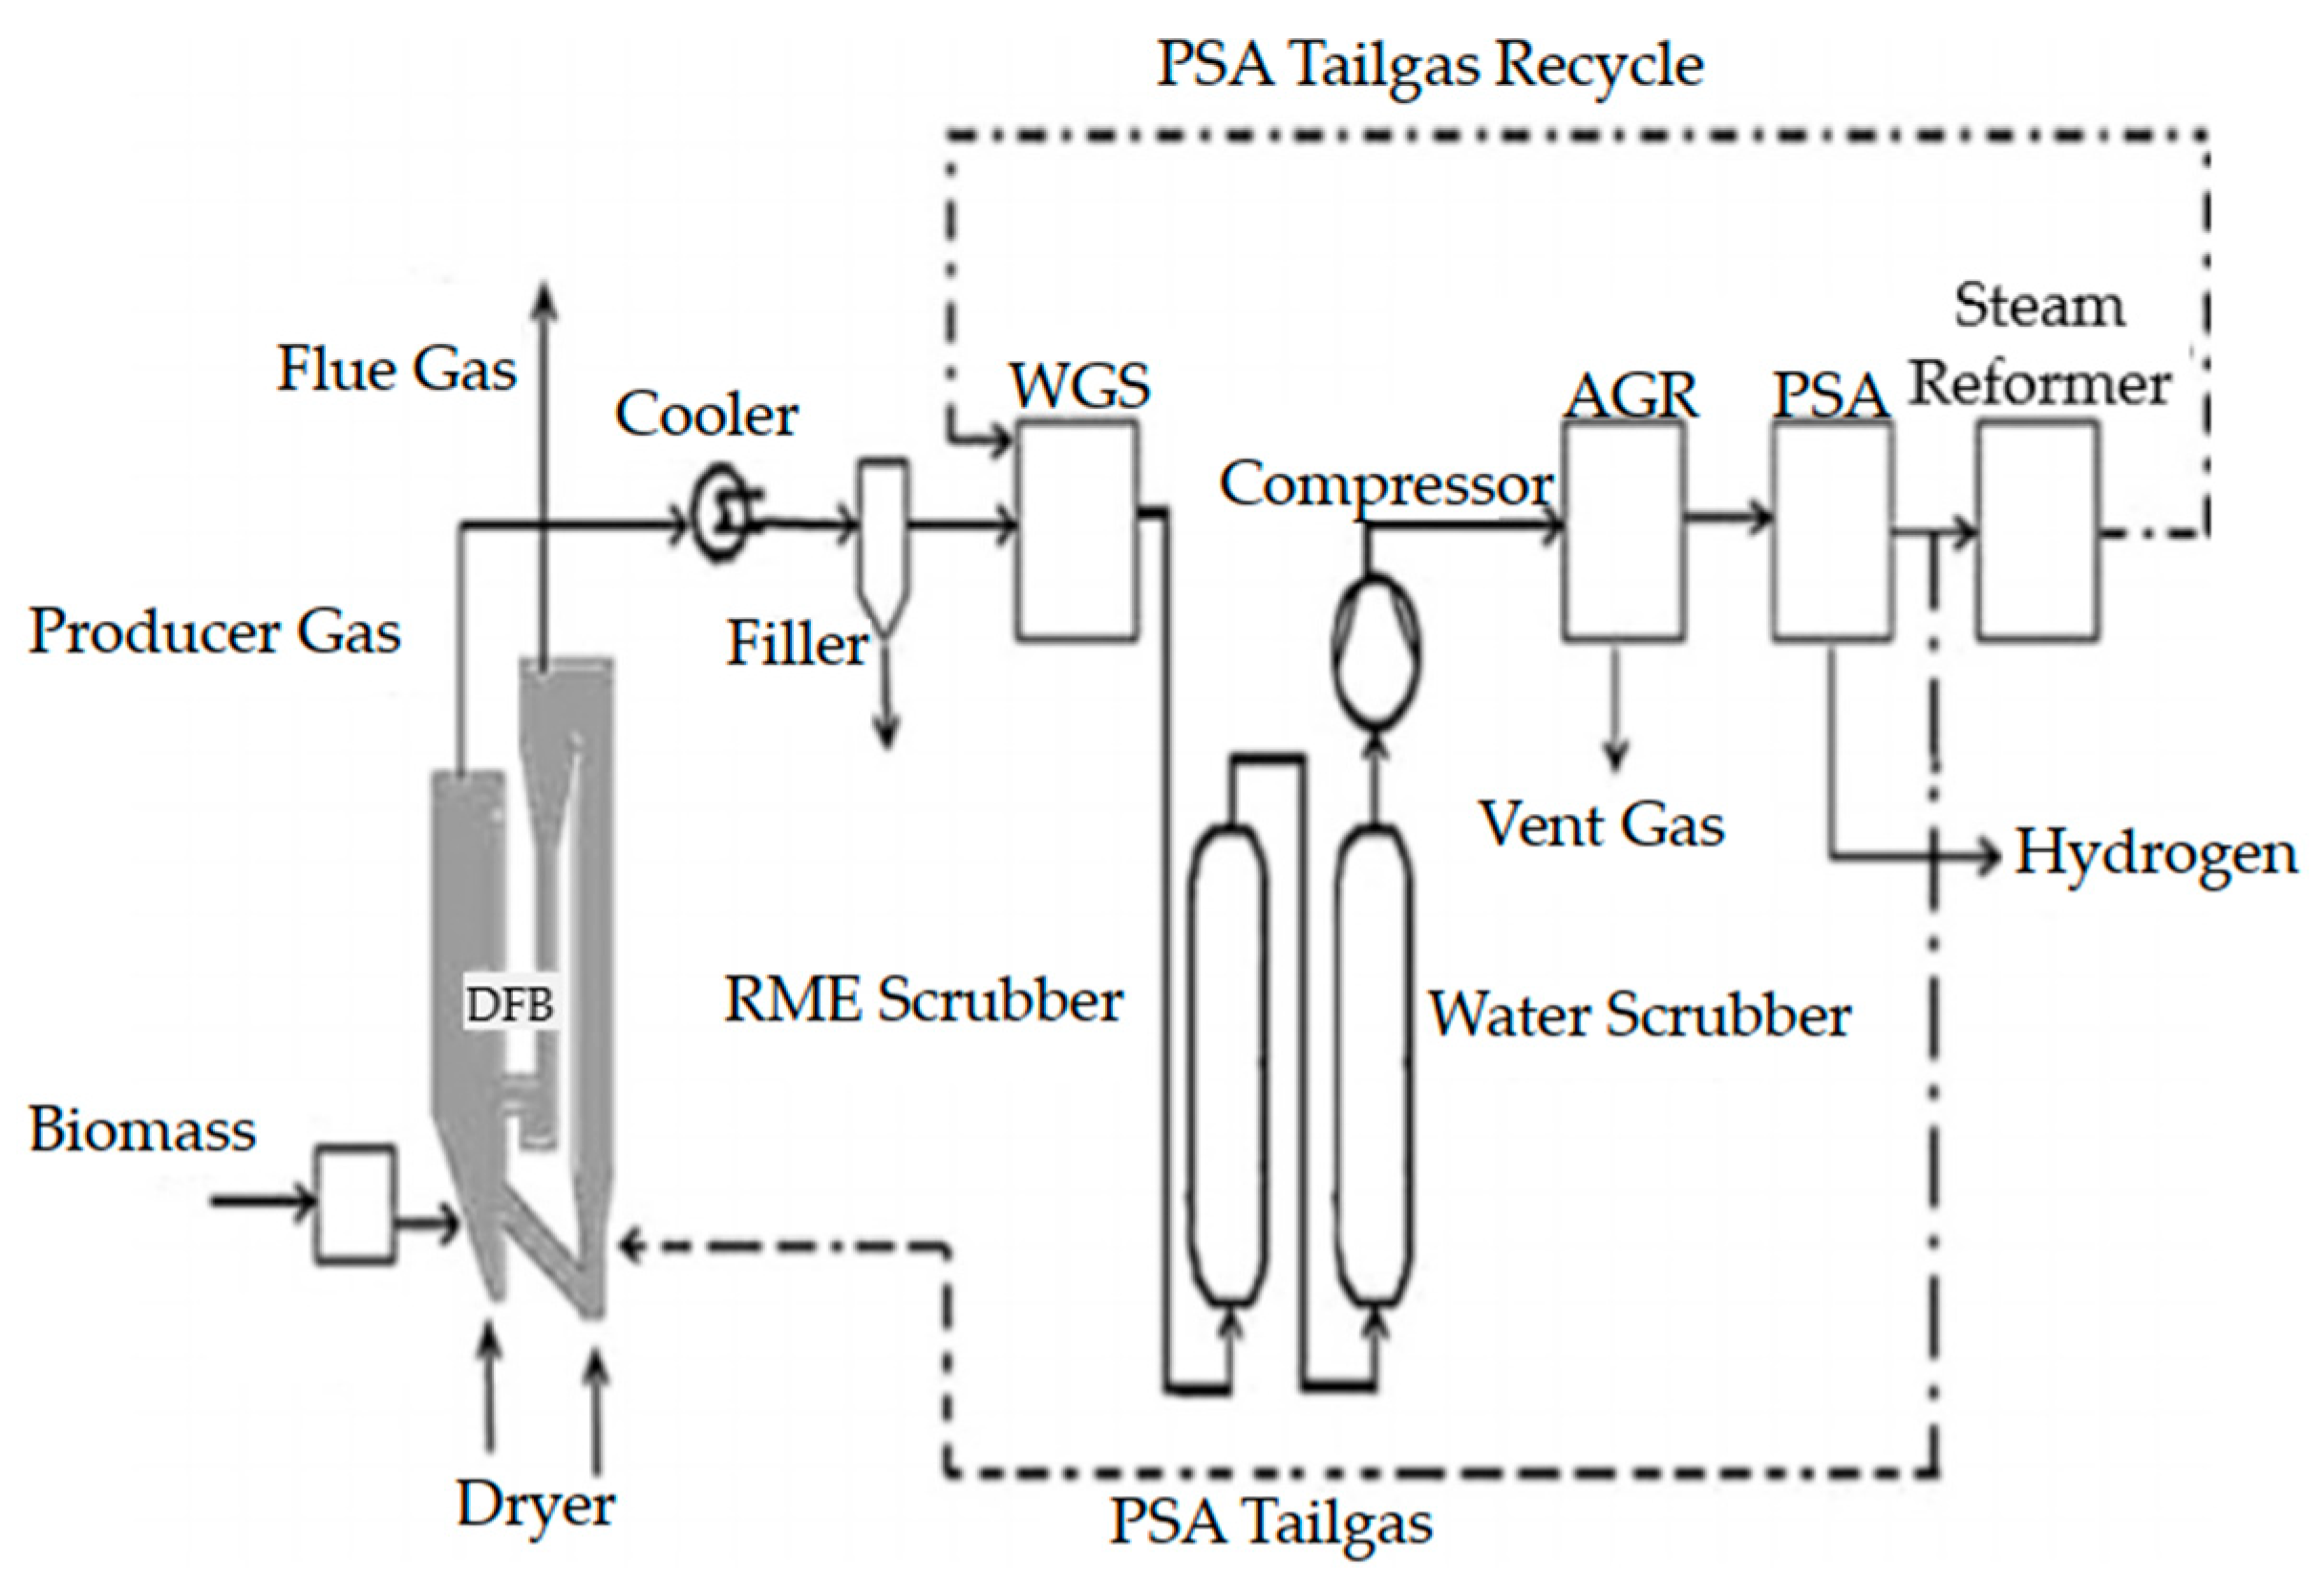
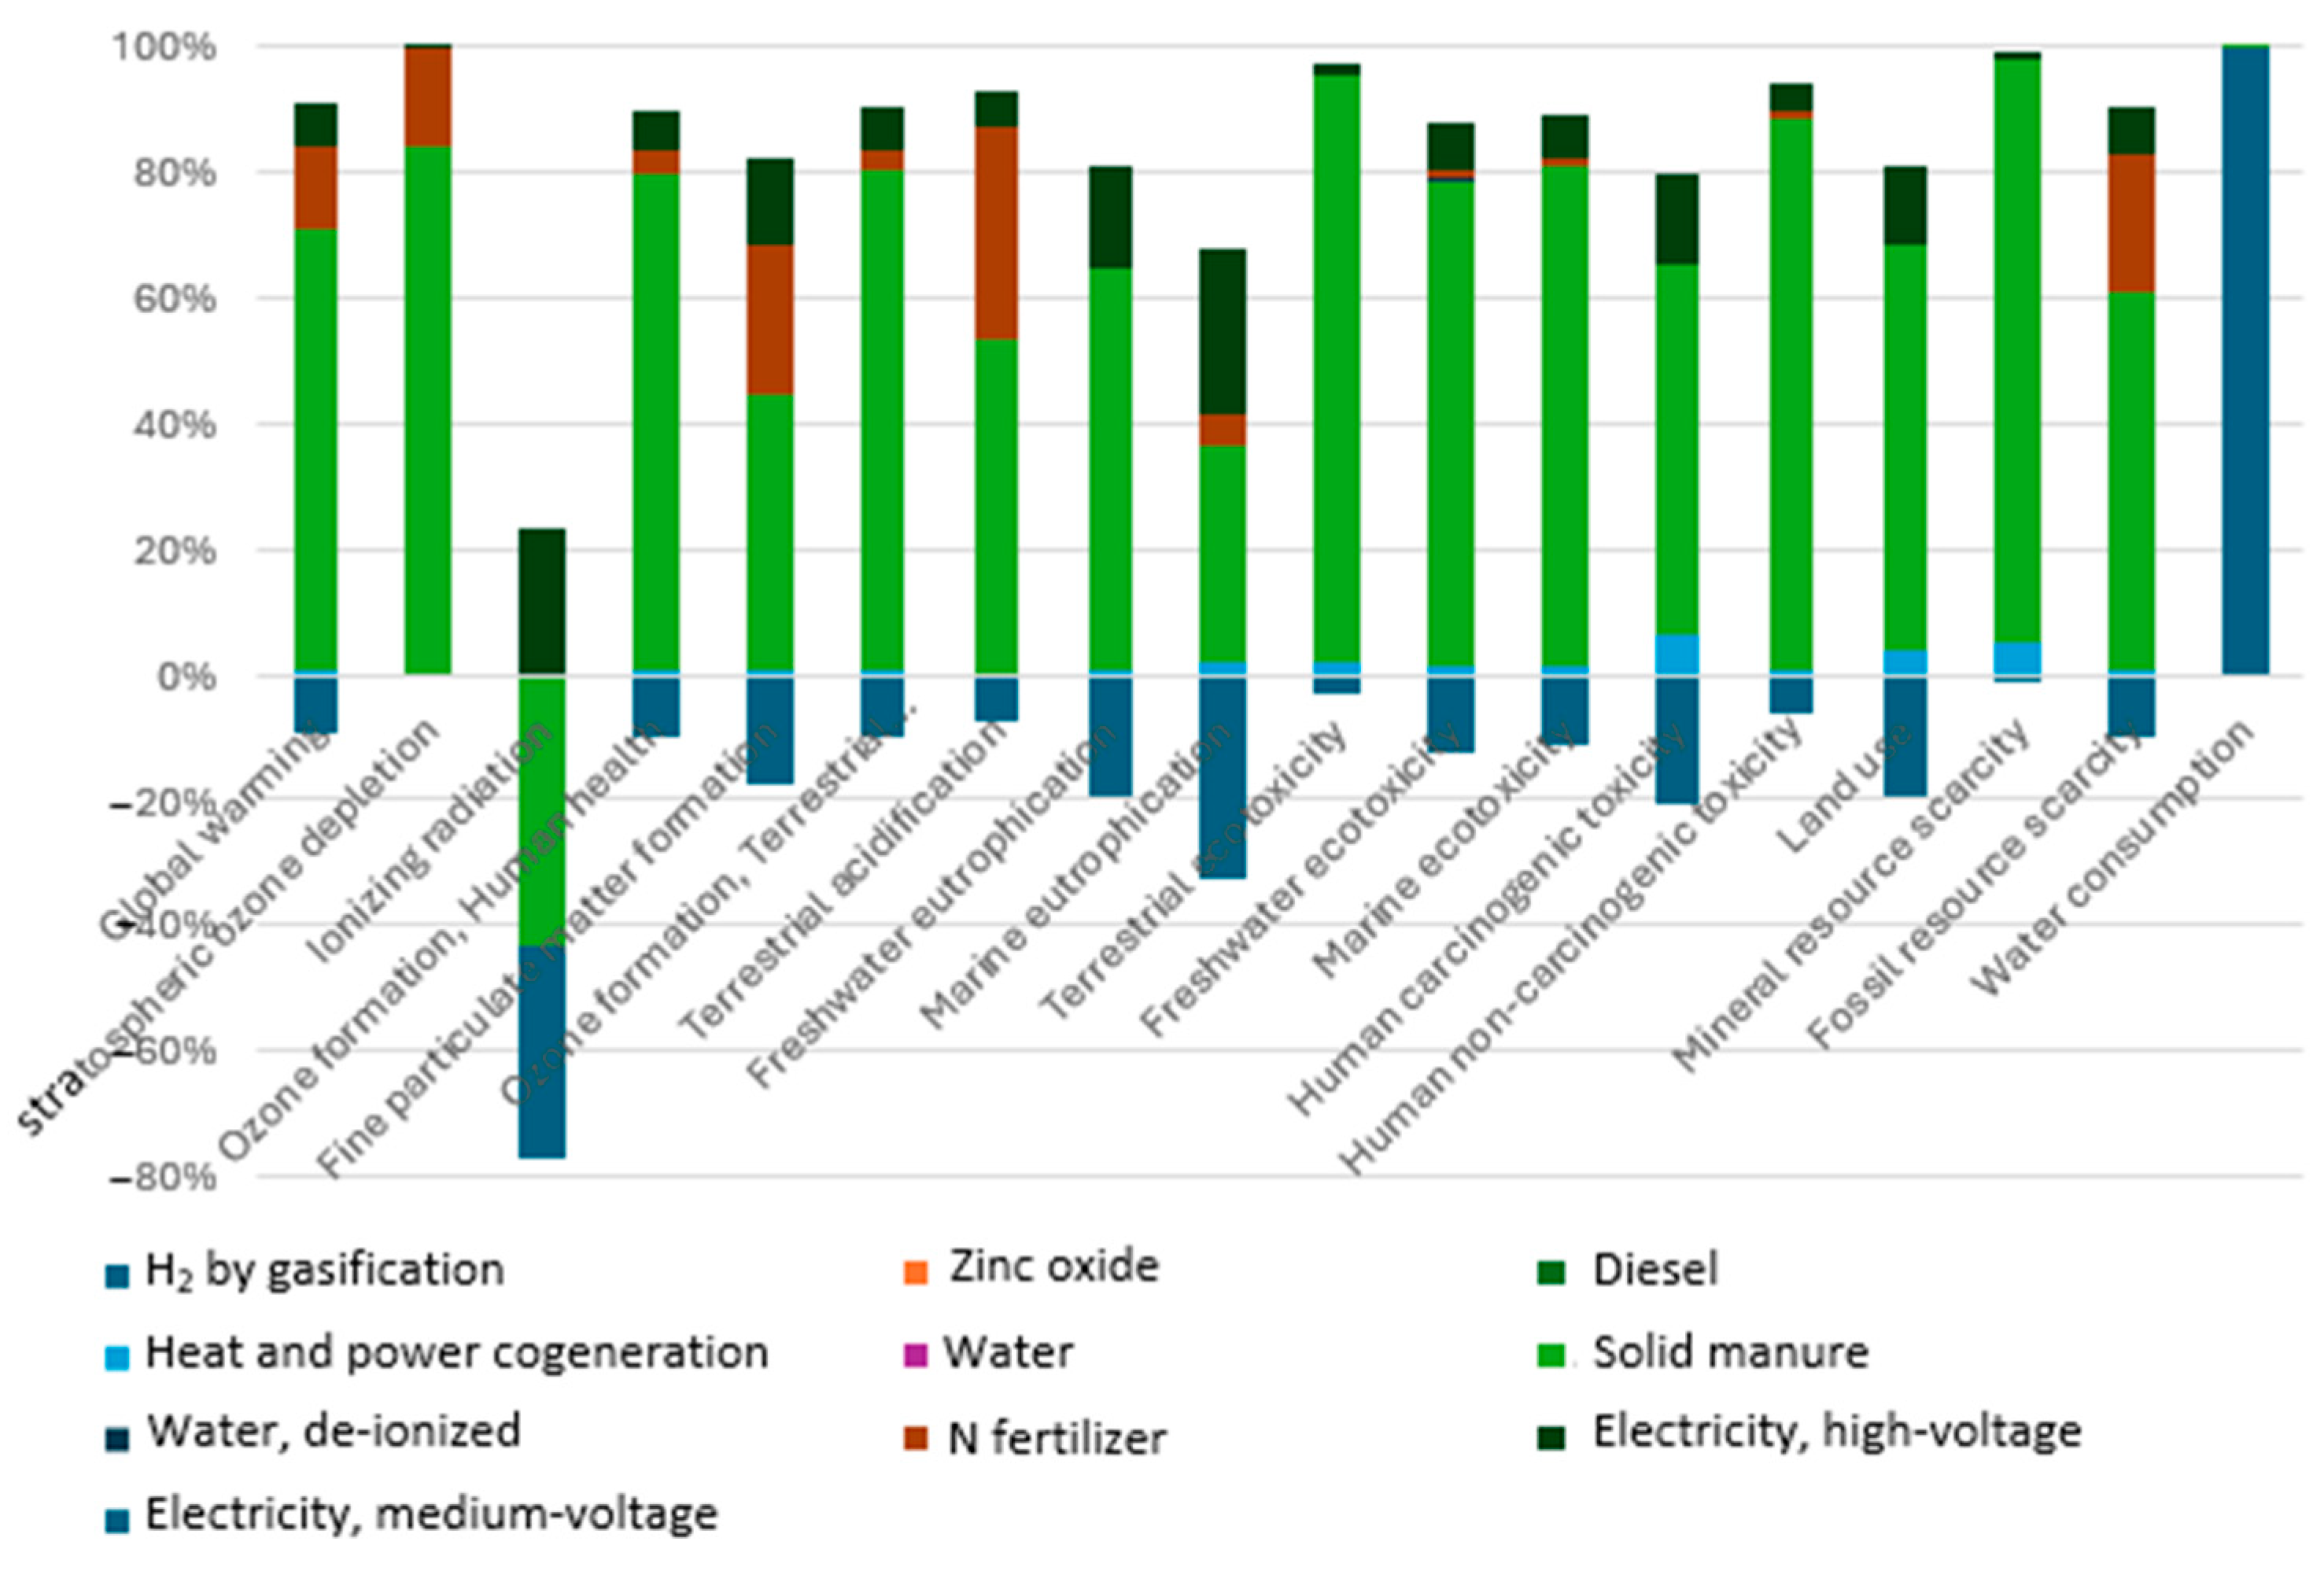
3.1.2. Agricultural Residue Gasification

Figure 6 illustrates the environmental profile of hydrogen (H2) production via agricultural residue gasification, showing a global warming potential (GWP) of 1.30 kg CO2-eq/kg H2, which is 4.89 times lower than that of biogas reforming. This significant reduction aligns with Chang et al. (2009) [51], who attributed such outcomes to the carbon-neutral nature of biomass feedstocks, which offset process-related emissions. However, ozone depletion (2.14 × 10⁻⁵ kg CFC11-eq) and ionizing radiation (−0.0355 kBq Co-60-eq) remain notable, driven by reliance on grid electricity, a trend also observed in electrolysis systems (Bareiß et al., 2019) [47]. Freshwater eutrophication (0.0005 kg P-eq) and marine ecotoxicity (0.15 kg 1,4-DCB-eq) are linked to nitrogen fertilizer use and ash emissions, mirroring Valente et al. (2017) [48], who emphasized nutrient runoff as a systemic issue in biomass-based systems. The mineral resource scarcity value (0.0106 kg Cu-eq) reflects the material demands associated with zinc oxide and solid manure usage. Water consumption (5.37 m3/kg H2), while higher than biogas reforming, remains lower than that of fossil-based methods, though advanced dry gasification technologies could further reduce this. Overall, gasification’s lower GWP and fossil resource depletion (3.20 vs. 10.42 kg oil-eq) position it as a promising low-carbon pathway, contingent on renewable energy integration and optimized feedstock management to address trade-offs in water use and material efficiency.
Figure 6 also shows that “electricity and medium-voltage” yields negative environmental impacts across all categories, while “manure” contributes to negative values, specifically in the ionizing radiation category. These negative values indicate environmental credits resulting from coproduct advantages and the avoidance of certain processes. The gasification system generates excess electricity that substitutes conventional grid electricity, typically sourced from fossil fuels or nuclear energy, thus mitigating impacts like greenhouse gas emissions and ionizing radiation. The utilization of solid manure as feedstock mitigates emissions associated with conventional disposal methods and decreases dependence on energy-intensive inputs, such as synthetic fertilizers. These contributions illustrate the potential of renewable feedstocks and energy recovery to improve the environmental performance of hydrogen production. However, some inputs still exert environmental burdens due to the resource use and emissions generated during their production, transportation, or utilization within the gasification system.
The Cumulative Energy Demand (CED) and Non-Renewable Energy (NRE) use are critical indicators of hydrogen production systems’ energy intensity and sustainability. The C E D represents the total amount of primary energy consumed throughout a product’s life cycle—including both renewable and non-renewable sources—while NRE accounts only for the fraction derived from fossil-based and nuclear sources. The CED is typically calculated using Equation (9):
C E D = i = 1 n E i × E F i
where E i is the quantity of input i (e.g., electricity, diesel) and E F i is its energy factor in MJ/unit. For N R E , the non-renewable share of total energy is calculated using Equation (10):
N R E = j = 1 m E j × E F j n o n - r e n e w a b l e
where Ej represents the quantity of input j that is non-renewable (e.g., coal, natural gas, diesel). EFj is the energy factor of non-renewable input j expressed in MJ per unit of the input.
In this study, biogas reforming consumed a higher CED of approximately 1.95 MJ/kg H2, primarily due to the electricity demand during the anaerobic digestion and reforming stages, with most energy sourced from the fossil-fueled grid. Conversely, agricultural residue gasification exhibited a lower total CED of about 0.685 MJ/kg H2 and significantly reduced NRE use due to the partial integration of renewable cogeneration systems for electricity. These findings also emphasize the superior energy sustainability of gasification, complementing its environmental advantages demonstrated through LCA.

3.2. Comparative LCA of Hydrogen Production: Biogas Reforming vs. Agricultural Residue Gasification

Table 5 presents a comparative LCA of hydrogen production processes, demonstrating that agricultural residue gasification outperforms biogas reforming in nearly all environmental impact categories.

3.2.1. Global Warming Potential

One of the most crucial impact categories analyzed is global warming potential (GWP), measured in kg CO2 equivalent per kg of hydrogen produced. As depicted in Table 5, the GHG emissions from biogas reforming (5.0471 kg CO2 eq) are significantly higher than those from gasification (1.2987 kg CO2 eq), primarily due to reduced reliance on fossil-based electricity and methane emissions. This indicates that biogas reforming generates 4.89 times more CO2 emissions, reinforcing the environmental advantage of gasification in mitigating climate change. Figure 5 and Figure 6 further highlight these differences, showing the substantial contribution of process emissions in biogas reforming to overall environmental burdens. These findings align with the work of previous researchers [30,31,32,33,34,35,36,37,38,39,40,41,42], who reported that thermochemical gasification of biomass results in substantially lower GHG emissions than reforming-based hydrogen production due to the reduced reliance on fossil carbon sources.

3.2.2. Ozone Depletion and Ionizing Radiation Impact

Stratospheric ozone depletion potential (SOD) is found to be slightly higher in biogas reforming (2.72936 × 10⁻⁵ kg CFC11 eq) than in gasification (2.14344 × 10⁻⁵ kg CFC11 eq), though the difference is relatively minor. However, the ionizing radiation impact is notably negative (−0.0355 kBq Co-60 eq) for gasification, suggesting a potential benefit in certain scenarios. In contrast, biogas reforming has a positive impact value of 0.3729 kBq Co-60 eq, indicating higher environmental burdens in this category. Biogas reforming contributed to higher levels of radioactive emissions due to the energy-intensive nature of the process and the reliance on fossil-derived methane. In contrast, gasification processes are associated with lower radiative impacts, particularly when using renewable feedstock.

3.2.3. Human and Ecosystem Toxicity

This study also assessed the toxicity impacts on human health and ecosystems. The human non-carcinogenic toxicity (HNCT) impact from biogas reforming (23.88 kg 1,4-DCB eq) is substantially higher compared to gasification (1.506 kg 1,4-DCB eq). Similarly, terrestrial ecotoxicity (TET) is much more pronounced in biogas reforming (33.44 kg 1,4-DCB eq) than in gasification (4.15 kg 1,4-DCB eq), underscoring the lower environmental impact of gasification in terms of chemical toxicity. Figure 4 and Figure 5 visually illustrate these differences, emphasizing the higher environmental burdens associated with biogas reforming across multiple impact categories. Table 5 shows that biogas reforming generates higher toxic emissions due to residual contaminants in feedstocks and the combustion of fossil-based gas. On the other hand, biomass gasification benefits from cleaner combustion pathways, reducing hazardous emissions.

3.2.4. Particulate Matter and Acidification Effects

Fine particulate matter formation (FPMF) is significantly higher in biogas reforming (0.0243 kg PM2.5 eq) compared to gasification (0.00151 kg PM2.5 eq). This suggests that biogas reforming contributes more to air pollution, with potential respiratory health risks. Additionally, terrestrial acidification (TA) is markedly greater for biogas reforming (0.0120 kg SO2 eq) than for gasification (0.0004788 kg SO2 eq), reinforcing the lower environmental burden of gasification. These results align with findings of Ilulianelli et al. (2021) [19], who demonstrated that hydrogen production from biogas results in higher emissions of sulfur oxides and nitrogen oxides, leading to increased acidification potential. Conversely, agricultural residue gasification minimizes these emissions due to more controlled combustion conditions and efficient gas cleaning systems.

3.2.5. Fossil and Mineral Resource Scarcity

Fossil resource scarcity (FRS) is a critical concern in hydrogen production sustainability. This study shows that gasification requires significantly fewer fossil resources (3.203 kg oil eq) compared to biogas reforming (10.416 kg oil eq). Similarly, mineral resource scarcity (MRS) is notably higher in biogas reforming (0.1168 kg Cu eq) than in gasification (0.0106 kg Cu eq), demonstrating that gasification is a more resource-efficient process.

3.2.6. Water Consumption and Land Use

A unique finding of this study is the water consumption required for both processes. While agricultural residue gasification requires significantly more water (5.3737 m3) than biogas reforming (0.0485 m3), the overall environmental benefits of gasification still outweigh this drawback. Additionally, the land use (LU) impacts are lower in gasification (0.0116 m2 a crop eq) compared to biogas reforming (0.0358 m² a crop eq), making gasification more sustainable in terms of land requirements. According to Kalinci et al. (2012) [23], biomass gasification systems often require substantial water input for gas cleaning and cooling, though advanced technologies, such as dry gas cleaning, could mitigate this impact. Meanwhile, the land use advantage of gasification aligns with other studies highlighting that agricultural residue utilization reduces pressure on arable land compared to energy crops used for biogas production.
The superior GWP gasification performance emphasizes that carbon-neutral biomass feedstocks offset emissions from thermochemical processes. The lower fossil resource scarcity linked to biomass-based systems reduces the dependency on non-renewable catalysts and infrastructure. Gasification requires a higher water demand for biomass pretreatment, and gas cleaning indicates that it involves water-intensive stages. Though lower than biogas reforming, land use impacts highlight the need for sustainable agricultural residue sourcing to avoid competition with food production. The reduced toxicity in gasification is associated with fossil-based reforming, with higher heavy metal leaching. While gasification’s water use remains a challenge, its overall environmental profile positions it as a more sustainable alternative to both biogas reforming and conventional steam methane reforming (SMR), particularly when paired with renewable energy integration. These findings underscore the importance of process optimization and feedstock management in advancing low-carbon hydrogen economies.

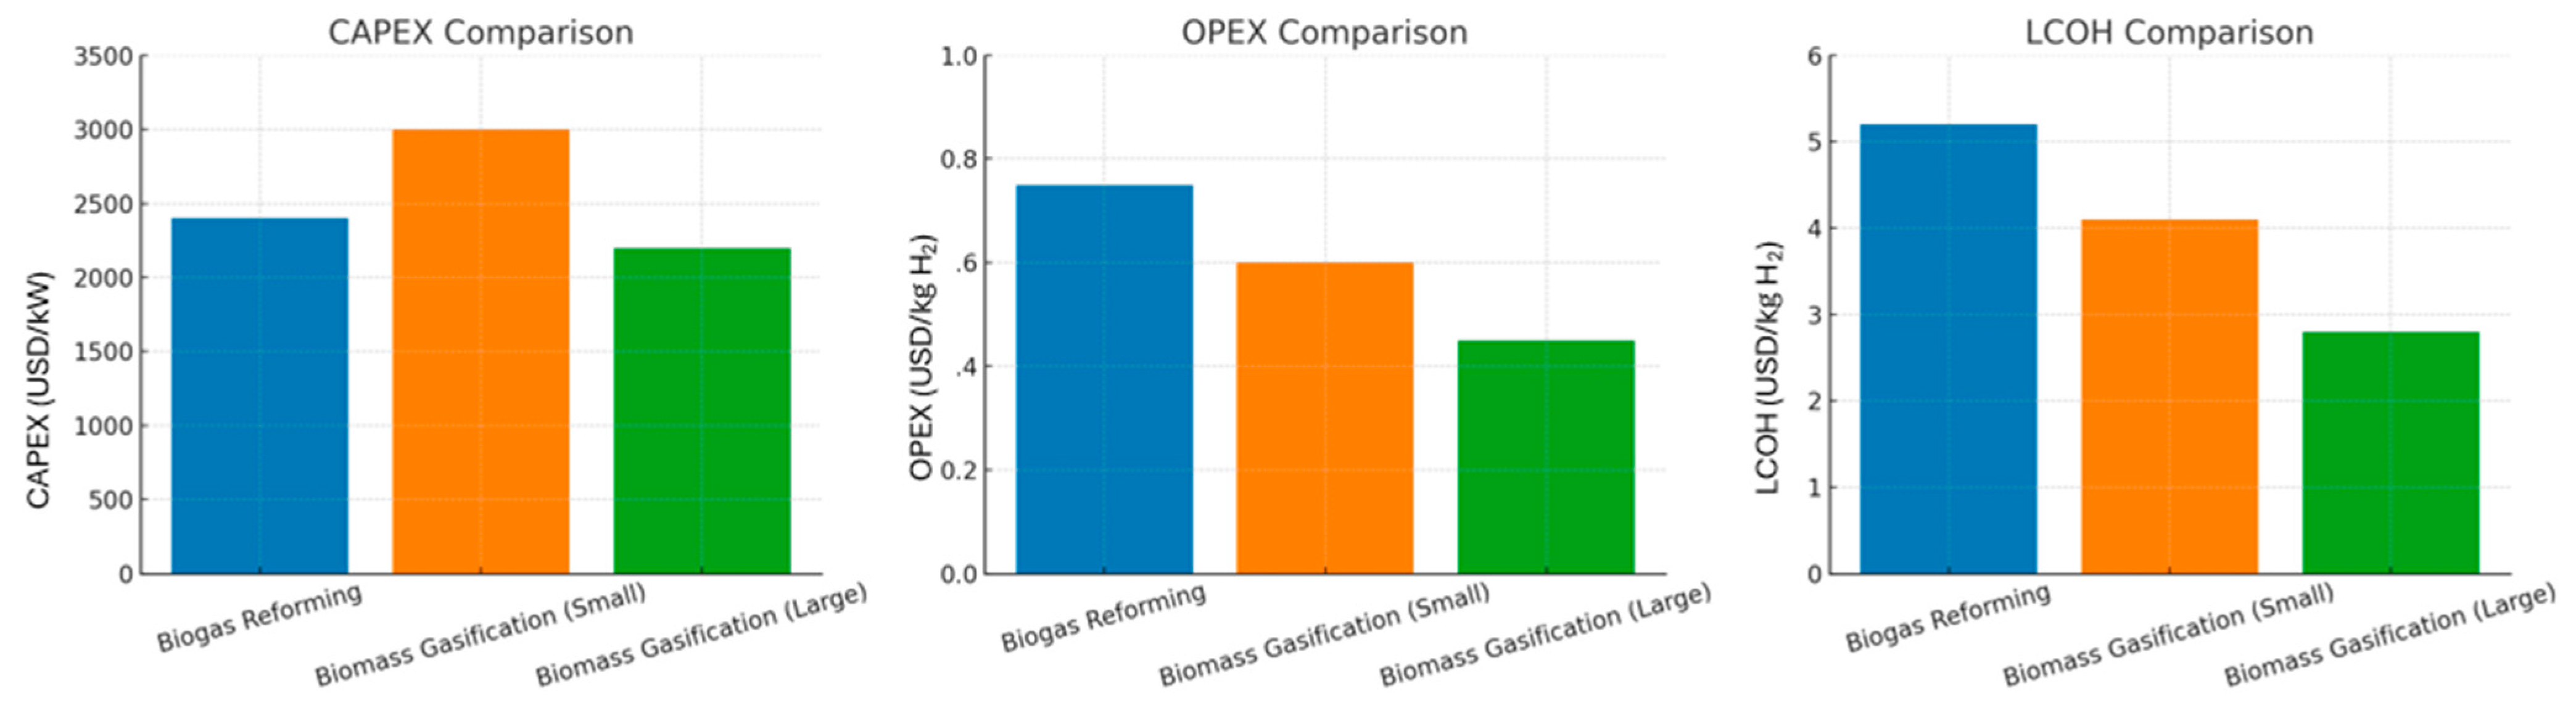
3.3. Socio-Economic Analysis of Hydrogen Production Pathways

To complement the environmental findings, a socio-economic analysis was conducted to provide a fuller picture of sustainability, comparing hydrogen production from biogas reforming and agricultural residue gasification. Biogas reforming, typically applied in urban contexts with established waste management systems, offers socio-economic benefits, such as improved sanitation, waste valorization, and employment opportunities in system operation and maintenance. However, its economic viability is hindered by high capital costs and feedstock variability, which require supportive policies and investments. In contrast, agricultural residue gasification promotes decentralized energy systems and rural economic development by creating jobs in biomass collection and plant operations while also mitigating environmental issues, like open biomass burning. Despite its higher technical and infrastructural requirements, gasification offers long-term potential when supported by stable biomass supply chains and capacity-building efforts. From a policy standpoint, both technologies align with circular economy and greenhouse gas reduction goals, and their widespread adoption can be facilitated through targeted subsidies, carbon credits, and development programs.
In addition to environmental and socio-economic aspects, a techno-economic assessment provides further insight into the feasibility of biogas reforming and biomass gasification. This includes capital expenditure (CAPEX), operational expenditure (OPEX), and the levelized cost of hydrogen (LCOH), defined as the average cost per unit of hydrogen produced over the lifetime of the system.

3.3.1. Capital Expenditure (CAPEX)

Capital expenditure (CAPEX) encompasses all the expenses associated with establishing the hydrogen production system, which includes reforming or gasification units, purification systems, compressors, and other components. CAPEX is typically calculated as the sum of all major component costs (Equation (11)):
C A P E X = r = 1 n C i
where C i denotes the cost of component i and n is the total number of components. For comparative analysis, CAPEX is often normalized by rated system capacity (Equation (12)):
C A P E X = T o t a l   i n s t a l l e d   c o s t R a t e d   c a p a c i t y   ( k W   o r   k g   H 2 d a y

3.3.2. Operational Expenditure (OPEX)

Operational expenditure (OPEX) encompasses the recurring costs during plant operation, including feedstock procurement, electricity consumption, labor, maintenance, and consumables. OPEX is typically calculated using Equations (13) and (14):
O P E X a n n u a l = F u e l   C o s t + E l e c t r i c i t y   C o s t + L a b o r   C o s t + M a i n t a i n a n c e   C o s t + M i s c e l l a n e o u s
O P E X n o r m = O P E X a n n u a l A n n u a l   p r o d u c t i o n   H 2   ( k g )                
where
  • Fuel cost = biomass/biogas feedstock cost;
  • Electricity = power consumption × unit price;
  • Labor = operators and technicians;
  • Maintenance = 2–5% of CAPEX annually (commonly used assumption);
  • Miscellaneous = catalyst, consumables, and disposal fees.

3.3.3. Levelized Cost of Hydrogen (LCOH)

The LCOH is the average cost to produce one kilogram of hydrogen over the entire life of a production plant. It includes both operating costs (OPEX) and capital costs (CAPEX), adjusted over time using a capital recovery factor (CRF) (Equation (15)):
L C O H = C A P E X × C R F + O P E X A n n u a l   H 2   P r o d u c t i o n
where C R F = i 1 + i n i i + 1 n 1 (capital recovery factor), i = discount rate (assumed 8%), and n = plant lifetime (25 years).
The LCOH is a key indicator for comparing hydrogen production methods and assessing their economic feasibility. A lower LCOH means a more cost-effective hydrogen supply, making it essential for planning large-scale, sustainable energy systems.
Figure 7 summarizes the comparative techno-economic evaluation of the hydrogen production pathways, including biogas reforming, biomass gasification (small-scale), and biomass gasification (large-scale), highlighting significant differences in the capital expenditure (CAPEX), operating expenditure (OPEX), and levelized cost of hydrogen (LCOH). Biogas reforming shows a moderate CAPEX of approximately USD 2400/kW, reflecting the maturity and standardization of reforming technology. However, its OPEX is the highest among the three options, reaching around USD 0.75/kg H2, likely due to the relatively high cost and variability in biogas feedstock and the operational demands of reforming processes. Consequently, biogas reforming results in the highest LCOH at about USD 5.2/kg H2, making it the least economically favorable option in this comparison. On the other hand, biomass gasification at a small scale exhibits the highest CAPEX, approximately USD 3000/kW, attributed to the lack of scale economies and the complexity of biomass handling systems. Despite this, its OPEX is moderately lower, at around USD 0.60/kg H2, leading to a reduced LCOH of about USD 4.0/kg H2 compared to biogas reforming. The most economically viable option is biomass gasification at a large scale, which benefits from significant cost reductions due to scale. This pathway demonstrates the lowest CAPEX (approximately USD 2200/kW) and OPEX (around USD 0.45/kg H2), resulting in the most competitive LCOH of approximately USD 2.8/kg H2.
These findings underscore the critical role of scale in enhancing the economic performance of biomass-based hydrogen production technologies. While small-scale systems offer flexibility and decentralized applications, the cost advantages of large-scale biomass gasification suggest it holds the greatest promise for cost-effective hydrogen generation.

4. Conclusions

This study conducted a comparative LCA of hydrogen production through biogas reforming and agricultural residue gasification, offering critical insights into their environmental performance. The results demonstrate that agricultural residue gasification exhibits a substantially lower global warming potential (GWP) of 1.30 kg CO2-eq/kg H2, which is 4.89 times lower than biogas reforming (5.047 kg CO2-eq/kg H2). This advantage stems from gasification’s reliance on carbon-neutral feedstocks, which offset process-related emissions and reduce dependency on fossil-based energy inputs. Conversely, biogas reforming’s higher GWP is driven by methane leakage during anaerobic digestion and fossil-intensive electricity consumption.
While gasification outperforms biogas reforming in most environmental impact categories, including fossil resource scarcity, toxicity, and eutrophication, it presents trade-offs in water consumption (5.37 m3/kg H2 vs. 0.05 m3/kg H2) and land use. These challenges highlight the need for optimized feedstock management to prevent competition with food production and the adoption of dry gasification technologies to mitigate water demands. Biogas reforming, though less sustainable overall, benefits from lower water usage and existing waste valorization pathways, emphasizing the importance of methane leakage mitigation and renewable energy integration.
The findings underscore agricultural residue gasification as a promising pathway for low-carbon hydrogen production, aligning with global decarbonization goals. However, achieving sustainability requires addressing systemic inefficiencies, such as grid electricity reliance and emission control during syngas cleanup. Future research and policy efforts should jointly prioritize the advancement of agricultural residue gasification, particularly in biomass-rich regions, by integrating renewable energy sources, improving gasification technologies, and aligning life cycle assessments with socio-economic analyses to support holistic and sustainable energy planning.

Author Contributions

Conceptualization, M.A. and K.P.; methodology, M.A. and M.L.; software, M.A.; resources, K.P.; writing—original draft preparation, M.A.; writing—review and editing, M.A.; supervision, K.P. and M.L.; funding acquisition, K.P. All authors have read and agreed to the published version of the manuscript.

Funding

This publication was funded by the research subsidy allocated for 2025 (08/030/BK_25/0151).

Institutional Review Board Statement

Not applicable.

Informed Consent Statement

Not applicable.

Data Availability Statement

This study’s original contributions are detailed in this article; any further inquiries can be addressed to the corresponding author.

Acknowledgments

The authors express their gratitude to the Silesian University of Technology for supporting this research through funds and materials.

Conflicts of Interest

The authors declare no conflicts of interest.

Abbreviations

ADanaerobic digestion
ATRautothermal reforming
BFbiogas reforming
CAPEXcapital expenditure
FPMFfine particulate matter formation
FRSfossil resource scarcity
FUfunctional unit
FWEfreshwater eutrophication
FWETfreshwater ecotoxicity
GHGgreenhouse gas
GWPglobal warming potential
HCThuman carcinogenic toxicity
HNCThuman non-carcinogenic toxicity
HTSHigh-Temperature Shift
IRionizing radiation
LCAlife cycle assessment
LCIlife cycle inventory
LCIAlife cycle impact assessment
LCOHlevelized cost of hydrogen
LTSLow-Temperature Shift
LUland use
MEmarine eutrophication
METmarine ecotoxicity
MRSmineral resource scarcity
NGnatural gas
OFHHozone formation, human health
OFTESozone formation, terrestrial ecosystems
OPEXoperating expenditure
POXPartial Oxidation
SGsynthesis gas
SMRsteam methane reforming
SODstratospheric ozone depletion
TAterrestrial acidification
TETterrestrial ecotoxicity
WGSwater–gas shift
WCwater consumption

References

  1. Wang, J.; Azam, W. Natural Resource Scarcity, Fossil Fuel Energy Consumption, and Total Greenhouse Gas Emissions in Top Emitting Countries. Geosci. Front. 2024, 15, 101757. [Google Scholar] [CrossRef]
  2. Chipangamate, N.S.; Nwaila, G.T. Assessment of Challenges and Strategies for Driving Energy Transitions in Emerging Markets: A Socio-Technological Systems Perspective. Energy Geosci. 2024, 5, 100257. [Google Scholar] [CrossRef]
  3. Landrat, M.; Abawalo, M.; Pikoń, K.; Fufa, P.A.; Seyid, S. Assessing the Potential of Teff Husk for Biochar Production through Slow Pyrolysis: Effect of Pyrolysis Temperature on Biochar Yield. Energies 2024, 17, 1988. [Google Scholar] [CrossRef]
  4. Awewomom, J.; Dzeble, F.; Takyi, Y.D.; Ashie, W.B.; Ettey, E.N.Y.O.; Afua, P.E.; Sackey, L.N.A.; Opoku, F.; Akoto, O. Addressing Global Environmental Pollution Using Environmental Control Techniques: A Focus on Environmental Policy and Preventive Environmental Management. Discov. Environ. 2024, 2, 8. [Google Scholar] [CrossRef]
  5. Angelico, R.; Giametta, F.; Bianchi, B.; Catalano, P. Green Hydrogen for Energy Transition: A Critical Perspective. Energies 2025, 18, 404. [Google Scholar] [CrossRef]
  6. Hossain Bhuiyan, M.M.; Siddique, Z. Hydrogen as an Alternative Fuel: A Comprehensive Review of Challenges and Opportunities in Production, Storage, and Transportation. Int. J. Hydrogen Energy 2025, 102, 1026–1044. [Google Scholar] [CrossRef]
  7. Hosseini, S.E.; Abdul Wahid, M.; Jamil, M.M.; Azli, A.A.M.; Misbah, M.F. A Review on Biomass-Based Hydrogen Production for Renewable Energy Supply. Int. J. Energy Res. 2015, 39, 1597–1615. [Google Scholar] [CrossRef]
  8. Methane Steam Reforming—An Overview ScienceDirect Topics. Available online: https://www.sciencedirect.com/topics/engineering/methane-steam-reforming (accessed on 11 March 2025).
  9. Timmerberg, S.; Kaltschmitt, M.; Finkbeiner, M. Hydrogen and Hydrogen-Derived Fuels through Methane Decomposition of Natural Gas—GHG Emissions and Costs. Energy Convers. Manag. X 2020, 7, 100043. [Google Scholar] [CrossRef]
  10. Akobi, C.O. Biohydrogen and Biomethane Production from Lignocellulosic Biomass. Master’s Thesis, The University of Western Ontario, London, ON, Canada, 2016. [Google Scholar]
  11. Hajjaji, N.; Martinez, S.; Trably, E.; Steyer, J.-P.; Helias, A. Life Cycle Assessment of Hydrogen Production from Biogas Reforming. Int. J. Hydrogen Energy 2016, 41, 6064–6075. [Google Scholar] [CrossRef]
  12. Zhou, Y. Life-Cycle Greenhouse Gas Emissions of Biomethane and Hydrogen Pathways in the European Union; The International Council of Clean Transportation: Washington, DC, USA, 2021. [Google Scholar]
  13. Meena, P.K.; Kumar, D.; Singh, L.; Sharma, S.; Didwania, M. Evaluating the Sustainability of Biohydrogen, Biogas, and Biohythane Generation from Agricultural, Industrial, and Municipal Waste Sources. Biofuels Bioprod. Biorefining 2025, 19, 485–507. [Google Scholar] [CrossRef]
  14. Di Marcoberardino, G.; Liao, X.; Dauriat, A.; Binotti, M.; Manzolini, G. Life Cycle Assessment and Economic Analysis of an Innovative Biogas Membrane Reformer for Hydrogen Production. Processes 2019, 7, 86. [Google Scholar] [CrossRef]
  15. González, R.; Peña, D.C.; Gómez, X. Anaerobic Co-Digestion of Wastes: Reviewing Current Status and Approaches for Enhancing Biogas Production. Appl. Sci. 2022, 12, 8884. [Google Scholar] [CrossRef]
  16. Jameel, M.K.; Mustafa, M.A.; Ahmed, H.S.; Mohammed, A.J.; Ghazy, H.; Shakir, M.N.; Lawas, A.M.; Mohammed, S.K.; Idan, A.H.; Mahmoud, Z.H.; et al. Biogas: Production, Properties, Applications, Economic and Challenges: A Review. Results Chem. 2024, 7, 101549. [Google Scholar] [CrossRef]
  17. Kasinath, A.; Fudala-Ksiazek, S.; Szopinska, M.; Bylinski, H.; Artichowicz, W.; Remiszewska-Skwarek, A.; Luczkiewicz, A. Biomass in Biogas Production: Pretreatment and Codigestion. Renew. Sustain. Energy Rev. 2021, 150, 111509. [Google Scholar] [CrossRef]
  18. Zhao, X.; Joseph, B.; Kuhn, J.; Ozcan, S. Biogas Reforming to Syngas: A Review. iScience 2020, 23, 101082. [Google Scholar] [CrossRef]
  19. Iulianelli, A.; Manisco, M.; Bion, N.; Valant, A.L.; Epron, F.; Colpan, O.; Esposito, E.; Jansen, J.C.; Gensini, M.; Caravella, A. Sustainable H2 Generation via Steam Reforming of Biogas in Membrane Reactors: H2S Effects on Membrane Performance and Catalytic Activity. Int. J. Hydrogen Energy 2021, 46, 29183–29197. [Google Scholar] [CrossRef]
  20. Iulianelli, A.; Liguori, S.; Huang, Y.; Basile, A. Model Biogas Steam Reforming in a Thin Pd-Supported Membrane Reactor to Generate Clean Hydrogen for Fuel Cells. J. Power Sources 2015, 273, 25–32. [Google Scholar] [CrossRef]
  21. Kumar, R.; Kumar, A.; Pal, A. Overview of Hydrogen Production from Biogas Reforming: Technological Advancement. Int. J. Hydrogen Energy 2022, 47, 34831–34855. [Google Scholar] [CrossRef]
  22. Rubinsin, N.J.; Karim, N.A.; Timmiati, S.N.; Lim, K.L.; Isahak, W.N.R.W.; Pudukudy, M. An Overview of the Enhanced Biomass Gasification for Hydrogen Production. Int. J. Hydrogen Energy 2024, 49, 1139–1164. [Google Scholar] [CrossRef]
  23. Kalinci, Y.; Hepbasli, A.; Dincer, I. Life Cycle Assessment of Hydrogen Production from Biomass Gasification Systems. Int. J. Hydrogen Energy 2012, 37, 14026–14039. [Google Scholar] [CrossRef]
  24. Muresan, M.; Cormos, C.C.; Agachi, P.S. Comparative Life Cycle Analysis for Gasification-Based Hydrogen Production Systems. J. Renew. Sustain. Energy 2014, 6, 013131. [Google Scholar] [CrossRef]
  25. Singh, A.; Shivapuji, A.M.; Dasappa, S. Hydrogen Production through Agro-Residue Gasification and Adsorptive Separation. Appl. Therm. Eng. 2023, 234, 121247. [Google Scholar] [CrossRef]
  26. Moreno, J.; Dufour, J. Life Cycle Assessment of Hydrogen Production from Biomass Gasification. Evaluation of Different Spanish Feedstocks. Int. J. Hydrogen Energy 2013, 38, 7616–7622. [Google Scholar] [CrossRef]
  27. Narnaware, S.L.; Panwar, N.L. Catalysts and Their Role in Biomass Gasification and Tar Abetment: A Review. Biomass Convers. Biorefinery 2021. [Google Scholar] [CrossRef]
  28. Kauffman, N.; Hayes, D.; Brown, R. A Life Cycle Assessment of Advanced Biofuel Production from a Hectare of Corn. Fuel 2011, 90, 3306–3314. [Google Scholar] [CrossRef]
  29. Christoforou, E.A.; Fokaides, P.A. Life Cycle Assessment (LCA) of Olive Husk Torrefaction. Renew. Energy 2016, 90, 257–266. [Google Scholar] [CrossRef]
  30. Wijayasekera, S.C.; Hewage, K.; Hettiaratchi, P.; Siddiqui, O.; Razi, F.; Pokhrel, D.; Sadiq, R. Sustainability of Waste-to-Hydrogen Conversion Pathways: A Life Cycle Thinking-Based Assessment. Energy Convers. Manag. 2022, 270, 116218. [Google Scholar] [CrossRef]
  31. Zheng, X.; Wang, J.; Huang, J.; Xu, X.; Tang, J.; Hou, P.; Han, W.; Li, H. Environmental Impact Assessment of a Combined Bioprocess for Hydrogen Production from Food Waste. Waste Manag. 2024, 173, 152–159. [Google Scholar] [CrossRef]
  32. Arfan, M.; Eriksson, O.; Wang, Z.; Soam, S. Life Cycle Assessment and Life Cycle Costing of Hydrogen Production from Biowaste and Biomass in Sweden. Energy Convers. Manag. 2023, 291, 117262. [Google Scholar] [CrossRef]
  33. Mio, A.; Barbera, E.; Massi Pavan, A.; Bertucco, A.; Fermeglia, M. Sustainability Analysis of Hydrogen Production Processes. Int. J. Hydrogen Energy 2024, 54, 540–553. [Google Scholar] [CrossRef]
  34. Kolahchian Tabrizi, M.; Famiglietti, J.; Bonalumi, D.; Campanari, S. The Carbon Footprint of Hydrogen Produced with State-of-the-Art Photovoltaic Electricity Using Life-Cycle Assessment Methodology. Energies 2023, 16, 5190. [Google Scholar] [CrossRef]
  35. Krishnan, S.; Corona, B.; Kramer, G.J.; Junginger, M.; Koning, V. Prospective LCA of Alkaline and PEM Electrolyser Systems. Int. J. Hydrogen Energy 2024, 55, 26–41. [Google Scholar] [CrossRef]
  36. Henriksen, M.S.; Matthews, H.S.; White, J.; Walsh, L.; Grol, E.; Jamieson, M.; Skone, T.J. Tradeoffs in Life Cycle Water Use and Greenhouse Gas Emissions of Hydrogen Production Pathways. Int. J. Hydrogen Energy 2023, 49, 1221–1234. [Google Scholar] [CrossRef]
  37. Salah, C.; Cobo, S.; Pérez-Ramírez, J.; Guillén-Gosálbez, G. Environmental Sustainability Assessment of Hydrogen from Waste Polymers. ACS Sustain. Chem. Eng. 2023, 11, 3238–3247. [Google Scholar] [CrossRef]
  38. Patel, G.H.; Havukainen, J.; Horttanainen, M.; Soukka, R.; Tuomaala, M. Climate Change Performance of Hydrogen Production Based on Life Cycle Assessment. Green Chem. 2024, 26, 992–1006. [Google Scholar] [CrossRef]
  39. Ji, M.; Shi, M.; Wang, J. Life Cycle Assessment of Nuclear Hydrogen Production Processes Based on High Temperature Gas-Cooled Reactor. Int. J. Hydrogen Energy 2023, 48, 22302–22318. [Google Scholar] [CrossRef]
  40. Cho, H.H.; Strezov, V.; Evans, T.J. Environmental Impact Assessment of Hydrogen Production via Steam Methane Reforming Based on Emissions Data. Energy Rep. 2022, 8, 13585–13595. [Google Scholar] [CrossRef]
  41. Weidner, T.; Tulus, V.; Guillén-Gosálbez, G. Environmental Sustainability Assessment of Large-Scale Hydrogen Production Using Prospective Life Cycle Analysis. Int. J. Hydrogen Energy 2023, 48, 8310–8327. [Google Scholar] [CrossRef]
  42. Chisalita, D.-A.; Petrescu, L.; Galusnyak, S.C.; Cormos, C.-C. Environmental Evaluation of Hydrogen Production Employing Innovative Chemical Looping Technologies—A Romanian Case Study. Int. J. Hydrogen Energy 2023, 48, 12112–12128. [Google Scholar] [CrossRef]
  43. Osman, A.I.; Nasr, M.; Mohamed, A.R.; Abdelhaleem, A.; Ayati, A.; Farghali, M.; Al-Muhtaseb, A.H.; Al-Fatesh, A.S.; Rooney, D.W. Life Cycle Assessment of Hydrogen Production, Storage, and Utilization toward Sustainability. Wiley Interdiscip. Rev. Energy Environ. 2024, 13, e526. [Google Scholar] [CrossRef]
  44. Abawalo, M.; Pikoń, K.; Landrat, M. Przegląd oceny cyklu życia produkcji biowodoru w procesie reformingu biogazu. Przem. Chem. 2024, 103, 1497–1501. [Google Scholar] [CrossRef]
  45. Rajabi Hamedani, S.; Villarini, M.; Colantoni, A.; Moretti, M.; Bocci, E. Life Cycle Performance of Hydrogen Production via Agro-Industrial Residue Gasification—A Small Scale Power Plant Study. Energies 2018, 11, 675. [Google Scholar] [CrossRef]
  46. Zhang, H.; Liu, G.; Xue, L.; Zuo, J.; Chen, T.; Vuppaladadiyam, A.; Duan, H. Anaerobic Digestion-Based Waste-to-Energy Technologies Can Halve the Climate Impact of China’s Fast-Growing Food Waste by 2040. J. Clean. Prod. 2020, 277, 123490. [Google Scholar] [CrossRef]
  47. Bareiß, K.; De La Rua, C.; Möckl, M.; Hamacher, T. Life Cycle Assessment of Hydrogen from Proton Exchange Membrane Water Electrolysis in Future Energy Systems. Appl. Energy 2019, 237, 862–872. [Google Scholar] [CrossRef]
  48. Valente, A.; Iribarren, D.; Dufour, J. Life Cycle Assessment of Hydrogen Energy Systems: A Review of Methodological Choices. Int. J. Life Cycle Assess. 2017, 22, 346–363. [Google Scholar] [CrossRef]
  49. Spath, P.L.; Mann, M.K. Life Cycle Assessment of Hydrogen Production via Natural Gas Steam Reforming; National Renewable Energy Laboratory: Golden, CO, USA, 2000; p. NREL/TP-570-27637.
  50. Bhandari, R.; Trudewind, C.A.; Zap, P. Life Cycle Assessment of Hydrogen Production Methods—A Review; Institut für Energie-und Klimaforschung, Systemforschung und Technologische Entwicklung (IEF-STE): Jülich, Germany, 2012. [Google Scholar]
  51. Chang, A.C.C.; Chang, H.-F.; Lin, F.-J.; Lin, K.-H.; Chen, C.-H. Biomass Gasification for Hydrogen Production. Int. J. Hydrogen Energy 2011, 36, 14252–14260. [Google Scholar] [CrossRef]
Figure 1. A detailed flowsheet of the H2 production process from biogas reforming [21].
Applsci 15 05029 g001
Figure 2. Biomass steam gasification plant design [24].
Applsci 15 05029 g002
Figure 3. Primary steps and application of the LCA methodology [43].
Applsci 15 05029 g003
Figure 4. LCA boundaries of H2 production from (a) biogas reforming [44] and (b) agricultural residue gasification [45].
Applsci 15 05029 g004
Figure 5. Environmental impacts of 1 kg of H2 production from biogas reforming.
Applsci 15 05029 g005
Figure 6. Environmental impacts for 1 kg of H2 production by the gasification process.
Applsci 15 05029 g006
Figure 7. Comparative socio-economic metrics for biogas reforming and gasification.
Applsci 15 05029 g007
Table 1. LCA methodological aspects of the reviewed papers.
Ref.SoftwareType of DataBackground DatabaseF.U.System BoundariesLCIAGlobal Warming
(kg CO2-eq)/FU
[30]SimaPro 8.5.2Software sim. + secondary dataBackground data source + ecoinvent + GREET 20211 kg H2cradle-to-gateReCiPe 20160.59 and 21.14
[31]SimaPro 9.0Software sim. + secondary dataPilot scale + ecoinvent1 kg H2, 99.99%cradle-to-gateIPCC 2013 GWP 100a10.1
[32]SimaPro 9.13Primary (AD) + secondary dataecoinvent 3.81 kg H2, 99.99%cradle-to-gateCML 20012.13
[33]undefinedSoftware sim. + secondary dataBackground data source + ecoinvent1 kg H2cradle-to-gateReCiPe12.6
[34]SimaPro 9.4Secondary dataecoinvent 3.51 kg H2, harmonizedcradle-to-gateE. F. 3.03.78 and 4.28
[35]SimaProSecondary dataecoinvent + literature + state of the art from producers1 kg H2cradle-to-gateE. F. 3.0
[36]OpenLCA v 1.11Secondary dataNETL Reports + literature1 kg H2, >99.99%; 925 psigcradle-to-gateIPCC 2013 GWP 100a; water balance−15 to 31
[37]SimaPro 9.2Secondary dataecoinvent 3.51 kg H2cradle-to-gateIPCC 2013 GWP 100a−101.12–12.66
[38]GaBi v 10.5.1.124Secondary dataGaBi database1 kg H2cradle-to-gateundefined0.6–13
[39]GaBiPrimary (mining; fuel prep) + secondary dataLiterature1 kg H2cradle-to-gateCML 2001296
[40]OpenLCA 1.10.2Primary (plant emission) + secondary dataUndefined1 kg H2gate-to-gateReCiPe11.2
[41]SimaPro 9.2Secondary dataecoinvent 3.8 + literature1 kg H2, 25 barcradle-to-gateE. F. 3.00.6–11
[42]GaBi 10Secondary dataUndefined1 kg H2cradle-to-gateReCiPe0.31–9.65
Table 3. Main inventory data on H2 production from biogas reforming [44].
CategoryComponentAmountUnit
Inputs from the TechnosphereFeed Conditioning and BG Reforming
BG7.18Nm3
Water7.5kg
Air19.1kg
Electricity1952.8kJ
Construction
Concrete227.9g
Steel72.81g
Aluminum0.6g
Iron0.89g
Equipment
Steel0.72mg
Steel high alloy2.78mg
Alumina0.96mg
Cast iron0.64mg
Steel low alloy0.3mg
WGS and Purification
Steel4mg
Steel high alloy0.13mg
Aluminum1.12mg
Alumina2.13mg
Iron1.65mg
Cast iron0.3mg
Nickel0.15mg
Steel low alloy18.22mg
Outputs to the TechnosphereH21.0kg
Outputs to the EnvironmentCO2, biogenic13.43kg
Table 4. Main inventory data for hydrogen production from agricultural residue gasification [45].
CategoryComponentAmountUnit
Inputs from the TechnosphereRice husk1.54kg
Diesel2.6 × 10−5kg
Water0.254kg
De-ionized water0.209kg
Zinc oxide1.61 × 10−4kg
Cu foam2.97 × 10−7P
Heat and power cogeneration unit4.21 × 10−8P
EnergyElectricity0.19kWh
Input from NatureOlivine2.7 × 10−5kg
Outputs to the TechnosphereHydrogen1kg
Avoided ProductElectricity0.26kWh
Emissions to AirNitrogen oxide1 × 10−9kg
Methane1.7 × 10−8kg
Carbon dioxide, biogenic0.16kg
Water0.15kg
Sulfur dioxide2 × 10−6kg
Emissions to WaterWastewater0.05kg
Solid Waste FlowsAsh1.6 × 10−3kg
Olivine2.7 × 10−4kg
Insulation0.5 × 10−7kg
Hydrogen sulfide5 × 10−5kg
Table 5. LCA comparative results of H2 production processes.
Impact Category H2 Production by Gasification (>99%)H2 Production from Biogas Reforming (>99%)
GWP (kg CO2 eq)1.2987784385.04713142
SOD (kg CFC11 eq) 2.14344 × 10−52.72936 × 10−5
IR (kBq Co-60 eq)−0.0355260920.37295624
OFHH (kg NOx eq)0.0023323910.012577232
FPMF (kg PM2.5 eq)0.0015132170.02432786
OFTES (kg NOx eq)0.0023762090.012821774
TA (kg SO2 eq)0.0049788860.121065517
FEW (kg P eq)0.0003154790.00413299
ME (kg N eq)6.98639 × 10−60.006735414
TET (kg 1,4-DCB)4.14815985633.44363458
FWET (kg 1,4-DCB)0.033217210.413201296
MET (kg 1,4-DCB)0.0498803560.562196103
HCT (kg 1,4-DCB)0.0185354820.323963195
HNCT (kg 1,4-DCB)1.50807348823.28455044
LU (m2 a crop eq)0.0157200693.683536534
MRS (kg Cu eq) 0.01066413880.048885568
FRS (kg oil eq) 0.3301178961.10519594
WC (m3)5.3737673010.040951105
NRE (MJ eq)0.4571.05
CED (MJ eq)0.6851.95
Disclaimer/Publisher’s Note: The statements, opinions and data contained in all publications are solely those of the individual author(s) and contributor(s) and not of MDPI and/or the editor(s). MDPI and/or the editor(s) disclaim responsibility for any injury to people or property resulting from any ideas, methods, instructions or products referred to in the content.

