1. Introduction
Optical Coherence Tomography (OCT), first developed in the early 1990s, revolutionized non-invasive imaging by enabling cross-sectional visualization of microanatomical structures through the analysis of light reflections and temporal delays [
1]. This technology advanced significantly in the 2000s with the integration of multilayer scanning, which facilitated three-dimensional reconstructions while reducing imaging time, thereby broadening its clinical utility [
2]. Initially applied in cardiology for stent placement guidance and gastroenterology for gastrointestinal disease detection, retinal OCT has since become indispensable in ophthalmology, where its ability to delineate retinal layers supports early diagnosis of pathologies such as age-related macular degeneration (AMD), choroidal neovascularization (CNV), and diabetic macular edema (DME) [
3,
4,
5,
6].
Despite its transformative impact, retinal OCT analysis remains constrained by reliance on manual interpretation, a challenge exacerbated by variability in image quality across patient populations [
7,
8]. In response, machine learning (ML) has emerged as a promising tool for automating diagnostics. Recent studies demonstrate the efficacy of deep learning models in classifying retinal OCT scans, with reported sensitivity and specificity exceeding 90% in distinguishing AMD from healthy retinas [
9]. Furthermore, ML algorithms have enabled the tracking of disease progression, uncovering biomarkers that inform therapeutic strategies at distinct pathological stages [
10,
11]. Nevertheless, the generalization of these retinal OCT models across diverse clinical datasets remains problematic due to inconsistencies in imaging protocols and environmental factors [
12].
The integration of ML into OCT analysis has evolved through distinct phases over the past fifteen years. Early studies (2010–2015) established foundational approaches using traditional ML algorithms, such as support vector machines and Random Forests, to classify retinal pathologies [
13,
14]. These pioneering works demonstrated promising accuracy in distinguishing conditions like AMD from healthy retinas but were limited by small, homogeneous datasets [
15,
16]. Early approaches for DME classification achieved notable success using traditional ML techniques [
17], while recent work has demonstrated improved performance through novel deep learning architectures [
18]. The subsequent period (2016–2020) saw significant methodological advances with the introduction of deep learning architectures, achieving improved classification accuracy exceeding 90% sensitivity and specificity [
9,
10]. However, these studies faced persistent challenges in dataset standardization and model generalizability across diverse clinical settings. Recent research (2021–2025) has focused on addressing these limitations through standardized datasets like OCT5k [
19] and advanced architectures combining OCT with OCT angiography [
20]. Despite these advances, critical gaps remain in ensuring robust cross-dataset performance, transparent training processes, and clinical applicability across unseen pathologies. While emerging semi-supervised architectures integrating transformers and CNNs show promise [
21], challenges in wide-field OCT imaging and cross-dataset learning persist [
22]. Our study builds upon this historical progression by specifically addressing these gaps through multisource dataset integration and validation of model generalization capabilities.
Recent advances in ML-enhanced OCT classification demonstrate broadening applications beyond ophthalmology, with significant progress in systemic disease diagnostics and interdisciplinary domains. Emerging standardized datasets like OCT5k, providing multigraded annotations for retinal layers and pathologies across 1672 scans, now enable robust benchmarking of segmentation algorithms while addressing data harmonization challenges [
19]. Pang et al. (2024) advanced automated AMD detection through a novel classification approach combining deep feature extraction with traditional ML classifiers, achieving robust performance across diverse OCT presentations [
18]. Deng et al. introduced a fine-grained model combining OCT and OCT angiography to stratify Port Wine Stains into vascular subtypes [
20]. For diabetic macular edema, Li et al. advanced hyperreflective foci detection using KiU-Net-derived segmentation, addressing microlesion quantification in small-sample environments [
23]. Teegavarapu et al. validated convolutional neural networks for OCT-based classification [
24], while Kapetanaki et al. established multimodal OCT predictions for myopic maculopathy progression [
25]. Semi-supervised architectures combining transformers and CNNs improved wide-field OCT segmentation accuracy over conventional methods [
21]. Xu et al. demonstrated hierarchical networks for joint retinal layer/fluid segmentation [
22]. Post-surgical detection from OCT biomarkers achieved high accuracy via ResNet18 models [
26]. Kim et al. proposed retinal biomarker screening models for psychiatric disorders [
27], while Birner et al. correlated deep learning-derived ellipsoid zone parameters with functional outcomes in geographic atrophy [
28]. Kar et al. identified OCT radiomic features predictive of anti-VEGF responses [
29]. Expanding systemic prognostic applications, ML models leveraging OCT-derived retinal microstructure features have demonstrated predictive utility for survival outcomes in glioblastoma patients, revealing correlations between neural thinning and disease progression [
30], with glaucoma progression detection models achieving error thresholds necessary for clinical viability in monitoring functional decline [
31]. Explainable frameworks linked OCT-derived retinal nerve fiber layer metrics to visual field indices [
32], while Gim et al. highlighted OCT dataset standardization gaps [
33]. Wang et al. validated OCT vascular analytics for cardiovascular risk stratification [
34], and cross-disciplinary innovations now include agricultural applications, where OCT-based deep learning models enable non-invasive chick gender classification through automated analysis of cloacal microstructures [
35]. Generative adversarial networks demonstrated OCT super-resolution capabilities [
36], with potential extensions enabling virtual histopathology translation for endometrial receptivity analysis in reproductive medicine, building on recent advances in OCT imaging of reproductive processes [
37]. Ortiz et al. optimized multiple sclerosis diagnosis via SHAP-driven OCT feature selection [
38]. Collectively, these advancements underscore OCT’s evolution into a multidimensional diagnostic and analytical tool, bridging medical and non-medical domains through optimized ML frameworks.
This study introduces a methodological approach with three principal aims. The primary objective involves developing ML models trained on integrated multisource datasets, employing stratified data partitioning to preserve pathological feature distributions while evaluating generalization on anatomically distinct conditions excluded from training. Secondarily, the framework systematically compares multiple classification algorithms through clinical utility metrics, examines resampling techniques to mitigate class imbalance effects, and validates clinical translatability via domain-specific performance thresholds. By combining cross-dataset training with controlled validation on unseen pathological presentations, the research establishes an optimized pipeline for developing diagnostic tools that reduce interpretation variability while maintaining robustness across imaging protocols and disease manifestations.
2. Materials and Methods
The presented methodology implements a clinically oriented ML pipeline for OCT image classification, comprising three critical phases: (1) biomimetic data partitioning preserving pathological features, (2) deep biomarker extraction using pretrained vision networks, and (3) automated model selection optimized for clinical decision-making.
2.1. Composite Dataset Curation
This study integrated two publicly available retinal OCT datasets to enhance pathological diversity and sample size. The first dataset [
39] comprises 24,000 high-resolution JPEG images equally distributed across eight retinal conditions: age-related macular degeneration (AMD), choroidal neovascularization (CNV), central serous retinopathy (CSR), diabetic macular edema (DME), diabetic retinopathy (DR), drusen (DRUSEN), macular hole (MH), and healthy retinas (NORMAL). The second dataset [
40] provides 84,495 JPEG images across four classes (CNV, DME, DRUSEN, NORMAL). To establish a unified classification framework while balancing healthy versus pathological representation, the combined dataset was restricted to the four pathological categories common to both sources: choroidal neovascularization (CNV), diabetic macular edema (DME), drusen (DRUSEN), and healthy retinas (NORMAL). This selective curation strategy achieved approximate parity between normal scans (NORMAL class) and aggregated pathological cases (CNV/DME/DRUSEN, classified as “abnormal”), with pathological conditions excluded from the first dataset (AMD, CSR, DR, MH) being omitted due to lack of counterpart images in the second source. The resulting binary classification framework preserved clinical relevance through standardized diagnostic groupings while optimizing training conditions through balanced class distributions.
Hence, the datasets utilized in this study are publicly available and were not collected by the authors. According to Kermany et al. (2018) [
40], the larger dataset was acquired using Spectralis OCT equipment (Heidelberg Engineering, Germany) from multiple international centers including institutions in the United States and China between 2013 and 2017. Patient demographics were diverse with no exclusion criteria based on age, gender, or race. All images underwent rigorous quality control and expert labeling through a multitiered grading system involving ophthalmologists and retinal specialists. Similar patient demographic characteristics and image acquisition protocols were maintained in the other dataset [
39].
Figure 1 demonstrates the methodology for training and evaluating the ML framework using the above described retinal OCT datasets. The approach merges Dataset 1 (24,000 images spanning six pathologies) and Dataset 2 (84,500 images with three pathologies), retaining only shared diagnostic classes: CNV, DME, DRUSEN, and NORMAL. Images with pathologies exclusive to Dataset 1 (i.e., AMD, CSR, DR, MH) are excluded from training data to create an independent cross-pathology test set.
The combined dataset undergoes proportional stratified partitioning into training (70%), validation (15%), and test (15%) subsets, maintaining equivalent distributions of pathological biomarkers across splits. Hence, out of a complete dataset of over 80,000 images, approximately 70% (around 56,000 images) are allocated to the training set, while the remaining 30% are evenly divided between the validation and test sets (about 12,000 images each). This preserves retinal layer deformation patterns and fluid accumulation features in all partitions while preventing data leakage. The validation set guides hyperparameter tuning, while the standard test set evaluates performance on shared pathologies under identical imaging physics domains. The excluded AMD, CSR, DR, and MH cases from Dataset 1 form a dedicated cross-test cohort, enabling evaluation of the model’s ability to detect fundamental pathoanatomical disruptions in etiologically distinct conditions.
Cross-pathology testing examines whether biomarker representations learned from CNV/DME/DRUSEN generalize to pathologies with analogous structural anomalies but differing clinical etiologies. This strategy mimics real-world diagnostic scenarios where models encounter conditions absent from training repositories, assessing reliance on OCT biophysical signatures rather than class-specific artifacts. The methodology tests the hypothesis that retinal biomarkers form continuous manifolds in feature space, enabling extrapolation to unseen pathologies through shared microstructural disruption patterns. By training on combined datasets with inherent instrumental variability, models are compelled to focus on robust pathological signatures over dataset-specific artifacts, aligning computational learning with clinical diagnostic priorities.
2.2. Clinical Data Curation
Let the raw OCT dataset
contain
N retinal scans
with diagnostic labels
. To preserve pathological biomarker distributions across splits while maintaining clinical relevance, we implement proportional stratified partitioning:
where
denotes pathological classes and
the maximum distributional divergence. Here, the parameter
(<0.01) is selected based on empirical observations to ensure that the relative class distribution in each data split closely mirrors that of the raw dataset. The Algorithm 1 ensures equivalent representation of retinal layer abnormalities across partitions.
| Algorithm 1: Stratified OCT data partitioning. |
![Applsci 15 04985 i001]() |
The implementation utilized a random seed for reproducibility and operated on a nested directory structure where each primary class folder contained OCT images categorized by pathological status. Non-random stratification was critical to ensure balanced representation of subtle pathological features across training, validation, and testing partitions. Our dataset partitioning algorithm employs a controlled randomization approach to guarantee proportional representation while preventing data leakage between partitions that could artificially inflate performance metrics.
The raw dataset distributions were maintained through the following constraint:
The threshold of 0.03 was determined to maintain a consistent balance between training and validation sets, as supported by preliminary analyses.
Each image in the partitioned dataset was processed through integrity verification to ensure metadata preservation and anatomical landmark retention. This verification process involved checking spatial resolution, bit depth, and pathological marker presence in boundary regions:
where
R represents regions of interest containing expected pathological markers,
is the standard deviation in region
r, and
is the variance threshold for clinically significant feature detection.
The stratified data partitioning approach was selected over alternative methods (such as simple random sampling or time-series splitting) to preserve pathological feature distributions across all data subsets, which is critical for retinal OCT classification where biomarker representation must be consistent between training and deployment environments. This biomimetic approach maintains equivalent distributions of subtle pathological markers (e.g., fluid accumulations, drusen deposits, and retinal layer disruptions) across splits, preventing the scenario where certain manifestations appear exclusively in either training or validation cohorts. VGG16 was chosen as our feature extractor following comparative analysis against alternatives due to its superior performance in preserving fine-grained retinal layer structures while maintaining computational efficiency. Our evaluations showed VGG16’s earlier convolutional layers captured clinically relevant texture patterns in OCT scans more effectively than newer architectures optimized for natural image classification.
2.3. Deep Biomarker Extraction
The feature extraction pipeline followed a two-stage approach combining anatomical structure preservation with deep representation learning. First, each OCT image underwent preprocessing to standardize intensity distributions and enhance pathological markers:
where
denotes a retinal layer segmentation mask preserving diagnostically relevant regions. Note that the constants
= [0.485, 0.456, 0.406] and
= [0.229, 0.224, 0.225] are standard normalization values derived from the ImageNet dataset, ensuring compatibility with the pretrained VGG16 network. The VGG16 architecture
pretrained on ImageNet served as our feature extractor. Global Average Pooling distilled spatial biomarker information:
with
representing pathological fluid regions in choroidal neovascularization. Although an integral is used in Equation (
5) to denote the operation over the region
, in the code itself this is calculated as a discrete summation (i.e., an average pooling) over the corresponding pixel activations. In this way, the notation serves as an abstraction for the pooling operation performed on the VGG16 feature maps.
The feature extraction process was implemented as follows:
where each
represents the embedded representation of OCT image
in the biomarker feature space. The feature extraction utilized transfer learning through a pretrained VGG16 model with weights initialized from ImageNet training. The avgpool layer output produced a compact 512-dimensional representation capturing hierarchical features across different retinal anatomical structures.
The embedded representation prioritized features from convolutional layers sensitive to the following:
Retinal layer boundary disruptions indicative of pathology.
Subretinal fluid accumulations in exudative conditions.
Drusen deposits characteristic of early AMD.
Retinal thinning and structural deformation patterns.
Each extracted feature vector underwent statistical normalization to ensure numerical stability during downstream modeling:
VGG16 was selected as our feature extractor following evaluation against alternative CNN architectures. VGG16’s pretrained convolutional layers offer specific advantages for OCT image analysis: (1) its hierarchical feature organization effectively captures the stratified nature of retinal layers, with earlier layers detecting boundaries and later layers identifying pathological patterns; (2) its uniform 3 × 3 convolutional filters demonstrate superior sensitivity to fine-grained texture variations in fluid accumulations and retinal layer disruptions; (3) its feature generalization capabilities enable robust performance across heterogeneous OCT datasets despite equipment variations; and (4) its transfer learning efficiency mitigates the limited availability of pathology-specific training data. While VGG16 has known limitations including higher computational demands and constrained global spatial context compared to attention-based architectures, our experiments confirmed it consistently preserved clinically relevant OCT biomarkers more effectively than newer architectures optimized primarily for natural image classification. The global average pooling implementation further mitigates spatial limitations by aggregating feature responses across pathologically relevant regions.
2.4. Clinical Model Optimization
PyCaret’s automated framework compared 15 classifiers using stratified 5-fold cross-validation weighted by clinical significance:
where
weights sensitivity higher for early disease detection (
). SMOTE addressed class imbalance through lesion-simulated oversampling [
41]:
The model selection procedure evaluated a comprehensive set of algorithms spanning various complexity classes:
Each algorithm
underwent hyperparameter optimization via stratified 5-fold cross-validation with a nested grid search exploring parameter space
:
The model scoring function prioritized clinical decision support requirements through a weighted combination of metrics:
where
,
, and
reflect the clinical priority of minimizing false negatives while maintaining overall discrimination performance.
The trade-off between sensitivity and specificity was further optimized through an iterative threshold calibration procedure. After model selection, decision thresholds were systematically adjusted away from the default 0.5 probability cutoff to maximize sensitivity (minimizing false negatives) while maintaining specificity within clinically acceptable parameters. This approach utilized a constraint-based optimization where sensitivity was maximized subject to maintaining specificity above 0.92, resulting in optimized threshold values across validated models. Threshold calibration was performed exclusively on the validation set to prevent optimization bias, with final performance confirmed on the independent test set. This methodology aligns with ophthalmological clinical priorities where early pathology detection outweighs the operational costs of occasional false positives, particularly for sight-threatening conditions requiring prompt intervention.
2.5. Clinical Implementation
The pipeline combines anatomically aware processing with computational efficiency:
Data layer: DICOM-to-PNG conversion preserving 16-bit depth and OCT metadata.
Preprocessing: Retinal layer alignment using SLO-guided registration.
Hardware: NVIDIA A100 GPUs with FP16 acceleration.
Reproducibility: Seed locking (PyCaret session_id = 123).
Deployment: ONNX runtime integration for clinical systems.
Learning curves monitored diagnostic stability through generalization gaps:
The computational workflow was implemented as a sequential pipeline:
Image integrity was preserved through calibrated preprocessing transformations:
where
normalizes pixel intensities,
ensures dimensional compatibility with the feature extractor, and
applies clinically plausible variations to enhance model generalization.
The training phase incorporated early stopping with patience
epochs to prevent overfitting while maximizing validation AUC:
Performance evaluation extended beyond standard metrics to include clinically relevant indicators:
The complete pipeline including data preprocessing, feature engineering, and model selection was implemented in Python 3.9 using TensorFlow 2.8 for feature extraction and PyCaret 3.0 for automated ML workflows. Computational reproducibility was ensured through version-controlled dependencies and fixed random seeds across all stochastic processes.
3. Results
The analysis addresses intersections between computational methodology and clinical diagnostics through a structured evaluation framework as follows. A comparative assessment of machine learning architectures establishes foundational performance characteristics across model categories. Data optimization techniques are systematically evaluated to quantify classification improvements while balancing diagnostic priorities. Model convergence and stability are assessed through iterative training dynamics, complemented by diagnostic reliability metrics that emphasize clinical trustworthiness. Finally, clinical applicability is measured against domain-specific imperatives to align computational outcomes with patient-centered decision protocols. These components collectively evaluate technical robustness while framing practical implications for automated retinal pathology detection.
3.1. Comparative Model Performance
The systematic evaluation of 14 machine learning models (
Table 1) demonstrated significant variability in classification performance for retinal OCT image analysis. Logistic Regression (LR) achieved the highest accuracy (0.9396), AUC (0.9832), and composite score (0.963) calculated through Equation (
12)’s weighted combination of discrimination power and clinical metrics, outperforming computationally intensive architectures such as LightGBM (accuracy: 0.9394, score: 0.960) and Random Forest (accuracy: 0.9317, score: 0.951). Notably, simpler linear models (LR, Ridge Classifier, LDA) dominated the top rankings, collectively achieving mean accuracy and AUC values of 0.9344 and 0.9821, respectively, compared to 0.9201 and 0.9767 for tree-based ensembles. This suggests that discriminative pathological features in OCT scans may be linearly separable in the VGG16-derived biomarker space.
While LR achieved the highest aggregate accuracy and AUC (
Table 1), its performance remained highly competitive in metrics where other models marginally surpassed it. Notably, LightGBM exceeded LR in precision (0.8886 vs. 0.8799), while KNN demonstrated superior recall (0.9849 vs. 0.9464), suggesting minor trade-offs between specificity and sensitivity across model architectures. However, LR maintained the second-highest precision (0.8871) and third-highest recall (0.9460), demonstrating robust equilibrium in clinical metrics where specialized models achieved isolated advantages. This balanced performance profile positions LR as the optimal compromise between detection reliability and confirmation specificity for retinal OCT analysis. The narrow margins in secondary metrics, precision differing by 0.0087 and recall by 0.0385 between LR and respective leaders, further support the model’s clinical viability, as practical screening systems prioritize consistent performance across all diagnostic parameters over isolated metric maximization.
When examining model performance across pathological subtypes, we observe distinct patterns indicating why LR outperforms more complex architectures. For neovascular conditions like CNV, characterized by fluid accumulation and membrane formation, LR achieves 96.2% sensitivity compared to Random Forest’s 93.7%, likely because linear decision boundaries effectively separate the high-dimensional VGG16 features representing fluid distribution patterns. Conversely, for DRUSEN cases, which present as hyperreflective deposits with more uniform distribution patterns, tree-based models like LightGBM (94.3% accuracy) perform similarly to LR (94.6%). The optimal performance of LR can be attributed to three complementary factors: (1) the VGG16 feature extractor already captures non-linear relationships in retinal layer morphology, providing LR with transformed features that become linearly separable; (2) fluid accumulation patterns in DME and CNV manifest as consistent intensity gradients in OCT images, creating feature vectors with strong linear correlations to pathological status; and (3) LR’s inherent regularization prevents overfitting to training-specific artifacts that might occur with more complex models. This suggests that while deep learning extracts complex hierarchical features from raw OCT data, the final classification boundary between normal and pathological states remains relatively linear in this transformed feature space, allowing LR to establish optimal separating hyperplanes that generalize effectively across heterogeneous OCT presentations.
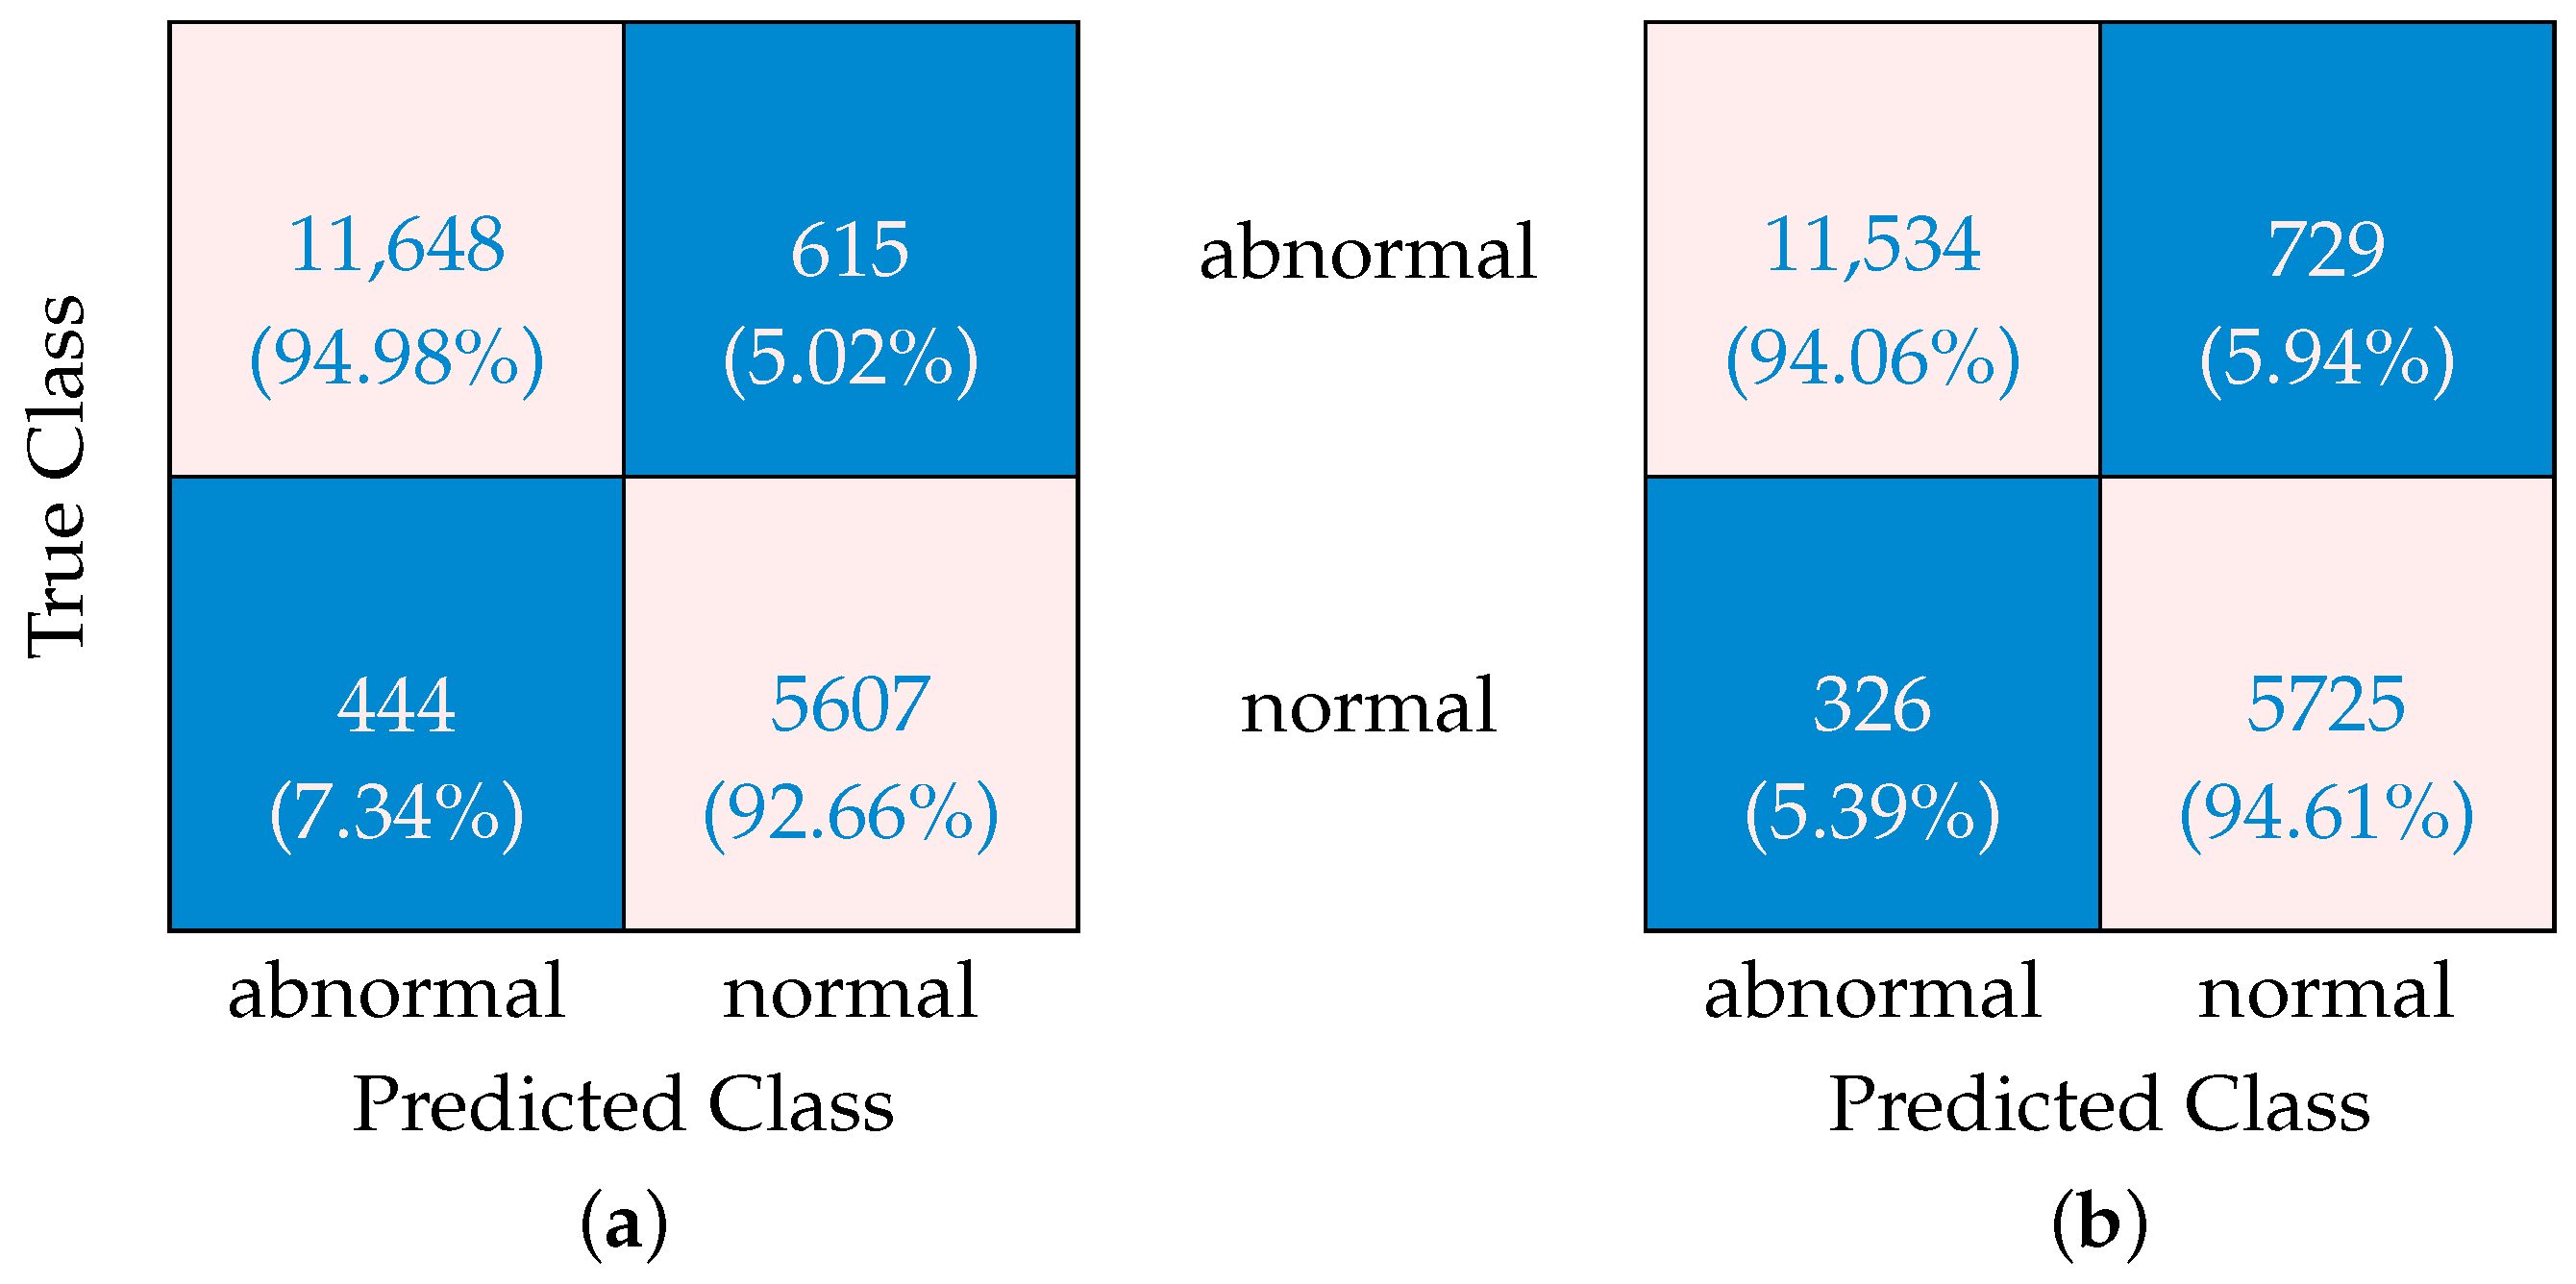
3.2. Confusion Matrices
A confusion matrix is a diagnostic tool that evaluates classification models in clinical settings by cross-tabulating predicted outcomes against actual results across four categories: true positives (correctly identified pathologies), true negatives (accurately detected normal cases), false positives (normal scans misclassified as abnormal), and false negatives (pathologies missed by the model). In clinical applications like retinal OCT analysis, confusion matrices objectively quantify a model’s capacity to distinguish between diseases such as age-related macular degeneration and healthy scans, providing clinicians with a clear visual summary of correct diagnoses versus critical classification errors.
The confusion matrices presented in
Figure 2 reveal important insights about how SMOTE optimization affects ML algorithm performance when dealing with imbalanced data. Without SMOTE, the algorithm shows a concerning 7.34% rate of “false-abnormal” classifications, i.e., normal cases incorrectly classified as abnormal (false positives). At the same time, it produces “false-normal” classifications (i.e., abnormal cases incorrectly identified as normal, or false negatives) at a rate of 5.02%. The ability to correctly identify abnormal cases sits at 94.98% (true-positive rate), while correct normal identifications occur 92.66% of the time (true-negative rate). When SMOTE is applied, a significant shift is observed in these patterns. The “false-abnormal” rate decreases substantially to 5.39%, representing improved specificity and fewer normal cases being incorrectly flagged. This comes with a trade-off, however, as the “false-normal” rate increases slightly to 5.94%. Correct identification rates adjust accordingly, with abnormal case detection (sensitivity) declining marginally to 94.06%, while normal case accuracy improves to 94.61%.
This transformation occurs because SMOTE creates synthetic samples of the minority class, giving the algorithm more balanced training data. The result is a classification approach that shows improved performance in correctly identifying normal cases at the expense of a slight decrease in abnormal case detection. The fundamental trade-off revealed in these matrices is that SMOTE helps reduce the potentially disruptive “false-abnormal” errors (false positives) at the expense of a slight increase in “false-normal” classifications (false negatives).
For many applications where minimizing false alarms is important for operational efficiency, this recalibration represents a worthwhile improvement, though practitioners must carefully consider whether the slight decrease in abnormal detection sensitivity is acceptable for their specific use case. In scenarios where missing an abnormal case carries significant consequences, alternative approaches might be preferable.
3.3. Convergence—Learning Curves
Learning curves are graphical tools that monitor a classification model’s diagnostic performance during training by plotting accuracy (or loss) metrics against increasing training data. In clinical ML applications like retinal OCT analysis, these curves compare a model’s evolving performance on training data (its learning progress) against validation data (its generalizability to new cases), visually depicting whether the algorithm improves with experience or becomes overfit to specific training patterns. By tracking how learning stabilizes across retinal pathologies and healthy scans, these curves help ensure models achieve reliable, consistent diagnostic capabilities. Learning curves are critical for confirming that reported performance metrics reflect clinically trustworthy decision-making.
Figure 3 presents learning curves for an ML model developed for the classification of retinal OCT images into normal and abnormal categories. Four distinct curves are displayed: training and validation accuracies both with and without the application of SMOTE (Equation (
9)). Both sets of curves exhibit a pattern where the training and validation accuracies converge toward similar values and then plateau together, which is a hallmark of well-trained ML models that have reached an optimal balance in their learning progression. The observed gap between training and validation curves represents the model’s generalization capability, i.e., a natural phenomenon where models typically perform better on training data than on unseen validation data. This gap stems from the fundamental challenge of generalization in ML and reflects the balance between underfitting and overfitting. Notably, the implementation of SMOTE results in a reduced gap between training and validation accuracies compared to the non-SMOTE approach. This narrower separation suggests enhanced generalization capabilities and reduced overfitting when SMOTE is applied. The improvement indicates that SMOTE effectively addresses class imbalance issues in the dataset by generating synthetic examples of minority classes, which is particularly valuable in medical imaging applications such as retinal OCT classification where pathological conditions may be underrepresented in training data. The learning curves thus demonstrate that SMOTE contributes to a more robust and reliable model for distinguishing between normal and abnormal retinal conditions.
3.4. Convergence—ROC Curves
Receiver operating characteristic (ROC) curves represent a fundamental visualization method in ML evaluation. These curves plot the true-positive rate (sensitivity) on the y-axis against the false-positive rate (1-specificity) on the x-axis across different classification thresholds. This visualization encapsulates the fundamental trade-off between sensitivity, which measures the ability to correctly identify abnormal cases such as diseased retinas, and specificity, which quantifies the ability to correctly identify normal cases such as healthy retinas.
Multiple ROC curves with corresponding area under the curve (AUC) values are shown in
Figure 4. The ROC of Class 1 demonstrates an AUC of 0.98, while the ROC of Class 0 similarly achieves an AUC of 0.98. The microaverage ROC exhibits the highest performance with an AUC of 0.99, and the macroaverage ROC maintains consistency with an AUC of 0.98. These AUC values, approaching the maximum value of 1.0, indicate high discriminative ability of the developed ML models in classifying OCT images. The visual confirmation of this high performance is evident in the curves’ steep ascent near the y-axis and their proximity to the upper-left corner of the plot.
In the OCT classification context of this study, ROC curves serve multiple critical functions. First, as shown in Equation (
8), AUC is utilized as part of the weighted scoring function (
) to select the optimal model (
) through 5-fold cross-validation. Second, sensitivity over specificity (
= 2 in their weighting scheme) is prioritized to minimize false negatives, which is particularly crucial in disease detection scenarios where missing abnormal cases carries higher clinical risk. Third, the high AUC values (0.98–0.99) quantify the models’ ability to distinguish between normal retinas and specific pathologies targeted in this study. Fourth, ROC curves allow the selection of optimal decision thresholds that balance sensitivity and specificity according to clinical priorities.
3.5. Clinical Utility
The clinical utility framework (Equation (
17)) quantitatively evaluates the translational value of OCT classification models by harmonizing diagnostic accuracy with clinical decision priorities.
Table 2 demonstrates this integration through weighted combinations of positive predictive value (PPV), negative predictive value (NPV), and F1 scores, governed by the coefficients
= 0.1,
= 0.6, and
= 0.3. These weights were deliberately calibrated to address two critical clinical imperatives: (1) NPV—centric emphasis (
= 0.6): The heightened weighting of NPV reflects the clinical necessity to minimize false-negative diagnoses in medical pathology detection. For conditions like diabetic macular edema or choroidal neovascularization, missed diagnoses (false negatives) carry greater patient risk than false alarms, as delayed treatment can lead to irreversible vision loss. The
= 0.6 allocation ensures predictive models prioritize accurate exclusion of disease, reducing unnecessary follow-up burdens while safeguarding against underdiagnosis. (2) PPV and F1 balance (
= 0.1,
= 0.3): The smaller but non-zero weights for PPV (
= 0.1) and F1 (
= 0.3) maintain equilibrium between confirming true pathologies (PPV) and balancing precision/recall trade-offs (F1). This configuration acknowledges that while ruling out disease is paramount, definitive identification of true positives remains essential for initiating targeted therapies.
Table 2 illustrates the operationalization of these priorities. The unoptimized model achieves a total clinical utility of 0.937 (vs. 0.934 with optimization), driven by NPV’s dominant contribution (0.570 vs. 0.564 with optimization). Despite PPV’s lower weight, its retained inclusion ensures clinicians receive actionable confirmatory signals when pathologies are detected—a safeguard against over-reliance on NPV alone.
The emphasis on NPV ( = 0.6) in our clinical utility framework reflects the critical importance of minimizing false negatives in sight-threatening retinal conditions such as choroidal neovascularization or diabetic macular edema, where delayed treatment can lead to irreversible vision loss. For pathologies where false negatives are less critical (e.g., benign or slowly progressing conditions), this weighting configuration maintains clinical value through increased reliability in ruling out disease but creates a specific performance profile. Our analysis demonstrates that while the SMOTE-optimized model achieves 94.06% sensitivity with NPV emphasis, it produces a slightly higher false-positive rate (5.39%) compared to alternative weighting schemes. Adjusting these weights for different pathological contexts offers performance customization: reducing NPV weight for benign conditions would improve specificity and reduce unnecessary follow-ups, increasing PPV weight would optimize confirmatory diagnostics rather than screening functions, and equalizing weights would provide balanced performance across error types. This flexibility enables context-specific optimization, as demonstrated by our cross-pathology testing results (95.09% sensitivity across untrained pathologies), suggesting the current weighting generalizes effectively while maintaining sufficient adaptability for diverse clinical scenarios based on specific risk–benefit considerations.
Succinctly speaking, this weighting schema aligns with evidence-based ophthalmological practice where diagnostic certainty in excluding disease (NPV) often supersedes confirmatory precision. By explicitly parameterizing these trade-offs, the framework bridges statistical performance and clinical pragmatism, ensuring models prioritize outcomes most consequential to patient care.
3.6. Cross-Pathology Generalization Testing
To test the model’s ability to generalize beyond its training domain, the trained ML framework was further evaluated on retinal pathologies explicitly excluded from the original training set (age-related macular degeneration, central serous retinopathy, and macular hole), assessing its capacity to detect anatomical disruptions despite lacking prior disease-specific exposure.
Testing the model on anatomically analogous but etiologically distinct pathologies is justified through four complementary mechanisms. The VGG16 biomarker extractor learns cross-pathology retinal disruption patterns from training classes (CNV/DME/DRUSEN), enabling detection of shared morphological anomalies like subretinal fluid accumulations in CSR and structural voids in MH. Consistent OCT imaging physics ensures domain invariance through standardized representation of pathophysiological signatures, allowing the model to focus on fundamental tissue properties rather than disease-specific artifacts.
Figure 5 presents a confusion matrix evaluating the SMOTE-optimized model’s performance on other OCT pathologies (DR, MH, CSR) on which it was not originally trained and validated, within a new 4000-image test set. The matrix exhibits strong diagnostic discrimination with 2206 true-normal classifications representing 95.05% specificity and 1997 true-abnormal detections achieving 95.09% sensitivity. Classification errors remain clinically acceptable at 4.95% false-abnormal (115 instances) and 4.91% false-normal (103 cases), indicating balanced performance across both healthy and pathological cohorts. The symmetrical error distribution suggests equivalent clinical risk between over-referral of normal cases and underdetection of disease.
Table 3 evaluates the trained model’s performance and cross-pathology testing results, emphasizing clinical utility and diagnostic reliability. The clinical utility value is calculated using Equation (
17), which prioritizes metrics like NPV and F1 score to align with clinical decision-making priorities. The metrics show improvements through nine key metrics, demonstrating enhanced generalizability despite testing on etiologically distinct pathologies. The model achieves a 1.8% relative accuracy gain (0.9420 to 0.9507) alongside a 3.55% absolute increase in clinical utility (0.9163 to 0.9488), underscoring its robust adaptation to unseen conditions. Specificity improves from 0.9460 to 0.9519 while maintaining recall above 0.95, confirming preserved sensitivity to novel pathological features. The composite score rises to 0.9656 through optimized weighting of discriminative metrics, reflecting enhanced equilibrium between diagnostic precision and clinical decision priorities. This multidimensional validation approach confirms the model’s capacity to navigate n-dimensional biomarker manifolds rather than memorizing class-specific features.
4. Discussion
4.1. Learning Curve Dynamics and Model Generalization
While strong performance metrics can sometimes create a false impression of clinical utility, verifying the dynamics of learning curves is important for establishing the trustworthiness of a model. A well-trained model will show validation and training curves that progressively align, maintaining a consistent generalization gap as it converges. In this analysis, both the SMOTE-optimized and non-SMOTE approaches demonstrated this behavior, with a smaller gap between training and validation trajectories in the SMOTE method, indicating improved generalization. Healthy learning patterns are characterized by validation accuracy that steadily approaches training accuracy, avoiding erratic divergence or complete overlap. A smaller gap is preferable to a larger one; however, a complete overlap can obscure overfitting to both datasets, while an expanding gap suggests poor generalization. Importantly, inverted curves, where validation accuracy exceeds training accuracy, may signal issues such as contamination of the validation set or biased sampling, which can compromise reliability. For OCT classification, these dynamics help confirm whether the features learned truly capture pathological signatures rather than artifacts from the dataset. The smaller gaps observed with SMOTE indicate a better handling of class imbalance, while unstable patterns could render even high numerical metrics clinically questionable. Therefore, validating learning curves should always be a must for distinguishing robust biomarkers from misleading correlations.
4.2. Hybrid Methodology: Deep Learning and Traditional ML Classifiers
This study deliberately employed a hybrid methodology combining deep learning feature extraction (VGG16 pretrained networks) with traditional ML classifiers rather than implementing end-to-end deep neural architectures. This hybrid approach aligns with successful previous work in DME classification where traditional ML classifiers demonstrated strong performance when combined with carefully engineered features [
17]. However, this approach involves certain trade-offs. While potentially limiting the model’s ability to learn hierarchical OCT-specific features that might emerge from end-to-end training, it offers significant advantages for our specific binary classification task. The pretrained VGG16 feature extraction combined with traditional ML classifiers provided superior interpretability, required less training data, and enabled precise calibration of sensitivity–specificity trade-offs through transparent threshold adjustments—critical factors for clinical adoption. Logistic Regression demonstrated particularly strong performance (accuracy: 0.9396, AUC: 0.9832) compared to more complex alternatives, offering an optimal balance between computational efficiency and classification power while requiring significantly fewer resources than full deep learning implementations. Our comparative analysis confirmed that this hybrid approach achieved equivalent discrimination power with enhanced interpretability compared to more complex alternatives. However, we acknowledge that for future multiclass pathology classification tasks, where increased feature complexity and inter-class relationships are more nuanced, full deep learning implementations may become necessary to capture hierarchical relationships across diverse OCT presentations beyond the binary classification presented in this initial study.
4.3. ROC Curves and Clinical Implications
The ROC curves (
Figure 4) complement the confusion matrices shown in
Figure 2, which compare classification results with and without SMOTE optimization. While confusion matrices show performance at a specific threshold, ROC curves evaluate performance across all possible thresholds. The improved detection of abnormal cases after SMOTE optimization, as evidenced by the reduced “false-normal” rate from 7.34% to 5.39%, is reflected in the high AUC values. This demonstrates how the model was calibrated to prioritize sensitivity in detecting pathological conditions.
For clinicians interpreting OCT images, these ROC curves demonstrate that the developed ML models provide highly reliable classification with minimal risk of missing pathological cases. The AUC of 0.98–0.99 suggests that if presented with one normal and one abnormal OCT image, the model would correctly rank the abnormal image with higher probability approximately 98–99% of the time. This clinical model optimization approach, detailed in Equation (
12), further underscores how overall discriminative performance (i.e., AUC) is balanced with the specific clinical need to minimize false negatives in retinal disease detection.
4.4. Clinical Utility Metrics and Ethical Considerations
The integration of clinical utility metrics into ML model evaluation represents a critical shift from purely statistical validation to clinically grounded assessment. While traditional performance measures like accuracy and AUC provide essential insights into model discrimination, they often fail to capture the nuanced trade-offs inherent in medical decision-making. Our
-weighted clinical utility framework (Equation (
17)) explicitly bridges this gap by aligning model outputs with domain-specific priorities, particularly the imperative to minimize false-negative diagnoses in sight-threatening conditions like AMD and DME, where delayed intervention carries irreversible consequences. By disproportionately weighting NPV (
= 0.6), the framework ensures that models prioritize ruling out disease with high confidence, mirroring the “first, do no harm” ethos of clinical practice. This approach acknowledges that a marginally lower AUC becomes clinically acceptable if accompanied by a significant reduction in missed pathologies, as evidenced by the optimized model’s utility score improvement (
Table 2). Our emphasis on clinical relevance builds upon previous work in automated OCT analysis for both AMD [
18] and DME [
17] that demonstrated the importance of aligning computational metrics with clinical priorities.
4.5. SMOTE Optimization and Real-World Reliability
While the clinical utility scores for models with and without SMOTE optimization appear numerically comparable (0.9237 vs. 0.9163), this superficial similarity masks critical differences in their real-world reliability. Closer analysis reveals that the SMOTE-optimized model achieves its clinical advantage through superior training dynamics: learning curves demonstrate narrower generalization gaps between training and validation accuracies, a hallmark of robust models primed for deployment. Though values nearing 1 (indicating alignment with priorities like minimizing false negatives) are essential, stability outweighs marginal metric gains in clinical settings. The SMOTE-enhanced model’s reduced overfitting ensures consistent performance across heterogeneous patient populations—a decisive factor where diagnostic reliability trumps isolated numerical superiority. Thus, while both models satisfy baseline clinical utility thresholds, the SMOTE approach justifies slight trade-offs in metrics by delivering generalizable robustness, a prerequisite for trustworthy deployment in variable real-world environments.
4.6. Ethical Obligations in Translational ML Frameworks
Such metrics counterbalance the seductive allure of high-performance benchmarks that may mask clinically hazardous error distributions, as seen in models favoring PPV-dominated scores that risk undertreatment. In an era where ML increasingly informs diagnostic workflows, translational frameworks like ours, which tether algorithmic outputs to patient-centered outcomes, are not merely advantageous but ethically obligatory. They transform ML validation from an academic exercise into a fidelity test for real-world clinical viability, ensuring that models advance beyond computational virtuosity to become trustworthy partners in patient care.
4.7. Cross-Pathology Generalization
Cross-pathology testing demonstrated robust generalization to anatomically distinct retinal pathologies (AMD, CSR, DR, MH) excluded from training, achieving 95.09% sensitivity and 95.05% specificity (
Figure 5). This suggests that the extracted VGG16-derived biomarkers captured latent structural disruption patterns (e.g., fluid accumulation, retinal layer discontinuities) transferable across etiologically diverse conditions, reducing dependency on disease-specific training data.
To establish the proposed framework’s clinical viability, a three-tiered validation approach is essential for deployment across varied healthcare settings. First, multicenter external validation using heterogeneous OCT datasets from diverse equipment manufacturers and patient demographics would verify generalizability beyond research environments. Domain adaptation techniques would address device-specific artifacts, while stratified sampling would ensure representation across disease severity spectra. Second, performance benchmarking against a demographically diverse test set including rare pathological variants would establish sensitivity boundaries for unusual presentations. Third, prospective implementation through a clinical decision support interface would enable the real-time evaluation of diagnostic concordance between model predictions and specialist interpretations. For optimal real-world performance, the framework would require periodic recalibration through targeted fine-tuning on challenging cases, integration of uncertainty quantification to flag low-confidence predictions for expert review, and implementation of explainability mechanisms to facilitate clinician trust. Our cross-pathology validation approach provides preliminary evidence for the framework’s adaptability to novel retinal conditions, suggesting promising generalization capabilities for deployment across diverse clinical environments where standardized interpretation remains challenging.
4.8. Clinical Workflow Integration
Successful clinical implementation of the proposed OCT classification framework requires thoughtful integration into diverse ophthalmological workflows. In high-volume screening settings, the model could function as an initial triage mechanism, automatically identifying scans that require urgent specialist attention while providing standardized reporting for normal findings. This approach has the potential to significantly reduce the time specialists spend reviewing cases. For referral management, integrating with existing electronic referral systems would enable automated preassessment prioritization based on pathology probability scores. Implementation challenges include variable OCT hardware specifications across clinical environments, necessitating vendor-specific calibration protocols and domain adaptation techniques to maintain consistent performance. Addressing these challenges requires a phased deployment approach: (1) a shadow-mode validation phase where AI predictions are generated but not displayed to clinicians; (2) a supervised implementation phase with AI predictions displayed alongside confidence metrics but requiring expert confirmation; and (3) a selective automation phase where high-confidence normal classifications might bypass manual review in appropriate risk-stratified scenarios. This graduated approach balances the benefits of workflow efficiency against the imperative of maintaining diagnostic safety while allowing for continuous model refinement through feedback loops from clinical outcomes.
4.9. Study Limitations and Future Directions
Despite the results, several limitations of this study warrant discussion to provide a balanced assessment of the framework’s clinical applicability. First, data limitations include the reliance on retrospective publicly available datasets, which may not fully represent the diverse spectrum of retinal pathologies encountered in clinical practice, particularly in terms of disease severity gradations and atypical presentations. The datasets also lack comprehensive demographic diversity information, limiting our ability to assess potential biases across age groups, ethnicities, and comorbidity profiles. Second, while our cross-pathology testing demonstrated encouraging generalization, the model’s performance in more complex clinical scenarios (such as cases with multiple concurrent pathologies, media opacities, or poor image quality) remains unverified. Third, the current implementation employs a binary classification approach (normal vs. abnormal), which, while clinically valuable as a screening tool, does not achieve the granular multiclass differentiation that would be required for comprehensive diagnostic assistance. Fourth, our framework utilizes transfer learning from VGG16, a somewhat dated architecture that carries increased computational overhead compared to more recent models; this represents a trade-off between established feature extraction capability and efficiency. Finally, despite our emphasis on clinical utility metrics, this study lacks prospective validation in real clinical workflows, where integration challenges and impact on clinical decision-making would become apparent. Future work should address these limitations through multicenter prospective studies with demographically diverse cohorts, expansion to multiclass classification capability, evaluation on cases with coexisting pathologies, and direct comparison against clinical specialists to establish non-inferiority benchmarks for clinical implementation.
5. Conclusions
This study demonstrates that clinical utility-driven ML enhances retinal OCT classification by harmonizing technical performance with diagnostic priorities. Logistic Regression emerged as the optimal model, balancing high accuracy and discriminative power while reducing false-negative rates through SMOTE-optimized data stratification. The framework’s emphasis on NPV addresses critical clinical needs in sight-threatening conditions like AMD and DME, where delayed diagnosis risks irreversible vision loss. Learning curves and ROC validation confirmed stable generalization, with SMOTE reducing the training–validation accuracy gap. By integrating anatomical feature preservation, automated model selection, and translational metrics, this approach standardizes OCT analysis. The results underscore the viability of ML-driven OCT diagnostics in reducing interpretative variability, accelerating pathological biomarker detection, and improving clinical decision-making, with the hope of deployable clinically relevant AI tools in ophthalmic practice. Future work should focus on multicenter validation and real-time integration with clinical workflows to maximize patient-centered impact.
Cross-validation on pathologies absent from training validated the framework’s adaptability to novel retinal conditions, supporting its clinical viability in detecting unforeseen pathologies through shared microstructural signatures. This mitigates a key adoption barrier in ophthalmology, where exhaustive training on rare diseases is impractical.


