Article

Short-Term Risk Estimation and Treatment Planning for Cardiovascular Disease Patients after First Diagnostic Catheterizations with Machine Learning Models

by
Guochang Ye
1,2,
Peshala Thibbotuwawa Gamage
2,
Vignesh Balasubramanian
2,
John K.-J. Li
3,
Ersoy Subasi
4,
Munevver Mine Subasi
5 and
Mehmet Kaya
2,*
1
Doll Cellular Inc., 420–880 Douglas ST, Victoria, BC V8W 2B7, Canada
2
Department of Biomedical and Chemical Engineering and Sciences, Florida Institute of Technology, 150 W University Blvd, Melbourne, FL 32901, USA
3
Department of Biomedical Engineering, Rutgers University, 599 Taylor Road, Piscataway, NJ 08854, USA
4
College of Aeronautics, Florida Institute of Technology, 150 W University Blvd, Melbourne, FL 32901, USA
5
Department of Mathematical Sciences, Florida Institute of Technology, 150 W University Blvd, Melbourne, FL 32901, USA
*
Author to whom correspondence should be addressed.
Appl. Sci. 2023, 13(8), 5191; https://doi.org/10.3390/app13085191
Submission received: 1 April 2023 / Revised: 18 April 2023 / Accepted: 19 April 2023 / Published: 21 April 2023
(This article belongs to the Collection Machine Learning for Biomedical Application)

Abstract

:
Cardiovascular disease (CVD) is the leading cause of death. CVD symptoms may develop within a short-term after diagnostic catheterizations and lead to life-threatening situations. This study is the first to apply machine learning (ML) methods to predict subsequent adverse cardiovascular events/treatments for patients within 90 days after their first diagnostic catheterizations. Patients (6539) without previously diagnosed CVD were selected from the DukeCath dataset. Ten ML methods were used. Three medical outcomes, varied cardiovascular-related scenarios, percutaneous coronary intervention (PCI) treatments, and coronary artery bypass graft (CABG) treatments, were targeted individually. With patient medical history, vital measurements, laboratory results, and the number of diseased vessels, the random forest classifier (RFC) performed best in predicting combined cardiovascular scenarios, including CABG, PCI, valve surgery (VS), stroke, and myocardial infarction (MI), achieving accuracy: 88.17%, sensitivity: 89.72%, specificity: 86.98%, area under receiver operating characteristic (AUROC): 91.68%. The gradient boosting classifier (GBC) performed best in predicting the PCI and CABG treatments (PCI treatments: accuracy: 89.21%, sensitivity: 90.20%, specificity: 88.74%, AUROC: 94.16%; CABG treatments: accuracy: 93.86%, sensitivity: 77.57%, specificity: 96.23%, AUROC: 96.47%). Our results show that the ML applications effectively identify high-risk patients, can provide diagnostic assistance in cardiovascular treatment planning, and improve outcomes in cardiovascular medicine.

1. Introduction

Cardiovascular disease (CVD) continues to be the leading cause of death and health expenditure worldwide. In the United States, approximately 659,000 people die from CVDs each year [1]. CVD is broadly referred to as a number of cardiovascular conditions, including coronary heart disease, arrhythmia, and heart valve problems. Coronary heart disease is prevalent and can cause heart attacks and stroke when a blood clot forms [2]. Diagnostic cardiac catheterization allows the assessment of coronary vessels and provides evaluation information about the heart muscle, heart valves, and blood vessels in the heart. Different treatments are suggested afterward depending on the diagnostic catheterization results (CR) and cardiovascular conditions [3]. Due to the ongoing CVD progression after the diagnostic catheterization, a certain portion of suspected patients would develop adverse cardiovascular symptoms in the short term [4]. These symptoms (e.g., heart attack, stroke) place patients at high risk that would even cause fatalities if proper medical interventions (e.g., percutaneous coronary intervention (PCI) for acute myocardial infarction) are not delivered on time. Unfortunately, these dangerous cardiovascular symptoms are unknown until these adverse cardiovascular events occur. Thus, early predictions of adverse cardiovascular events for patients who received catheterizations can provide helpful information to differentiate the high-risk patients and provide valuable time ahead for hospital inpatient monitoring and treatment management.
Machine learning (ML) techniques have become a powerful tool for making predictions or performing classifications for medical diagnoses [5]. Previous studies have developed cardiovascular event prediction methods [6,7]. ML predicted one-year cardiovascular events for patients with severe dilated cardiomyopathy and achieved an area under receiver operating characteristic (AUROC) of 0.887 [8]. Another study predicted mortalities and heart failure (HF) hospitalization for HF outpatients diagnosed with preserved ejection fraction. They tested different models, and they received their best results using the random forest model with a mean C-statistic of 0.72 for predicting mortality and 0.76 for predicting HF hospitalization during the 3-year follow-up [9]. A deep neural network method was used to predict myocardial infarction (MI) events at six months, resulting in an AUROC of 0.835 with harmonized electronic health record data [10]. The majority of these ML studies focused only on the long-term (years) predictions of cardiovascular scenarios and not aimed to generate on-time guidance/assistance on treatment planning or risk estimation at the beginning of patient diagnoses. Additionally, during that long observation period, many unseen factors would affect patients diagnosed with CVD (e.g., side effects of prescription medicine [11]). These introduced uncertainties would hinder the accurate performance of the ML models. Differently, short-term predictions (i.e., months) will not be sensitive to these unpredicted factors, and uncertainties can be largely reduced [12]. Thus, ML methods focusing on short-term cardiovascular-related predictions would be practical and reliable.
The number of CVD patients increases yearly, and the population of patients who receive catheterization procedures is significant [4]. In certain cases, the complete determination of CVD progression in patients can be challenging when there is a lack of sequential catheterization history [13]. Therefore, patients, who have no history of or any dangerous symptoms (e.g., heart attack and stroke) of CVD, are still encountering unknown cardiovascular risks. An accurate scoring metric/approach is needed to identify the high-risk patients from the suspected CVD patients. Furthermore, some related studies [14,15] are solely based on CR and basic demographic information. With the catheterization procedures, the ML model, predicting fractional flow reserve, achieved 84% sensitivity, 80% specificity, 82% accuracy, and 0.87 AUROC [14]. Similarly, another ML model showed 84% accuracy and 0.89 AUROC during external validation for the assessment of myocardial ischemia [15]. These catheterization-based methods ignore the patient’s medical/physical features (such as laboratory results and physical examinations), which are not applicable to personalized medicine developments. Including patient medical history, vital measurements, and laboratory results before catheterization procedures can enhance the ML model’s performance and practicality for diagnostic purposes [16]. To fill this gap, this study adapted ML-based approaches to effectively identify high-risk patients who lack sequential catheterization history. These findings would provide diagnostic assistance in cardiovascular treatment planning with patients’ short-term diagnostic information, contributing to improved diagnosis and treatment outcomes in cardiovascular medicine. Further, the DukeCath database [17] contains 155,980 catheterization procedures (diagnostic and interventional), and to the best of our knowledge, this study is the first to apply ML methods to this dataset. This study aimed to explore the potential of ML applications in predicting CVD in suspected patients with no previously diagnosed CVD or any apparent severe symptoms of fatal CVD. The DukeCath database was utilized to provide insights into the effectiveness of ML algorithms for detecting CVD in this specific target population. Initially, ML methods were used to predict cardiovascular-related scenarios (i.e., treatments and events) occurring within 90 days of the first catheterization procedure to provide overall cardiovascular risk assessments and classify high-risk patients. The patients’ features included medical history, vital measurements, laboratory results, and CR. The treatments and events include coronary artery bypass surgery (CABG), valve-related surgery (VS), PCI, stroke, and MI. For CVD, the PCI and CABG treatments are the main revascularization procedures [18,19]. Therefore, the study generated treatment predictions (PCI and CABG) for suspected patients using ML models to facilitate treatment planning. Finally, the model’s performance was evaluated by measuring accuracy, sensitivity, specificity, and AUROC.

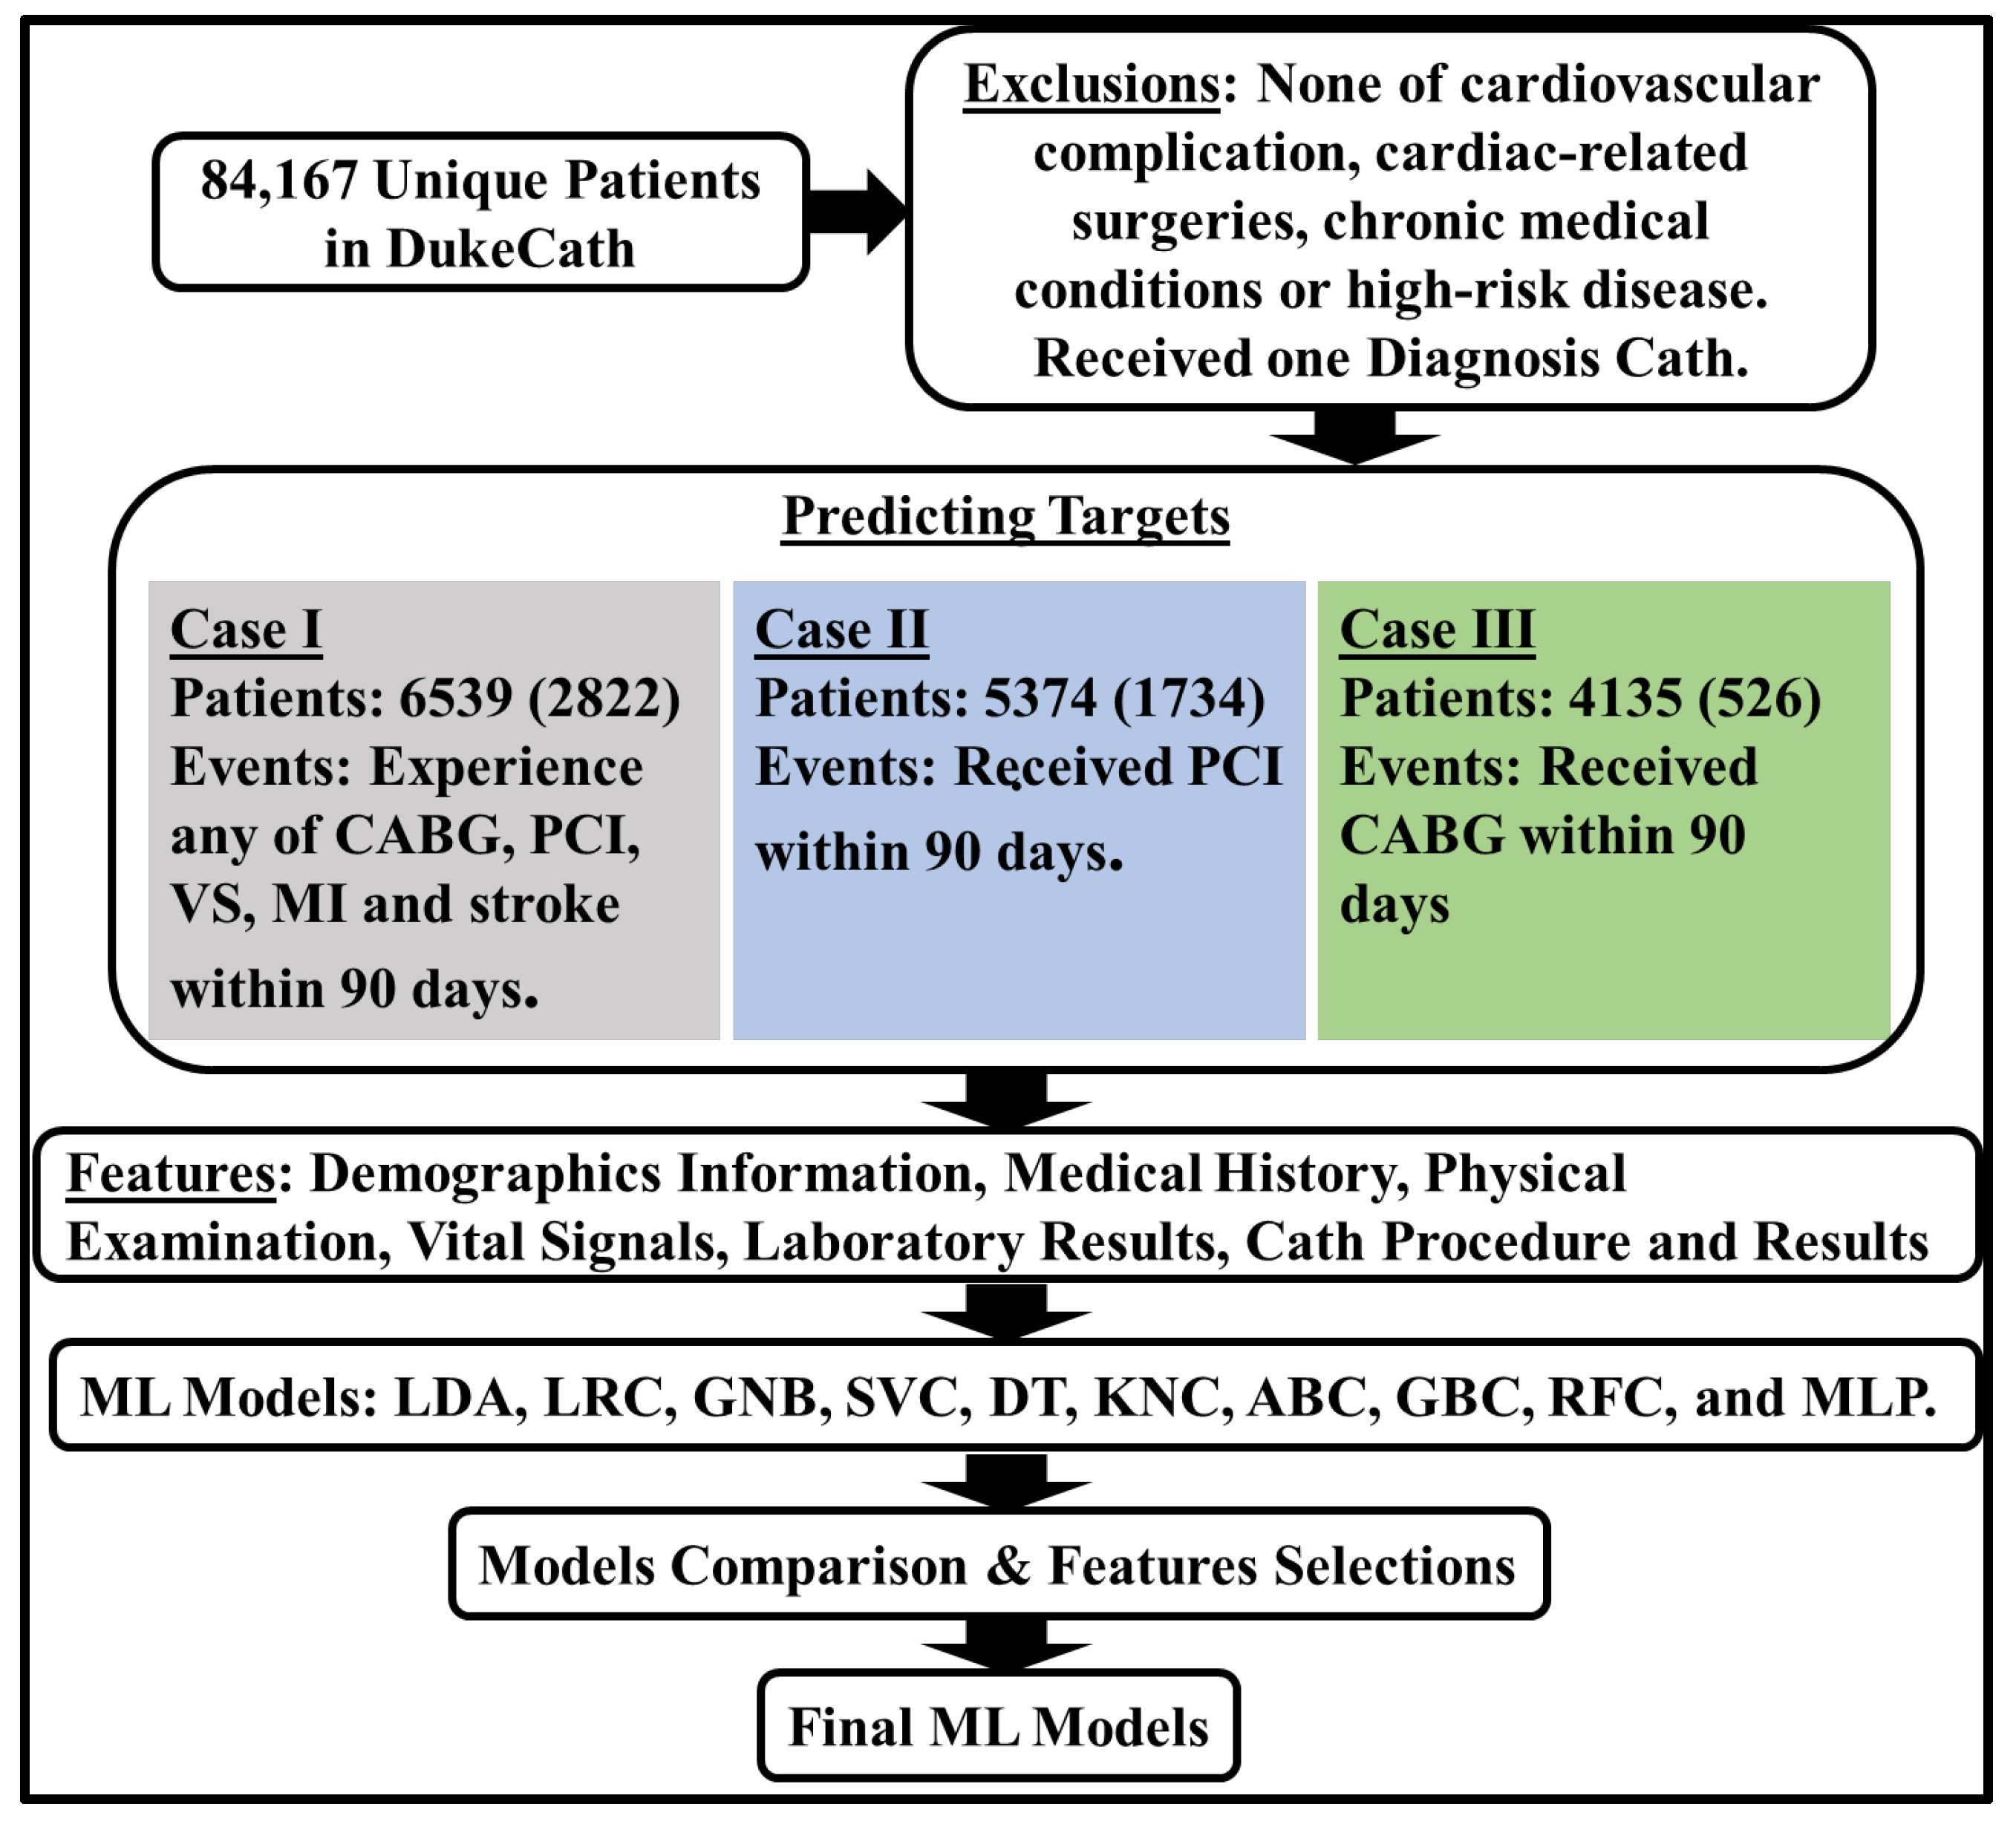
2. Materials and Methods

DukeCath database contains a total of 155,980 catheterizations that took place in the Duke University Medical Center (Durham, NC, USA) from 1985 to 2013. The Duke Medicine Institutional Review Board (Pro00068333) approved the creation, de-identification, and public sharing of the DukeCath dataset through DCRI’s SOAR (Supporting Open Access for Researchers) initiative. In this dataset, 95 features were created for each catheterization procedure. Among the records, there were 84,167 unique patients. A table providing the univariance analysis of the applied patient information can be found in the Appendix A section. There were nine groups of features: identification, demographics, medical history, vital signs before the catheterization, laboratory measurements before the catheterization, physical examination record before the catheterization, catheterization procedures, CR, and follow-up results, as shown in Table A1 of Appendix A. Some features had two versions in the database, and their raw versions were considered here. Missing data were commonly found among the features. ML applications were applied to subsets of the DukeCath patient population based on their medical history to predict the likelihood of specific cardiovascular events and treatments. These subsets included patients with no history of cerebrovascular disease, congestive heart failure, MI, or peripheral vascular disease and who were not experiencing any severity of congestive heart failure. None of the cardiac-related surgeries, including CABG, PCI, valve repair or replacement (VS), were reported previously in these patients’ medical history. Since the cardiovascular risk factor was the only factor investigated here, the potential risks caused by other health conditions were excluded from this study. These exclusions comprised chronic medical conditions such as chronic obstructive pulmonary disease, connective tissue disease, or undergoing dialysis, as well as high-risk diseases like liver disease, renal disease, leukemia, lymphoma, solid tumor, or metastatic cancer. All these preserved patients have only received their first diagnostic cardiac catheterization procedures. There was a total of 38 input features, including demographic information (three features), medical history (seven features), physical examination (six features), vital signals (three features), laboratory results (four features), and CR (15 features). Baseline characteristics of the study population were analyzed with t-test methods (on continuous data), Fisher’s exact tests (on Boolean data), and chi-square tests (on categorical data).

Machine Learning Models

Ten ML methods were used to provide binary predictions (risk or no risk) in this work. ML models can be divided into linear and nonlinear types for classification. A linear model will plot features and the targeted outcomes with a hyperplane that separates all the different classifications. Nonlinear models, as their name suggests, have complex boundaries which do not have to be a hyperplane. Currently, all the selected ML models in this study are widely used. Linear discriminant analysis (LDA), logistic regression classifier (LRC), Gaussian naïve Bayes (GNB), and support vector classification (SVC) were applied as linear models. Applied nonlinear models include decision trees (DT), K-neighbors classifier (KNC), and ensemble models (AdaBoost classifier (ABC), gradient boosting classifier (GBC), and random forest classifier (RFC). Since this work provides an understanding of using general ML applications to predict adverse cardiovascular events and treatments, as a neural network model, a multi-layer perceptron classifier (MLP) was chosen [20]. Our MLP model consists of an input layer with 38 dimensions, while the number of hidden layers varied up to 50 during the model selection process. The output layer has one dimension. All ten ML models were trained with default parameters unless additional ones were mentioned. The synthetic minority over-sampling technique (SMOTE, a type of data augmentation) [21] was used to stratify the data to mitigate the data imbalance issue. As conventional methods to performance train/test data splitting, when the data is sufficient, 20–30% of the data is preserved for testing, and the remaining 70–80% of the data is for training purposes [22]. More training data would likely yield a better ML model; more testing data would provide a more accurate estimation of model performance. Therefore, to maintain a sufficient number of positive cases (occurrence of cardiovascular events of interest) for validation, the data was split into a ratio of 1:1 for training and testing purposes. With the patient testing data, accuracy, sensitivity, specificity, and AUROC were calculated for each ML model. A flowchart to illustrate the ML applications on the DukeCath dataset is shown in Figure 1.
ML models were trained to predict multiple cardiovascular scenarios within 90 days after receiving their first catheterization for patients with no previous cardiovascular event history. The first part (referring to Case I in Figure 1) of the study provides overall risk assessments that would be a metric for isolating high-risk patients. The target cardiovascular events and treatments included CABG (727 of 1041 cases occurred within 90 days), PCI (2008 of 2211 cases occurred within 90 days), VS (152 of 230 cases occurred within 90 days), MI (53 of 349 cases occurred within 90 days), and stroke (111 of 444 cases occurred within 90 days). The resulting dataset contains 6539 patients, including 2822 patients who experienced the targeted events (positive). In total, 207 patients had two incidents, and 11 patients had three incidents within 90 days. For CVD, the PCI and CABG treatments are the main revascularization procedures, and each of them is preferable under patients’ clinical conditions [18,19]. Thus, in the next section, PCI (Case II in Figure 1) and CABG (Case III in Figure 1) were explored separately as the predicted treatments for the patient within 90 days after their first catheterization. To predict PCI treatments, the patient who received CABG and VS were excluded, and the number of patients was reduced to 5374. In total, 1734 patients received PCI within 90 days. To predict CABG treatments, the number of patients was reduced to 4135 after excluding the patient who received PCI and VS, and only 526 patients received CABG within 90 days. Until the ML models with the best performance were obtained at all three conditions, these selected models were additionally trained only with CR features and with non-CR features to demonstrate the overall importance of the CR features. Lastly, all the features were divided into three groups: the first group was the combination of demographic information and patient medical history; the second group included all patient examinations (physical examination, vital signals, laboratory results); the CR features were included in the third group. For these feature groups, heatmaps (Figure 2) were generated in each predicting case to demonstrate the importance of features from the best ML model. With the visual aid of the heatmaps, feature selections were performed to obtain the final ML models in this study.
The machine learning code was written in Python (Python Software Foundation, Wilmington, DE, USA). The ML models were from the Scikit-learn package [23], a popular ML library for the Python programming language.

3. Results

3.1. Performance of ML Methods

Table 1 shows the performance of ten ML models on the prediction of the short-term risk assessment within 90 days. Among the ten ML models, RFC was the best model achieving 89.69% accuracy, 93.83% sensitivity, 86.55% specificity, and an AUROC of 95.76%, with the testing dataset composed of 1411 positive cases and 1859 negative cases. When the train test split ratio was changed to 75:25, the GBC was the best model achieving 90.28% accuracy, 93.06% sensitivity, 88.16% specificity, and an AUROC of 95.87%, which is slightly better than the RFC’s performance (achieving 90.03% accuracy, 94.05% sensitivity, 86.98% specificity, and an AUROC of 95.77%). Only with the increasing amount of training data, GBC outperformed RCF. Without enabling the SMOTE data augmentation technique, the training accuracy was 100.00% in the RFC model training phase, and an accuracy of 89.36%, a sensitivity of 93.27%, 86.39% specificity, and an AUROC of 95.75% were obtained with the test data. Since the data imbalance is not significant, the effectiveness of SMOTE applications was not observed. Still, the RFC model with SMOTE was slightly better. As shown in Table 2, the performance of the RFC model trained only with the CR was far better than training without CR features, reflecting the importance of CR. Regarding the importance of other features, the top 10 catheterization-unrelated features of the RFC model were high-density lipids (HDL), history of angina, low-density lipids (LDL), heart rate, body mass index (BMI), diastolic blood pressure (DBP), systolic blood pressure (SBP), body surface area (BSA), weight, and serum creatinine.
Table 3 shows the performance of the ten ML models on the prediction of the PCI treatment within 90 days. Among the ten ML models, GBC was the best model, achieving 92.07% accuracy, 95.50% sensitivity, 90.44% specificity, and 98.02% as an AUROC, with the testing dataset composed of 867 positive cases and 1820 negative cases. When the train test split ratio was changed to 75:25, the GBC was still the best model achieving 92.26% accuracy, 94.47% sensitivity, 91.21% specificity, and an AUROC of 97.95%. The SMOTE method mitigated the data imbalance issue, and the GBC model’s performance was enhanced. As shown in Table 4, the performance of the GBC model trained only with the CR was also found to be better than training without CR features, which revealed the importance of CR. Other than catheterization-related features, history of angina, acute coronary syndrome (ACS), HDL, LDL, GFR Stage, DBP, BSA, BMI, age, and history of diabetes were among the top ten important features in the GBC model for predicting the PCI treatment within 90 days.
Table 5 shows the performance of the ML models on the prediction of CABG treatment within 90 days. Among the ten ML models, GBC was the best model, achieving 95.45% accuracy, 86.31% sensitivity, 96.79% specificity, and 98.33% as an AUROC, with the testing dataset composed of 263 positive cases and 1805 negative cases. When the train test split ratio was changed to 75:25, the GBC was still the best model achieving 95.65% accuracy, 83.33% sensitivity, 97.45% specificity, and an AUROC of 98.40%. Compared with two previous cases, this data was significantly imbalanced, and the number of CABG samples was far less than the negative group, which directly lowered the sensitivity even under engaging the SMOTE. As shown in Table 6, the performance of the GBC model trained only with the CR was found to be better than training without CR features, as in the other two predictions. Aside from the catheterization-related features, history of angina, age, race, heart rate, height, serum creatinine, HDL, DBP, SBP, and LDL were the top ten most important features in the descending order.
In Figure 2A, based on the color of the heatmaps, age, and HXANGINA (history of angina) were the most important features within the demographic information and patient medical history for all three prediction cases. In Figure 2B, the patient examination features were found relatively important only during the prediction of cardiovascular scenarios, including CABG, PCI, VS, stroke, and MI, but not for the prediction of only PCI or CABG treatments. Further, these examination features had higher importance than the demographic information and patient medical history features in this risk estimation model, and the HDL was the most important feature. Since the cardiovascular risk was assessed within 90 days, the recent physical conditions of the patients would be helpful in identifying the high-risk patients. In the PCI treatment prediction, the history of diabetes feature was uniquely found as an important feature that was supported by other studies [24,25]. In contrast, the CABG treatment predictions are more affected by the demographic information (age, race), also evident in Figure 2A.
Based on the results from Table 2, Table 4, and Table 6, the overall importance of CR-related features was higher than the others, which are also visually supported by the colored heatmaps (in Figure 2). Among these CR features, the NUMDZV (the number of significantly diseased vessels) feature was important in all three prediction cases. This feature can be accessed via noninvasive techniques, such as noninvasive CT angiograms [26,27]. Among the non-CR related features, CBRUITS (carotid bruits), S3 (the third heart sound), YRCATH_G (year of cardiac catheterization), and HXPEPULC (history of peptic ulcer disease) were removed. After combining the NUMDZV with other non-CR-related features, the performances of all three models were improved (listed in Table 7). For estimating high-risk conditions within 90 days, the RFC achieved 88.17% accuracy, 89.72% sensitivity, 86.98% specificity, and an AUROC of 91.68%. For predicting the PCI treatments within 90 days, the GBC achieved 89.21% accuracy, 90.20% sensitivity, 88.74% specificity, and 94.16% AUROC. For predicting the CABG treatments within 90 days, the GBC achieved 93.86% accuracy, 77.57% sensitivity, 96.23% specificity, and 96.47% AUROC.

3.2. Statistical Analysis

Based on the statistical analysis results, weight, history of peptic ulcer disease, the third heart sound, BMI, DBP, and valve-related features (including aortic valve insufficiency, mitral valve stenosis, valvular heart disease, mitral regurgitation grade) were not significant (p ≥ 0.01) between the positive and negative group during the varied cardiovascular events and treatments predictions (Case I). Further, in the PCI treatment predictions (Case II), weight, history of peptic ulcer disease, BMI, DBP, maximum stenosis of the left main artery, aortic valve insufficiency, aortic valve stenosis, mitral valve stenosis, and mitral regurgitation grade were not statistically significant (p ≥ 0.01). In the CABG treatment predictions (Case III), weight, history of peptic ulcer disease, history of smoking, the third heart sound, BSA, BMI, DBP, aortic valve insufficiency, aortic valve stenosis, mitral valve Stenosis, and valvular heart disease were not found statistically significant (p ≥ 0.01). Among the patient samples, the number of VS cases is the least compared to the other treatments, and VS has been excluded as the criterion in the PCI and CABG predictions. Therefore, the conventional statistical results found that heart valve-related features from the CR were not found to be significant between the positive and negative groups. BMI and DBP were also not significant in all three prediction models. Compared to the importance of features, most of these insignificant features (e.g., BMI, DBP) were used among these three prediction scenarios as important features. However, these features were classified as weak features in the applied conventional statistical techniques (t-test (on continuous data), Fisher’s exact tests (on Boolean data), and chi-square tests (on categorical data)). In this work, ensemble methods, RFC and GBC, produced an optimal predictive output by combining several weak learning models. The interactions/relations between features were examined, and the weak features were efficiently considered. As shown in Table 2, Table 4, and Table 6, the addition of the non-CR features improves the model performance.

4. Discussion

This study is the first to apply ML methods to the DukeCath database, which contains 155,980 catheterization procedures to predict short-term risks for CVDs. In this research, various ML methods (linear models, nonlinear models, and a neural network) were applied for short-term likelihood assessment of varied cardiovascular events and treatments (including CABG, PCI, VS, stroke, and MI), PCI treatments, and CABG treatments for patients, who were not previously diagnosed with CVD, by inputting their first catheterizations results, catheterizations procedure, medical history, vital signal, laboratory results, and physical examination prior to catheterizations. The RFC was the best predictive model among all the ML models in the risk assessment on varied cardiovascular events and treatments section with high accuracy. This model accurately identifies the high-risk patients who will experience multiple cardiovascular incidents within 90 days. In the case of the PCI prediction, the GBC was the best model among all the ML models with high accuracy. As for the CABG forecast, the GBC was the best model among all the ML models, with high prediction accuracy. The PCI and CABG treatments were predicted accurately in a short-term manner, providing instance diagnosis assistance in cardiovascular treatment planning.
Some of the patients are expected to have recurrent cardiac events within the first year after catheterization. This highlights the poor medical outcomes and high utilization of resources by this patient population [28]. Our study provides a better solution for determining recurrent cardiovascular events and identifying high-risk patients. This work also presents a baseline for ML applications targeting the treatment predictions for suspected CVD patients and serves as a comparison reference for future ML model validation. In some survival analyses on CVD patients, African-Americans are shown to have lower long-term survival than Caucasian [29]. Extremes of BMI are associated with lower long-term survival in patients with significant coronary disease [30]. In our study, race is observed to be significant only in the statistical analysis of the short-term effect, but it is a weak feature in all three prediction cases. Contrarily, the BMI feature is not significant in our statistical analysis, but it is a strong feature in the risk estimations (Case I predictions). Our ML applications examined the interactions/relations between features, and the weak features were efficiently considered. Despite having a high significance in statistical analysis, a feature will process with low importance if it lacks interactions between other features. Therefore, the feature importance presented in our study provides additional importance evaluations for CVD patients’ features.
Among the other ML applications on CVD, cardiovascular symptoms were broadly used as the targets and predicted as output. The naïve Bayes algorithm was used to predict heart attacks with an accuracy of 81.25% [31]. This naïve Bayes classifier reduced the doctor’s efforts and time by automating the risk prediction. In another study, a deep neural network achieved an F1 score of 0.092 and AUROC of 0.835 on MI predictions from harmonized EHR data [10]. With the ensemble deep learning method, 85% of heart arrest was successfully predicted one hour before the incidence (sensitivity ≥ 0.85), and 73% of arrest cases 25 h before the occurrence (sensitivity ≥ 0.73) [32]. The models from these studies could predict adverse cardiovascular conditions based on the known factors which have been widely accepted to directly relate to the predicted cardiovascular events. Therefore, these methods might not be suitable for patients without previously diagnosed CVD due to the lack of previous adverse cardiovascular symptoms. Additionally, since the risk of each CVD patient is not the same, different CVD patients may develop different cardiovascular events, and the exact cardiovascular event that will occur is unknown. Hence, ML models that only focus on a single type of cardiovascular incident lack practicability in providing diagnosis aids. As an advantage of this study, patients without a known history of cardiovascular disease were exclusively considered and investigated. It also demonstrated that the performance of the ML models was enhanced slightly after including non-catheterization features. Overall, the proposed models in our work achieved highly accurate predictions: 88.17%, sensitivity: 89.72%, and AUROC: 91.68% for predicting various cardiovascular incidents (including CABG, PCI, VS, stroke, and MI) with accuracy: 89.21%, sensitivity: 90.20%, and AUROC: 94.16% for predicting PCI treatments; and with accuracy: 93.86%, sensitivity: 77.57%, and AUROC: 96.47% for predicting CABG treatments. As a novelty of this study, cardiovascular treatment (PCI or CABG) was the predicted target. By predicting the likelihood of a treatment received, patients’ cardiovascular risks were also indirectly estimated. The approaches can efficiently differentiate CVD patients under high risk and assist in timely treatment planning (PCI or CABG).
Compared with traditional strategies for the CVD risk assessment (e.g., the Framingham Risk Score), ML could improve the accuracy of CVD risk prediction [33]. For 10-year cardiovascular predictions, the neural networks algorithm obtained a sensitivity of 67.5% and a specificity of 70.7% and performed better than the established algorithm based on American College of Cardiology guidelines [33]. AutoPrognosis, an ensemble of three ML pipelines, maintains higher accuracy (AUROC: 0.774) compared to the baseline Framingham score (AUROC: 0.724) on 5-year CVD risk prediction for patients without diabetes [34]. However, the level of CVD risk is still hard to be evaluated accurately. In fact, CVD has been long believed as a multifactorial disease, and its risk factors tend to interact with each other for each individual. Thus, the interactive effects within patients’ medical history, vital signs, laboratory measurements, and physical examination records should not be ignored. Additionally, long-term predictions were unavoidably exposed to unseen factors that should be eliminated for accurate predictions. In the future research plan, feature selection will be performed based on the provided importance of each feature from the developed ML models in this study. With these selected features, new ML models will be explored to provide a better risk evaluation for survival analysis on patients without any adverse cardiovascular symptoms. Even though there is room for future improvement on the proposed method, this novel research is the first ML application on the DukeCath dataset, and it demonstrated the feasibility of using the ML models to classify high-risk CVD patients accurately.

5. Conclusions

This study provides new insights into predicting the risks of developing CVD in the short term after the first catheterization. The application of ML methods to the large clinical DukeCath databank is new, and the results are promising. For patients without previously diagnosed CVD, the proposed RFC had a good performance in predicting cardiovascular scenarios (including CABG, PCI, VS, stroke, and MI) to provide short-term cardiovascular risk estimations. The gradient boosting classifier performed accurately on both predicting the PCI and CABG treatments within 90 days after the first catheterizations by using patient medical history, vital measurements, laboratory results, and the number of diseased vessels. In conclusion, these models offer valuable information to identify high-risk patients and help gain valuable time ahead for hospital inpatient monitoring and treatment consideration.

Author Contributions

Conceptualization, G.Y., V.B. and M.K.; methodology, G.Y., P.T.G., J.K.-J.L., V.B., E.S., M.M.S. and M.K.; software, G.Y.; validation, G.Y. and M.K.; formal analysis, G.Y. and M.K.; investigation, G.Y. and M.K.; resources, G.Y. and M.K.; data curation, G.Y., V.B. and M.K.; writing—original draft preparation, G.Y.; writing—review and editing, P.T.G., J.K.-J.L., V.B., E.S., M.M.S. and M.K.; supervision, M.K.; project administration, M.K. All authors have read and agreed to the published version of the manuscript.

Funding

This research received no external funding.

Institutional Review Board Statement

Not applicable.

Informed Consent Statement

Not applicable.

Data Availability Statement

All the medical data in this work is from the DukeCath dataset, a de-identified dataset, including records and variables for patients undergoing cardiac catheterization procedures. Researchers would request access through http://www.dcri.org/our-approach/data-sharing/ (accessed on 20 September 2020).

Conflicts of Interest

The authors declare no conflict of interest.

Appendix A

Table A1. Univariance analysis of patient information.
FeatureNo Risk
(3717)
Risk
(2822)
No PCI
(3640)
PCI
(1734)
No CABG
(3609)
CABG
(526)
Gender (male)177199417596261734150
Race
Missing986497429611
Caucasian24192128236012672341407
African American10344821019325101081
Other16614816410016227
Age
18–24616061
25–29273272270
30–348014807782
35–3917356166351658
40–443301303268532318
45–4946925945516445533
50–5458335557122056067
55–5956341354625753776
60–6449942648826549283
65–6942041541224240870
70–7424734024319923783
75–7919926719715919965
≥801211431239912220
History of peptic ulcer disease43414121407
History of diabetes740698719400704144
History of angina25522500248816072460459
History of hypertension20151769196610861947326
History of hyperlipidemia1534154214919251481314
History of smoking1504131814638181450242
Acute coronary syndrome status upon presentation (ACS)
No ACS2545129224927152478280
STEMI17751751156
Non-STEMI4211142764120
MI Unspecified223130
Unstable Angina1111134210868911072220
Third heart sound (S3)2912283294
Carotid bruits4710547424732
Height
(cm)
170.64
(10.8, 0)
171.95
(10.34, 0)
170.53
(10.76, 0)
171.88
(10.39, 0)
170.58
(10.79, 0)
172.64
(10.45, 0)
Weight
(kg)
86.29
(24.09, 0)
86.54
(20.18,0)
86.03
(24.12, 0)
87.19
(20.42, 0)
86.13
(24.11, 0)
86.37
(19.92, 0)
Body surface area (m2)1.97
(0.27, 0)
1.99
(0.24, 0)
1.97
(0.27, 0)
1.99
(0.24, 0)
1.97
(0.27, 0)
1.99
(0.24, 0)
Body mass index (kg/m2)29.63
(8.44, 0)
29.3
(7.03, 0)
29.58
(8.48, 0)
29.58
(7.47, 0)
29.6
(8.48, 0)
28.95
(6.13, 0)
Diastolic blood pressure (mmHg)81.38
(13.59, 0)
81.52
(13.93, 0)
81.28
(13.63, 0)
81.29
(13.6, 0)
81.33
(13.63, 0)
82.1
(13.23, 0)
Systolic blood pressure (mmHg)142.23
(23.29, 0)
148.07
(24.62, 0)
141.98
(23.22, 0)
147.02
(24.01, 0)
142.03
(23.21, 0)
150.62
(24.96, 0)
Heart rate
(bpm)
74.31
(19.13, 0)
69.87
(16.94, 0)
74.41
(19.17, 0)
68.83
(15.33, 0)
74.39
(19.14, 0)
71.52
(20.84, 0)
Serum creatinine (mg/dL)0.99
(0.46, 0)
1.06
(0.53, 0)
0.99
(0.46, 0)
1.05
(0.5, 0)
0.99
(0.46, 0)
1.09
(0.53, 0)
High-density lipid (mg/dL)50.38
(18.46, 0)
43.68
(14.02, 0)
50.58
(18.52, 0)
43.49
(13.27, 0)
50.62
(18.56, 0)
43.89
(14.68, 0)
Low-density lipid (mg/dL)110.44
(38.16, 0)
114.79
(38.26, 0)
110.22
(38.21, 0)
113.55
(37.04, 0)
110.12
(38.11, 0)
117.14
(39.96, 0)
GFR Stage (mL/min per 1.73 m2)
<1513201310123
15–<3048364517477
30–<451221581249912230
45–<6034236634022433472
60–<901680147416499001633279
≥90151276814694841461135
Valvular heart disease8576718714
Max stenosis of the right coronary artery14.9
(24.68, 23)
62.39
(36.29, 609)
14.27
(24.12, 22)
61.3
(35.71, 495)
14.43
(24.48, 21)
72.88
(32.12, 13)
Max stenosis of the left main artery4.5
(11.81, 7)
12.24
(22.67, 307)
4.41
(11.8, 6)
5.39
(12.94, 252)
4.53
(11.96, 5)
31.63
(31.83, 2)
Max stenosis of the left anterior descending artery20.07
(25.92, 8)
72.46
(29.39, 450)
19.42
(25.27, 5)
71.66
(28.87, 371)
19.65
(25.66, 5)
84.78
(18.69, 4)
Max stenosis of the left circumflex artery13.74
(23.72, 21)
57.48
(37.27, 712)
13.1
(23.06, 20)
54.19
(37.58, 589)
13.32
(23.52, 19)
71.75
(31.18, 8)
Max stenosis of the proximal left anterior descending artery6.96
(15.17, 8)
28.5
(35.9, 451)
6.72
(14.74, 5)
23.58
(33.86, 371)
6.88
(15.25, 5)
45.53
(38.38, 4)
Left ventricular ejection fraction (%)62.07
(10.59, 844)
60.32
(10.69, 1416)
62.11
(10.65, 848)
61.24
(9.94, 1053)
62.11
(10.63, 842)
59.52
(11.3, 86)
Coronary dominance
Left3411673429833827
Right30872562301115982983464
Balanced289932873828835
Number of significantly diseased vessels
Missing91949171897
None306414130282629816
One3401421325113732757
Two129646109409115129
Three93520879197327
Mitral regurgitation grade (left ventriculogram)
Missing8581424862105785688
None2637121525756102547382
I1431161314613445
II593754205411
III1212121120
IV8186060
Aortic valve insufficiency
Missing35282713346017093427508
Absent123531231612415
Mild2418202201
Moderate2422214222
Severe585050
Trace138113110
Aortic valve stenosis
Missing32312584316916263146466
Absent45820245010744359
Mild (>1.0 cm2)194121111
Moderate (0.7–1.0 cm2)5125050
Severe (<0.7 cm2)4204040
Mitral valve stenosis
Missing36502791357817263548521
Absent5622538524
Mild (>1.5 cm2)433031
Moderate (1.0–1.5 cm2)323030
Severe (<1.0 cm2)443030
Type of cardiac catheterization
Unknown83582671
Right Heart Only515050
Left Heart Only27222558265916442624502
Right and Left Heart9822289686497323
Year of cardiac cath
1991–1994262125
1995–1998698860665492656170
1999–2002947816909501897153
2003–200689259488841588294
2007–201067633667219566972
2011–201350221050413050332
DSPCI1871.03
(1439.18, 3606)
63.57
(418.21, 722)
1945.08
(1461.92, 3550)
0.49
(3.63, 0)
DSVALVE1957.11
(1632.88, 3671)
450.57
(1149.06, 2638)
DSMI1907.78
(1545.51, 3643)
1523.77
(1524.79, 2547)
DSCABG2110.27
(1701.61, 3624)
397.05
(1072.4, 1874)
1924.44
(1649.45, 3550)
5.18
(8.67, 0)
DSSTROKE2158.53
(1577.75, 3587)
1642.44
(1800.13, 2508)
All the continuous numeric data were described with the means; the standard deviation and the number of missing data were included in the following bracket. DSPCI, Days to First Subsequent Percutaneous Coronary Intervention; DSVALVE, Days to First Subsequent Valve Repair or Replacement Surgery; DSMI, Days to First Subsequent Non-Fatal Myocardial Infarction; DSCABG, Days to First Subsequent Coronary Artery Bypass Surgery; DSSTROKE, Days to First Subsequent Non-Fatal Stroke.

References

  1. Virani, S.S.; Alonso, A.; Aparicio, H.J.; Benjamin, E.J.; Bittencourt, M.S.; Callaway, C.W.; Carson, A.P.; Chamberlain, A.M.; Cheng, S.; Delling, F.N.; et al. Heart Disease and Stroke Statistics—2021 Update. Circulation 2021, 143, e254–e743. [Google Scholar] [CrossRef] [PubMed]
  2. Centers for Disease Control and Prevention, National Center for Health Statistics. About Multiple Cause of Death, 1999–2019; CDC WONDER Online Database Website; Centers for Disease Control and Prevention: Atlanta, GA, USA, 2019. [Google Scholar]
  3. Kern, M.J.; Sorajja, P.; Lim, M.J. Cardiac Catheterization Handbook; Elsevier Health Sciences: Amsterdam, The Netherlands, 2015. [Google Scholar]
  4. Manda, Y.R.; Baradhi, K.M. Cardiac Catheterization, Risks and Complications. In StatPearls; StatPearls Publishing: Treasure Island, FL, USA, 2019. [Google Scholar]
  5. Fatima, M.; Pasha, M. Survey of Machine Learning Algorithms for Disease Diagnostic. J. Intell. Learn. Syst. Appl. 2017, 9, 73781. [Google Scholar] [CrossRef]
  6. Damen, J.A.A.G.; Hooft, L.; Schuit, E.; Debray, T.P.A.; Collins, G.S.; Tzoulaki, I.; Lassale, C.M.; Siontis, G.C.M.; Chiocchia, V.; Roberts, C.; et al. Prediction models for cardiovascular disease risk in the general population: Systematic review. BMJ 2016, 353, i2416. [Google Scholar] [CrossRef]
  7. Beunza, J.J.; Puertas, E.; García-Ovejero, E.; Villalba, G.; Condes, E.; Koleva, G.; Hurtado, C.; Landecho, M.F. Comparison of machine learning algorithms for clinical event prediction (risk of coronary heart disease). J. Biomed. Inform. 2019, 97, 103257. [Google Scholar] [CrossRef] [PubMed]
  8. Chen, R.; Lu, A.; Wang, J.; Ma, X.; Zhao, L.; Wu, W.; Du, Z.; Fei, H.; Lin, Q.; Yu, Z.; et al. Using machine learning to predict one-year cardiovascular events in patients with severe dilated cardiomyopathy. Eur. J. Radiol. 2019, 117, 178–183. [Google Scholar] [CrossRef]
  9. Angraal, S.; Mortazavi, B.J.; Gupta, A.; Khera, R.; Ahmad, T.; Desai, N.R.; Jacoby, D.L.; Masoudi, F.A.; Spertus, J.A.; Krumholz, H.M. Machine Learning Prediction of Mortality and Hospitalization in Heart Failure With Preserved Ejection Fraction. JACC Hear. Fail. 2020, 8, 12–21. [Google Scholar] [CrossRef]
  10. Mandair, D.; Tiwari, P.; Simon, S.; Colborn, K.L.; Rosenberg, M.A. Prediction of incident myocardial infarction using machine learning applied to harmonized electronic health record data. BMC Med. Inform. Decis. Mak. 2020, 20, 252. [Google Scholar] [CrossRef]
  11. Suter, T.M.; Ewer, M.S. Cancer drugs and the heart: Importance and management. Eur. Heart J. 2013, 34, 1102–1111. [Google Scholar] [CrossRef]
  12. Ambale-Venkatesh, B.; Yang, X.; Wu, C.O.; Liu, K.; Gregory Hundley, W.; McClelland, R.; Gomes, A.S.; Folsom, A.R.; Shea, S.; Guallar, E.; et al. Cardiovascular Event Prediction by Machine Learning: The Multi-Ethnic Study of Atherosclerosis. Circ. Res. 2017, 121, 1092–1101. [Google Scholar] [CrossRef]
  13. Bhatti, N.K.; Karimi Galougahi, K.; Paz, Y.; Nazif, T.; Moses, J.W.; Leon, M.B.; Stone, G.W.; Kirtane, A.J.; Karmpaliotis, D.; Bokhari, S.; et al. Diagnosis and Management of Cardiovascular Disease in Advanced and End-Stage Renal Disease. J. Am. Heart Assoc. 2016, 5, e003648. [Google Scholar] [CrossRef]
  14. Cho, H.; Lee, J.G.; Kang, S.J.; Kim, W.J.; Choi, S.Y.; Ko, J.; Min, H.S.; Choi, G.H.; Kang, D.Y.; Lee, P.H.; et al. Angiography-based machine learning for predicting fractional flow reserve in intermediate coronary artery lesions. J. Am. Heart Assoc. 2019, 8, e011685. [Google Scholar] [CrossRef] [PubMed]
  15. Hae, H.; Kang, S.J.; Kim, W.J.; Choi, S.Y.; Lee, J.G.; Bae, Y.; Cho, H.; Yang, D.H.; Kang, J.W.; Lim, T.H.; et al. Machine learning assessment of myocardial ischemia using angiography: Development and retrospective validation. PLoS Med. 2018, 15, e1002693. [Google Scholar] [CrossRef] [PubMed]
  16. Mathur, P.; Srivastava, S.; Xu, X.; Mehta, J.L. Artificial Intelligence, Machine Learning, and Cardiovascular Disease. Clin. Med. Insights Cardiol. 2020, 14, 1179546820927404. [Google Scholar] [CrossRef] [PubMed]
  17. Analysis Dataset of Cardiac Catheterization Procedures from the Duke Information System for Cardiovascular Care (DISCC) (“ACATHD”) (DukeCath); VIVLI: Cambridge, MA, USA, 2014. [CrossRef]
  18. Habib, R.H.; Dimitrova, K.R.; Badour, S.A.; Yammine, M.B.; El-Hage-Sleiman, A.-K.M.; Hoffman, D.M.; Geller, C.M.; Schwann, T.A.; Tranbaugh, R.F. CABG Versus PCI Greater Benefit in Long-Term Outcomes With Multiple Arterial Bypass Grafting. J. Am. Coll. Cardiol. 2015, 66, 1417–1427. [Google Scholar] [CrossRef]
  19. Taggart, D.P. PCI or CABG in coronary artery disease? Lancet 2009, 373, 1150–1152. [Google Scholar] [CrossRef]
  20. Hsieh, M.-H.; Lin, S.-Y.; Lin, C.-L.; Hsieh, M.-J.; Hsu, W.-H.; Ju, S.-W.; Lin, C.-C.; Hsu, C.Y.; Kao, C.-H. A fitting machine learning prediction model for short-term mortality following percutaneous catheterization intervention: A nationwide population-based study. Ann. Transl. Med. 2019, 7, 732. [Google Scholar] [CrossRef]
  21. Chawla, N.V.; Bowyer, K.W.; Hall, L.O.; Kegelmeyer, W.P. SMOTE: Synthetic minority over-sampling technique. J. Artif. Intell. Res. 2002, 16, 321–357. [Google Scholar] [CrossRef]
  22. Gholamy, A.; Kreinovich, V.; Kosheleva, O. Why 70/30 or 80/20 Relation Between Training and Testing Sets: A Pedagogical Explanation. Dep. Tech. Rep. 2018, 1209, 1–6. [Google Scholar]
  23. Buitinck, L.; Louppe, G.; Blondel, M.; Pedregosa, F.; Mueller, A.; Grisel, O.; Niculae, V.; Prettenhofer, P.; Gramfort, A.; Grobler, J.; et al. API design for machine learning software: Experiences from the scikit-learn project. arXiv 2013, arXiv:1309.0238. [Google Scholar]
  24. Strain, W.D.; Paldánius, P.M. Diabetes, cardiovascular disease and the microcirculation. Cardiovasc. Diabetol. 2018, 17, 57. [Google Scholar] [CrossRef]
  25. Leon, B.M. Diabetes and cardiovascular disease: Epidemiology, biological mechanisms, treatment recommendations and future research. World J. Diabetes 2015, 6, 1246. [Google Scholar] [CrossRef] [PubMed]
  26. Sun, Z.; Lin, C.H.; Davidson, R.; Dong, C.; Liao, Y. Diagnostic value of 64-slice CT angiography in coronary artery disease: A systematic review. Eur. J. Radiol. 2008, 67, 78–84. [Google Scholar] [CrossRef] [PubMed]
  27. Mowatt, G.; Cook, J.A.; Hillis, G.S.; Walker, S.; Fraser, C.; Jia, X.; Waugh, N. 64-Slice computed tomography angiography in the diagnosis and assessment of coronary artery disease: Systematic review and meta-analysis. Heart 2008, 94, 1386–1393. [Google Scholar] [CrossRef]
  28. Cavender, M.A.; Alexander, K.P.; Broderick, S.; Shaw, L.K.; McCants, C.B.; Kempf, J.; Ohman, E.M. Long-term morbidity and mortality among medically managed patients with angina and multivessel coronary artery disease. Am. Heart J. 2009, 158, 933–940. [Google Scholar] [CrossRef] [PubMed]
  29. Thomas, K.L.; Honeycutt, E.; Shaw, L.K.; Peterson, E.D. Racial differences in long-term survival among patients with coronary artery disease. Am. Heart J. 2010, 160, 744–751. [Google Scholar] [CrossRef] [PubMed]
  30. Turer, A.T.; Mahaffey, K.W.; Honeycutt, E.; Tuttle, R.H.; Shaw, L.K.; Sketch, M.H.; Smith, P.K.; Califf, R.M.; Alexander, J.H. Influence of body mass index on the efficacy of revascularization in patients with coronary artery disease. J. Thorac. Cardiovasc. Surg. 2009, 137, 1468–1474. [Google Scholar] [CrossRef]
  31. Manikandan, S. Heart attack prediction system. In Proceedings of the 2017 International Conference on Energy, Communication, Data Analytics and Soft Computing, ICECDS, Chennai, India, 1–2 August 2017. [Google Scholar]
  32. Layeghian Javan, S.; Sepehri, M.M. A predictive framework in healthcare: Case study on cardiac arrest prediction. Artif. Intell. Med. 2021, 117, 102099. [Google Scholar] [CrossRef]
  33. Weng, S.F.; Reps, J.; Kai, J.; Garibaldi, J.M.; Qureshi, N. Can Machine-learning improve cardiovascular risk prediction using routine clinical data? PLoS ONE 2017, 12, e0174944. [Google Scholar] [CrossRef]
  34. Alaa, A.M.; Bolton, T.; Di Angelantonio, E.; Rudd, J.H.F.; van der Schaar, M. Cardiovascular disease risk prediction using automated machine learning: A prospective study of 423,604 UK Biobank participants. PLoS ONE 2019, 14, e0213653. [Google Scholar] [CrossRef]
Figure 1. The flowchart of the ML applications on the DukeCath dataset.
Applsci 13 05191 g001
Figure 2. Heatmaps of different feature groups. (A) The combination of demographics information and patient medical history features heatmap; (B) included all patient examination results (physical examination, vital signals, laboratory results); and (C) the heatmap of all the CR features.
Applsci 13 05191 g002
Table 1. Performance of ML models in predicting cardiovascular events and treatments, including CABG, PCI, VS, stroke, and MI.
ModelAccuracy (%)Sensitivity (%)Specificity (%)AUROC (%)
LDA88.1392.2085.0593.67
KNC 183.0377.5387.2089.53
DTC83.5882.0084.7883.39
GNB75.9095.6860.8989.15
SVC87.3191.3584.2493.87
LR88.4789.5887.6393.57
RFC89.6993.8386.5595.76
GBC89.0591.8586.9395.58
ABC88.5389.0988.1194.41
MLP 287.6187.5387.6894.26
1 KNC model with setting the weights parameter as ‘distance’ was better than its default. 2 With a hidden layer of 34 dimensions as the best MLP model among the model selection.
Table 2. Performance of the RFC model trained without CR and trained only with CR.
ModelAccuracy (%)Sensitivity (%)Specificity (%)AUROC (%)
No-CR67.8959.3274.3973.97
CR88.9091.9286.6195.37
Table 3. Performance of ML models in the prediction of receiving PCI treatments.
ModelAccuracy (%)Sensitivity (%)Specificity (%)AUROC (%)
LDA89.3694.0087.1496.19
KNC 185.3473.2491.1091.15
DTC87.1281.7889.6785.72
GNB36.3297.817.0353.86
SVC89.2188.0089.7895.69
LR89.6287.2090.7795.76
RFC91.4095.6289.4097.46
GBC92.0795.5090.4498.02
ABC90.3689.3990.8296.91
MLP 289.5886.6290.9996.10
1 KNC model with setting the weights parameter as ‘distance’ was better than its default. 2 with a hidden layer of 43 dimensions was the best MLP model among the model selection.
Table 4. Performance of the GBC model trained without CR and trained only with CR.
ModelAccuracy (%)Sensitivity (%)Specificity (%)AUROC (%)
No CR72.5747.8784.3476.66
CR91.6395.6289.7397.93
Table 5. Performance of ML models in predicting receiving CABG treatments.
ModelAccuracy (%)Sensitivity (%)Specificity (%)AUROC (%)
LDA93.9684.0395.497.52
KNC 192.3663.8896.5189.57
DTC92.0769.5895.3582.46
GNB62.8688.9759.0683.82
SVC94.5873.0097.7396.33
LR94.7375.6797.5196.86
RFC95.3187.8396.4098.21
GBC95.4586.3196.7998.33
ABC94.8382.5196.6297.68
MLP 294.5872.2497.8497.05
1 KNC model with setting the weights parameter as ’distance’ was better than its default. 2 with a hidden layer of 38 dimensions was the best MLP model among the model selection.
Table 6. Performance of the GBC model trained without CR and trained only with CR.
ModelAccuracy (%)Sensitivity (%)Specificity (%)AUROC (%)
No CR86.6520.1596.3476.12
CR94.4985.1795.8497.73
Table 7. Performance of models trained after feature selections.
Model 1Accuracy (%)Sensitivity (%)Specificity (%)AUROC (%)
Risk-RFC88.1789.7286.9891.68
PCI-GBC89.2190.2088.7494.16
CABG-GBC93.8677.5796.2396.47
1 CBRUITS (carotid bruits), S3 (the third heart sound), YRCATH_G (year of cardiac catheterization), HXPEPULC (history of peptic ulcer disease) were removed from the features list. The NUMDZV (the number of significantly diseased vessels) was the only CR feature included.
Disclaimer/Publisher’s Note: The statements, opinions and data contained in all publications are solely those of the individual author(s) and contributor(s) and not of MDPI and/or the editor(s). MDPI and/or the editor(s) disclaim responsibility for any injury to people or property resulting from any ideas, methods, instructions or products referred to in the content.

