1. Introduction
Emotion recognition has garnered increasing attention from researchers across various interdisciplinary fields. A primary scientific problem in affective computing lies in enabling computers to accurately process, identify, and interpret emotional information conveyed by humans [
1]. Although facial expressions and vocal cues offer valuable insights, they are highly susceptible to individual and cultural differences, potentially reducing the accuracy of emotion recognition [
2]. Therefore, it is essential to employ more direct and objective methods for assessing emotional states. The electroencephalography (EEG) method, which records the electrical activity of pyramidal neurons in the cerebral cortex as a physiological indicator [
3], is characterized by being non-invasive, rapid, portable, possessing high temporal resolution, providing objective measurement of emotions, and being sensitive to emotional changes [
4]. It has attracted significant attention from both academia and industry [
5,
6,
7].
In emotion recognition research using EEG signals, features are typically extracted from the δ, θ, α, and β frequency bands. However, subdivided frequency bands (α1, α2, β1, and β2) contain more detailed emotional information [
8,
9,
10], which can enhance model performance [
11,
12]. Furthermore, the β/α ratio is often regarded as an indicator of arousal, as a higher ratio is associated with greater attentional focus [
13,
14,
15]. This ratio effectively represents emotions in the arousal dimension. Consequently, incorporating the β/α ratio into the feature construction of emotion recognition models is a potential means to improve their performance.
With the growing popularity of olfactory aromatherapy, individuals are increasingly using essential oils to regulate their mood, as this method is convenient, fast-acting, and safe [
16]. Due to their distinct chemical compositions, different essential oils can elicit specific emotional responses. For instance, Satou et al. [
17] investigated the relationship between emotional behavior in mice and brain concentrations of (+)-α-santalol, the primary volatile component of sandalwood essential oil (SEO). They observed its transfer to the brain, indicating that this compound exerts a sedative effect through pharmacological mechanisms. Similarly, Chang et al. [
18] examined the effects of inhaling bergamot essential oil (BEO) on depression-like behaviors and hippocampal neural plasticity in rats subjected to chronic unpredictable mild stress (CUMS). Their findings suggested that BEO alleviates depressive symptoms by preserving hippocampal neuronal plasticity, thereby enhancing mood. This approach of modulating emotions via olfactory stimulation has attracted significant attention from researchers in the field of emotion recognition [
19,
20].
A comprehensive understanding of emotions is beneficial to emotional recognition research. In psychology and computer vision, emotions are classified as categorical or dimensional models [
21,
22,
23]. In the categorical model, Ekman et al. [
23] defined the basic human emotions as happiness, anger, disgust, fear, sadness, and surprise. Sauceda et al. [
24] utilized three neural network algorithms (ShallowFBCSPNet, Deep4Net, and EEGNetv4) to recognize emotions, including happiness, sadness, disgust, neutrality, and fear, in the SEED-V dataset. In contrast, the dimensional emotional model quantifies emotions along multiple dimensions, including valence, arousal, and dominance, thereby capturing more complex emotional states [
22]. Kroupi et al. [
25] established a model based on pleasant, neutral, and unpleasant odors, finding that the model was particularly sensitive to unpleasant smells and exhibited good classification performance. However, the accuracy of the model decreased markedly when distinguishing between pleasant and neutral odors. This may indicate that the use of olfactory stimuli to regulate emotions is effective, as exogenous stimuli can enhance emotional self-monitoring [
26], thereby facilitating the understanding of emotions. Despite these advancements, existing research in emotion recognition has primarily focused on the valence dimension. In reality, each emotional state is a linear combination of various dimensions. Accurate emotion recognition requires the simultaneous consideration of multiple emotional dimensions. The widely used VA (valence–arousal) dimensional emotional model links valence to the degree of pleasure and arousal to the degree of excitement, with higher dimension values corresponding to greater emotional intensity. This model treats emotional experiences as a continuum of related but often ambiguous states, effectively capturing the nuances of emotional expression [
27].
This study investigates the emotional effects of inhaling SEO, which is believed to induce relaxation in olfactory aromatherapy, and BEO, which is thought to enhance concentration. By combining subjective self-report scores with objective EEG spectral analysis, we assessed and validated the emotional effects induced by inhaling SEO or BEO. Using EEG data collected after the inhalation of SEO or BEO, we introduced a novel feature construction method, namely extracting features from six frequency bands (δ, θ, α1, α2, β1, and β2) across all electrodes in five brain regions, and incorporating the β/α ratio as an initial feature. This approach led to the development of a high-performance model for classifying low-arousal (SEO) and high-arousal (BEO) emotions. The model enables rapid and accurate differentiation between various emotional states, facilitating timely monitoring of emotional changes. It provides an effective tool for screening essential oils that can evoke distinct emotional responses in various applications, such as aromatherapy, human–computer interaction, and multimedia.
2. Materials and Methods
2.1. Participants
Fifty young healthy adults (twenty-eight females, aged 22.71 ± 1.98 years; twenty-two males, aged 22.73 ± 1.24 years, mean ± SD) were recruited from Shanghai Institute of Technology. All participants provided written informed consent and were compensated monetarily.
2.2. Olfactory Stimulation
According to previous studies, sandalwood essential oil and bergamot essential oil are commonly used in olfactory aromatherapy and are capable of eliciting significant emotional responses [
16]. Specifically, sandalwood essential oil has been associated with emotional relaxation [
17], while bergamot essential oil has been linked to mood enhancement [
18]. These contrasting emotional effects are advantageous for developing machine learning models, as they provide distinct emotional states for classification and analysis. Therefore, in this study, undiluted sandalwood (
Santalum album L.) essential oil (SEO) and bergamot (
Citrus medica L. var.
sarcodactylis Swingle) essential oil (BEO), sourced from Quintis Trading Co., Ltd. (Xiamen, China) and Zhejiang Golden Hand Biotechnology Co., Ltd. (Zhejiang, China), respectively, were employed to produce olfactory stimuli. For the convenience of the participants, unscented aroma diffuser woods were procured as carriers for the essential oils. The EEG data obtained during the inhalation of SEO was designated as 0 (negative sample), and the data corresponding to BEO inhalation was marked as 1 (positive sample).
2.3. Experimental Design
The experiment comprised three distinct sessions (
Figure 1A). Prior to each session, participants engaged in a brief period of physical relaxation (up to one minute) in preparation for the EEG data acquisition. During the EEG recording of each session, participants held a diffuser wood (no fragrance) approximately 3 cm from their nose to inhale the essential oil for a duration of two minutes, while being instructed to limit bodily movements and maintain normal eye openness. The diffuser wood was subjected to the following treatments across the sessions: (1) no treatment; (2) addition of 0.1 g SEO; (3) addition of 0.1 g BEO. Subsequent to the EEG data collection in the second and third sessions, participants completed a 30 s questionnaire to assess their emotional responses to the essential oils, based on the valence–arousal (VA) emotion model [
27]. They rated the oils on a scale of valence and arousal from 1 to 9, with 1 indicating low pleasantness and excitement, 9 indicating high, and 5 being neutral. To prevent olfactory cross-contamination, the experimental area was ventilated for one minute following each inhalation of essential oil.
2.4. EEG Recording
EEG data were captured using an EEG acquisition device (eggo
TM mylab, ANT Neuro, Hengelo, The Netherlands), equipped with 32 AgCl electrodes arranged according to an expanded 10–20 system [
28] (refer to the “Channel Locations” module in
Figure 1B). The impedance of the electrodes was maintained below 5 kΩ. A band-pass filter was applied, featuring a low-pass cutoff frequency of 1 Hz and a high-pass cutoff frequency of 30 Hz. Concurrently, a notch filter was utilized to attenuate the 50 Hz power line noise, with cutoff frequencies set at 49 Hz and 51 Hz. The sampling rate of EEG device was established at 512 Hz.
2.5. EEG Data Preprocessing
The EEG data were re-referenced to the average values of the M1 and M2 electrodes at the bilateral mastoids, after which the reference electrode was excluded, leaving 30 electrodes for analysis. The data were processed using EEGLAB (version 2024.0) [
29] and MATLAB (R2024a) functions. Contaminants, such as eye blinks and motion artifacts, were mitigated using the second-order blind identification (SOBI) algorithm [
30], with all parameters remaining default. Baseline drift was minimized by applying a detrending function to the continuous linear trend present in the data from each electrode using MATLAB, with all parameters remaining default. Ultimately, one minute of continuous EEG data were preserved for further analysis.
2.6. Spectral Decomposition
The power spectral density (PSD) was estimated using the Welch method, employing a Hanning window of 2 s for segmentation and an overlap of 256 samples (50% overlap rate). The number of discrete Fourier transform (DFT) points was 1024.
Since high-frequency signals are often doped with electromyographic (EMG) artifacts, these are difficult to remove cleanly in long-term monitoring [
31], which, in turn, affects the experimental results. The 1–30 Hz range is a common EEG study frequency band range which can provide most of the emotional information [
32]. Therefore, this study focused on the PSD within the 1–30 Hz frequency range, which constitutes the band of interest. Given the distinct biological significance of EEG signal frequency bands [
8,
9,
10,
33,
34], the 1–30 Hz range was segmented into six sub-bands, namely delta (δ, 1–4 Hz), theta (θ, 4–8 Hz), alpha1 (α1, 8–10 Hz), alpha2 (α2, 10–13 Hz), beta1 (β1, 13–20 Hz), and beta2 (β2, 20–30 Hz). The PSD of all frequency points within each frequency band at each electrode was averaged to obtain the mean PSD value for that band. Additionally, we introduced the β/α ratio as a new metric, since it reflects the level of brain arousal [
13,
14,
15]. Subsequently, we averaged the PSD of the β/α ratio across all electrodes. It should be noted that in the β/α ratio, β represents the entire β frequency band (13–30 Hz), while α represents the entire α frequency band (8–13 Hz).
The brain was divided into five regions of interest (ROIs), namely F-ROI, T-ROI, C-ROI, P-ROI, and O-ROI, with electrodes in each ROI distinguished by unique colors (refer to the “Channel Locations” module in
Figure 1B). Given that this study focuses exclusively on the arousal dimension of emotions, the α frequency band, which is associated with internal attention [
35], and the β/α ratio, which serves as a potential indicator of arousal [
14], are sufficient to support the electroencephalographic analysis conducted in this research. In addition, the α frequency band is considered to have the highest retest reliability and is a characteristic of the internal stability of the individual [
36], so no other separate EEG bands (1–30 Hz) were visualized and further analyzed. To facilitate an intuitive comparison of the PSD across different brain ROIs before and after inhaling SEO or BEO, we averaged the PSD of three metrics (α1, α2, and β/α) at each electrode in both the resting state (RS) group and the inhalation of SEO or BEO groups, and then computed the intragroup averages to generate topographic maps. A paired
t-test (one-tailed) was conducted on the average PSD of the three metrics at each electrode between groups, with a significance level of α = 0.05. Additionally, we plotted the spectrograms of the intersubject average PSD across different ROIs for all frequency points within the 8–30 Hz range (with a frequency resolution of 0.5 Hz). The PSD for each ROI was calculated as the average of all electrodes in that region. Paired
t-tests (one-tailed) were also performed on the intersubject average PSD of each metric between the RS and SEO or BEO groups across different ROIs, with a significance level of α = 0.05.
2.7. Division of the Training Set and Test Set
The division of the dataset into training and test sets followed the conventional 8:2 ratio. To ensure a balanced representation of positive and negative samples, 40 positive and 40 negative samples were randomly selected to form the training set, while 10 positive and 10 negative samples constituted the test set.
2.8. Model Selection and Feature Construction
We employed three classic models for emotion recognition, namely discriminant analysis (DA), support vector machine (SVM) [
37], and random forest (RF). In the label assignment, EEG data from SEO inhalation were labeled as 0 (negative class), and EEG data from BEO inhalation were labeled as 1 (positive class). Given the potential of the β/α ratio as an arousal indicator, we introduced it during feature construction. The mean PSD of traditional EEG frequency bands (δ, θ, α1, α2, β1, and β2) and the β/α ratio at each electrode in all ROIs were used as initial features. Each ROI thus contributed 7 initial features, resulting in a total of 35 features (see the “Dataset” module in
Figure 1B). To assess the impact of incorporating the β/α ratio on model performance, we constructed two sets of models. The first set (DA-1, SVM-1, RF-1) used traditional EEG frequency bands (δ, θ, α1, α2, β1, and β2) for feature construction, while the second set (DA-2, SVM-2, and RF-2) incorporated the β/α ratio, with all other conditions kept constant.
To enhance numerical stability and expedite model convergence, we applied standardization and normalization to the dataset, which consists of a 100 by 35 array. We performed both processes column-wise. Standardization adjusted the mean of each feature to zero and the standard deviation to one. Normalization scaled the feature data to the [−1, 1] interval, thereby mitigating the influence of outliers on the model. Given that the DA and RF models are insensitive to the range of feature data, we normalized the datasets only for these models. Conversely, the SVM model, which is sensitive to feature data range, underwent both standardization and normalization. To eliminate redundant information and improve model performance, we applied the partial least squares (PLS) regression algorithm for dimensionality reduction and selected the first m components, where the cumulative explained variance ratio exceeded 95%. The final dataset used for model input had a size of 100 by m (samples: 100, features: m).
2.9. Model Optimization
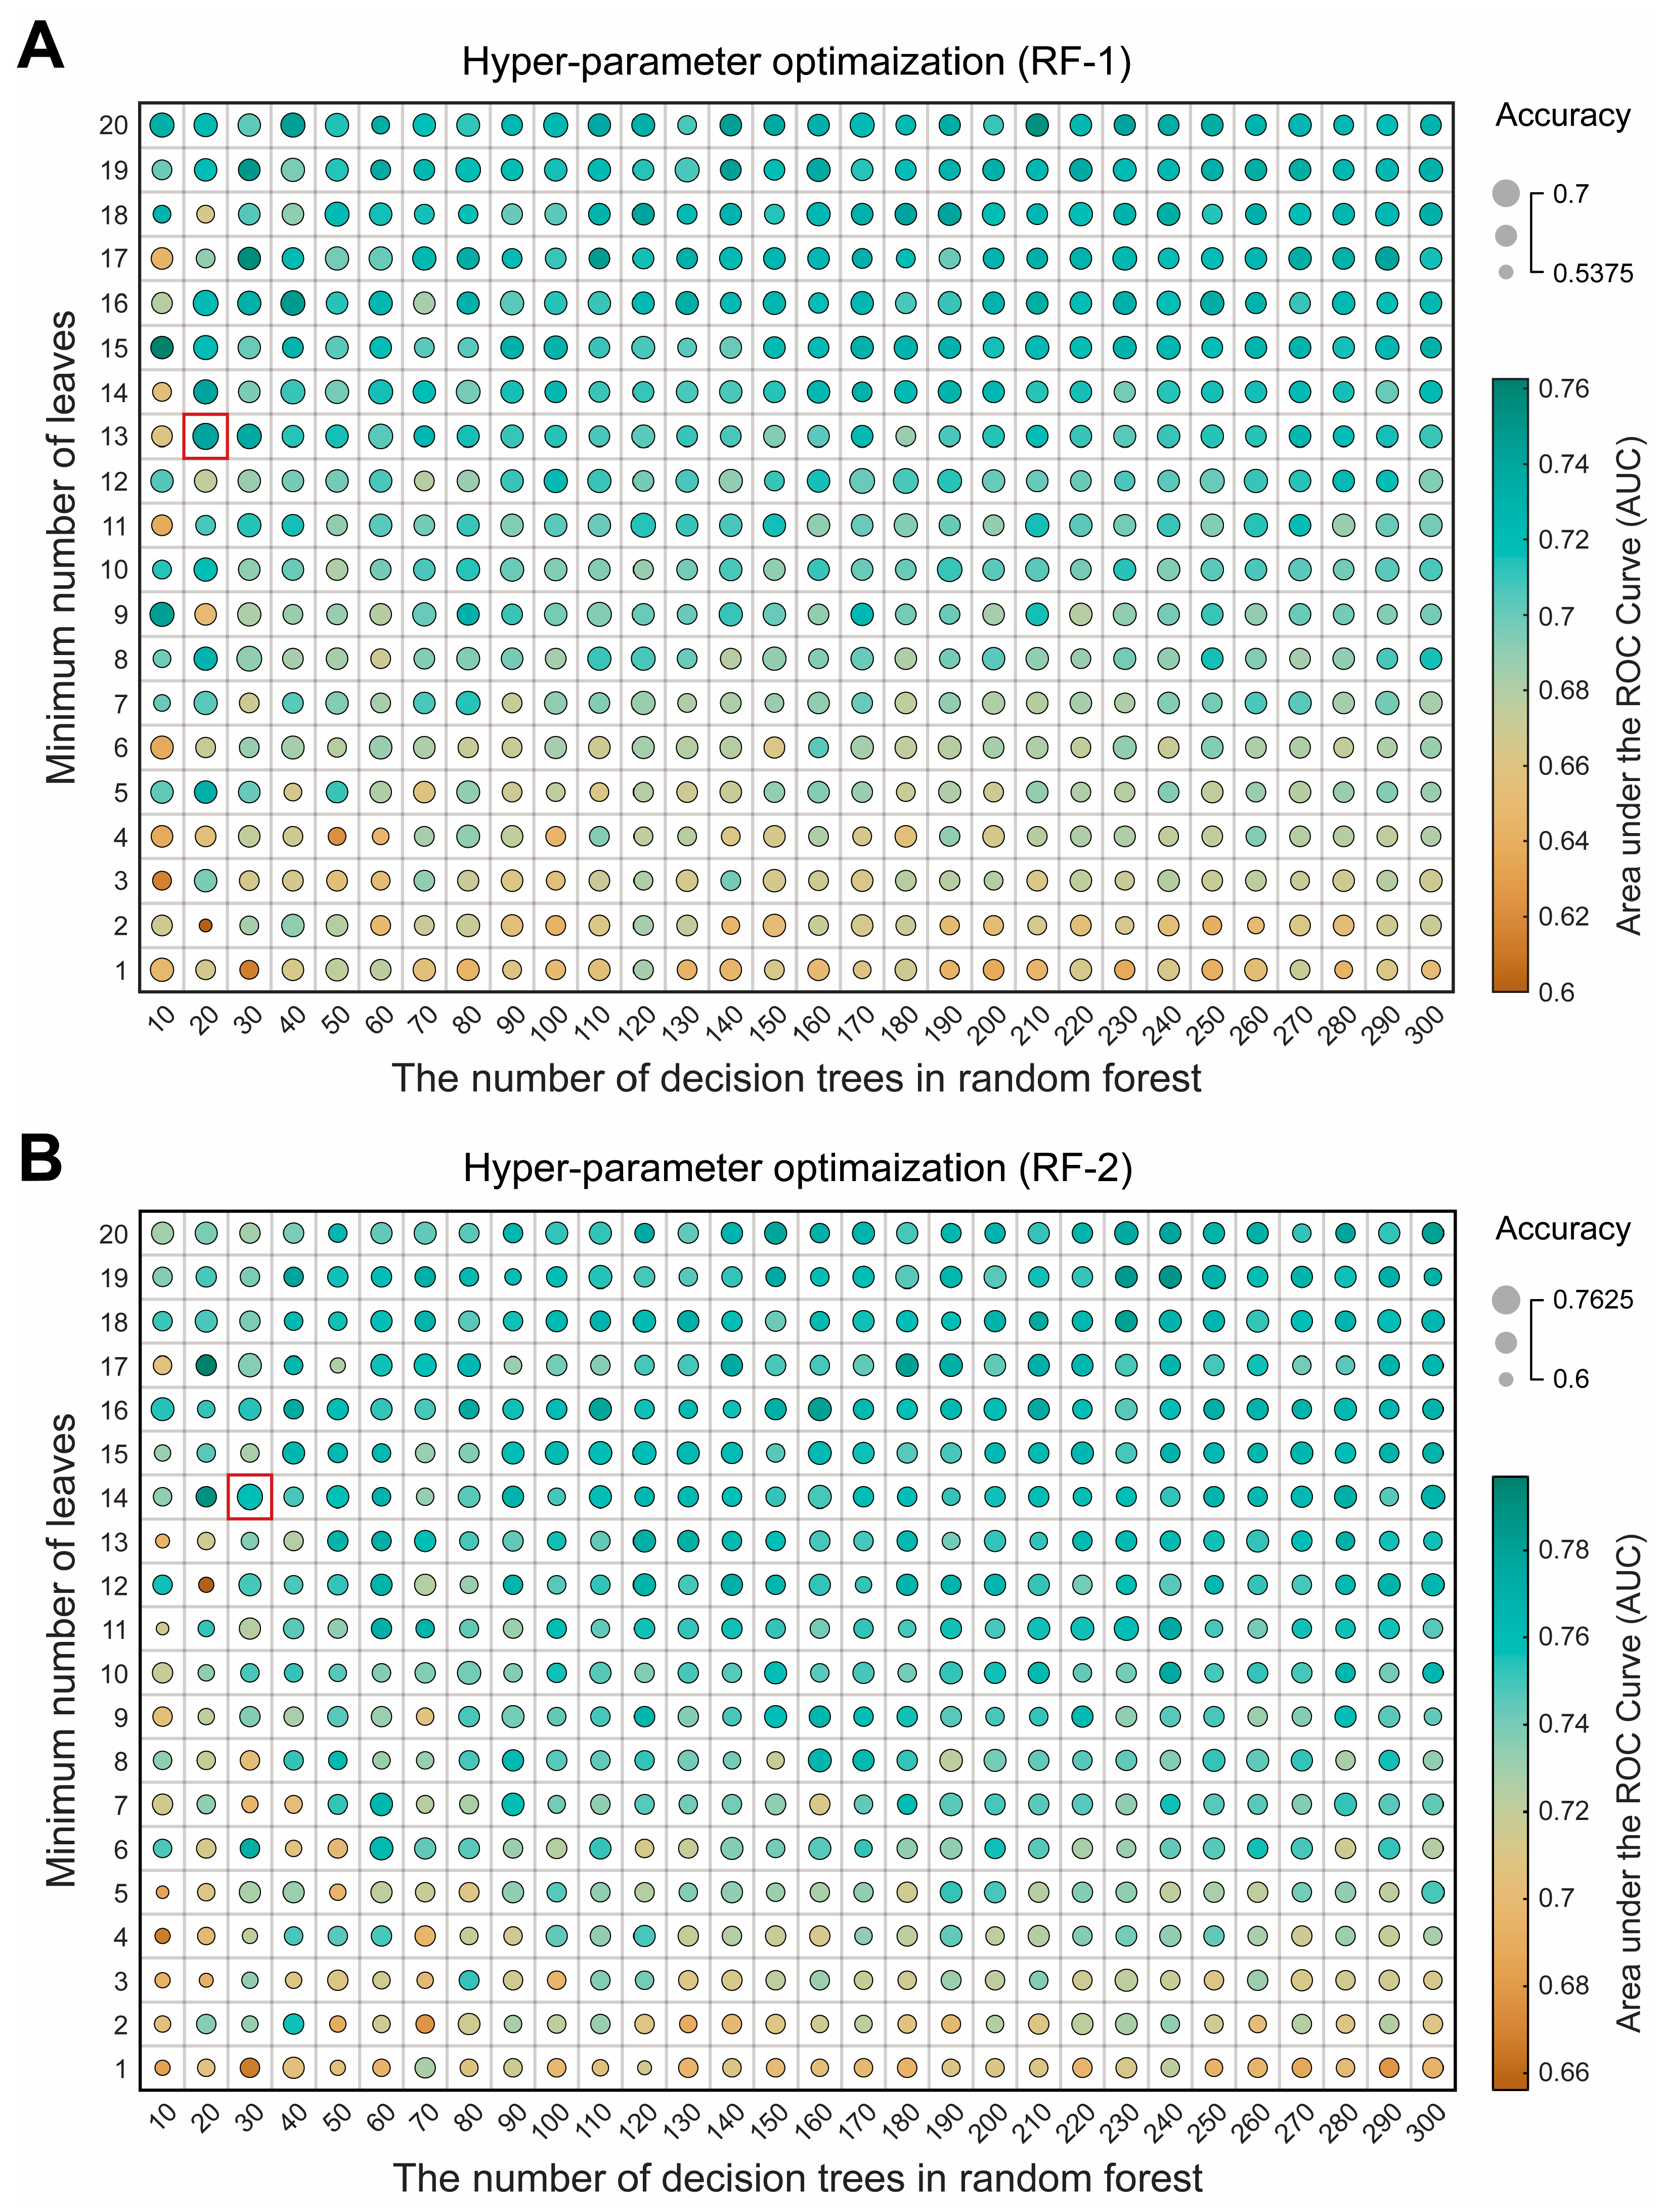
We constructed the models based on the training set to find the optimal hyperparameters. For the DA model, due to its simplicity, hyperparameter optimization was not performed, and the discriminant type was set to “diaglinear”. For the SVM and RF models, 5-fold cross-validation was conducted during each grid search (
Supplementary Figure S1) to identify the best hyperparameters. Notably, the kernel function used in the SVM was the radial basis function (RBF). The objective for DA and SVM was accuracy, while for RF, the objective was accuracy plus AUC. In the SVM, the hyperparameters selected were cost (c) and gamma (g), both of which were subject to grid search with exponential growth (base 2). The grid search range for c and g was from 2
−8 to 2
8. For RF, the hyperparameters selected were the number of decision trees and the minimum number of leaves, with step sizes of 10 and 1, respectively. The grid search range for these parameters was from 10 to 300 and from 1 to 20.
2.10. Model Testing
To effectively and quantitatively assess the performance of each binary classification model, we utilized the following metrics on the test set: accuracy, precision, sensitivity, specificity, and
F1 score. Accuracy is defined as the ratio of the number of samples correctly predicted by the model to the total number of samples. Precision denotes the fraction of positively predicted samples that are indeed positive. Sensitivity is the proportion of actual positive samples that are correctly identified by the model. Specificity refers to the proportion of actual negative samples that the model accurately classifies as negative. The
F1 score, the harmonic mean of precision and sensitivity, considers both precision and recall. These metrics are calculated according to the following “Equations (1)–(5)”:
where
TP and
TN represent the counts of positive and negative samples that the model correctly identified, respectively. Conversely,
FP and
FN denote the counts of positive and negative samples that the model incorrectly identified, respectively.
We constructed the receiver operating characteristic (ROC) curve to assess the overall performance of model. The ROC curve is derived from a series of varying classification thresholds for the model. At each threshold, we calculate the true positive rate (TPR) and false positive rate (
FPR) of the model, which serve as the coordinates (
FPR,
TPR) for the curve [
38]. The TPR, synonymous with sensitivity, and the
FPR, defined by “Equation (6)”, represent the proportion of negative samples incorrectly classified as positive by the model. The metrics in “Equations (1)–(6)” range from 0 to 1, with values closer to 1 indicating superior model performance. Notably, an AUC of 0.5 suggests that the classification capability of model is no better than random chance.
2.11. Statistical Analysis
Unless otherwise stated, all statistical tests were conducted using the built-in functions in MATLAB (R2024a). All statistical tests reported in this study were paired t-tests (one-tailed), the confidence level was 95%, and p-values < 0.05 were considered significant. When performing paired t-tests, the RS group was used as the first input sample data group. This study conducted multiple paired t-tests between electrodes or regions, but did not perform statistical corrections (such as FDR correction), which may lead to an increase in Type I errors, reducing the reliability of validating hypotheses to some extent. However, this approach also reduces the generation of Type II errors, contributing to the screening of potential candidate electrodes or brain regions.
4. Discussion
This study is the first to use the inhalation of SEO or BEO as an olfactory stimulus for emotion recognition based on the EEG signals of participants. By subdividing the α and β frequency bands, introducing new variables (β/α), and incorporating different ROIs, new EEG spectral features were constructed, leading to the development of a high-performance emotion recognition model. In the performance test of the classification models, the introduction of the β/α value markedly improved the performance of all models (DA, SVM, and RF). Among them, the RF model demonstrated the best performance in handling high-dimensional frequency–spatial domain EEG signal characteristics, indicating its effectiveness as a tool for analyzing odor-induced EEG emotion recognition.
The subjective self-reported results showed that inhaling SEO generally induced low-arousal, high-valence emotions, while inhaling BEO generally induced high-arousal, high-valence emotions. These results align with previous studies showing that SEO has relaxing and calming properties [
40]. This may be due to its main volatile component (+)-α-Santalol [
17]. BEO has mood-boosting and attention-focusing properties [
41], and limonene may play an important role as the main volatile component of BEO [
42]. Notably, the self-reported results also conveyed interesting information: in the arousal dimension, male participants were more sensitive to SEO than female participants, perceiving SEO as inducing lower arousal emotions; in the valence dimension, the ratings for BEO were highly dispersed, especially among male participants.
Current EEG spectral analysis research generally recognizes that different frequency bands have different physiological meanings [
33,
43]. For example, alpha rhythm synchronization is associated with enhanced calmness [
44], while beta rhythms usually occur when we are alert, focused, and engaged in problem solving [
45]. Furthermore, studies have shown that a higher β/α ratio is associated with increased brain focus [
13,
14,
15]. In the topographic analysis, we found that compared to RS, inhaling SEO significantly increased the PSD of the alpha1 frequency band in the frontal lobe, right temporal lobe, central area, and parietal lobe, and significantly increased the PSD of the alpha2 rhythm mainly in the frontal lobe, right and central parietal lobes, and occipital lobe. Inhaling BEO significantly increased the PSD of the alpha1 rhythm in the prefrontal lobe, left temporal lobe, and a few electrodes in the central area, and significantly increased the PSD of the alpha2 rhythm mainly in the frontal lobe, right and central parietal lobes, and left occipital lobe. It is noteworthy that inhalation of SEO or BEO significantly alters the alpha1 and alpha2 rhythms in the frontal lobe, possibly due to the involvement of the orbitofrontal cortex in odor processing [
46]. More interestingly, inhalation of SEO significantly reduced the PSD of the β/α ratio across all ROIs, while inhalation of BEO significantly increased the PSD of the β/α ratio in the right temporal lobe. These findings suggest that inhaling SEO promotes brain relaxation, while inhaling BEO enhances focus, which is consistent with the self-reported results in this study. Additionally, they further support the potential of the β/α ratio as an arousal marker. Our spectral analysis results show that, compared to the RS, inhalation of SEO significantly increases the PSD of the alpha1 rhythm in all ROIs, while the alpha2 rhythm shows a significant increase only in the frontal lobe. In contrast, the inhalation of BEO results in a significant increase in the PSD of both alpha1 and alpha2 rhythms exclusively in the frontal lobe. The differences between the alpha1 and alpha2 results may be due to the former reflecting general task demands, such as attention processes [
9,
34], and the latter possibly reflecting specific task demands, such as semantic memory processes [
10].
In the final model test, the comprehensive performance of the classifiers was ranked as follows: RF > SVM > DA. This suggests that more complex classifiers are better at identifying emotions induced by odors and reflected by EEG. RF (random forest) likely outperforms others [
47] because it can more accurately capture nonlinear relationships between features by integrating multiple decision trees [
48]. SVM (support vector machine), while capable of addressing nonlinear problems through kernel functions that map data to high-dimensional space, requires careful parameter tuning [
49] and is more sensitive to feature engineering than RF [
50]. Consequently, RF surpasses both the linear model (DA) and the kernel-driven SVM. This finding also supports the notion that “the mapping relationship between EEG signals and emotional states is inherently nonlinear”. Additionally, when comparing models with the new β/α features (DA-2, SVM-2, and RF-2), the performance indices were higher than those of models without these features (DA-1, SVM-1, and RF-1). This indicates that the β/α ratio is directly linked to emotional arousal. Furthermore, the improvement in cross-model performance with the β/α features suggests that the β/α ratio is a universal, robust, and interpretable biomarker. By integrating this emotion marker with advancements in wearable device miniaturization technology [
51,
52] and edge computing deployment frameworks [
53], this framework enables the construction of an olfactory stimulation-driven EEG emotion recognition model. The model supports rapid and precise identification of diverse emotional states, enables real-time monitoring, and advances the application of olfactory-driven emotion recognition in such domains as aromatherapy, human–computer interaction, and multimedia.
The limitations of this study include the following: (a) the absence of additional demographic data (e.g., educational level, ethnicity, and handedness) that may influence EEG signals, potentially limiting the generalizability of findings to broader populations; (b) the evaluation of the model relied solely on a single 80/20 split for training and test sets, which may constrain the generalizability of its performance; (c) controlled laboratory settings may not fully replicate real-world olfactory environments, thereby reducing the ecological validity of the results.
5. Conclusions
This study explored the effects of inhaling SEO or BEO on emotions from both subjective (self-reporting) and objective (EEG) perspectives. In addition, this study utilized EEG to assess emotions in odor-induced emotion recognition. By incorporating the β/α ratio and subdivided EEG frequency bands (1–30 Hz), features were extracted and integrated into a machine learning framework, resulting in the development of three emotion recognition models. The experimental results confirmed that the inhalation of SEO or BEO effectively induced low or high arousal emotions, ensuring the authenticity of the emotional labels in the emotion recognition process. Furthermore, the inclusion of the β/α ratio markedly improved the performance of all models (DA, SVM, and RF). For instance, the accuracy of the DA and SVM models increased by 5%, while the accuracy of RF model improved by 10%. Notably, the RF model demonstrated a distinct advantage over the other two models in handling emotion recognition based on EEG signals induced by olfactory stimuli, with RF-1 and RF-2 achieving test accuracies of 85% and 95%, respectively, which may be due to the high nonlinear correlation of EEG characteristics, while RF model has excellent ability to capture nonlinear characteristics.
This study validated the effectiveness of the β/α ratio as an objective emotional indicator and highlighted its importance in EEG-based emotion recognition models. These models are capable of classifying emotions with different levels of arousal and contribute to a deeper understanding of how essential oils influence brain activity and emotions, thereby providing scientific support and new research approaches for olfactory aromatherapy.
However, there are still several limitations in the future. For example, different individuals have different sensitivity to odors, which may lead to inconsistencies in emotional responses, which, in turn, affects the generalization ability of the model. In addition, the limited variety of essential oils used in the current study will have led to insufficient coverage of the emotions induced and limit the application scenarios of the model. Future research should further explore factors, such as individual differences and essential oil types, to improve the practicality and robustness of the emotion recognition model.


 ,
, 