1. Introduction
With the widespread adoption of location-based social networks (LBSNs), massive quantities of check-in data have been generated continuously, revealing complex patterns of human mobility at different scales [
1,
2]. These check-in records not only contain basic geographical coordinates and timestamps but also encode rich hierarchical information, from individual venue preferences to district-level activities and city-wide movement patterns. This multi-scale nature of human mobility data provides unprecedented opportunities for understanding user behaviors at different granularities [
3]. Recent advances in deep learning have shown remarkable success in modeling complex spatio-temporal dependencies in various real-world scenarios, such as high-speed railroad scene parsing from UAV imagery [
4] and fast vehicle detection in traffic environments [
5]. These studies demonstrate the potential of deep models to extract structured representations from rich spatial and temporal cues. However, effectively modeling hierarchical relationships in human mobility data for accurate next point of interest (POI) prediction, as illustrated in
Figure 1, remains a significant challenge due to the need to capture both fine-grained location transitions and coarse-grained mobility patterns.
Early research in POI recommendation primarily focused on matrix factorization approaches [
3,
6,
7,
8,
9,
10], which established foundational methods by integrating user preferences with geographical influence. However, these models often struggle to capture sequential patterns and may not perform well in sparse data scenarios, which can limit their effectiveness in dynamic environments. Building on this foundation, sequential models [
11,
12,
13,
14,
15,
16,
17] have been developed to leverage temporal patterns using advanced neural networks and attention mechanisms [
18] to enhance predictive performance. While models such as Recurrent Neural Networks (RNNs) [
19] and Long Short-Term Memory (LSTM) [
20] networks are adept at capturing temporal dependencies, they still struggle with long-term dependencies and lack global collaborative information, which can lead to performance degradation over time when facing new data. More recently, graph-based models [
21,
22,
23,
24,
25,
26] have emerged as a powerful approach to capturing complex dependencies and relationships. These models utilize graph structures to achieve superior results in POI recommendation by modeling the inherent relationships between users, locations, and check-in sequences. However, in the effort to enhance POI recommendation accuracy, two key challenges emerge: the hierarchical nature of human mobility and data sparsity. Firstly, human movement patterns naturally exhibit a hierarchical structure—from individual venue preferences to district-level activities and city-wide movement patterns. Traditional models that treat all POIs at a single granularity fail to capture these multi-scale relationships, leading to suboptimal recommendations. Secondly, the sparsity of check-in data further complicates the modeling of these hierarchical patterns. Users’ check-ins are often unevenly distributed and concentrated around familiar locations, making it difficult to establish reliable connections between different geographical scales. While existing approaches have made progress in addressing data sparsity, they typically construct single-layer graphs that cannot effectively model the inherent hierarchical relationships in human mobility data.
To address these limitations, we propose a novel hierarchical graph learning framework that models POI relationships at multiple scales. Specifically, we construct a three-level graph structure: a base-level graph capturing direct POI transitions, a region-level graph modeling area-based interactions through spatio-temporal clustering, and a global-level graph representing category-based patterns. To effectively utilize this hierarchical structure, we design a cross-layer information propagation mechanism that enables bidirectional message passing between different levels, allowing the model to capture both fine-grained POI interactions and coarse-grained mobility patterns. Additionally, we introduce a hierarchical POI representation learning strategy that fuses information from multiple scales to generate comprehensive POI embeddings. Our key contributions are as follows:
We propose a novel hierarchical graph learning framework that models POI relationships at multiple scales through a three-level structure, effectively capturing both fine-grained POI transitions and coarse-grained mobility patterns.
We design a cross-layer information propagation mechanism that enables bidirectional message passing between different hierarchical levels, allowing the model to effectively integrate information across scales and address the data sparsity challenge.
Through extensive experimentation on two real-world datasets, we demonstrate that our hierarchical approach significantly outperforms existing state-of-the-art POI recommendation methods.
The remainder of this paper is organized as follows. In
Section 2, we review related work.
Section 3 details the proposed hierarchical graph learning framework. In
Section 4, we present the experimental setup and evaluation metrics.
Section 5 discusses the experimental results and comparative analysis. Finally,
Section 6 presents the limitations and future work, along with a summary of our contributions and future research directions.
2. Related Work
In this section, we review the existing literature on POI recommendation, focusing on matrix factorization models, sequential models, and graph-based models.
2.1. Matrix Factorization Models
The task of next POI recommendation began with the application of matrix factorization methods. One notable approach combines matrix factorization with Markov chains to learn personalized transition graphs [
6]. Some works have recognized the importance of geographical influence [
3] and have introduced a unified POI recommendation framework. To address the challenge of successive personalized POI recommendations, the FPMC-LR model [
7] was developed, embedding personalized Markov chains and localized regions. Further advancements include the PRME and PRME-G models [
8], which incorporate sequential information, individual preferences, and geographical influences. Additionally, some works [
10] have demonstrated the importance of modeling multidimensional contextual information and incorporating social relations.
2.2. Sequential Models
Building on the advances in matrix factorization methods, researchers have explored sequence prediction models to capture more complex temporal patterns in POI recommendation. The Spatio-Temporal Recurring Neural Network (ST-RNN) model [
11] incorporates spatio-temporal contextual information, extending RNNs with time-specific and distance-specific transition matrices. To enhance Long Short-Term Memory (LSTM) networks, the Spatio-Temporal Gated Network (STGN) [
12] introduces spatio-temporal gates to capture relationships between successive check-ins. Addressing the limitations of existing RNN-based methods, the Long- and Short-Term Preference Modeling (LSTPM) method [
13] combines a non-local network for long-term preference with a geo-dilated RNN for learning short-term preferences.
While sequence prediction models have proven effective, the introduction of attention mechanisms and Transformer models [
18] has further advanced the accuracy and performance of POI recommendations. The Long- and Short-Term Preference Learning (LSPL) model [
14] leverages attention mechanisms and LSTM to capture users’ contextual and sequential behavior. Addressing spatio-temporal sparsity and relations, the Spatio-Temporal Attention Network (STAN) [
15] employs self-attention layers to capture non-trivial correlations from non-adjacent locations and non-consecutive visits. The Personalized Long- and Short-Term Preference Learning (PLSPL) model [
16] combines user-specific preferences through a linear combination unit and utilizes attention mechanisms to capture contextual features. The Auto-Correlation Enhanced Multi-Modal Transformer Network (AutoMTN) [
17] uses the Transformer network with an auto-correlation mechanism to model intricate dependencies and cross-modal interactions between POI and category sequences. SelfTrip [
27] introduces a self-supervised representation learning framework that employs a two-stage contrastive learning mechanism and four trip augmentation methods to capture the diversity and uncertainty of users’ travel needs. INSPIRE [
28] focuses on modeling users’ interest sustainability over time for sequential POI recommendation, addressing the dynamic nature of user preferences. Counterfactual user sequence synthesis [
29] employs counterfactual data augmentation to alleviate noise and sparsity issues in sequential POI recommendation, enhancing the robustness of the models.
2.3. Graph-Based Models
Graph-based models have emerged as a powerful approach to better capture complex relationships and dependencies in POI recommendation. The Geographical–Temporal influences Aware Graph (GTAG) model [
21] utilizes geographical and temporal influences within a graph structure to recommend POIs. The Hierarchical Multi-Task Graph Recurrent Network (HMT-GRN) [
22] addresses data sparsity by learning user–region matrices, thereby improving recommendation accuracy. The GETNext model [
23] incorporates a user-agnostic global trajectory flow map and a graph-enhanced transformer to exploit collaborative signals, achieve better next POI recommendation and addressing cold-start problems. DisenPOI [
30] disentangles sequential and geographical influences using contrastive learning, providing more interpretable and effective POI recommendations. The Adaptive Graph Representation-enhanced Attention Network (AGRAN) [
24] replaces pre-defined static graphs with learned graph structures, improving representation learning and capturing dynamic user preferences. The Spatio-Temporal HyperGraph Convolutional Network (STHGCN) [
25] leverages a hypergraph to capture trajectory-level information and combines it with spatio-temporal data, outperforming existing methods and alleviating cold-start issues. The MMPOI framework [
26] incorporates multi-modal content information into POI recommendations using a Multi-Modal Trajectory Flow Graph and an adaptive multi-task transformer, outperforming state-of-the-art methods. GSA-CTM [
31] utilizes GraphSAGE to identify real user preferences and incorporates continuous-time modeling to enhance POI recommendation accuracy. BGSL [
32] constructs a bi-level graph structure to capture global spatio-temporal POI correlations and utilizes auxiliary next-region prediction tasks to alleviate data sparsity issues.
Our proposed HGL explicitly integrates a three-level hierarchical structure with rule-based spatio-temporal clustering, achieving both multi-scale semantic representation and enhanced interpretability.
3. Hierarchical Graph Learning for Next POI Recommendation
Current POI recommendation methods typically rely on single-layer graphs that fail to capture the hierarchical nature of human mobility patterns. These approaches suffer from limited local information, missing hierarchical relationships, and restricted information propagation across different spatial scales.
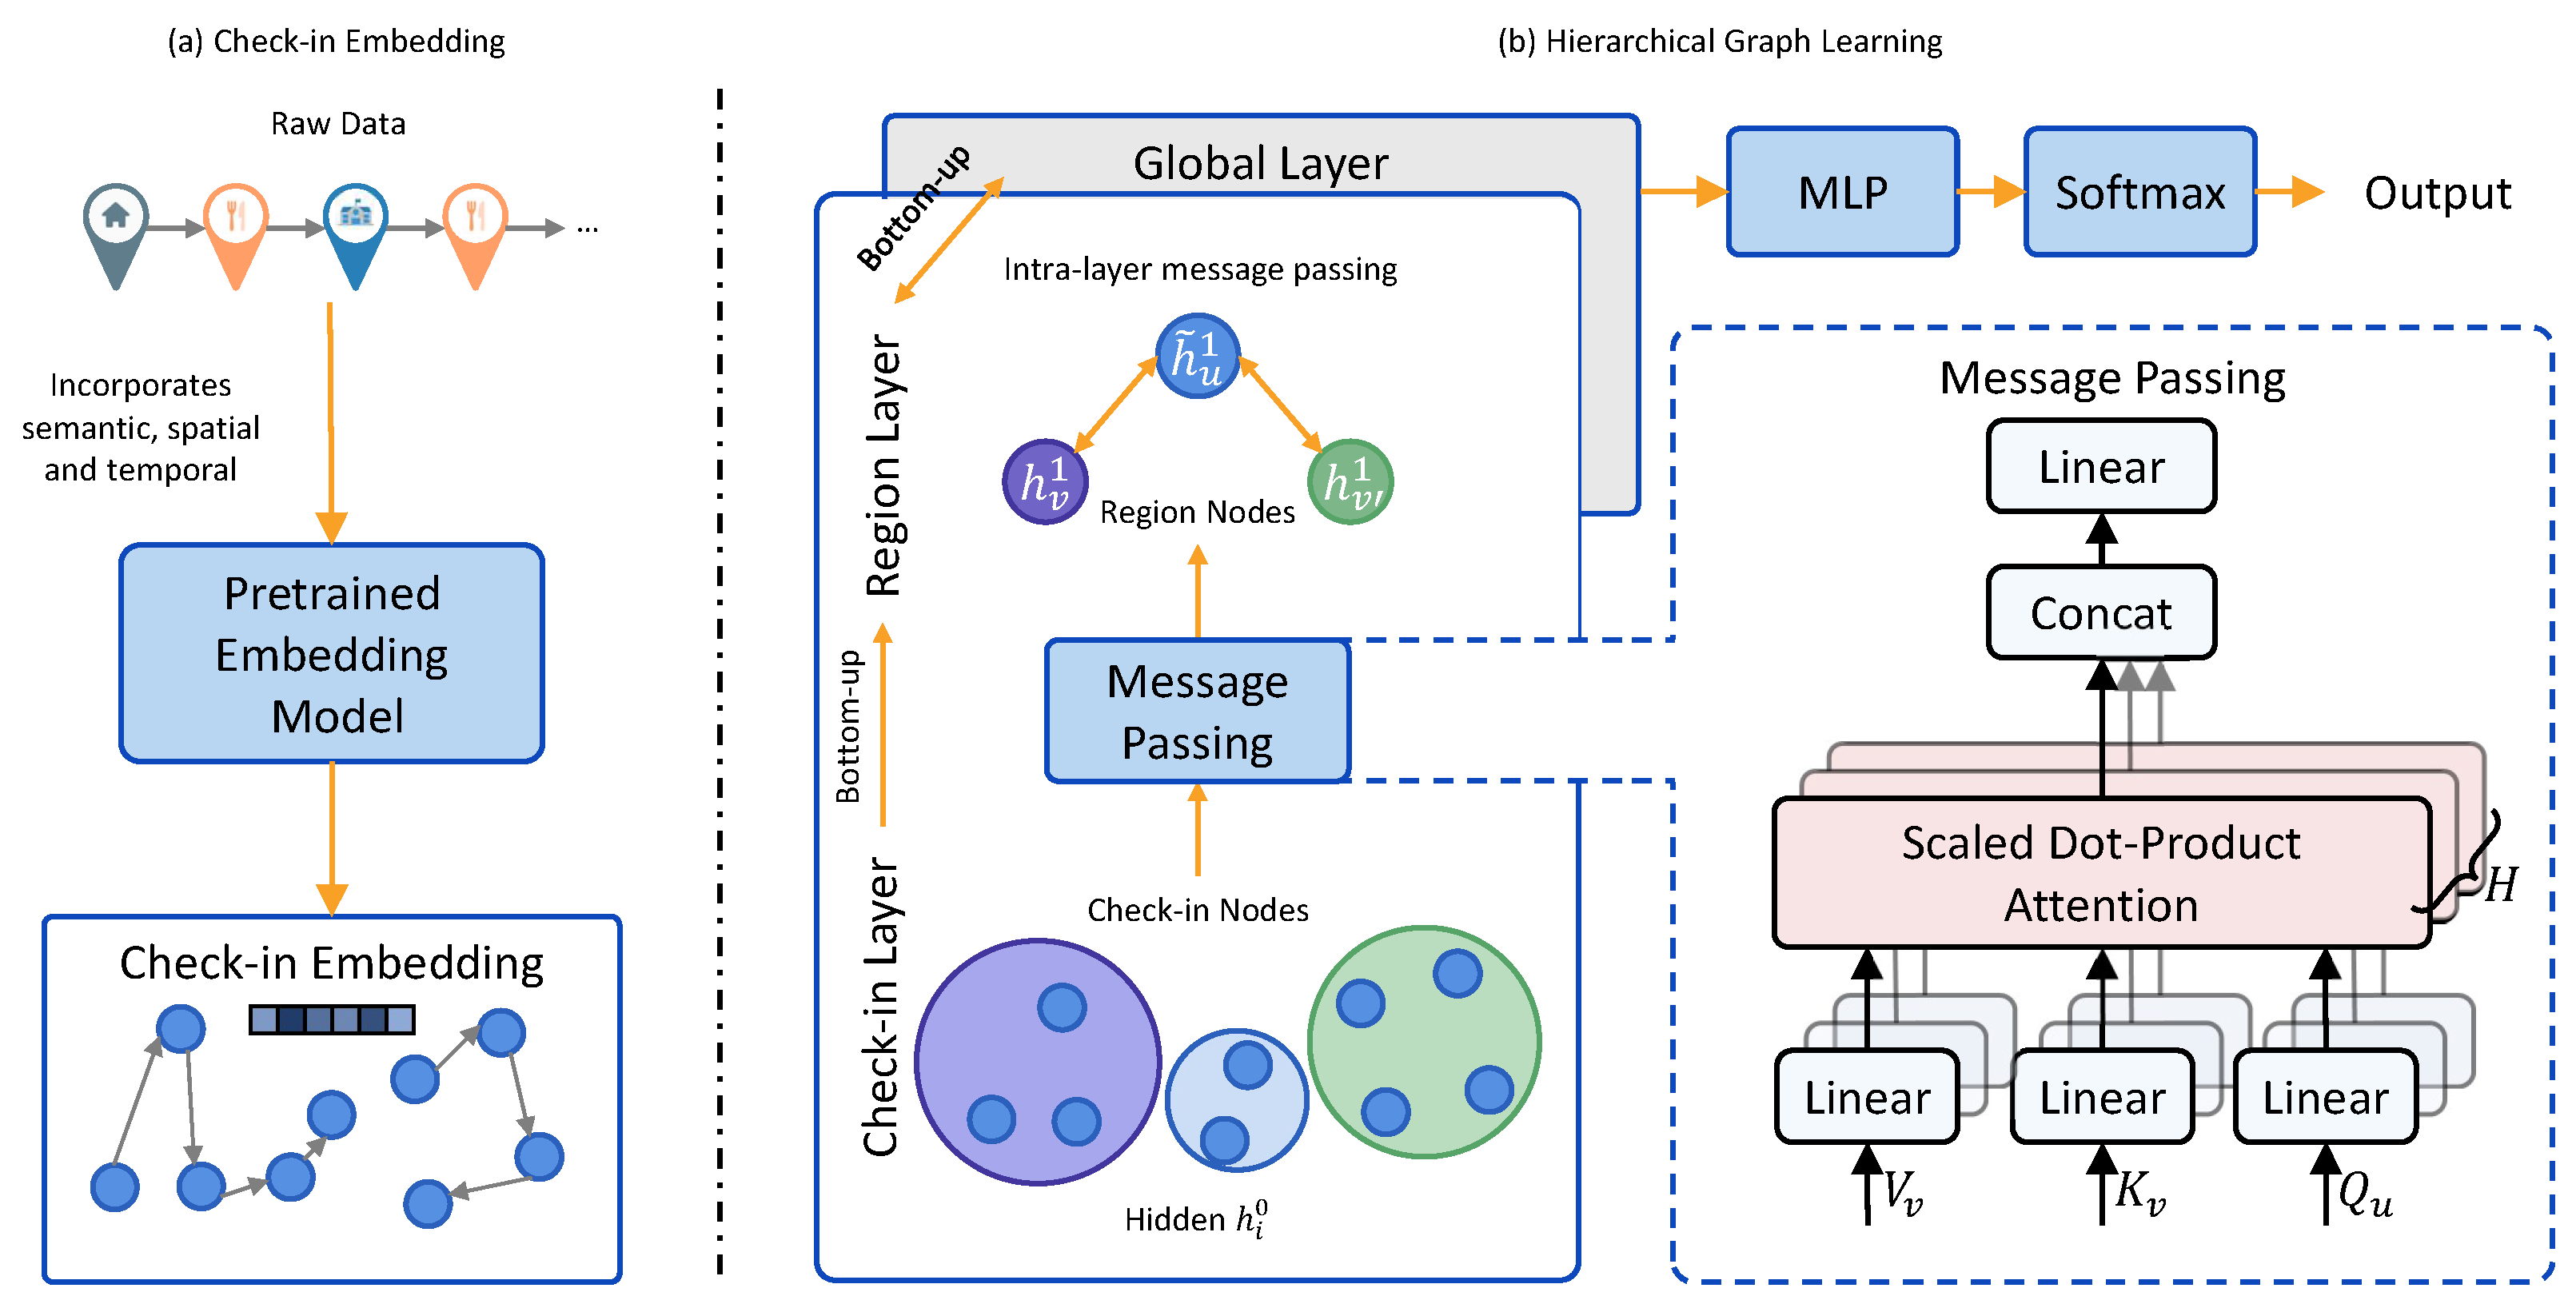
We propose a novel Hierarchical Graph Learning (HGL) framework for next POI recommendation that effectively captures multi-scale mobility patterns. As illustrated in
Figure 2, our approach consists of two main components: (1) a hierarchical graph construction module that builds a three-level graph structure representing POI relationships at different scales, (2) a cross-layer information propagation mechanism that enables bidirectional message passing between hierarchical levels, and, finally, (3) a next POI prediction module that leverages the learned multi-scale representations. This architecture addresses the limitations of existing single-layer graph methods by modeling both fine-grained POI transitions and coarse-grained regional movement patterns simultaneously.
3.1. Hierarchical Graph Construction
Our hierarchical graph construction module builds a three-level graph structure to capture POI relationships at different scales. The overall architecture of HGL is illustrated in
Figure 3. The three levels of the graph structure are as follows:
Base-level graph: This level captures direct check-in transitions. Each node in this graph represents a check-in, and edges between nodes indicate direct transitions between different places.
Region-level graph: This level models area-based interactions through spatio-temporal clustering. We define a region as a group of spatially proximate check-ins that are frequently visited together. Nodes in this graph represent regions, and edges between nodes indicate interactions between regions.
Global-level graph: This level captures broader mobility patterns across the entire city. Each node represents a major geographical area or significant landmark that influences citywide movement flows. Edges between nodes indicate transition frequencies between these macro-level entities, enabling the model to understand high-level movement patterns that transcend individual regions.
Based on the definitions above, we now introduce the construction process of the three-level graph.
3.1.1. Basic-Level Graph
In the construction of our hierarchical graph structure, the base-level graph consists of check-in data. At this level, each node represents an individual check-in, and nodes are not directly connected to each other. This design choice is deliberate, as directly connecting all check-in points would result in an excessively dense graph structure, significantly increasing computational complexity. Instead, we facilitate information transfer and representation learning between base-level nodes indirectly through connections established at higher levels of the graph hierarchy.
3.1.2. Region-Level Graph Construction
For the region-level graph, each node represents a region, defined as a group of spatially proximate check-in locations that are frequently visited together. To maintain the sequential order of node visits and preserve temporal relationships, we employ a strict rule-based clustering approach. We adopt stay points as the representation of spatio-temporal clusters. Specifically, following the approach of extracting stay points [
33], we have designed a procedure to extract spatio-temporal clusters based on a time threshold (
) and a distance threshold (
). For a trajectory containing
n check-ins, a spatio-temporal cluster
C is generated, starting from the first check-in. When subsequent check-ins do not exceed the distance and time thresholds compared to the previous one, they are merged into the current cluster; otherwise, a new cluster is generated. Here,
and
denote the timestamps of check-ins
and
, respectively. The attributes
and
represent the arrival and departure times of a spatio-temporal cluster
s. The algorithm for spatio-temporal cluster extraction is shown as Algorithm 1 below.
| Algorithm 1: Spatio-temporal cluster detection |
![Applsci 15 04979 i001]() |
The edges between spatio-temporal clusters can be established in two ways: by using user information and by analyzing the similarity of clusters.
User Information: First, we discuss edge generation based on user information. According to previous research [
34], users exhibit certain regularities in their travel patterns, particularly the tendency to repeatedly visit certain preferred locations. Based on this assumption, we hypothesize that there is a certain degree of similarity between the locations visited by the same user, and thus, there should be edges between these clusters in the hypergraph. For instance, if a user’s trajectory on Monday is refined into spatio-temporal clusters
and
and the same user’s trajectory on Tuesday is refined into
, we infer that there is some similarity between
and
due to the user’s daily routine. Therefore, edges that facilitate information aggregation between them are warranted. This method aims to enable clusters belonging to the same user to share check-in information, thereby accurately capturing the user’s fine-grained preferences.
Similarity of Clusters: However, relying solely on the same user’s data to fuse information neglects the integral trends of user movement, especially in regions with high popularity. To address this, we also define edges between similar spatio-temporal clusters. For example, if a user’s weekend trajectory is refined into clusters and , and another user’s weekend trajectory into , and if and are similar in context, we consider there to be an edge that can facilitate information integration between these clusters, thereby reflecting the overall trend of location popularity. Specifically, we utilize the Jaccard similarity, a commonly used measure in computing sequence similarity. Through these edges, the hypergraph model can more effectively capture the complex relationships between clusters and different users, thereby improving the accuracy of the next POI recommendations.
3.1.3. Global-Level Graph Construction
For the construction of the global-level graph, we employ the Spatio-Temporal DBSCAN (ST-DBSCAN) algorithm [
35], which extends the traditional DBSCAN algorithm to simultaneously consider both spatial and temporal attributes during clustering. We further cluster the nodes from the regional level to form higher-order cluster structures. These higher-order clusters serve as nodes in the global-level graph, capturing larger areas or functionally specialized districts within a city. These areas consist of region-level nodes that are spatially proximate and exhibit similar temporal visitation patterns.
The edges in the global-level graph are established based on similarity between higher-order clusters. For edge construction, we employ cosine similarity to measure the relationship between global-level nodes. Specifically, we represent each global-level node by computing the average of the feature vectors from its constituent region-level nodes. This approach allows us to preserve the semantic information from lower levels while creating a more abstract representation at the global level.
Given two global-level nodes A and B, with their respective feature vectors derived from averaging their constituent region-level nodes, we calculate their cosine similarity as follows:
If the calculated similarity exceeds a predetermined threshold, we establish an edge between these nodes. This method effectively captures the functional and semantic relationships between different large-scale areas within a city, enabling the model to leverage higher-level geographical patterns for more accurate recommendations.
3.2. Cross-Layer Information Propagation
To fully exploit the hierarchical structure of our graph, we propose a cross-layer information propagation mechanism that enables message passing both within each layer and across different levels. This mechanism allows the model to integrate semantic signals from multiple spatial scales, enhancing the quality of POI representations for recommendation.
The propagation process consists of three stages: (1) bottom-up aggregation from check-in nodes to region-level and then to global-level clusters, (2) intra-layer message passing within each level, and (3) top-down feedback to enrich check-in node representations. At each stage, we employ multi-head attention to capture heterogeneous dependencies and ensure selective aggregation.
3.2.1. Bottom-Up Propagation
In the bottom-up phase, each region-level node aggregates information from its associated check-in nodes, and each global-level node aggregates information from its constituent region-level nodes. For a region-level node
u, we compute its embedding as follows:
where
is the attention weight computed via scaled dot-product attention, while H denotes the number of attention heads in the multi-head attention mechanism. The same formulation is applied at the global level for each node
v using its associated region-level nodes
:
Here, is the transformation matrix that propagates messages from the regional layer (level 1) to the global layer (level 2).
3.2.2. Intra-Layer Message Passing
To model dependencies within each level, nodes at the region and global layers perform intra-layer message passing. For a node
u at layer
,
where the attention weights
are also computed using scaled dot-product attention. For the check-in layer (layer 0), we preserve the initial embeddings.
3.2.3. Top-Down Integration and Output Prediction
After the upward aggregation and intra-layer propagation, we integrate the learned hierarchical information back into the check-in representations. For each check-in node
i, we concatenate its initial embedding with the embeddings of its associated region- and global-level clusters:
where
and
denote the corresponding region and global clusters, while ‖ represents concatenation. This yields the final enriched embedding for POI prediction.
To generate the next POI recommendation, we compute the dot-product similarity between
and all candidate POI embeddings
, followed by a softmax normalization:
The final recommendation is obtained by selecting the top k POIs with the highest predicted probabilities in .
4. Experiment
4.1. Setup
Herein, we describe the experimental setup, including the datasets, evaluation metrics, and baseline models.
4.1.1. Dataset
To compare with prior research, we utilized two widely used datasets for predicting the next POI: NYC (representing New York City) and TKY (representing Tokyo) [
36]. These datasets consist of check-in records collected from Foursquare, the largest LBSN website, from April 2012 to February 2013. Each record in the original data includes the user ID, POI ID, POI category, geographical coordinates, and timestamp. For data preprocessing, we filtered out inactive users (those with fewer than 10 check-ins) and inactive POIs (those with fewer than 10 check-ins at their location).
Subsequently, to segment long-term and recent trajectories, we initially arranged the check-in records in chronological order, where the first
points of the recent trajectories were included as input, while the last point served as the training target. We divided the dataset into training, validation, and test sets in an 8:1:1 ratio. The statistical information of the processed dataset is shown in
Table 1.
4.1.2. Check-In Embedding
In order to obtain a multi-modal representation of check-ins, geospatial, temporal, and semantic data need to be converted into a textual format to match the modality pre-trained in language models. For geographical data, we employed the OpenStreetMap API for reverse geocoding, an open-source tool for geo-spatial data analysis. For the two datasets, we used different geographical label information at various levels of data representation. For NYC, we used “New York” as the city, with
Quarter and
Street fields from the OpenStreetMap API for district and street levels. For TKY, we used “Tokyo” as the city, with
City and
Province fields for district and street levels, respectively. For the pre-trained language model, we chose the BERT model [
37], which is a widely used language model for text embedding and has demonstrated strong potential in representation learning. All of our experiments were conducted on an RTX 4090 GPU.
4.1.3. Baselines
To compare our model with previous research, we selected several common baselines from matrix factorization, sequence models, and graph models as follows:
FPMC [
6]: FPMC is one of the earliest attempts at next POI recommendation, combining matrix factorization and Markov chains to create personalized transition graphs.
PRME [
8]: PRME is a personalized ranking metric embedding method that integrates sequential information, individual preferences, and geographical influence to improve next point-of-interest recommendation performance.
LSTM [
20]: LSTM networks are a classical type of RNN architecture specifically designed to address the challenge of learning long-term dependencies, making them particularly effective for sequential data prediction and analysis, such as human mobility data.
PLSPL [
16]: PLSPL combines user-specific long- and short-term preferences using a linear combination unit and employs LSTM models to capture the distinct influences of locations and categories.
STAN [
15]: STAN utilizes a bi-layer attention architecture to exploit spatio-temporal correlations within user trajectories, enabling interactions between non-adjacent locations and non-consecutive check-ins. It also incorporates personalized item frequency to enhance target recall.
GETNext [
23]: GETNext is a novel graph-enhanced transformer model that integrates global transition patterns, user preferences, spatio-temporal context, and time-aware category embeddings into a transformer framework to improve accuracy in predicting the next POI and address the cold-start problem.
STHGCN [
25]: STHGCN leverages hypergraphs to capture both intra-user and inter-user trajectory information, combining it with spatio-temporal data using a novel hypergraph transformer; this method demonstrates superior performance and effectively addresses cold-start issues.
4.2. Evaluation Metrics
Following previous studies, we use Recall@k and Mean Reciprocal Rank (MRR), which are common metrics for recommender systems, to measure the prediction performance of our framework. The definitions of Recall@k and MRR are as follows:
where
is the number of users,
represents the set of POIs that user
u actually visited in the test set,
denotes the top k POIs recommended to user
u, and
is the rank position of the first relevant POI in the recommendation list for user
u.
4.3. Parameter Setting
We trained our model using the Adam optimizer with a learning rate of , a batch size of 64, and 20 epochs. The number of embedding dimensions was set to 64, and we used a two-head multi-head attention mechanism.
Threshold Selection To construct the region-level graph, we applied rule-based clustering with spatial and temporal thresholds selected to balance granularity and interpretability. A stay point ratio of around 50% offers a practical trade-off—aggregating about half of the check-ins ensures structural richness without overgeneralization. For NYC, we used m and min (49.98%, avg. 48.3 per user), and for TKY, we used (50.01%, avg. 88.3) and the same spatial threshold.
Global-Level Clustering We applied a spatio-temporal DBSCAN algorithm with time_weight = 0.5, eps = 0.05, and min_samples = 20. These parameters were selected to produce fewer global-level clusters than region-level ones, maintaining a clear hierarchical structure. The resulting clusters were both temporally and spatially consistent, averaging 11.67 per user with a temporal standard deviation of 4.07 days.
We summarize the average training time per epoch, total training time, and peak GPU memory consumption for each dataset in
Table 2. The experiments were conducted with an NVIDIA RTX 4090 GPU. The results show that our model is both computationally efficient and scalable to large-scale datasets.
5. Results and Analysis
5.1. Performance Comparison
We present a comparative analysis of the prediction accuracy of our proposed model against several baseline methods. The results of the comparison experiment are shown in
Table 3 and
Table 4. For both datasets, the overall performance indicates that traditional methods such as FPMC and PRME have lower recall rates across all metrics, whereas modern methods such as STAN, GETNext, and STHGCN show significant improvements. This performance gap highlights the evolution of POI recommendation techniques, where earlier matrix factorization approaches struggle to capture the complex spatio-temporal dependencies that characterize human mobility patterns.
In general, our HGL outperforms all others across all metrics. Specifically, our method shows a notable improvement over STHGCN, achieving a 3.01% increase in Recall@5 and 1.59% increase in Recall@10 on the NYC dataset, and improvements of 2.57% and 1.35% on the TKY dataset, respectively. The more substantial improvements in Recall@5 compared to Recall@10 suggest that our hierarchical approach is particularly effective at identifying the most relevant POIs within a smaller recommendation set, which is crucial for practical applications where users typically focus on the top few recommendations.
Additionally, in terms of MRR, our approach outperforms STHGCN by 2.41% on the NYC dataset and shows a 2.69% improvement on the TKY dataset. This signifies that our method not only identifies the correct POI more frequently but also ranks it higher among the recommendations. The consistent improvement in MRR across both datasets demonstrates our model’s ability to better prioritize the most relevant POIs, which directly enhances the user experience in real-world recommendation scenarios.
When examining the performance patterns across different methods, we have observed that the improvement margin between sequential models (LSTM, PLSPL) and graph-based models (GETNext, STHGCN) is substantially larger than the gap between traditional methods (FPMC, PRME) and sequential models. This trend indicates that graph structures are particularly well suited for capturing the complex relationships in POI recommendation tasks. Our hierarchical graph approach further extends this advantage by modeling these relationships at multiple scales.
Interestingly, the performance improvements differ slightly between the NYC and TKY datasets. The NYC dataset shows larger improvements in Recall@5, while the TKY dataset exhibits more balanced improvements across metrics. This difference may be attributed to the distinct urban structures and mobility patterns in these two cities. New York’s grid-like street layout and concentrated points of interest may benefit more from our hierarchical approach’s ability to capture neighborhood-level patterns, while Tokyo’s more complex and distributed urban structure might require the multi-scale modeling that our approach provides.
5.2. Cold-Start Problem Analysis
In the task of next POI recommendation, the cold-start problem presents a significant challenge, particularly in providing accurate recommendations for inactive users with sparse historical data. To evaluate the effectiveness of our model in handling cold-start scenarios, we calculated the number of user trajectories and categorized users based on their trajectory counts. Users in the top 30% are defined as active, those in the bottom 30% as inactive, and the remainder as normal.
We then compared the performance of our model with the STHGCN model, which has demonstrated the best performance in addressing the cold-start problem in prior studies. The results of this comparison are presented in
Figure 4.
For both the NYC and TKY datasets, our model demonstrates notable improvements across all user groups, as shown in
Figure 4, particularly in the Recall@5 and Recall@10 metrics. This suggests that while our model enhances the accuracy of the top recommendation, it excels at identifying a broader set of potential POIs, effectively capturing users’ diverse interests. Even in the challenging inactive user group, our approach significantly outperforms the STHGCN model, showcasing its capability to handle sparse data and effectively utilize limited interactions.
To highlight the interpretability of our hierarchical structure, we present a real-world example demonstrating preference transfer via shared global-level semantics. User #124 from the TKY dataset is a cold-start user with only a limited number of check-ins, such as an art museum, a government building, and several road or park locations. Importantly, this user has never visited POI #114, a train station located in the southern part of Tokyo. However, POI #114 belongs to Cluster #37, a densely populated, transport-oriented global-level cluster containing multiple train stations (e.g., POI #4902, POI #6451, POI #212, and POI #114 itself). This cluster corresponds to real-world transit hubs around Ōimachi, Ōmori, and Kamata—areas frequently traversed by commuters. During training, the global-level embedding of Cluster #37 aggregates spatio-temporal patterns from all contributing users, forming a general representation of transport-related mobility behavior. When generating recommendations for user #124, the model leverages to infer POI #114 as a likely destination, despite it being unseen in the user’s own history.
This robust performance across varying metrics and user activity levels highlights our model’s adaptability and strength in providing relevant and comprehensive POI recommendations.
5.3. Ablation Study
The ablation study results presented in
Figure 5 provide valuable insights into the contributions of different components to our hierarchical graph learning framework. We conducted experiments by removing key components of our model to evaluate their impact on performance across both datasets.
Removing the entire hierarchical structure (“w/o Hierarchy”) and using only a single-layer graph results in significant performance degradation across all metrics. On the NYC dataset, this leads to a 8.0% decrease in Recall@5, a 9.4% drop in Recall@10, and a 7.9% reduction in MRR. Similar patterns have been observed on the TKY dataset, with decreases of 5.0% in Recall@5, 4.7% in Recall@10, and 4.6% in MRR. These substantial declines highlight the critical importance of modeling multi-scale relationships in human mobility patterns, confirming that a single-layer graph structure is insufficient for capturing the hierarchical nature of POI transitions.
The impact of removing only the global-level graph (“w/o Global Layer”) while retaining the POI and region levels is less severe but still notable. For the NYC dataset, this results in a 1.8% decrease in Recall@5, a 3.0% drop in Recall@10, and a 4.0% reduction in MRR. The effect is more pronounced on the TKY dataset, with decreases of 9.6% in Recall@5, 8.4% in Recall@10, and 10.5% in MRR. These findings indicate that the global-level graph plays a crucial role in capturing city-wide patterns and category-based relationships, particularly in the more complex urban environment of Tokyo.
These results clearly demonstrate that each level of our hierarchical graph structure makes a distinct and important contribution to the overall model performance. The base-level graph captures fine-grained POI transitions, the region-level graph models area-based interactions, and the global-level graph represents broader mobility patterns. The integration of these multiple scales through our cross-layer information propagation mechanism is essential for comprehensive POI representation learning and accurate next location prediction.
6. Conclusions
In this study, we proposed a novel hierarchical graph learning (HGL) framework for next point of interest (POI) recommendation, which effectively captures multi-scale mobility patterns by constructing a three-level graph and enabling cross-layer information propagation. The framework integrates POI-level transitions, region-level spatio-temporal clusters, and global semantic patterns, allowing the model to learn rich hierarchical representations.
Extensive experiments conducted on two real-world datasets, NYC and TKY, demonstrate that our model significantly outperforms state-of-the-art baselines. Specifically, HGL achieves improvements of up to 3.01% in Recall@5 and 2.69% in MRR compared to the best-performing prior method, STHGCN. The performance gains are particularly notable in cold-start scenarios, where HGL shows robust results for inactive users with limited historical data. Ablation studies further confirm that both the hierarchical structure and the cross-layer information propagation mechanism are crucial to the effectiveness of the model.
Despite its strong performance, the proposed framework has several limitations. The multi-level graph construction and hierarchical message passing introduce additional computational complexity, which may affect scalability. Furthermore, the model relies on hand-crafted clustering thresholds that may require tuning across datasets, and it currently operates under a static modeling assumption.
Future work will explore dynamic modeling techniques to capture evolving user preferences, adaptive clustering strategies for automated parameter selection, and more efficient network designs to reduce computational overhead. We also plan to incorporate richer contextual cues such as social influence or multimodal POI content, as well as investigate self-supervised learning methods to leverage unlabeled check-in data more effectively.
Author Contributions
Conceptualization, Q.H. and A.Y.; methodology, Q.H. and A.Y.; software, Q.H.; validation, Q.H., A.Y. and M.Y.; formal analysis, Q.H. and A.Y.; investigation, Q.H.; data curation, Q.H.; writing—original draft preparation, Q.H.; writing—review and editing, A.Y. and M.Y.; visualization, Q.H.; supervision, A.Y. and M.Y.; project administration, A.Y.; funding acquisition, M.Y. All authors have read and agreed to the published version of the manuscript.
Funding
This research was funded by JST SPRING, Japan, Grant Number JPMJSP2180.
Institutional Review Board Statement
Not applicable.
Informed Consent Statement
Not applicable.
Data Availability Statement
The datasets used in this study are publicly available from the corresponding author upon reasonable request.
Acknowledgments
We would like to thank the anonymous reviewers for their valuable feedback and suggestions.
Conflicts of Interest
The authors declare no conflicts of interest.
References
- Bao, J.; Zheng, Y.; Mokbel, M.F. Location-based and preference-aware recommendation using sparse geo-social networking data. In Proceedings of the 20th International Conference on Advances in Geographic Information Systems, Redondo Beach, CA, USA, 6 November 2012; pp. 199–208. [Google Scholar]
- Zheng, Y.; Capra, L.; Wolfson, O.; Yang, H. Urban computing: Concepts, methodologies, and applications. ACM Trans. Intell. Syst. Technol. (TIST) 2014, 5, 1–55. [Google Scholar] [CrossRef]
- Ye, M.; Yin, P.; Lee, W.C.; Lee, D.L. Exploiting geographical influence for collaborative point-of-interest recommendation. In Proceedings of the 34th International ACM SIGIR Conference on Research and Development in Information Retrieval, Beijing, China, 24–28 July 2011; pp. 325–334. [Google Scholar]
- Wu, Y.; Zhao, Z.; Chen, P.; Guo, F.; Qin, Y.; Long, S.; Ai, L. Hybrid learning architecture for high-speed railroad scene parsing and potential safety hazard evaluation of UAV images. Measurement 2025, 239, 115504. [Google Scholar] [CrossRef]
- Chen, Z.; Guo, H.; Yang, J.; Jiao, H.; Feng, Z.; Chen, L.; Gao, T. Fast vehicle detection algorithm in traffic scene based on improved SSD. Measurement 2022, 201, 111655. [Google Scholar] [CrossRef]
- Rendle, S.; Freudenthaler, C.; Schmidt-Thieme, L. Factorizing personalized markov chains for next-basket recommendation. In Proceedings of the 19th International Conference on World Wide Web, Raleigh, NC, USA, 26–30 April 2010; pp. 811–820. [Google Scholar]
- Cheng, C.; Yang, H.; Lyu, M.R.; King, I. Where you like to go next: Successive point-of-interest recommendation. In Proceedings of the Twenty-Third International Joint Conference on Artificial Intelligence, Beijing, China, 3–9 August 2013. [Google Scholar]
- Feng, S.; Li, X.; Zeng, Y.; Cong, G.; Chee, Y.M.; Yuan, Q. Personalized ranking metric embedding for next new POI recommendation. In Proceedings of the 24th International Conference on Artificial Intelligence, Buenos Aires, Argentina, 25–31 July 2015. [Google Scholar]
- Yuan, Q.; Cong, G.; Ma, Z.; Sun, A.; Thalmann, N.M. Time-aware point-of-interest recommendation. In Proceedings of the 36th International ACM SIGIR Conference on Research and Development in Information Retrieval, Dublin, Ireland, 28 July–1 August 2013; pp. 363–372. [Google Scholar]
- Yao, L.; Sheng, Q.Z.; Qin, Y.; Wang, X.; Shemshadi, A.; He, Q. Context-aware point-of-interest recommendation using tensor factorization with social regularization. In Proceedings of the 38th International ACM SIGIR Conference on Research and Development in Information Retrieval, Santiago, Chile, 9–13 August 2015; pp. 1007–1010. [Google Scholar]
- Liu, Q.; Wu, S.; Wang, L.; Tan, T. Predicting the next location: A recurrent model with spatial and temporal contexts. In Proceedings of the AAAI Conference on Artificial Intelligence, Phoenix, AZ, USA, 12–17 February 2016; Volume 30. [Google Scholar]
- Sun, K.; Qian, T.; Chen, T.; Liang, Y.; Nguyen, Q.V.H.; Yin, H. Where to go next: Modeling long-and short-term user preferences for point-of-interest recommendation. In Proceedings of the AAAI Conference on Artificial Intelligence, New York, NY, USA, 9–11 February 2020; Volume 34, pp. 214–221. [Google Scholar]
- Zhao, P.; Luo, A.; Liu, Y.; Xu, J.; Li, Z.; Zhuang, F.; Sheng, V.S.; Zhou, X. Where to go next: A spatio-temporal gated network for next poi recommendation. IEEE Trans. Knowl. Data Eng. 2020, 34, 2512–2524. [Google Scholar] [CrossRef]
- Wu, Y.; Li, K.; Zhao, G.; Qian, X. Long-and short-term preference learning for next POI recommendation. In Proceedings of the 28th ACM International Conference on Information and Knowledge Management, Beijing, China, 3–7 November 2019; pp. 2301–2304. [Google Scholar]
- Luo, Y.; Liu, Q.; Liu, Z. Stan: Spatio-temporal attention network for next location recommendation. In Proceedings of the Web Conference 2021, New York, NY, USA, 19–23 April 2021; pp. 2177–2185. [Google Scholar]
- Wu, Y.; Li, K.; Zhao, G.; Qian, X. Personalized long-and short-term preference learning for next POI recommendation. IEEE Trans. Knowl. Data Eng. 2020, 34, 1944–1957. [Google Scholar] [CrossRef]
- Qin, Y.; Fang, Y.; Luo, H.; Zhao, F.; Wang, C. Next point-of-interest recommendation with auto-correlation enhanced multi-modal transformer network. In Proceedings of the 45th International ACM SIGIR Conference on Research and Development in Information Retrieval, Madrid, Spain, 11–15 July 2022; pp. 2612–2616. [Google Scholar]
- Vaswani, A.; Shazeer, N.; Parmar, N.; Uszkoreit, J.; Jones, L.; Gomez, A.N.; Kaiser, Ł.; Polosukhin, I. Attention is all you need. Adv. Neural Inform. Proc. Syst. 2017, 30, 6000–6010. [Google Scholar]
- Rumelhart, D.E.; Hinton, G.E.; Williams, R.J. Learning Internal Representations by Error Propagation. In Parallel Distributed Processing: Explorations in the Microstructure of Cognition; Rumelhart, D.E., McClelland, J.L., Eds.; MIT Press: Cambridge, MA, USA, 1986; Volume 1, pp. 318–362. [Google Scholar]
- Hochreiter, S.; Schmidhuber, J. Long short-term memory. Neural Comput. 1997, 9, 1735–1780. [Google Scholar] [PubMed]
- Yuan, Q.; Cong, G.; Sun, A. Graph-based point-of-interest recommendation with geographical and temporal influences. In Proceedings of the 23rd ACM International Conference on Conference on Information and Knowledge Management, Shanghai, China, 3–7 November 2014; pp. 659–668. [Google Scholar]
- Lim, N.; Hooi, B.; Ng, S.K.; Goh, Y.L.; Weng, R.; Tan, R. Hierarchical multi-task graph recurrent network for next poi recommendation. In Proceedings of the 45th International ACM SIGIR Conference on Research and Development in Information Retrieval, Madrid, Spain, 11–15 July 2022; pp. 1133–1143. [Google Scholar]
- Yang, S.; Liu, J.; Zhao, K. GETNext: Trajectory flow map enhanced transformer for next POI recommendation. In Proceedings of the 45th International ACM SIGIR Conference on Research and Development in Information Retrieval, Madrid, Spain, 11–15 July 2022; pp. 1144–1153. [Google Scholar]
- Wang, Z.; Zhu, Y.; Wang, C.; Ma, W.; Li, B.; Yu, J. Adaptive Graph Representation Learning for Next POI Recommendation. In Proceedings of the 46th International ACM SIGIR Conference on Research and Development in Information Retrieval, Taipei, Taiwan, 23–27 July 2023; pp. 393–402. [Google Scholar]
- Yan, X.; Song, T.; Jiao, Y.; He, J.; Wang, J.; Li, R.; Chu, W. Spatio-temporal hypergraph learning for next POI recommendation. In Proceedings of the 46th International ACM SIGIR Conference on Research and Development in Information Retrieval, Taipei, Taiwan, 23–27 July 2023; pp. 403–412. [Google Scholar]
- Xu, Y.; Cong, G.; Zhu, L.; Cui, L. MMPOI: A Multi-Modal Content-Aware Framework for POI Recommendations. In Proceedings of the ACM on Web Conference 2024, Singapore, 13–17 May 2024; pp. 3454–3463. [Google Scholar]
- Gao, Q.; Wang, W.; Zhang, K.; Yang, X.; Miao, C.; Li, T. Self-supervised representation learning for trip recommendation. Knowl.-Based Syst. 2022, 247, 108791. [Google Scholar] [CrossRef]
- Long, Z.; Wang, L.; Liu, Q.; Wu, S. Personalized Interest Sustainability Modeling for Sequential POI Recommendation. In Proceedings of the 32nd ACM International Conference on Information and Knowledge Management, Birmingham, UK, 21–25 October 2023; pp. 4145–4149. [Google Scholar]
- Qi, L.; Liu, Y.; Liu, W.; Pei, S.; Xu, X.; Zhang, X.; Wang, Y.; Dou, W. Counterfactual user sequence synthesis augmented with continuous time dynamic preference modeling for sequential POI recommendation. In Proceedings of the Thirty-Third International Joint Conference on Artificial Intelligence (IJCAI), Jeju, Republic of Korea, 3–9 August 2024; pp. 2306–2314. [Google Scholar]
- Qin, Y.; Wang, Y.; Sun, F.; Ju, W.; Hou, X.; Wang, Z.; Cheng, J.; Lei, J.; Zhang, M. DisenPOI: Disentangling sequential and geographical influence for point-of-interest recommendation. In Proceedings of the Sixteenth ACM International Conference on Web Search and Data Mining, Singapore, 27 February–3 March 2023; pp. 508–516. [Google Scholar]
- Liu, Y.; Qi, L.; Liu, W.; Xu, X.; Zhang, X.; Dou, W. Graphsage-based POI recommendation via continuous-time modeling. In Proceedings of the Companion Proceedings of the ACM Web Conference, Singapore, 13–17 May 2024; pp. 585–588. [Google Scholar]
- Wang, L.; Wu, S.; Liu, Q.; Zhu, Y.; Tao, X.; Zhang, M. Bi-level graph structure learning for next POI recommendation. IEEE Transac. Knowl. Data Eng. 2024, 36, 5695–5708. [Google Scholar] [CrossRef]
- Zheng, Y.; Zhang, L.; Xie, X.; Ma, W.Y. Mining interesting locations and travel sequences from GPS trajectories. In Proceedings of the 18th International Conference on World Wide Web, Madrid, Spain, 20–24 April 2009; pp. 791–800. [Google Scholar]
- Gonzalez, M.C.; Hidalgo, C.A.; Barabasi, A.L. Understanding individual human mobility patterns. Nature 2008, 453, 779–782. [Google Scholar] [CrossRef] [PubMed]
- Cakmak, E.; Plank, M.; Calovi, D.S.; Jordan, A.; Keim, D. Spatio-Temporal Clustering Benchmark for Collective Animal Behavior. In Proceedings of the 1st ACM SIGSPATIAL International Workshop on Animal Movement Ecology and Human Mobility, HANIMOB ’21, New York, NY, USA, 2 November 2021; pp. 5–8. [Google Scholar]
- Yang, D.; Zhang, D.; Zheng, V.W.; Yu, Z. Modeling user activity preference by leveraging user spatial temporal characteristics in LBSNs. IEEE Trans. Syst. Man Cybern. Syst. 2014, 45, 129–142. [Google Scholar] [CrossRef]
- Tenney, I.; Das, D.; Pavlick, E. BERT rediscovers the classical NLP pipeline. arXiv 2019, arXiv:1905.05950. [Google Scholar]
| Disclaimer/Publisher’s Note: The statements, opinions and data contained in all publications are solely those of the individual author(s) and contributor(s) and not of MDPI and/or the editor(s). MDPI and/or the editor(s) disclaim responsibility for any injury to people or property resulting from any ideas, methods, instructions or products referred to in the content. |
© 2025 by the authors. Licensee MDPI, Basel, Switzerland. This article is an open access article distributed under the terms and conditions of the Creative Commons Attribution (CC BY) license (https://creativecommons.org/licenses/by/4.0/).


