1. Introduction
As children reach school age, they become more independent and active road users. Despite this, they remain the most vulnerable group of road users as pedestrians [
1]. It is common for children to travel by foot to various destinations, including school, friends’ houses, and sports activities [
2]. The American Academy of Pediatrics recommends that children under the age of ten should not be unsupervised pedestrians in road traffic, except under special conditions [
3]. However, it may not always be feasible to practice and supervise all trips. It is strongly recommended that children practice walking to school with adult supervision before being allowed to walk alone [
4]. According to Limbourg [
5], children up to the age of approximately eight years are unpredictable and untrustworthy as pedestrians in road traffic due to their psychological development. Even older children, aged 8–9 years, are still easily distracted. It is crucial for children to focus their attention on the hazardous situation and avoid distractions from other things [
4,
6,
7,
8]. Children crossing the road tend to focus on their immediate surroundings, often neglecting traffic [
6,
9]. It is vital to educate children on the significance of paying attention to traffic when crossing the road. Their attention is often drawn to non-traffic related objects such as animals or other children [
4,
8]. Thus, inadequate observation of traffic and failure to stop before crossing the road are major contributing factors to accidents, as highlighted by Jiang et al. and Wang et al. [
6,
10,
11]. Accurately estimating the speed and distance of an approaching vehicle is crucial to avoid critical situations. It is important to note that speed estimation is a complex task that requires considering distance [
12]. According to various studies, children’s ability to estimate distances ranges from approximately six [
13] to approximately nine years [
14] (as cited in Uhr [
12]). Furthermore, studies have demonstrated that children between the ages of 10 and 12 possess the capacity to estimate the velocity of approaching vehicles [
14] (as cited in Uhr [
12]). It is worth noting that 10-year-old children tend to use distance rather than speed as a reference for their judgment [
15]. Furthermore, Tapiro et al. [
8] identified a correlation between the time taken to clear the roadway and the speed of the next approaching vehicle. The study indicates that younger children have a shorter escape time compared with older children. Each age group (7–8 years, 9–10 years, 11–13 years, and adults) exhibited a significant difference to the next age group. Notably, the age group of 11–13-year-olds exhibited no statistically significant variation in their results when compared with adults. The remaining escape time averaged at 0.7 s for 7–8 year olds, 2.7 s for the 9–10 year olds, and 4.9 s for the 11–13 year olds. Younger children were able to cross the road safely in significantly less time than adults, who exhibited an escape time of 5.7 s. These findings suggest that younger children perceive a shorter distance between two vehicles as safe compared with adults or older children. However, in some situations, it may still be more appropriate for all pedestrians to stop and wait for traffic to pass or for vehicles to stop. It has been demonstrated that children aged six to seven encounter difficulties in interrupting a movement once it has been initiated. This has significant implications for their ability to respond promptly in dangerous situations [
16] (cited in Schlag et al. [
17]). This task requires a high level of alertness, which refers to the ability to quickly establish a general readiness to react [
18]. It is important to note that alertness increases significantly between the ages of 5 and 11 years [
19] (cited in Limbourg [
12]). However, for younger children (6–8 years), there are significant inter-individual differences. The attainment of an average adult level of alertness is customarily observed at approximately 14 years of age.
The objective of the study is to analyze the stopping distance, stopping time, and deceleration of children of varying ages in response to a specific request.
2. Literature
A considerable body of research has been dedicated to examining the impact of varying speeds of movement among study participants. The extant studies have been separated into three categories: those that include (e.g., Griffits et al. [
20], Knoblauch et al. [
21] cited in Rastogi et al. [
22], Forde and Daniel [
23], Hussein and Sayed [
24]), those that include children (e.g., Vaughan and Bain [
25,
26], Eberhardt and Himbert [
27] cited in Vaughan [
26], Eubanks and Hill [
28] cited in Vaughan [
26]), and those that include both, adults and children (e.g., Strouhal et al. [
29] cited in Bartels and Erbsmehl [
30], Tarawneh [
31], Kramer and Raddatz [
32] cited in Bartels and Erbsmehl [
30], Rahman et al. [
33]). The studies categorized assessments into slow walking, normal walking, running, and jogging. These categories were separated by gender. The experimental protocol entailed the execution of trials in both real-world road traffic conditions and a controlled laboratory environment. Throughout these trials, the primary focus remained on the steady-state speed of the participants. However, the examination of stopping time or stopping distance has been undertaken in a limited number of studies. For example, Wood et al. [
34] examined the stopping distance of seven males and one female. The study conducted two test runs with participants jogging and walking at their preferred speed. The subjects were prompted to stop as quickly as possible using an acoustic signal, with the timing of the signal varied to prevent preparation. Tavana et al. [
35] conducted a meticulous investigation into the reaction time and stopping distance of 16 participants (nine males and seven females) at three distinct velocities. Each velocity was assessed on three separate occasions. During the test configuration, participants were instructed to follow a leading person at a comfortable distance and to respond promptly to the leader’s sudden command to stop, without overtaking. The time and location of the stop were randomly selected and were not disclosed to the participants. Zhang et al. [
36] investigated the stopping distance of pedestrians (29 males and 25 females) in the context of pedestrian crowd stampede accidents. The experimental trials were executed at an assortment of temporal and velocity parameters. A comprehensive analysis of pedestrian safety was conducted, encompassing their capacity to estimate the velocity and stopping distance of oncoming vehicles [
37,
38], as well as to predict the pedestrian’s intended crossing path [
39]. In their study, Kath et al. [
40] found that vehicle drivers are willing to stop for pedestrians crossing the road. Concurrently, Rajendar et al. [
41] conducted a specific examination of the detection of pedestrians and the stopping distance of a vehicle equipped with an emergency braking system.
4. Results Analysis
The walking speeds of the different age groups within the conducted tests were significantly different from each other, as determined by a single-factorial ANOVA (
p = 0.005), see
Table 2 (a summary of the results for boys and girls can be found in the
Appendix A and
Appendix B). The walking speed of seven-year-olds was significantly different from that of nine to ten-year-olds (
p = 0.002) (Tukey post-hoc test), while no significant differences were observed among the other age groups (
Table 3). A notable difference was found only between the seven-year-olds and the eight-year-olds (
p = 0.065).
The findings further indicate a significant difference between the age groups for the “running” test configuration (single-factorial ANOVA, p = 0.003). Specifically, a statistically significant difference in speed was observed between six-year-olds and nine-year-olds in the “running” test (p = 0.001), as well as between eight-year-olds and nine-year-olds (p = 0.041) (Tukey post-hoc test).
For the “sprinting” test configuration, a single-factorial ANOVA yielded a significant difference between age groups (p = 0.000). The Tukey post-hoc test revealed significant differences between the age groups of six-year-olds and seven-year-olds (p = 0.021), six-year-olds and eight-year-olds (p = 0.000), and six-year-olds and nine-year-olds (p = 0.000).
Notably, there was no statistically significant difference found between boys and girls in terms of speed in the “walking” and “running” test configurations within each age group. A significant gender difference (p = 0.007) was found between eight-year-old boys and girls in the “sprinting” test configuration.
In the “walking” test configuration, an average stopping distance of 0.63 m was recorded for six-year-olds (
Table 4). Stopping distance has been observed to decrease with increasing age, with an average value of 0.47 m reported for 9–10-year-olds. The Welch-ANOVA test revealed a statistically significant difference between age groups (
p = 0.030). Subsequent analysis using the Games-Howell post hoc test (
Table 5) showed that only the six-year-olds and the 9–10-year-olds exhibited a significant difference (
p = 0.017). The “running” test configuration yielded a stopping distance ranging from 1.72 m to 1.85 m. No significant difference was found between age groups for the “running” test configuration (single-factorial ANOVA test,
p = 0.840).
The investigation yielded no statistically significant differences in the average stopping distance between male and female subjects within the specified test configurations and single age groups.
As indicated by the results presented in
Table 6, a clear trend emerges in the stopping times for both walking and running. Older children demonstrate significantly faster stopping times than younger children. A statistically significant difference in the mean stopping time was observed between the age groups for the walking condition (Welch-ANOVA test,
p = 0.000). Furthermore, the Games-Howell test reveals statistically significant differences (
Table 7) in stopping time between six- and seven-year-olds (
p = 0.042), six- and nine-year-olds (
p = 0.000), seven- and nine-year-olds (
p = 0.017), and eight- and nine-year-olds (
p = 0.019). A single-factorial analysis of variance (ANOVA) revealed no statistically significant differences between the age groups (
p = 0.533). However, it was observed that older children tended to cease running more rapidly in the designated “running” configuration.
The investigation yielded no statistically significant differences in the average stopping distance between male and female subjects within the specified test configurations and single age groups.
The analysis of deceleration shows a comparable trend, albeit with an inverse tendency. As children mature, they attain higher deceleration values in both the “walking” and “running” test configurations (
Table 8). However, these results did not attain statistical significance in either configuration (
p = 0.167 and
p = 0.284, single-factorial ANOVA).
An examination of the mean stopping deceleration revealed no statistically significant differences between male and female subjects within the designated test configurations and single age groups.
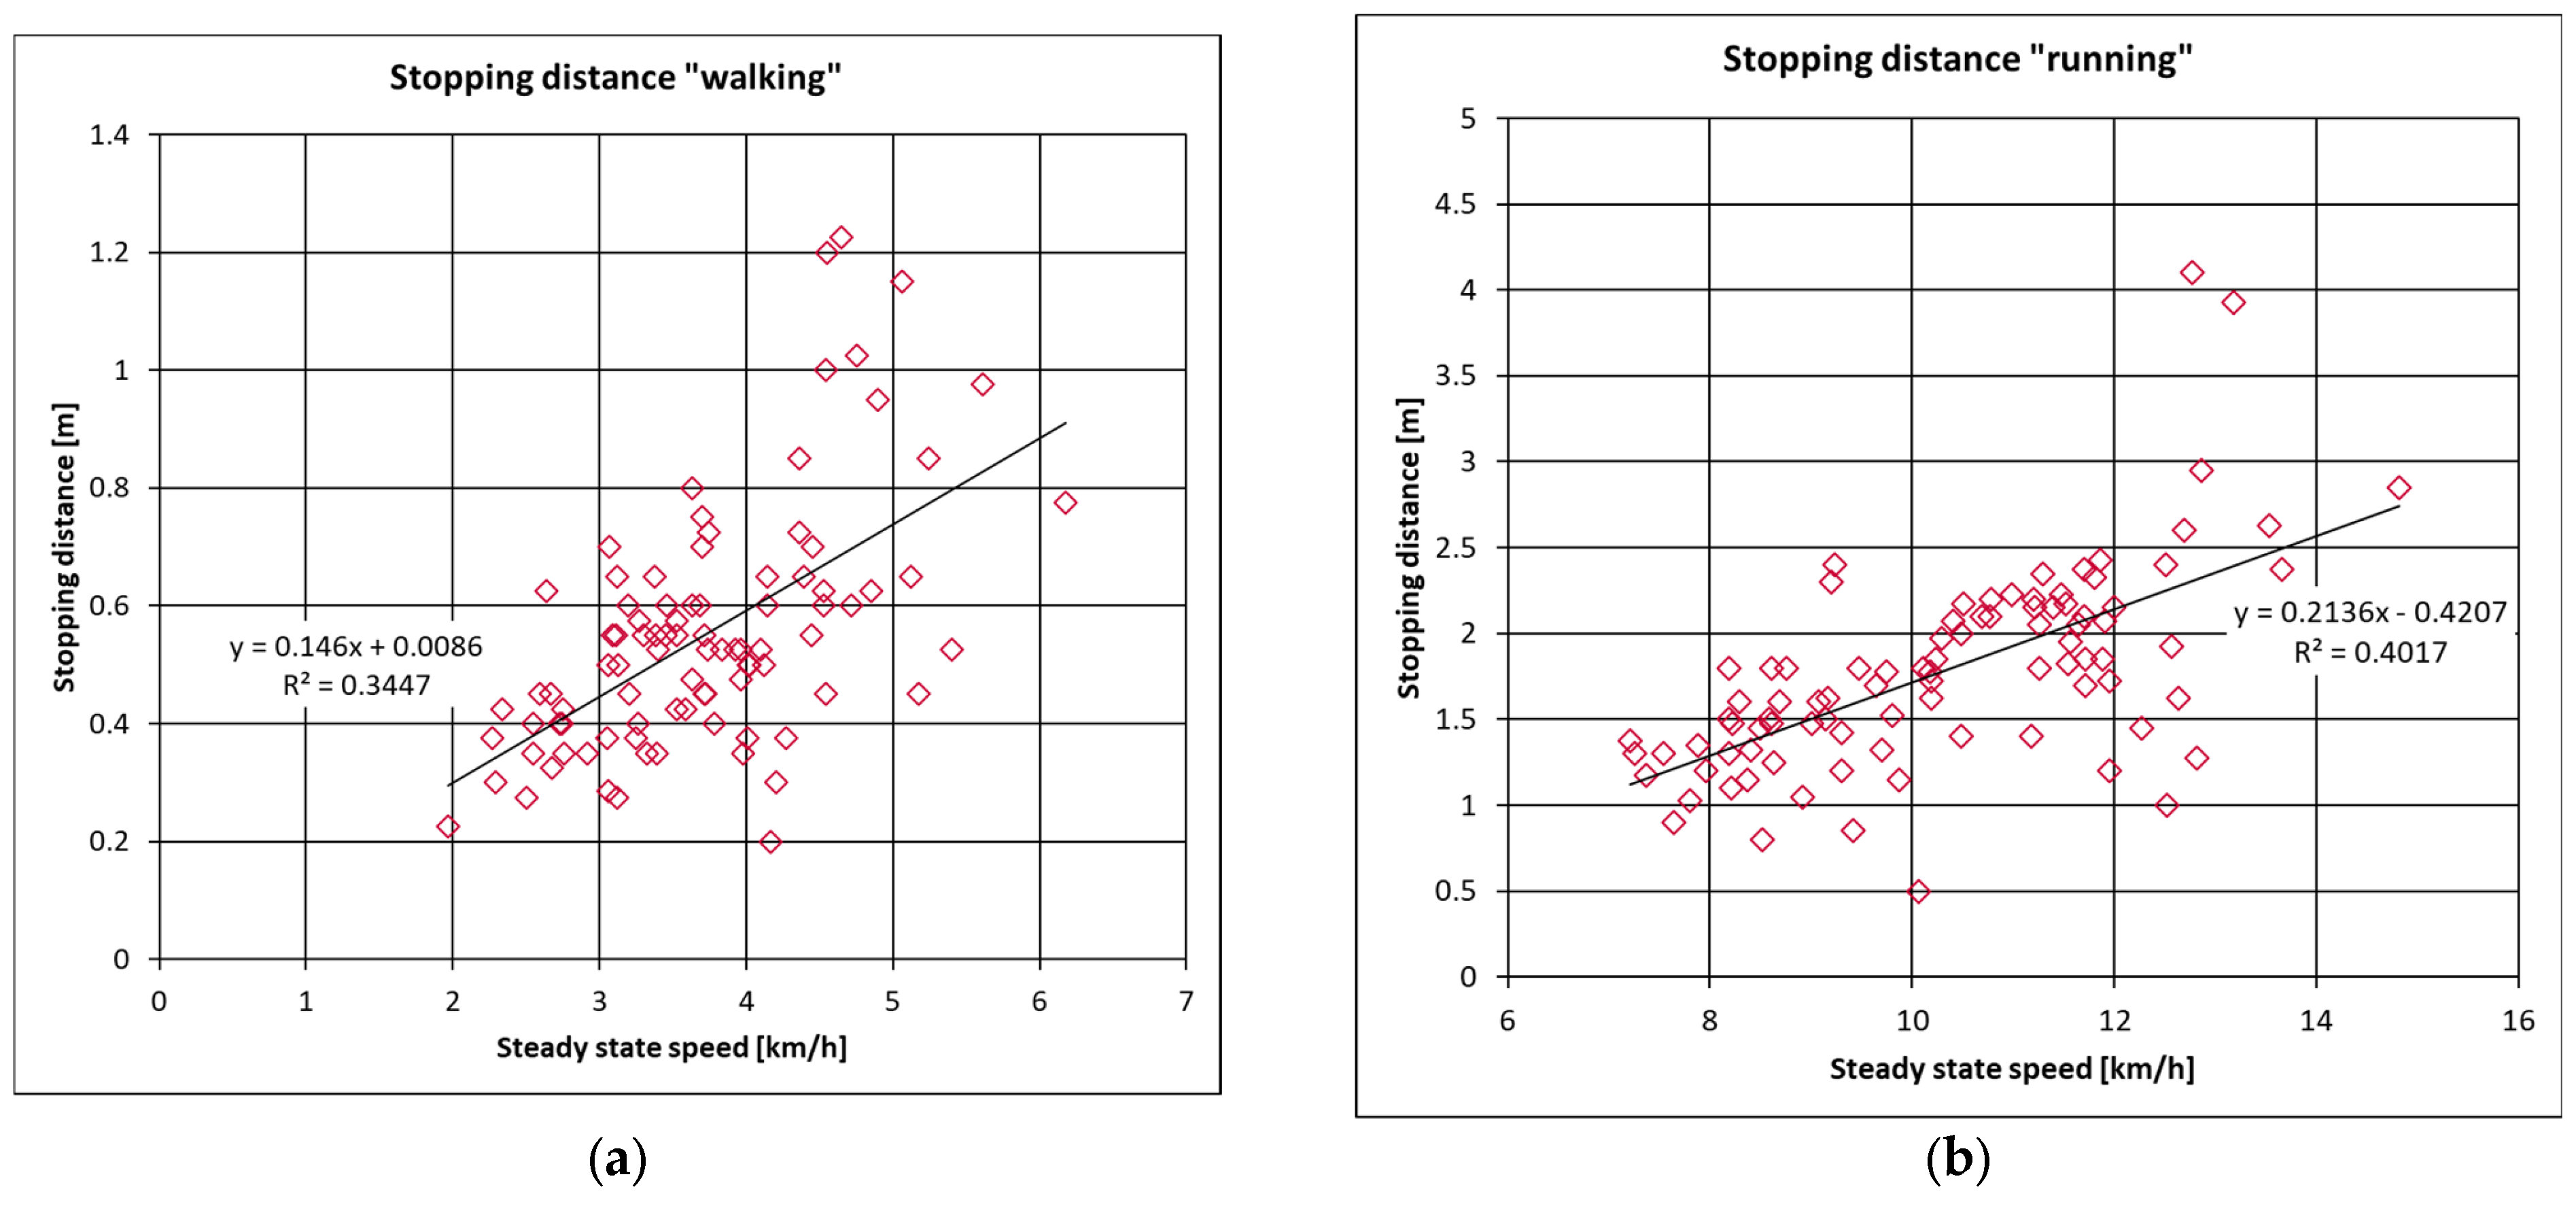
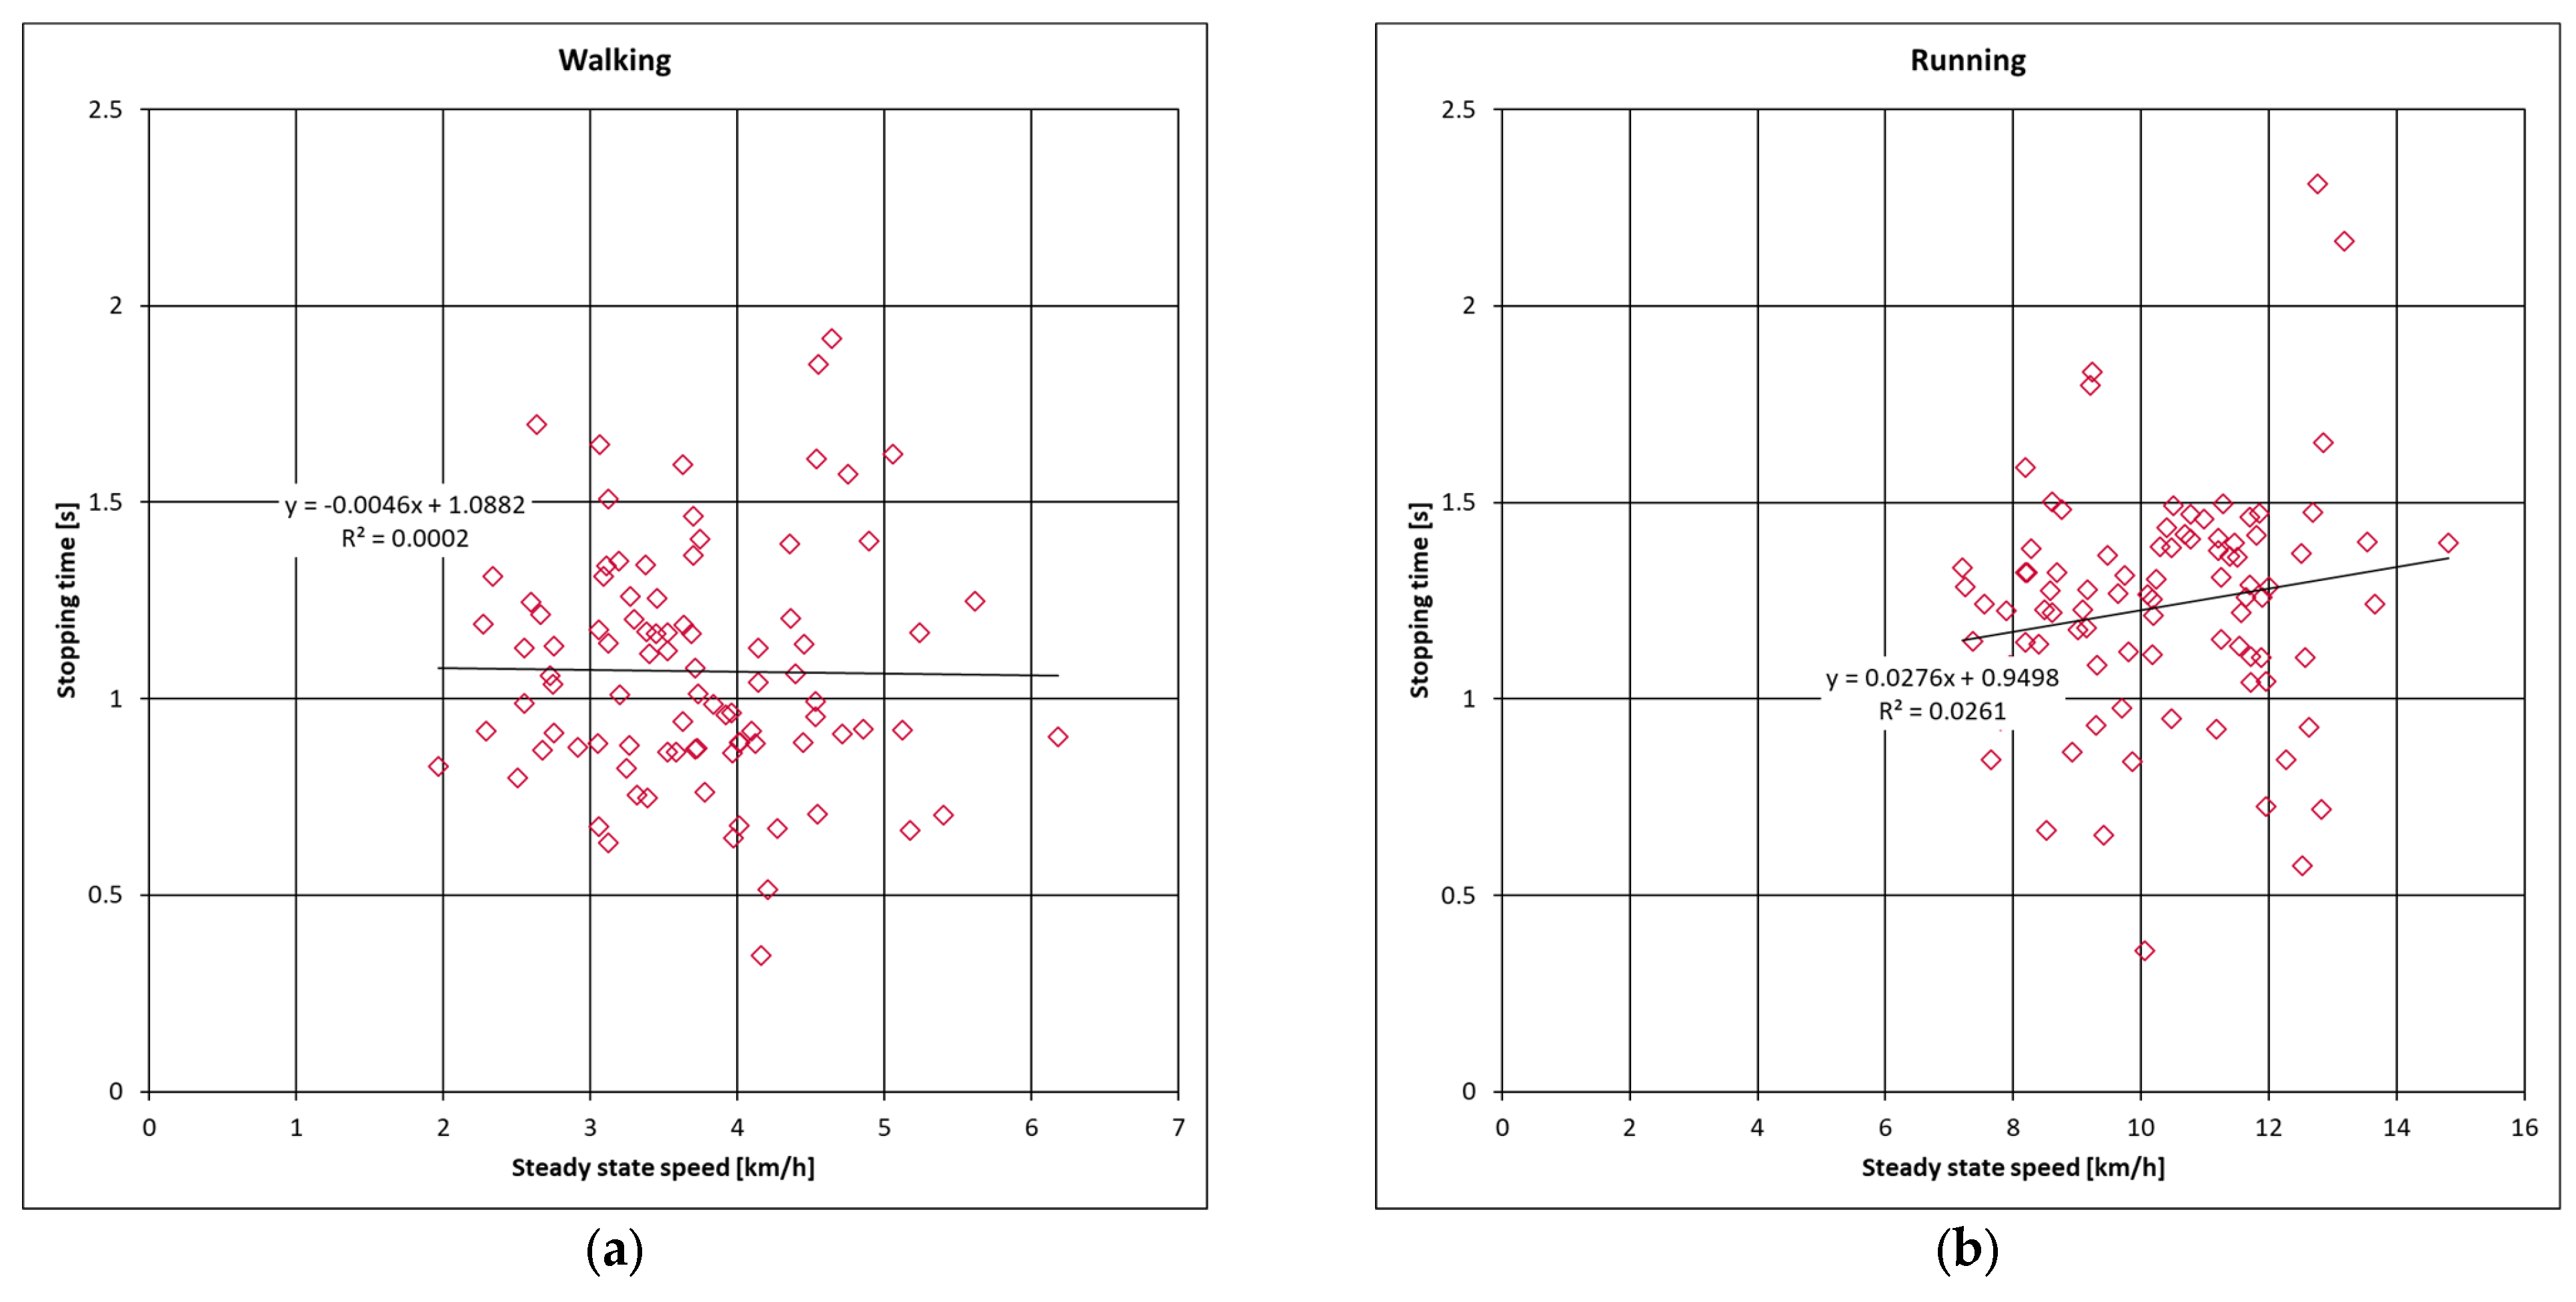
Speed significantly affects the length of stopping distance and stopping time. The relationship between stopping distance, stopping time, and steady-state speed for the “walking” and “running” test configurations is shown in
Figure 4 and
Figure 5. The data clearly indicates an increase in stopping distances at higher speeds (R
2 = 0.34 for “walking” and R
2 = 0.40 for “running”). Notably, this trend is not observed for stopping time.
5. Discussion
During the course of the tests, we carefully considered the boundary conditions of the test setup and determined that the length of the test course differs from what is stated in the literature. While Vaughan and Bain’s complete test course [
25,
26,
42] was 15 m long, it is assumed that the initial five meters constituted the acceleration phase. Eberhard and Himbert [
27] (cited in Bartels and Erbsmehl [
30]) employed a test set-up that encompassed the entire course length of 10 m. However, the length of the acceleration phase was not specified. Strouhal et al. [
29] (also cited in Bartels and Erbsmehl [
30]) used a course length of 10 m to determine only steady-state speed, indicating that the participants did not accelerate from a standstill. The recorded steady-state speeds of the children in different age groups are comparable with findings in the literature. However, they are lower than those reported by some previous studies (see Vaughan and Bain [
25,
26,
42], Eberhard, and Himbert [
27] (cited in Bartels and Erbsmehl [
30]), Eubanks and Hill [
28] (cited in Vaughan and Bain [
25,
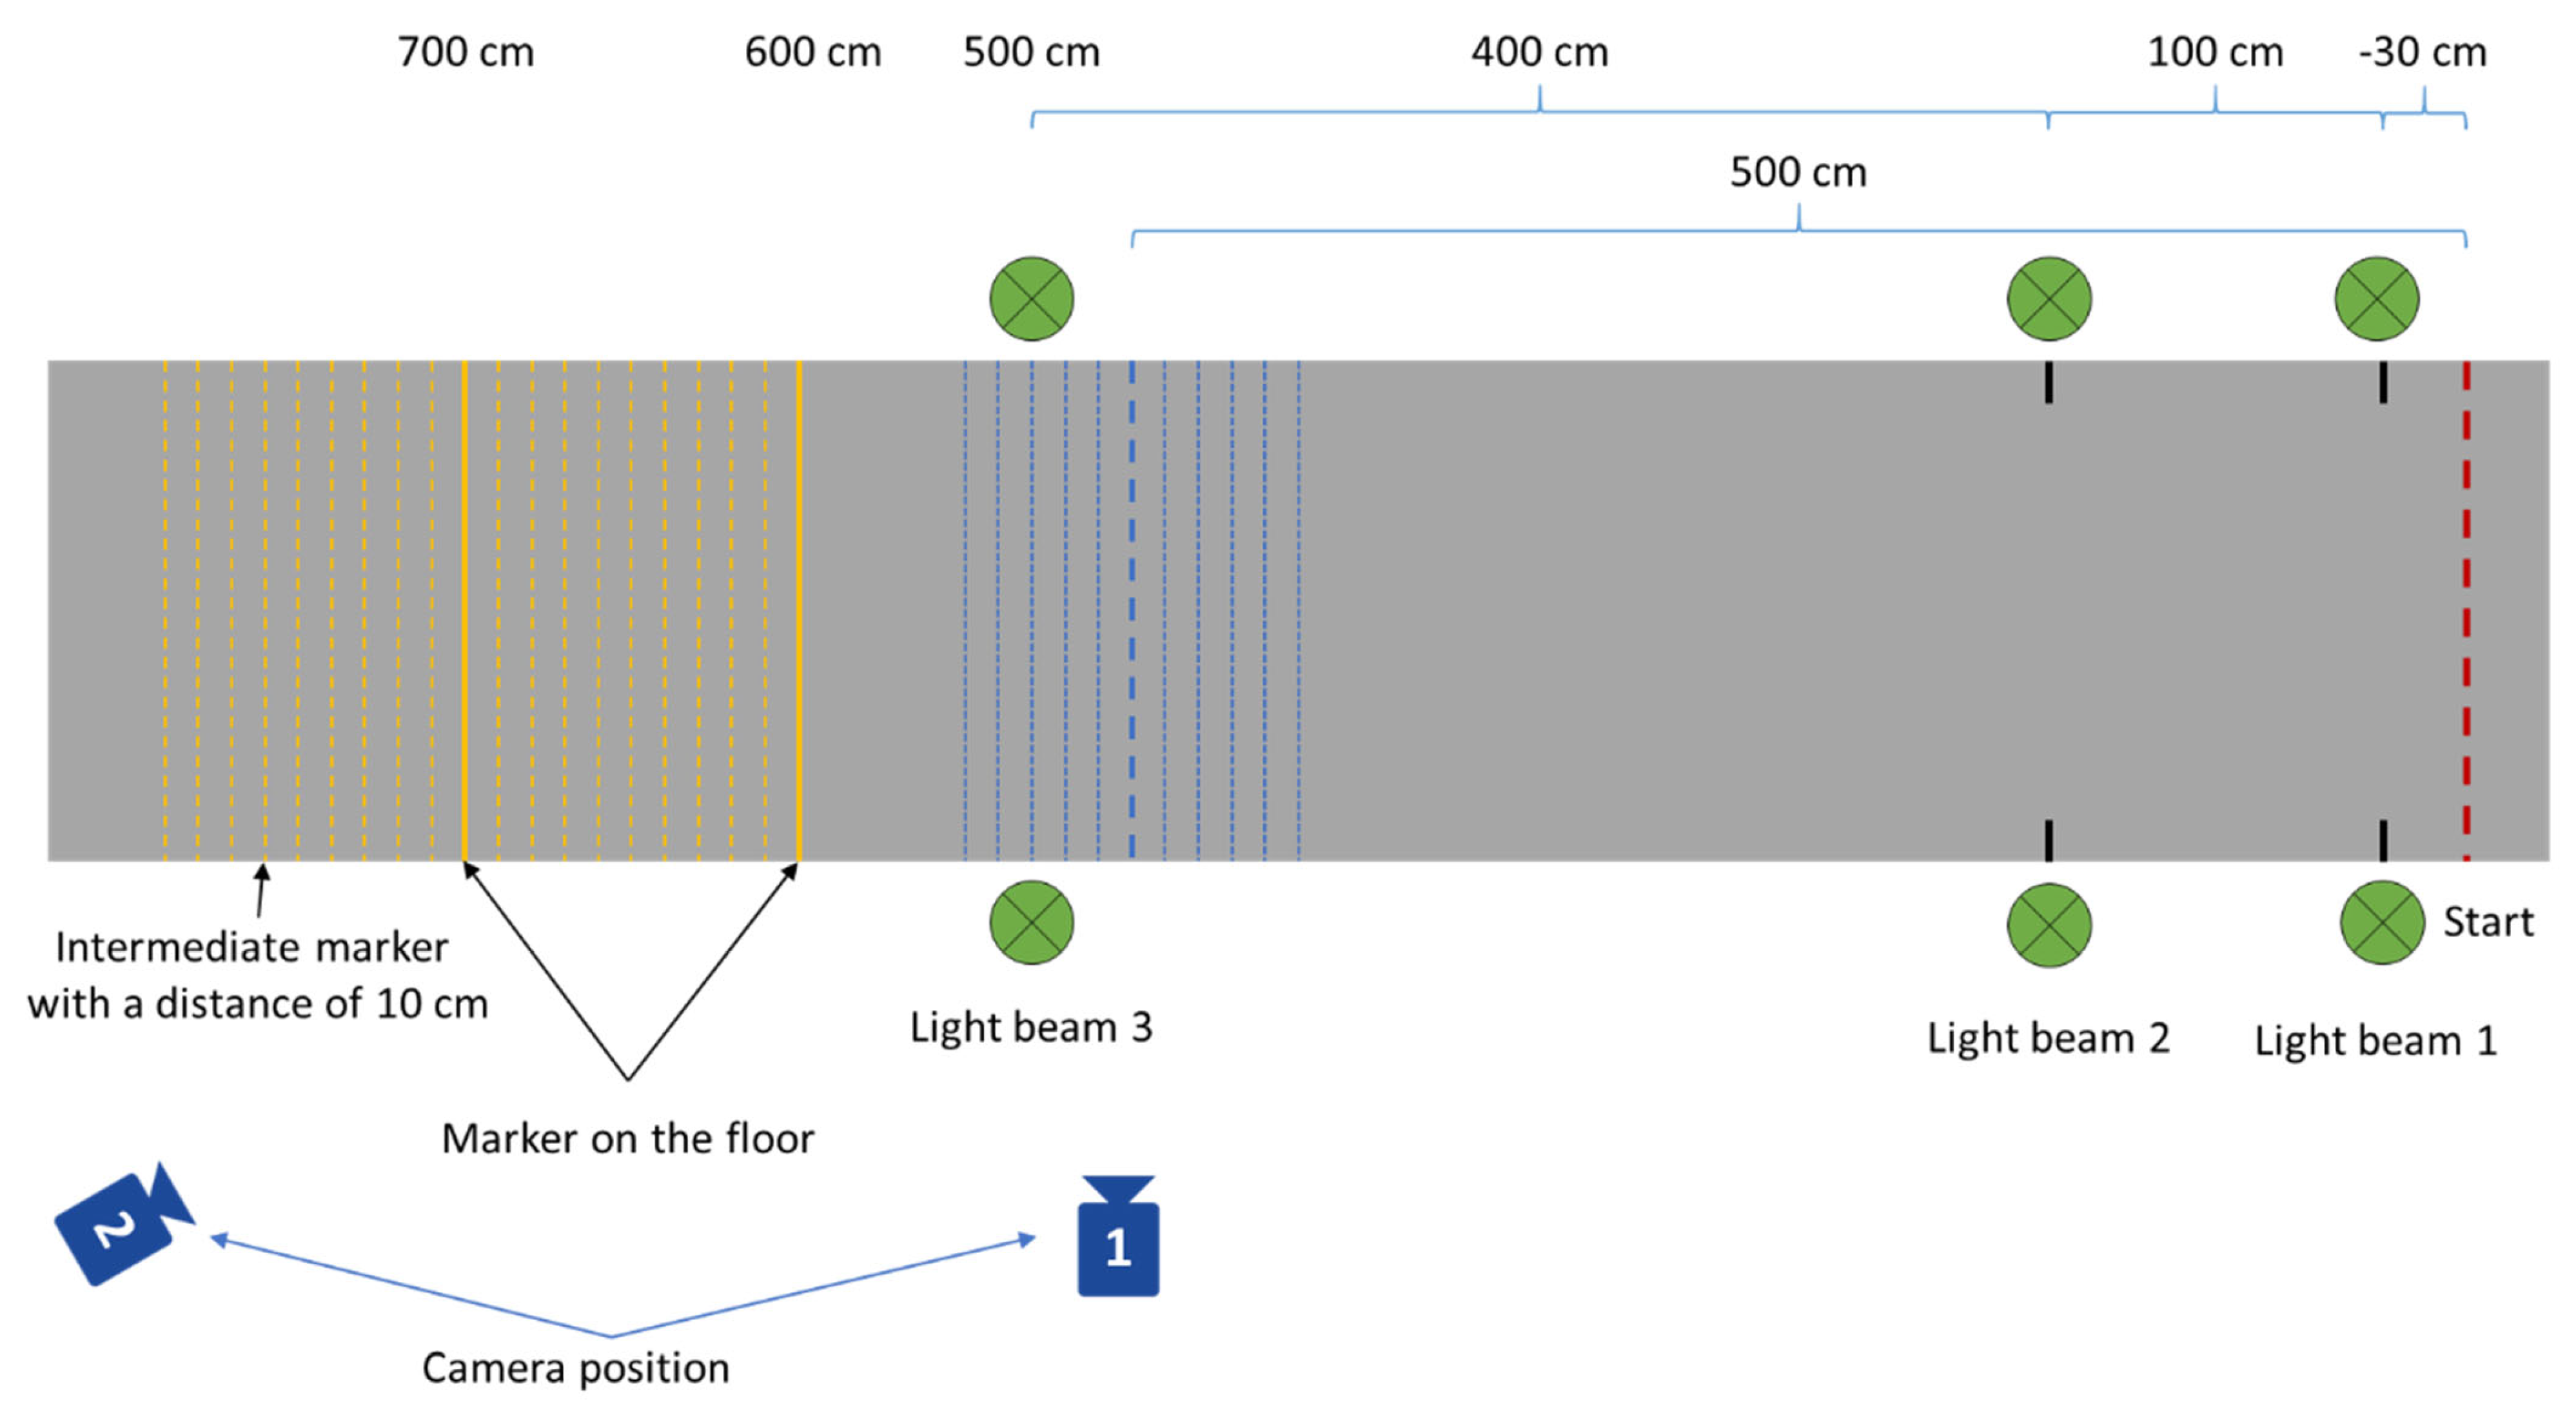
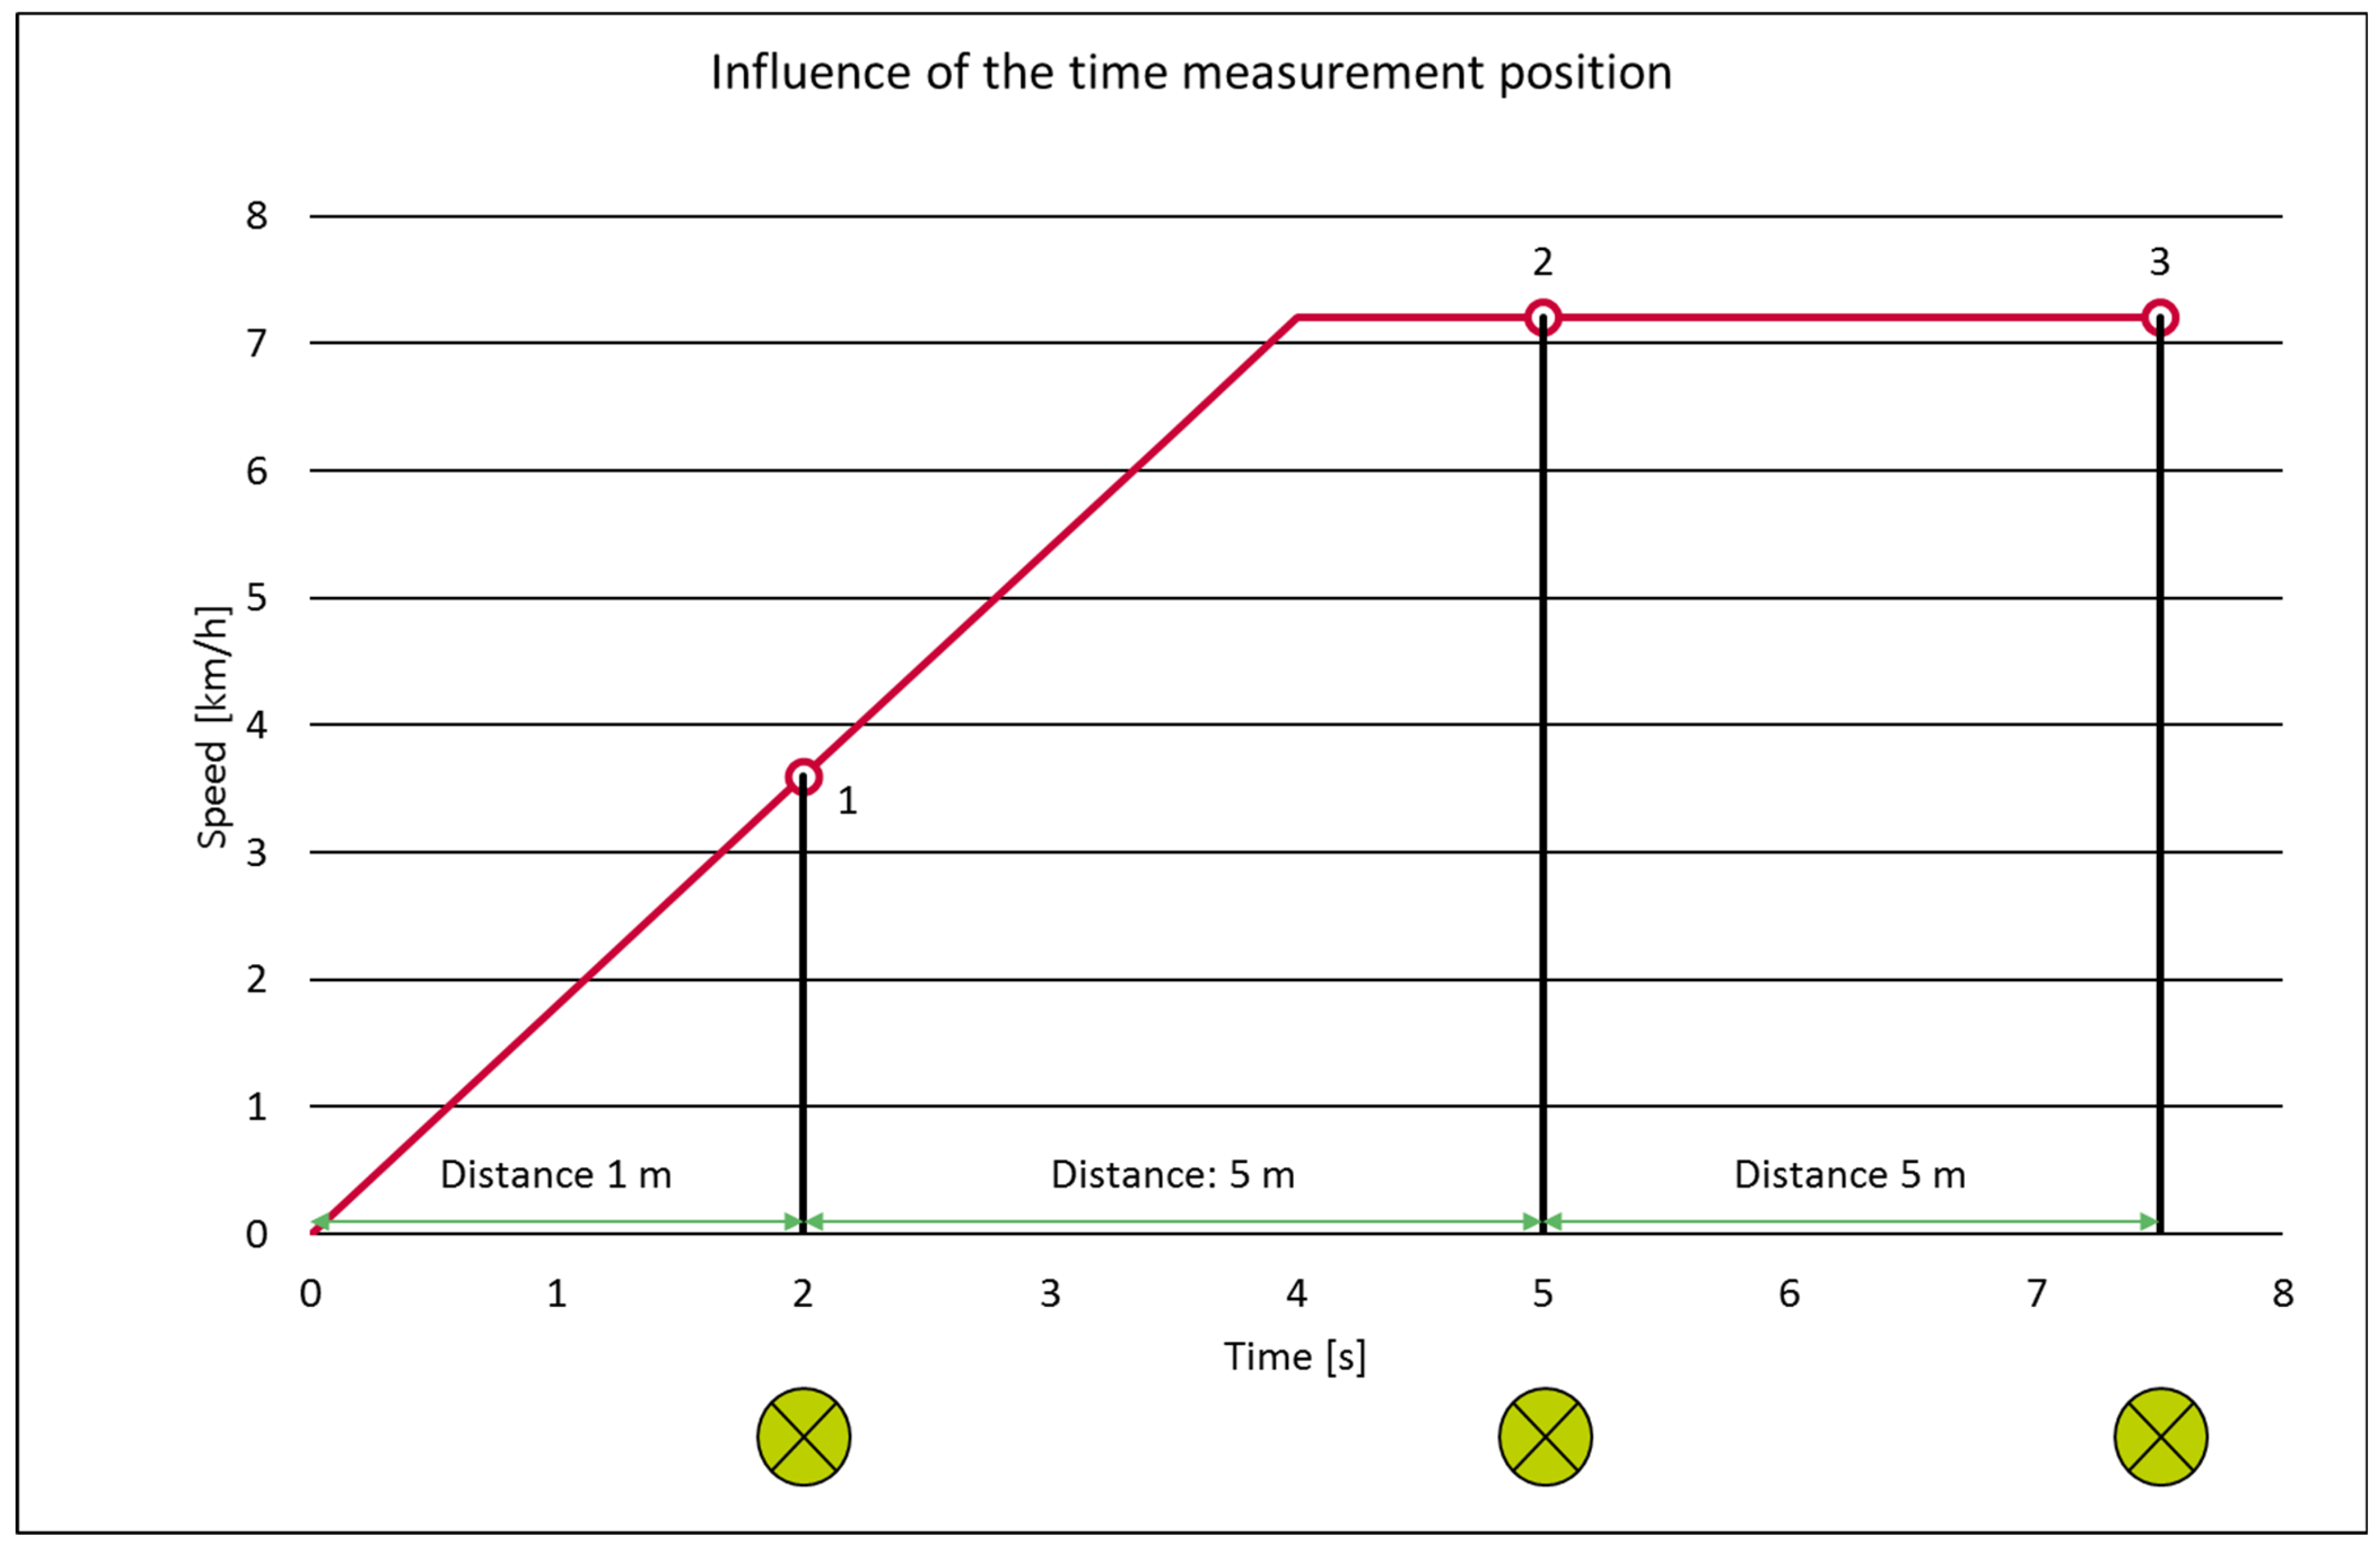
26])). These differences may be attributable to variations in the test configuration. It is expected that the children will attain a constant speed subsequent to the second light beam, following an acceleration phase of 1.3 m. It is important to note that if the children do not attain a constant speed immediately after this brief acceleration phase, they will persist in accelerating, despite the assumption of a steady-state speed. It is assumed that a steady-state speed is maintained between the second and third light beams, but there is still acceleration. In the context of the walking test configuration, it has been observed that a steady-state speed is maintained between the second and third light beams. However, the acceleration phase of the running tests is characterized by a prolonged duration, with steady-state speed being attained at a subsequent stage. It is important to acknowledge the potential underestimation of the steady-state speed attained after the second light beam, which may be more than the values reported in the extant literature. As shown in
Figure 6, the calculation of steady-state speed based on the distance and time between the second and third light beams results in a speed of 7.2 km/h. During the acceleration phase, a lower speed can be calculated based on the distance and time between light beams. In this particular example, the steady-state speed between the first and second light beams is calculated to be 6 km/h.
Research has demonstrated that older children, including both girls and boys, demonstrate higher speeds, a finding that aligns with existing literature on the subject. Despite the finding that steady-state speed is lower than the values reported in the extant literature, this discrepancy does not contradict the observed tendency. A number of studies have proposed a categorization based on specific age groups and gender, as evidenced by the works of Vaughan and Bain [
25,
26,
42], Eberhard and Himbert [
27] (cited in Vaughan and Bain [
25,
26]), and Eubanks and Hill [
28] (cited in Vaughan and Bain [
25,
26]). The results show that older children attain higher speeds. According to Vaughan and Bain [
25,
26,
42] as well as Eberhard and Himbert [
27] (cited in Vaughan and Bain [
25,
26]), boys tend to exhibit higher levels of speed in comparison to girls. Nevertheless, this observation was not substantiated in the present study.
A paucity of studies exists that examine the stopping distance or deceleration of children according to their age group. However, the extant literature on deceleration behavior primarily focuses on adults and their body postures immediately before collision [
43,
44,
45,
46]. It is important to note that these postures can exert a substantial influence on the patterns and severity of injuries. Research in this field involves the prediction of movement trajectories of pedestrians [
47,
48] and investigates movement characteristics of healthy individuals and those with a unilateral transtibial leg prosthesis [
49]. The study confidently determined a steady-state speed with a time to stop of approximately 1.6 s (Goldhammer et al. [
50]), while senior citizens and children had average times to stop of 3.25 s (SD = 1.25) and 3.14 s (SD = 1.13), respectively. These observations suggest that age group may not be a significant factor in reaction time, although further research is needed to confirm this conclusion. According to Tavana et al. [
35], the average time to stop was 0.58 s (SD = 0.31) with a total stopping distance of 0.63 m and a total stopping time of 1.08 s. Notably, the maximum speed recorded by Tavana et al. [
35] is comparable with the steady-state speed in the “walking” test configuration and the average stopping time of this test configuration. Furthermore, the stopping distance in the “walking” configuration ranges from 0.47 to 0.63 m at a steady-state speed of between 3.1 and 4.4 km/h. The study’s “walking” test configuration indicates that older children have a significantly shorter average stopping distance than younger children. The stopping time required to decelerate from steady-state speed to standstill ranges from 0.84 s to 1.21 s. This range demonstrates a negative correlation with children’s age. Moreover, the “running” test configuration revealed that the stopping distances of the various age groups were comparable. This finding serves to reinforce the study’s conclusions. The stopping distance ranges from 1.72 m to 1.84 m, and the stopping time ranges from 1.17 s to 1.28 s. The time required to decelerate from steady-state speed to standstill decreases with age. These results indicate a clear relationship between age and stopping performance. The temporal dynamics of the acoustic signal’s perception and subsequent reaction are not explicitly evaluated; however, these parameters can be inferred from the observed stopping distance and the deceleration phase. The specific braking distance is reduced, and the deceleration values achieved are potentially higher. It has been demonstrated that children can achieve a deceleration ranging from 0.91 m/s
2 (six years old) to 1.57 m/s
2 (9 to 10 years old) in the “walking” test configuration. In the “running” test configuration, deceleration ranges from 2.24 m/s
2 (six years old) to 3.19 m/s
2 (9 to 10 years old). According to Zou et al. [
51], pedestrians exhibit a median deceleration of 4.2 m/s
2 in response to hazardous situations, demonstrating a clear effort to avoid collisions. The authors conducted a study on vehicle-pedestrian accidents and subsequently analyzed the pedestrian’s response prior to the collision. The imminent danger of a collision is quite different from the test configuration, in which an acoustic signal is used to trigger a stopping maneuver. Consequently, the discrepancy in the deceleration rates observed between the present study and those reported by Zou et al. [
51] is not unexpected.
While the present study provides significant findings on stopping distances, stopping times, and braking behavior of children aged six to ten years under standardized, child-friendly conditions, the transferability of the results to real traffic situations must be viewed critically. In the controlled test environment, potential sources of distraction—including other road users, unpredictable vehicle movements, noise, and visual stimuli—were systematically minimized. However, it is important to note that these factors are not uncommon in real road traffic and have the potential to significantly influence children’s behavior. While the experimental results in the laboratory environment demonstrated that the children’s stopping distance after the acoustic signal in the current test configurations was up to 1.85 m, it is crucial to hypothesize that under real-world conditions, such as when children are distracted, the stopping distance could be significantly longer. This, in turn, would increase the probability of a collision.
It is particularly evident in children that the ability to direct attention and motor self-regulation is limited depending on age and can be significantly impaired by distraction, causing them to fail to stop before crossing the road [
4,
6,
8,
9]. In more complex environments, children may have difficulty stopping movements or reacting quickly to unexpected events, which may lead to longer reaction times and stopping distances in everyday situations. This discrepancy highlights the need to design future studies in such a way that they take more realistic framework conditions into account.
In order to increase the validity of future studies and improve their relevance to real-life traffic situations, methodological extensions to the study design should be considered, such as field surveys in a protected area under natural conditions, virtual reality simulations for a realistic but controlled representation of suitable traffic scenarios with targeted distraction stimuli or comparative age group studies for a more precise classification of development-related differences. These methodological extensions could help to increase the transferability of the study results to real traffic situations and to tailor specific prevention measures more precisely to age- and development-specific requirements.
The results of the present study highlight the need to focus training measures not only on motor skills, but also to specifically take real-world stress factors into account. In addition to the acquisition of motor skills, road safety education should therefore also include strategies for directing attention and dealing with distractions. Only by consistently developing methods and practical training approaches can road safety and the independent, safe behavior of young road users be sustainably improved.
6. Limitations
Despite receiving instruction on the proper methodology, the children frequently failed to adhere to the established theoretical velocity-distance characteristics. The acceleration phase was not completed before the second beam thereby resulting in an underestimation of the steady-state velocity between the second and third beams was underestimated. In some cases, the subjects began to decelerate prematurely, that is, before the third light beam was passed or before the acoustic signal was initiated. Consequently, the stopping distance is therefore underestimated.
The position of the children at the time of the acoustic signal is extracted from the video source. The position was not measured precisely with a measuring device. The position was estimated from the video data analysis; consequently, it is not recorded with precision.
The stopping distance is significantly influenced by the reaction time; however, it was not feasible to analyze the reaction times of the children in the test setup. It was hypothesized that the children would begin to decelerate immediately following the acoustic signal. However, this assertion is not entirely accurate, as there is invariably a temporal interval preceding an action. It is important to note that reaction time was not measured separately in this study.
According to the extant literature, younger children encounter difficulties in interrupting a movement once it has begun. The present study aimed to measure the stopping distance of children of different age groups in primary school. The study demonstrated that, even within the confines of a laboratory setting, children require ample space to halt. Following a thorough examination of the available evidence, it was determined that children are incapable of stopping immediately. However, the absence of a control group comprising adolescents, adults, and elderly people limits the study’s conclusions. A comparison with these groups would allow for more precise conclusions regarding any significant differences in the stopping distance of children. In order to enhance the robustness of the results, it would be advantageous to analyze adolescents, adults, and elderly people within the same test configuration.
Despite the considerable size of the overall sample, its magnitude diminishes when specific parameters are integrated, such as age groups and gender differences. Individual characteristics may exert an unequal influence on the outcomes.
The experimental tests were carried out in a non-hazardous environment. The extent to which the results can be extrapolated to real traffic conditions is not entirely clear and should be treated with care.
7. Conclusions
Our study provides key findings on the traffic-related movement control of children aged six to ten years. One of the most important findings of the study is that children up to a certain age have considerable difficulty in stopping a movement they have started in response to a stop signal. Both the speed of movement and age play a decisive role in braking behavior. The ability of volitional movement inhibition is an important component of road safety behavior in order to be able to avoid approaching dangers in a timely manner.
As part of the study, the stopping behavior, time, and distance of children in different test configurations—‘walking’ and ‘running’—were systematically recorded. In the walking configuration, the measured braking distances varied between 0.47 m and 0.63 m depending on age. Older children were able to achieve shorter braking distances and stopped faster, with braking times between 0.84 and 1.21 s. The deceleration performance when walking was between 0.91 m/s2 and 1.57 m/s2. When running, on the other hand, the braking distance was almost constant across all age groups at 1.72 to 1.84 meters, as was the braking time at 1.17 to 1.28 s. The deceleration measured here was 2.24 to 3.19 m/s2. It can be deduced from this that age-dependent differences are less pronounced when running, which indicates biomechanical limits to the ability to react and control at higher speeds. This finding highlights the fact that younger children in particular are a particularly vulnerable group in road traffic due to their still-maturing ability to inhibit movement, which requires special protection.
The results also make it clear that safety-relevant movement sequences such as stopping cannot be taught by traffic rules alone, but require intensive, independent practice under realistic conditions accompanied by adults, especially for younger children. The study thus provides both theoretically sound and practically applicable findings for promoting road safety among children and emphasizes the need for age-appropriate measures in traffic planning, policy, and education.


 ,
, 