Article

Non-Destructive Evaluation of Microstructural Changes Induced by Thermo-Mechanical Fatigue in Ferritic and Ferritic/Martensitic Steels

1
Fraunhofer Institute for Non-Destructive Testing, 66123 Saarbruecken, Germany
2
Institute of Materials Science and Engineering, RPTU Kaiserslautern-Landau, 67663 Kaiserslautern, Germany
*
Author to whom correspondence should be addressed.
Appl. Sci. 2025, 15(9), 4969; https://doi.org/10.3390/app15094969
Submission received: 24 March 2025 / Revised: 17 April 2025 / Accepted: 24 April 2025 / Published: 30 April 2025

Abstract

:

Featured Application

Detection of operational-induced material degradation in power plants.

Abstract

Non-destructive evaluation (NDE) is highly relevant to assessing micro- and macrostructural changes in ferritic and ferritic/martensitic steels subjected to high temperature loading. These materials are widely used in energy generation, where they undergo extreme thermal and mechanical loads. This study examines the feasibility of micromagnetic NDE techniques, i.e., micromagnetic measurements, supported by machine learning methods, to identify and characterize the micro- and macrostructural changes caused by the mechanical loading at high temperatures of power plant steels, i.e., ferritic/martensitic P91 and the high chromium ferritic steel HiperFer-17Cr2. While the P91 did not show any systematic changes in micromagnetic measurements, which generally correlate with the evolution of the microstructure and the mechanical properties, for the HiperFer-17Cr2, pronounced changes in the micromagnetic properties were observed. In correlation with the evolution of the hardness and cyclic deformation behavior, which are both mainly attributed to Laves phase precipitation, the micromagnetic measurements significantly changed depending on the temperature, number of load cycles and load amplitude applied. Thus, these NDE methods can be used for early diagnosis and preventive maintenance strategies for HiperFer-17Cr2, potentially extending the lifespan of the components and mitigating safety risks.

1. Introduction

The functionality and safety of power plants require structural materials that fulfill requirements such as high-temperature strength (at operating temperatures of 500 °C to 650 °C), sufficient corrosion resistance or resistance to neutron irradiation.
Ferritic–martensitic 9–12% Cr steels, such as P91, fulfill these requirements and are widely used for components like main steam pipes, boiler headers and superheater pipes in power plants [1]. Their mechanical strength is derived from the martensitic structure, characterized by numerous strengthening block, lath and subgrain boundaries; the high dislocation density and the strengthening precipitates (M23C6 carbides and MX carbonitrides) [2,3]. However, given the limited corrosion resistance of 9–12% Cr steels at temperatures up to 620 °C, high-chromium ferritic steels have been developed as promising alternatives. These steels combine excellent corrosion resistance, which is caused by the relatively high Cr content, with a high mechanical strength at these temperatures due to intermetallic (Fe,Cr,Si)2(Nb,W) Laves phase strengthening [4,5,6].
In view of the challenges associated with the safety assessment of power plants, the early and non-destructive detection of micro- and macrostructural changes induced by high temperature loadings is important. For ferromagnetic materials, microstructural changes caused by high temperature loading and the resulting changes in mechanical properties can be detected non-destructively, as shown in [7]. In the context of non-destructive evaluation (NDE), magnetic methods are of particular significance due to the close analogy between the modification of the steel’s microstructure and the movement of the magnetic domain walls under an applied magnetizing field [8,9,10]. In ferromagnetic materials, the movement of dislocations and the movement of domain walls are affected by microstructural imperfections encountered during movement through the material. The resulting correlation between mechanical and magnetic properties is well interpreted, and magnetic methods are usually simple and not expensive.
Moreover, in the context of the increasing digitalization and traceability of material properties, non-destructive tools supported by artificial intelligence (AI) methods can improve the characterization of the material properties and their changes along the product life cycle [11]. The application of machine learning (ML) methods in the analysis of non-destructively acquired data offers significant advantages to industries reliant on NDE techniques [11]. By using ML, deep learning and data fusion, AI can enhance the accuracy, efficiency and decision-making of NDE assessments. As technology continues to advance, the integration of AI in NDE undoubtedly plays a crucial role in ensuring safety and reliability across various industries.
However, the development of ML-supported non-destructive testing methods requires a sound knowledge of the relationship between the data obtained by NDE, the material degradation caused by typical operation conditions and the underlying macro- and microstructural changes. Therefore, the aim of the research project presented here is to analyze and predict changes in the microstructure and the mechanical properties (e.g., changes in hardness) of the martensitic 9–12% Cr steel P91 and the fully ferritic 17% Cr steel HiperFer-17Cr2. The investigation focuses on the isothermal cyclic loading in the high-cycle fatigue (HCF) and low-cycle fatigue (LCF) regime at temperatures ranging from 600 °C to 650 °C.
The analysis is based on non-destructive micromagnetic feature measurements, providing critical data and methods for assessing the safety of new reactor designs and for their monitoring during operation. The primary objective of this research is to identify load-induced changes using micromagnetic sensors. This approach could enable monitoring of the condition of components—such as pipeline segments—directly in their installed state, allowing for safe, predictive and cost-effective replacements. The present study discusses the dependencies of the micromagnetic features on different combinations of thermal and mechanical loadings. It has to be noted that the non-destructive measurements were not performed in situ. The microstructural changes induced by the variations in temperature and mechanical loading, and the associated changes in the mechanical material properties (e.g., Vickers hardness) were correlated with the micromagnetic parameters. Moreover, the relationship between these changes in mechanical properties and micromagnetic parameters and changes in microstructural features (e.g., number and density of (Fe2Mo) Laves phase particles) was determined and interpreted [12,13]. Additionally, the applicability of different ML algorithms to predict mechanical properties and microstructural characteristics based on the micromagnetic feature space was examined.

2. Materials and Methods

2.1. Materials: P91 and HiperFer-17Cr2

To produce the fatigue specimens of the martensitic P91, cylindrical blanks with a diameter of 15 mm were extracted via electrical discharge machining (EDM) from rolled raw material with a diameter of 80 mm, which were produced by BGH Edelstahl Freital GmbH, Freital, 01705, Germany. These blanks were then machined to obtain the specimen geometry shown in Figure 1, and the gauge lengths were mechanically polished. Prior to machining, the blanks were austenitized at 1050 °C for 30 min, air-quenched and subsequently tempered at 750 °C for 1 h, followed by cooling in air. The chemical composition of the P91 was measured by spark spectroscopy and is given in Table 1.
The high chromium ferritic steel HiperFer-17Cr2 with the chemical composition given in Table 1 was produced by the Steel Institute (IEHK) of RWTH Aachen, Germany. The blanks were extracted by water jet cutting from hot-rolled material with a thickness of 16 mm and were subsequently turned into the geometry shown in Figure 1. The turned specimens were austenitized at 1050 °C for 15 min followed by air cooling. Then, two-stage precipitation annealing was carried out: 545 °C for 5 h with water quenching followed by 650 °C for 1 h with water quenching. Finally, the specimens were polished in the gauge lengths to minimize the effect of surface roughness and oxidation.

2.2. Analyses of the Changes in Mechanical Properties by Indentation Testing

To analyze the changes in mechanical properties induced by the loading scenarios applied, Vickers hardness (HV) was measured for differently loaded specimens, using an indentation force of 98.07 N (HV10) and a ZHU 250 tabletop device from Zwick/Roell GmbH & Co. KG, 89079 Ulm, Germany. The measurements were performed at cross sections extracted from the gauge lengths of the specimens. For each specimen, six hardness measurements were conducted across two different cross sectionss.
In addition to conventional hardness measurements, instrumented cyclic indentation tests (CITs) were performed at the same cross sections to evaluate changes in the material’s cyclic deformation behavior. In accordance with [14,15], the material was cyclically loaded for 10 cycles with a Vickers indenter at a frequency of f = 1/12 Hz and a maximum force of 1000 mN. For the CIT, a Fischerscope H100 C device (Helmut Fischer GmbH, Sindelfingen, Germany) was used. This device enables the continuous measurement of the indentation force F and indentation depth h, resulting in an F-h hysteresis loop from the second cycle on. In analogy to the stress–strain hysteresis obtained in uniaxial fatigue tests, the half-width of the F-h hysteresis is defined as the plastic indentation depth amplitude ha,p, representing the amount plastic deformation in the respective indentation cycle.
The resulting ha,pN curve describes the cyclic deformation behavior in the CIT. From the fifth cycle on, the ha,pN curve shows a stabilized slope, which indicates the saturation of macroplastic deformation processes and hence, the domination of microplasticity. This regime can be described mathematically by the power law function given in Equation (1), where the slope of the ha,pN curve is represented by the respective exponent of the power law function, which is called the cyclic hardening exponent CHT eII. Since more pronounced cyclic hardening leads to a steeper slope of the ha,pN curve, |eII| correlates with the cyclic hardening potential of the material.
ha,p II = aII·NeII.
Note that this measurement of the mechanical properties is more sensitive to microstructural changes than conventional hardness measurements, which is demonstrated in [14,16]. This procedure is explained in more detail in [14,15].
As described in the previous work [12,13], 40 CITs were performed for each analyzed condition, with a spacing of 250 µm between the CIT points to prevent interference. Note that the analyses of the microstructural changes caused by isothermal fatigue loading and the investigations of the corresponding changes in the mechanical properties, which were determined by CITs and Vickers hardness measurements, were already shown in the previous work [13].

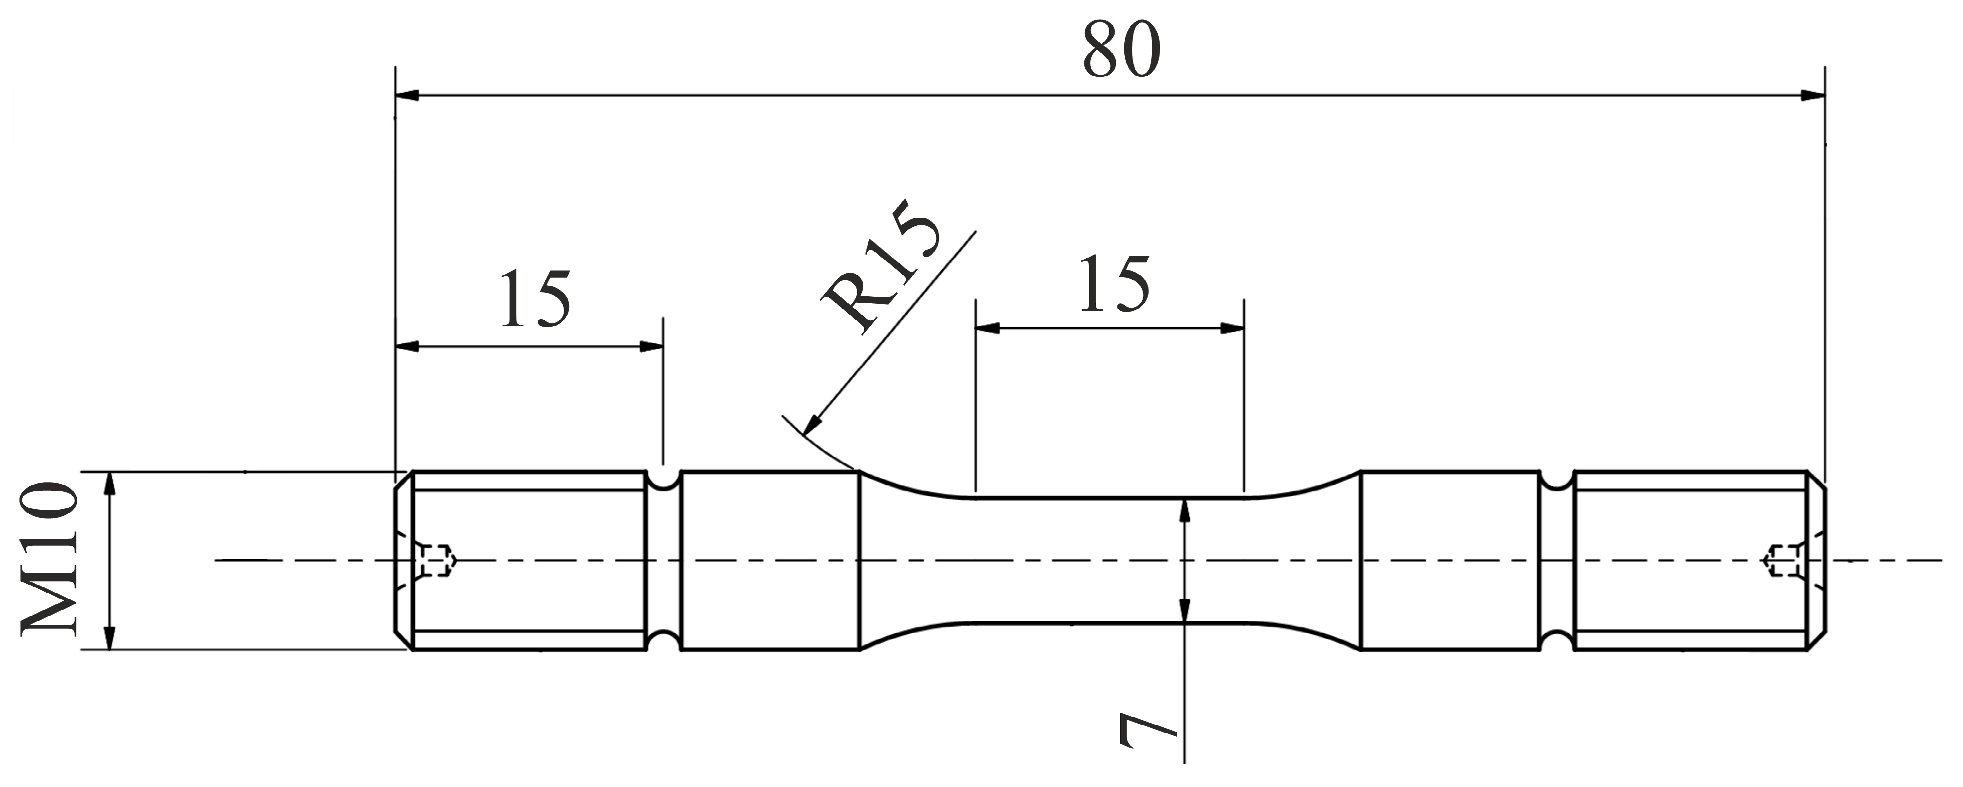
2.3. Isothermal Fatigue Loading of P91 and HiperFer-17Cr2

The fatigue specimens were loaded in isothermal fatigue tests using a servohydraulic test system MTS 100 kN equipped with a radiation furnace to achieve test temperatures of 600 °C, 635 °C and 650 °C, according to a previous study [12]. To measure and control the temperature of the specimens, a thermocouple of type K was applied in the middle of the gauge lengths of the specimens. The specimens were loaded with two different types of load scenarios, i.e., upper High-Cycle Fatigue (HCF) loads with f = 5 Hz and lower stress amplitudes, leading to failure at around 40,000 cycles, as well as Low-Cycle Fatigue (LCF) loads with f = 0.05 Hz and higher stress amplitudes, leading to failure at around 4000 cycles (Table 2). Furthermore, the fatigue specimens were loaded with stress amplitudes σa leading to similar numbers of cycles to failure across all three temperatures and for both materials, which were approximately 2000 cycles for the LCF tests and 20,000 cycles for the HCF tests (Table 2).
At the given loading conditions, fatigue specimens were loaded in intervals with a defined number of cycles and then the tests were interrupted to detect the corresponding microstructural changes and the respective mechanical properties. In addition to hardness, the plastic strain amplitude at interruption εa,p-inter. was determined for every investigated specimen as a mechanical parameter, providing information about changes in the cyclic deformation behavior between the intervals. This enabled the detection of the microstructural evolution and the mechanical and the micromagnetic properties during the isothermal fatigue loads. The number of cycles for the test interruptions was determined based on the changes in the cyclic deformation curves obtained, which were explained in detail in [12].

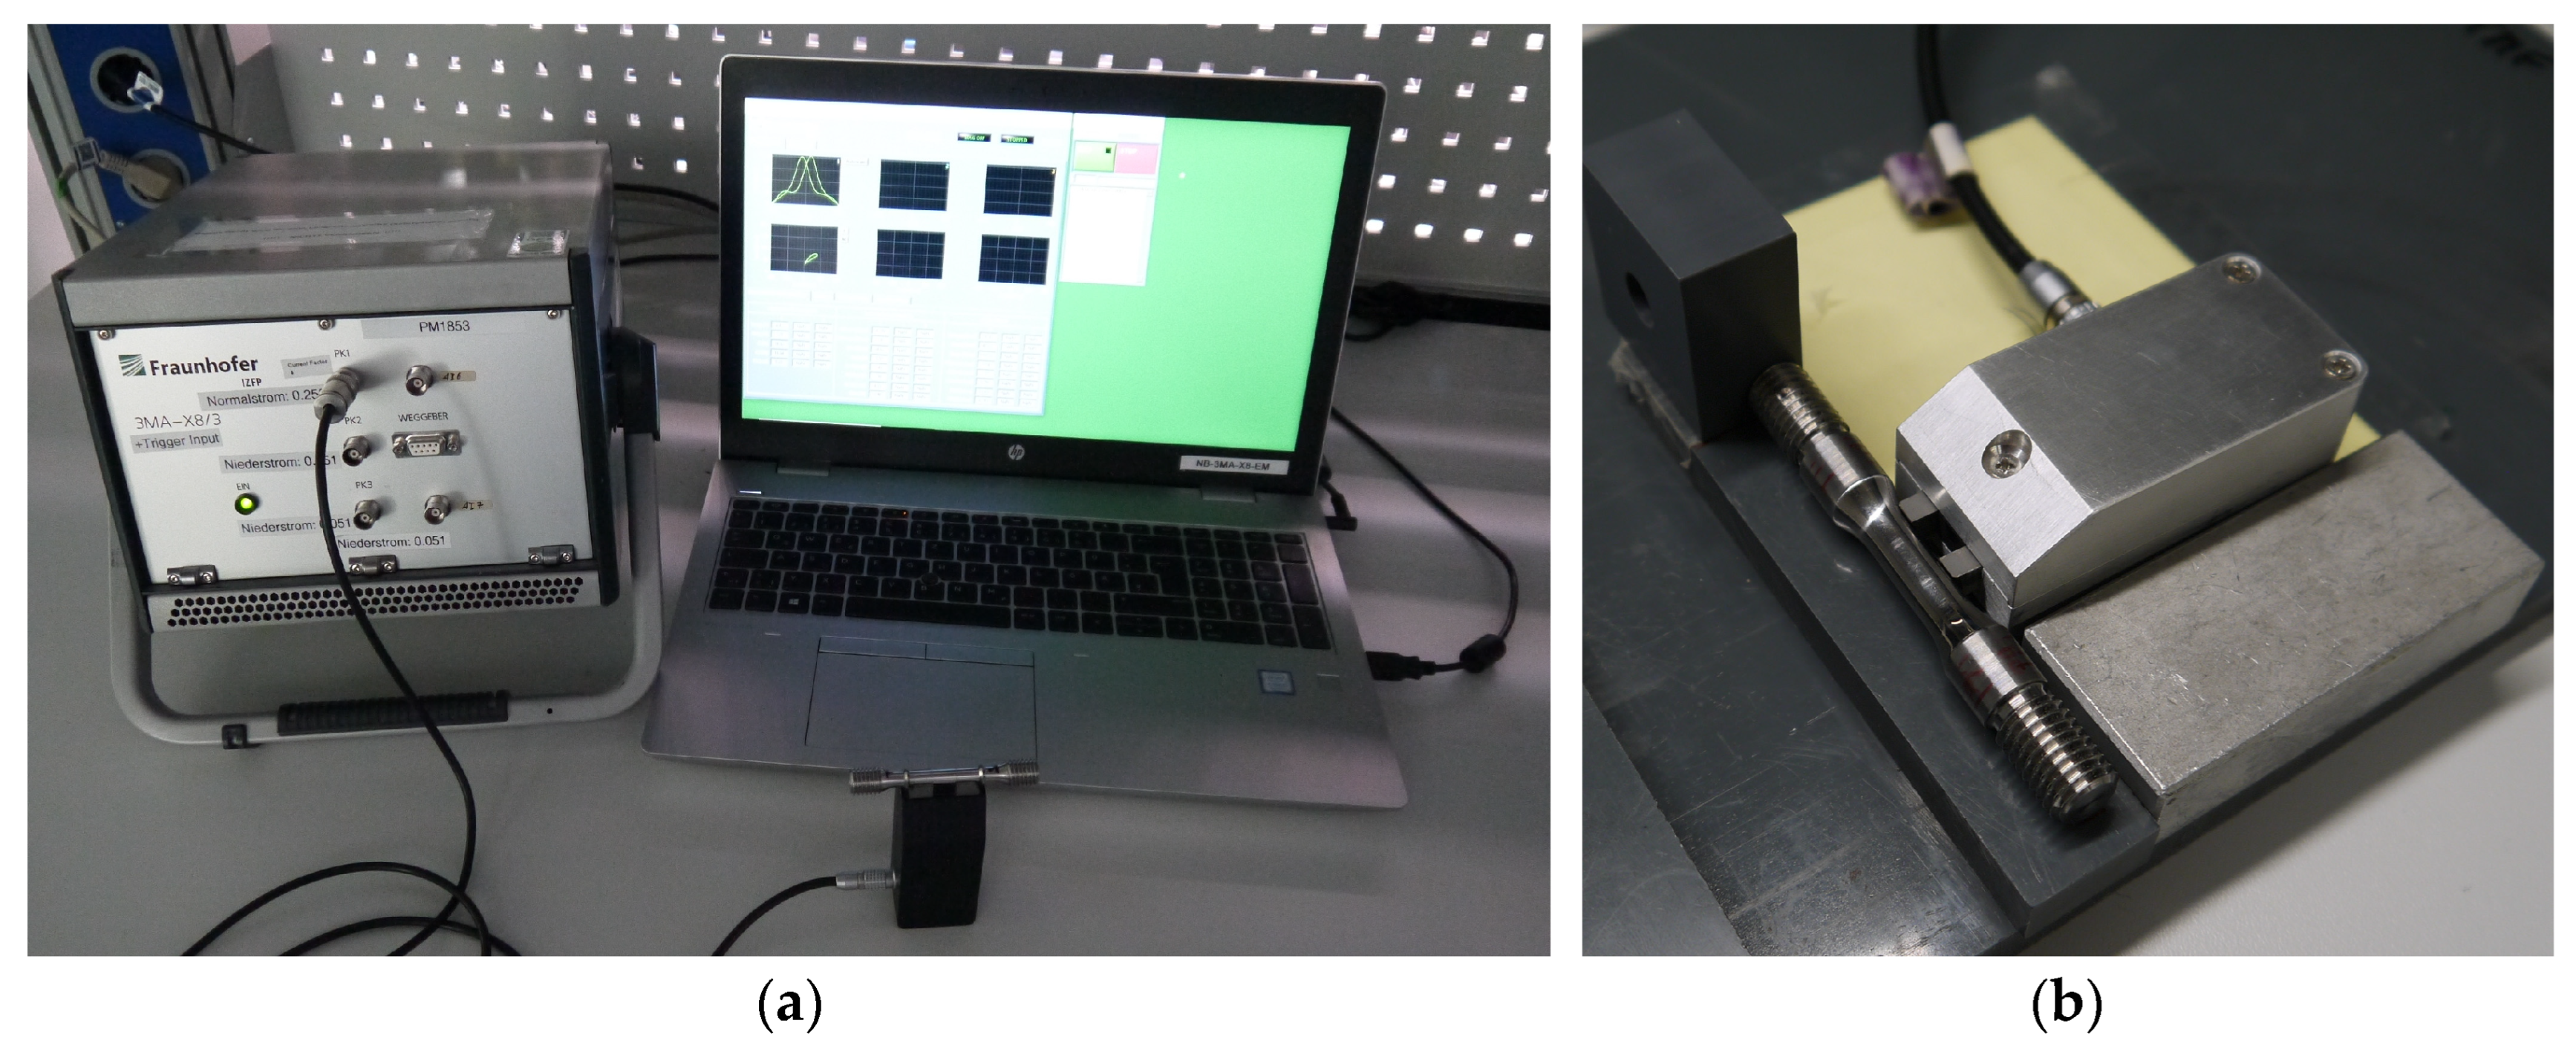
2.4. Micromagnetic Multiparameter, Microstructure and Stress Analysis (3MA) Method

Non-destructive methods for material characterization are based on physical principles and effects. Acoustic methods have been developed for the non-destructive detection of material damage caused by fatigue. Ultrasonic techniques are widely used for internal crack detection. Recent advances focus on nonlinear acoustic techniques, which are sensitive to microstructural changes before visible cracks form [17,18]. Ultrasonic laminography is one way of determining the state of damage over different component depths [19]. Fatigue-induced crack growth can be detected using ultrasonic methods. Phase transformations and the Villari effect can be measured ‘in situ’ using non-destructive magnetic testing methods and are used for assessing the fatigue condition and for a reliable service life calculation [20]. Furthermore, the fatigue properties of austenitic steels could be characterized at elevated service-relevant temperatures under isothermal and thermo-mechanical stress using electromagnetic acoustic transducers [21,22,23]. Ultrasonic methods can be used to detect fatigue-induced crack growth, but microstructures, such as carbides M23C6, Laves phases (Fe2Mo) and Z-phases, as they occur in the case of the materials analyzed in the current study, cannot be detected using such methods.
The behavior of steels during fatigue testing can also be monitored by infrared thermography, an advanced, high-speed, high-sensitivity and non-destructive evaluation technique [24].
Micromagnetic techniques are used to study the properties of ferromagnetic steels. Based on the correlation between the magnetic and mechanical properties of the considered materials, both classes of properties depend on the microstructure. Hence, micromagnetic measurements allow for the estimation or prediction of mechanical properties [8,9,10,25,26]. Depending on the microstructure state, particularly on the size and distribution of the microstructural imperfections, different effects have an influence on the magnetic Bloch-wall movement: the foreign-body effect (in case of small precipitates), stress effect (in case of precipitates and dislocations) or stray field effect (in case of dislocations and big precipitates) [27]. The micromagnetic techniques detect a combination of these effects.
For measuring magnetic hysteresis loops, the specimen must be rod-shaped and magnetized homogeneously at a low frequency, and the magnetic flux in the test specimen must be measured with a coil [8]. Due to the fact that the direct measurement of the hysteresis curve is not suitable for practical application with components, alternative magnetic techniques are applied for characterizing ferromagnetic materials. Frequently, micromagnetic effects in non-destructive testing are minor hysteresis loops, magnetic Barkhausen noise, harmonic analysis of the magnetic tangential field strength, eddy currents and incremental permeability [8,9,10,25,26,27,28,29,30,31,32].
Micromagnetic measuring devices comprise a magnetization unit, a probe and a unit for measurement control and data processing. The design and measurement parameters determine the depth and area of the materials that are analyzed. Micromagnetic methods can thus be used to measure a controllable fraction of the specimen volume.
Fraunhofer IZFP developed the Micromagnetic Multiparameter, Microstructure and Stress Analysis (3MA) technique, which indirectly and non-destructively predicts mechanical material properties using an on-site access micromagnetic sensor to measure the features derived from several magnetic methods [9]. The 3MA method is a powerful technique that allows for the integral comprehensive recording of micromagnetic characteristics across the entire surface of a specimen. The 3MA method has been applied in the characterization of various steel grades and types of damage over the last decades [28,29,30,31,32,33]. However, it is important to note that the 3MA method has limitations when it comes to detecting local changes in the microstructure and the mechanical properties derived from it.
The 3MA-X8 applied in this work is the latest implementation of 3MA, defined around a minimalistic sensor design, using the magnetization coil on a U-shaped core as the only sensing element [28]. The 3MA-X8 uses low-frequency excitation (f < 20 kHz) and offers high-speed multichannel measurement (>>100 measurements/s on 3, 8 or more channels synchronously, depending on the exact device variant). Due to the lower frequency range compared with previous 3MA implementations, a higher penetration depth of the magnetic field is reached. This is an important advantage, given the correlation of the magnetic properties with the material properties, as these are also integral values of the examined specimens. Harmonics analyses, incremental permeability analyses and eddy current impedance analyses are conducted by supplying a voltage signal comprising two frequencies to the electromagnet. The 3MA-X8 is operated via modular measuring software based on LabVIEW. The data acquisition and evaluation module produce a set of 21 magnetic features derived from the eddy current analysis, incremental permeability and the harmonic analysis in the time domain signal of the magnetization current. These 21 features are sensitive to different material characteristics. Some of them are sensitive to microstructural features (e.g., precipitates or dislocations), to residual stresses or to surface roughness, depending on the underlying interaction between the magnetic structure and micro- and macrostructure and depending on the different effects that have an influence on the magnetic Bloch-wall movement [28,29,30,31,32,33].
The drive current depends on the material analyzed with the probe, while the voltage is used to extract the parameters that describe the magnetization behavior. This is then correlated to the material properties [10,28,29,30,31,32,33]. A comprehensive overview of the various measurement applications of 3MA-X8 analysis is given in [18,28].
In this study, three of the twenty-one magnetic features are illustrated: DZmax is defined as the maximum value of the incremental permeability, W3Z is the width of the impedance loop at 3% of the maximum and W10Z is the width of the impedance loop at 10% of the maximum.
Figure 2 shows the 3MA-X8 device, including the probe. As part of the non-destructive material characterization, a 3MA sensor (Figure 2—right-hand side) with a concave rounding (R3.5) of the contact surface is processed. This design aims to ensure optimum coupling to the sample geometry (Figure 1) and thus, to enable the acquisition of optimum sensor signals across the entire surface of a specimen. Using a probe holder reduces the impact of position variations, which improves the reproducibility (Figure 2—right-hand side). The samples are magnetized in the longitudinal direction.
To define the proper measurement parameters, the micromagnetic investigations are conducted with varying measurement parameters, including the frequency and amplitude of the magnetic field. Finally, the 3MA-X8 measurements are performed with a magnetization frequency of 200 Hz, a magnetization voltage of 1.2 V and a superimposed higher frequency of 5 kHz with a voltage of 0.5 V.

2.5. Machine Learning (ML) Methods

The significance of the 3MA technique lies in the fact that through the use of diverse micromagnetic methods, redundant and multifarious information can be selected from material states for the purpose of non-destructive analysis. This information is then incorporated into a multiple regression approach, serving as a tool to predict material characteristics [9,33].
In the first step, the results of the individual 3MA-X8 measurements are thoroughly investigated to identify outliers or potential disturbances that may affect the dataset. With this understanding, the dataset can be analyzed to uncover any undesirable correlations. These disturbances must either be mitigated by adjusting the measurement setup or mathematically suppressed if the boundary conditions are known. If the mitigation of such disturbances is not possible, it is important to acknowledge their presence.
Following the cleansing of the dataset of undesirable influences, the manual correlation process can be initiated. During this phase, the targeted references (for example, HV10) are manually correlated with the 3MA-X8 features, with this correlation being based on pre-existing human expertise (e.g., the sensitivity of the 3MA features to different microstructural characteristics). This human-driven correlation assists in the identification of further outliers, the recognition of trends and the exploration of initial correlation possibilities. This process offers insights into the potential of the dataset and provides a basis for evaluating the accuracy of subsequent trained models and the extent of their capabilities. However, it is important to note that this method is susceptible to errors, as human bias can affect the analysis based on preconceived expectations and cannot build dependencies within the multidimensional 3MA-X8 feature space. To eliminate this bias and fully utilize the multidimensional 3MA-X8 feature space, statistical machine learning models are used. These models leverage statistical dependencies to predict the targeted value from the 3MA-X8 data, a process known as regression modeling. Notwithstanding the numerous advantages offered by machine learning (e.g., scalability, pattern recognition without prior assumptions), human expertise remains indispensable. These include contextualization and the identification and avoidance of systematic distortions in training data.
Given the relatively small size of the dataset and the need for explainability, only a set of linear models, listed in Table 3, are employed. In the context of the evaluation and selection of the model, the relative root mean square error (RRMSE) and the coefficient of determination (R2) are of pivotal significance. The RRMSE is a metric commonly used. R2 measures how well a model fits the data compared to a simple horizontal line representing the null hypothesis. It can range from negative values, indicating that the model performs worse than the horizontal line, to a maximum of 1, which signifies a perfect fit. A value of 0 denotes that the model explains none of the variability in the response data around its mean values. The RRMSE serves as a percentage that reflects the model’s predictive accuracy by quantifying the average deviation between predicted and actual values relative to the mean value of all actual measures. Both metrics should be considered together to fully understand the model’s performance.

3. Results and Discussion

All specimens loaded with two different types of load scenarios were examined non-destructively by using the 3MA-X8 technique. The sample was positioned in a fixed setup to ensure that the variation introduced with the measurement setup was reduced to a minimum (Figure 2—right-hand side). For both materials investigated, the relationships between the 21 micromagnetic features obtained by 3MA-X8; the number of load cycles and the mechanical properties, i.e., the plastic strain amplitude obtained at the point of test interruption εa,p-inter.; the hardness HV10 as well as the cyclic hardening potential represented by |eII| were analyzed. As mentioned in Section 2.4, the 3MA-X8 features were sensitive to different material characteristics and consequently, only a few of the 21 features were sensitive to the changes in the precipitation or dislocation density induced by isothermal fatigue loading. Therefore, in the following sections, only some of those few 3MA-X8 features that are sensitive to precipitation and dislocation density, which are dominant microstructural changes, are shown. Additionally, the findings on the applicability of different ML algorithms to predict mechanical properties and microstructural characteristics based on the 3MA feature space are presented. The following procedure was performed:
  • Correlation of features derived from the 3MA-X8 with the number of load cycles;
  • Correlation of features derived from the 3MA-X8 with the mechanical properties;
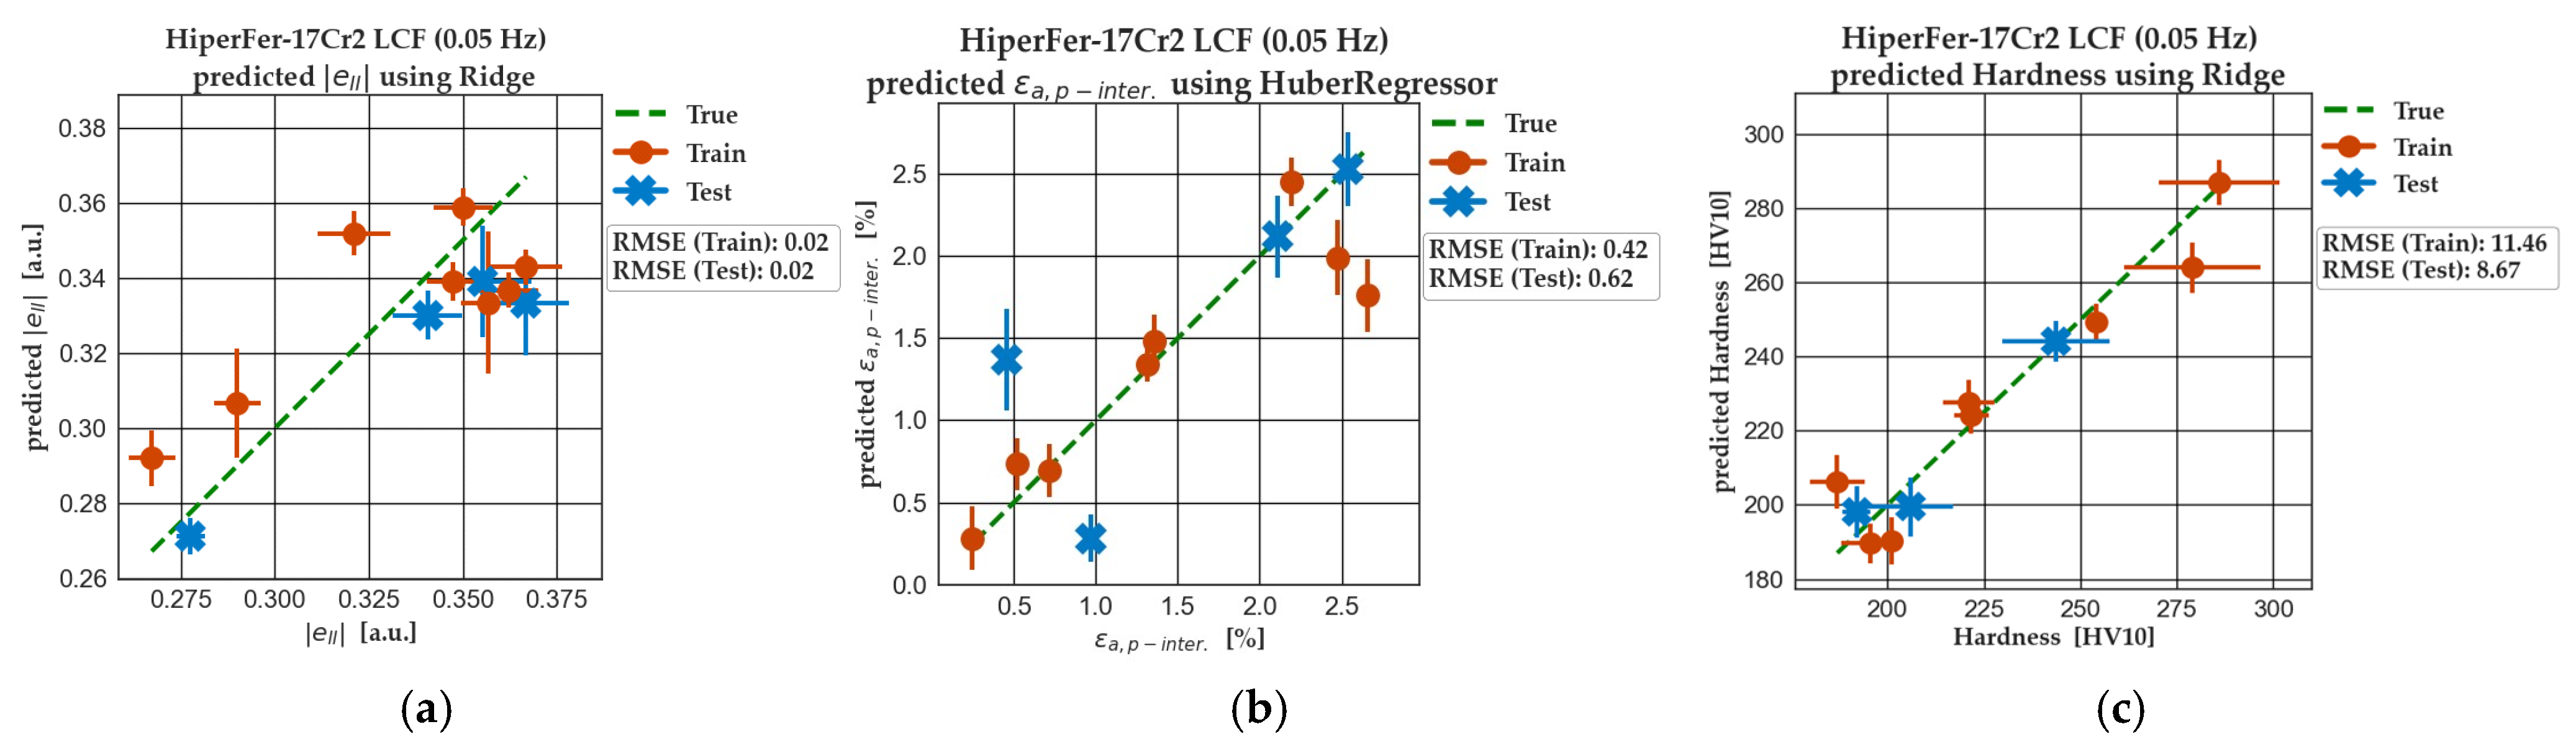
  • Prediction of the mechanical properties based on 3MA-X8 measurements using ML methods;
  • Prediction of the microstructural features (e.g., precipitation density) based on 3MA-X8 measurements using ML methods.

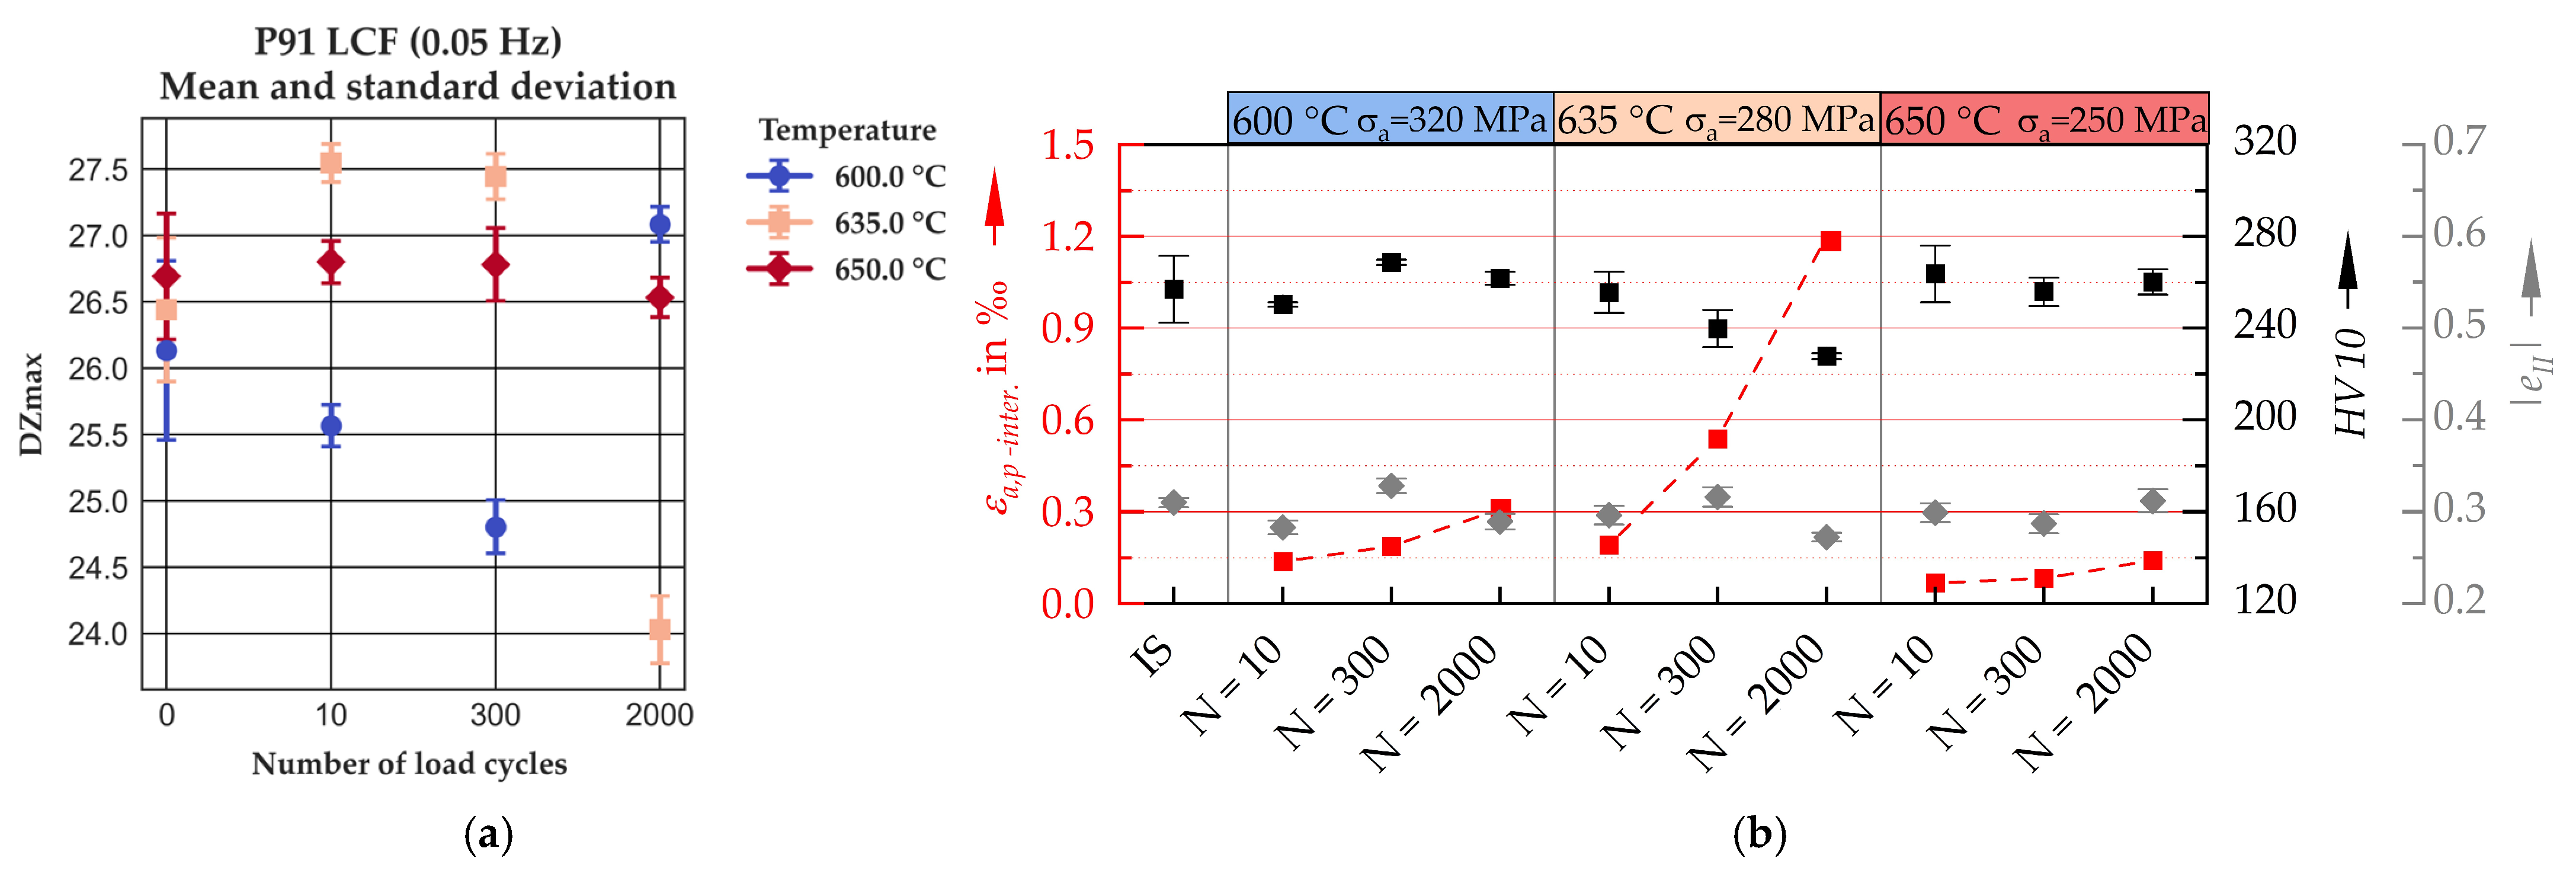
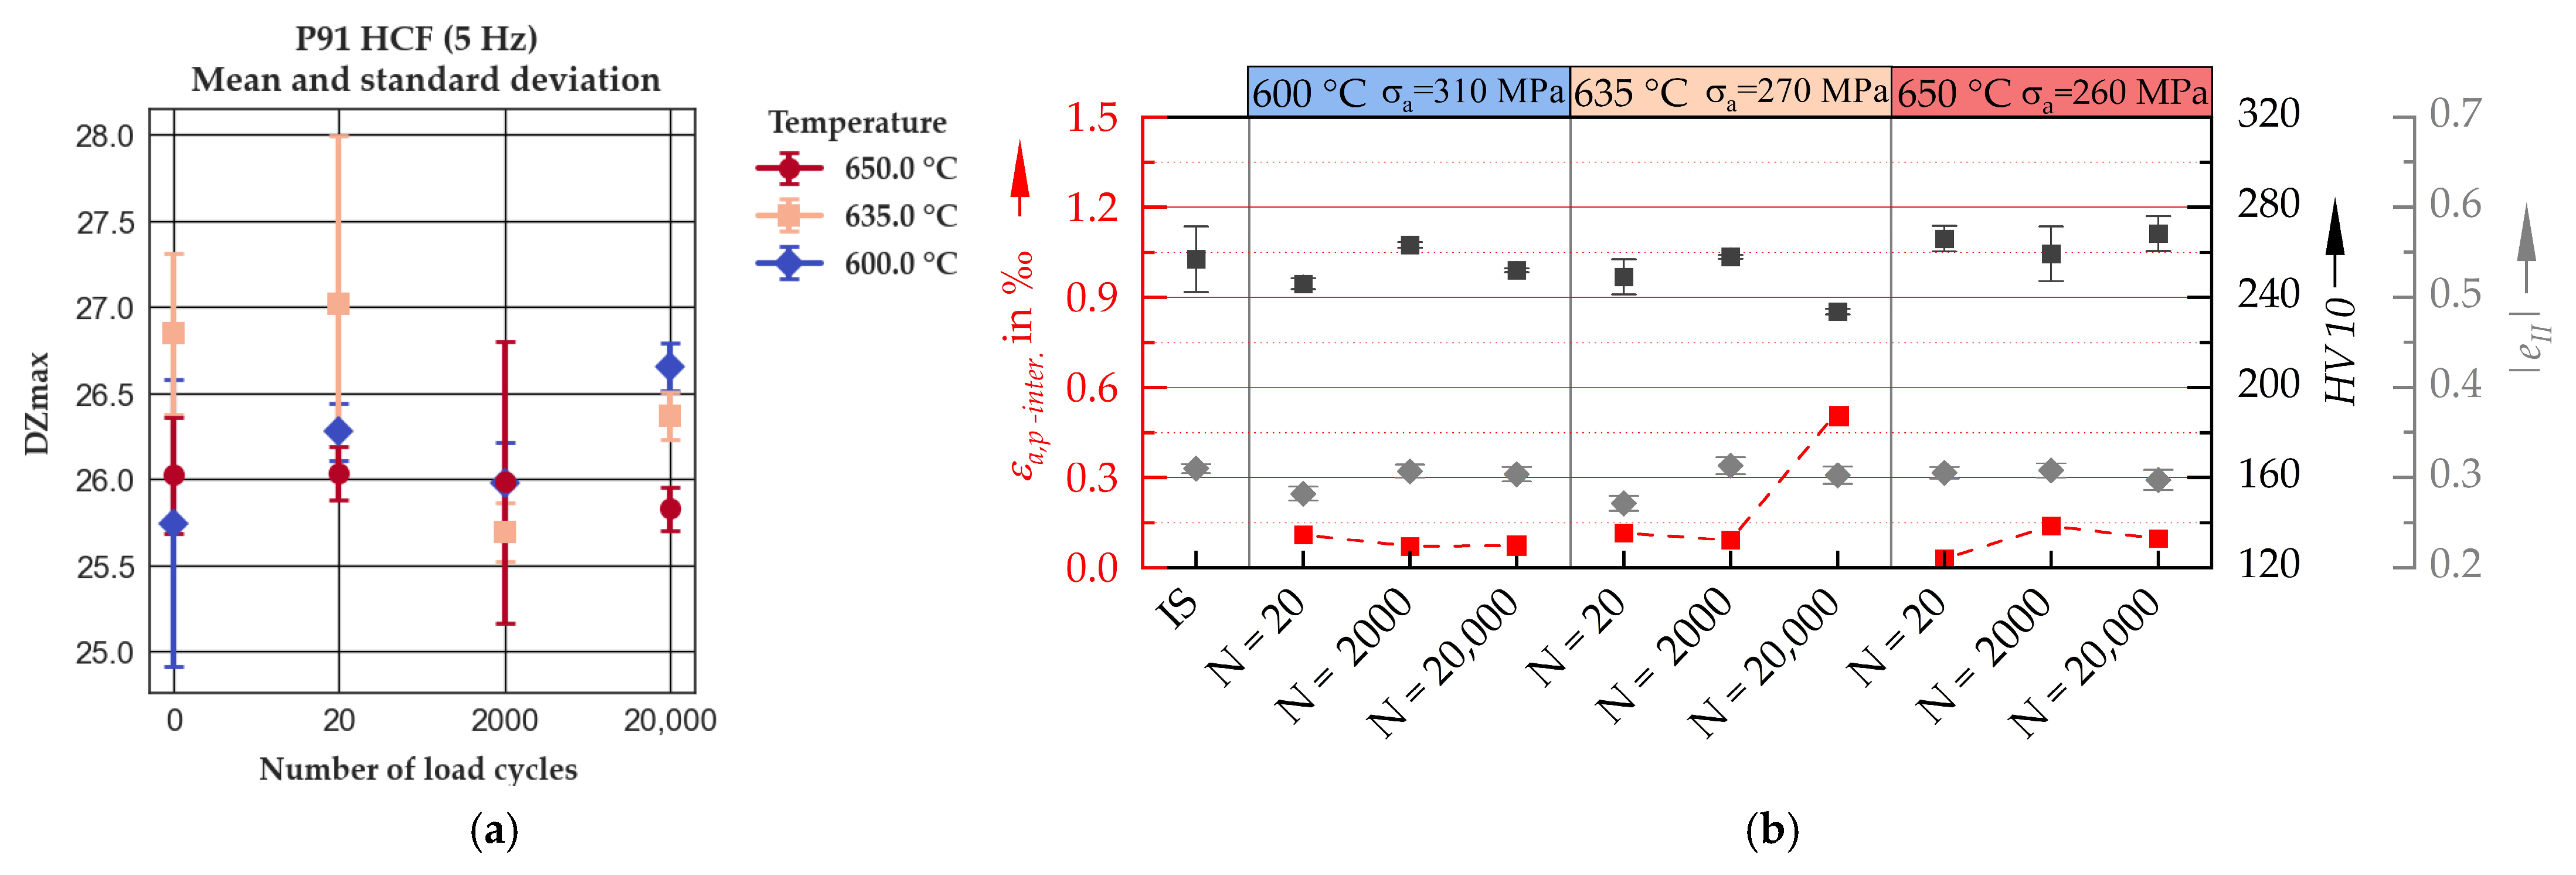
3.1. Results of the Analysis of P91

The evaluation of the 3MA-X8 features in relation to the number of load cycles is given in Figure 3a and Figure 4a for P91. These figures demonstrate that neither the LCF nor the HCF load induce any systematic change in the material’s magnetic properties (exemplarily illustrated by DZmax). The fatigue tests performed at the highest temperature (650 °C) as well as the lowest temperature (600 °C) did not cause a change in the mechanical properties until the cyclic saturation phase or just until the beginning of cyclic softening. Note that the cyclic softening was most pronounced at intermediate temperatures (635 °C), as a more pronounced increase in εa,p-inter. was evident at both loading types, which, however, was only accompanied by a weak decrease in HV10.
In both the 3MA-X8 and the mechanical measurements, no systematic changes were detected regarding all loading temperatures for the P91 material. Only for a temperature of 635 °C, an increase in εa,p-inter. and a decrease in HV10, which was accompanied with a decrease in DZmax, were observed between 300 and 2000 cycles. Moreover, DZmax decreased at 600 °C in this fatigue life interval, which, however, did not correlate with changes in mechanical properties. In summary, for most conditions, there were no pronounced changes in micromagnetic and mechanical measures, disabling a reasonable correlation analysis.
The absence of variations suggests that the material did not undergo any significant macroscopic changes. According to the SEM analysis, the density of precipitates, which could affect the magnetic material behavior, did not change during the fatigue loading [13]. Additional examinations indicated that the grain structure and grain size also did not change at a large scale. The cyclic softening observed at the specimens fatigued at 635 °C was primarily associated with recovery processes, attributed to a reduction in dislocation density. However, based on the changes in micromagnetic properties obtained, it can be assumed that the microstructural changes induced in P91 are too weak to be measured by 3MA-X8. Therefore, the prediction of the mechanical properties and the microstructural features (e.g., precipitation density) based on 3MA-X8 measurements using ML methods is not possible.

3.2. Results of the Analysis of HiperFer-17Cr2

As shown in [12], the HiperFer-17Cr2 shows significantly more pronounced changes in the microstructure and the mechanical properties. Consequently, stronger changes in micromagnetic properties can be expected than those observed in P91. Accordingly, the evaluation of the 3MA-X8 measurements performed on the HiperFer-17Cr2 specimens reveals that several micromagnetic parameters allow for a clear differentiation between the loaded and unloaded states. When analyzing these changes, it must be considered that within the first 10 LCF or 20 HCF cycles, the material shows cyclic hardening only due to an increase in dislocation density, while the changes in the microstructure and cyclic deformation behavior after this initial phase are dominated by the precipitation of the Laves phase [13]. For long-term operation and industrial applications, this initial cyclic hardening and the accompanied microstructural changes are less relevant. To exclude the superposition of this initial change and the precipitation occurring afterwards, the unloaded state, and thus, the changes occurring in the first 10 LCF or 20 HCF cycles, are not considered in the correlation analysis.
After the initial cyclic hardening, a cyclic saturation phase or a slight cyclic softening can be observed for HiperFer-17Cr2, which is followed by a second phase of cyclic hardening. Qualitatively, these three phases can be observed in the cyclic deformation curves obtained under both LCF and HCF loading [12,13]. However, these phases are differently pronounced depending on the load temperature, while the formation of intragranular Laves phases during the second prolonged cyclic hardening phase initiates earlier with increasing temperature. Furthermore, note that an increase in dislocation density up to half of the fatigue life occurs, which also is expected to influence the mechanical and micromagnetic measures.
When comparing HiperFer-17Cr2 and P91, HiperFer-17Cr2 shows a significantly stronger change in mechanical parameters, primarily driven by an enhanced thermo-mechanically induced precipitation and an increased dislocation density. These microstructural changes, caused by the applied loading, introduce numerous new barriers to domain wall motion, leading to significant changes in the micromagnetic properties. In contrast, P91 features a high density of obstacles to domain wall motion in its initial state, owing to its strengthened microstructure with high precipitate and dislocation densities [34]. Due to the relatively short loading time, precipitate coarsening is minimal. Although dislocation density decreases, it remains significantly higher than in HiperFer-17Cr2 (see [13]), and subgrain coarsening is only weakly developed in the investigated conditions. Consequently, the effect of microstructural obstacles on domain wall motion remains nearly unchanged, reflected by there being no pronounced changes in the micromagnetic parameters.
In summary, the micromagnetic behavior differs between the materials due to opposing microstructural developments: HiperFer-17Cr2 forms new obstacles to domain wall motion, while P91 reduces the existing ones. It is also important to note that the martensitic microstructure of P91 exhibits magnetic characteristics that differ from those of conventional ferritic steels, which impacts the results obtained in micromagnetic measurements. Ferrite has a low mechanical hardness and very often also has a low magnetic hardness in terms of coercivity, whereas martensite shows a high mechanical and magnetic hardness and is much more brittle [27,28,35].

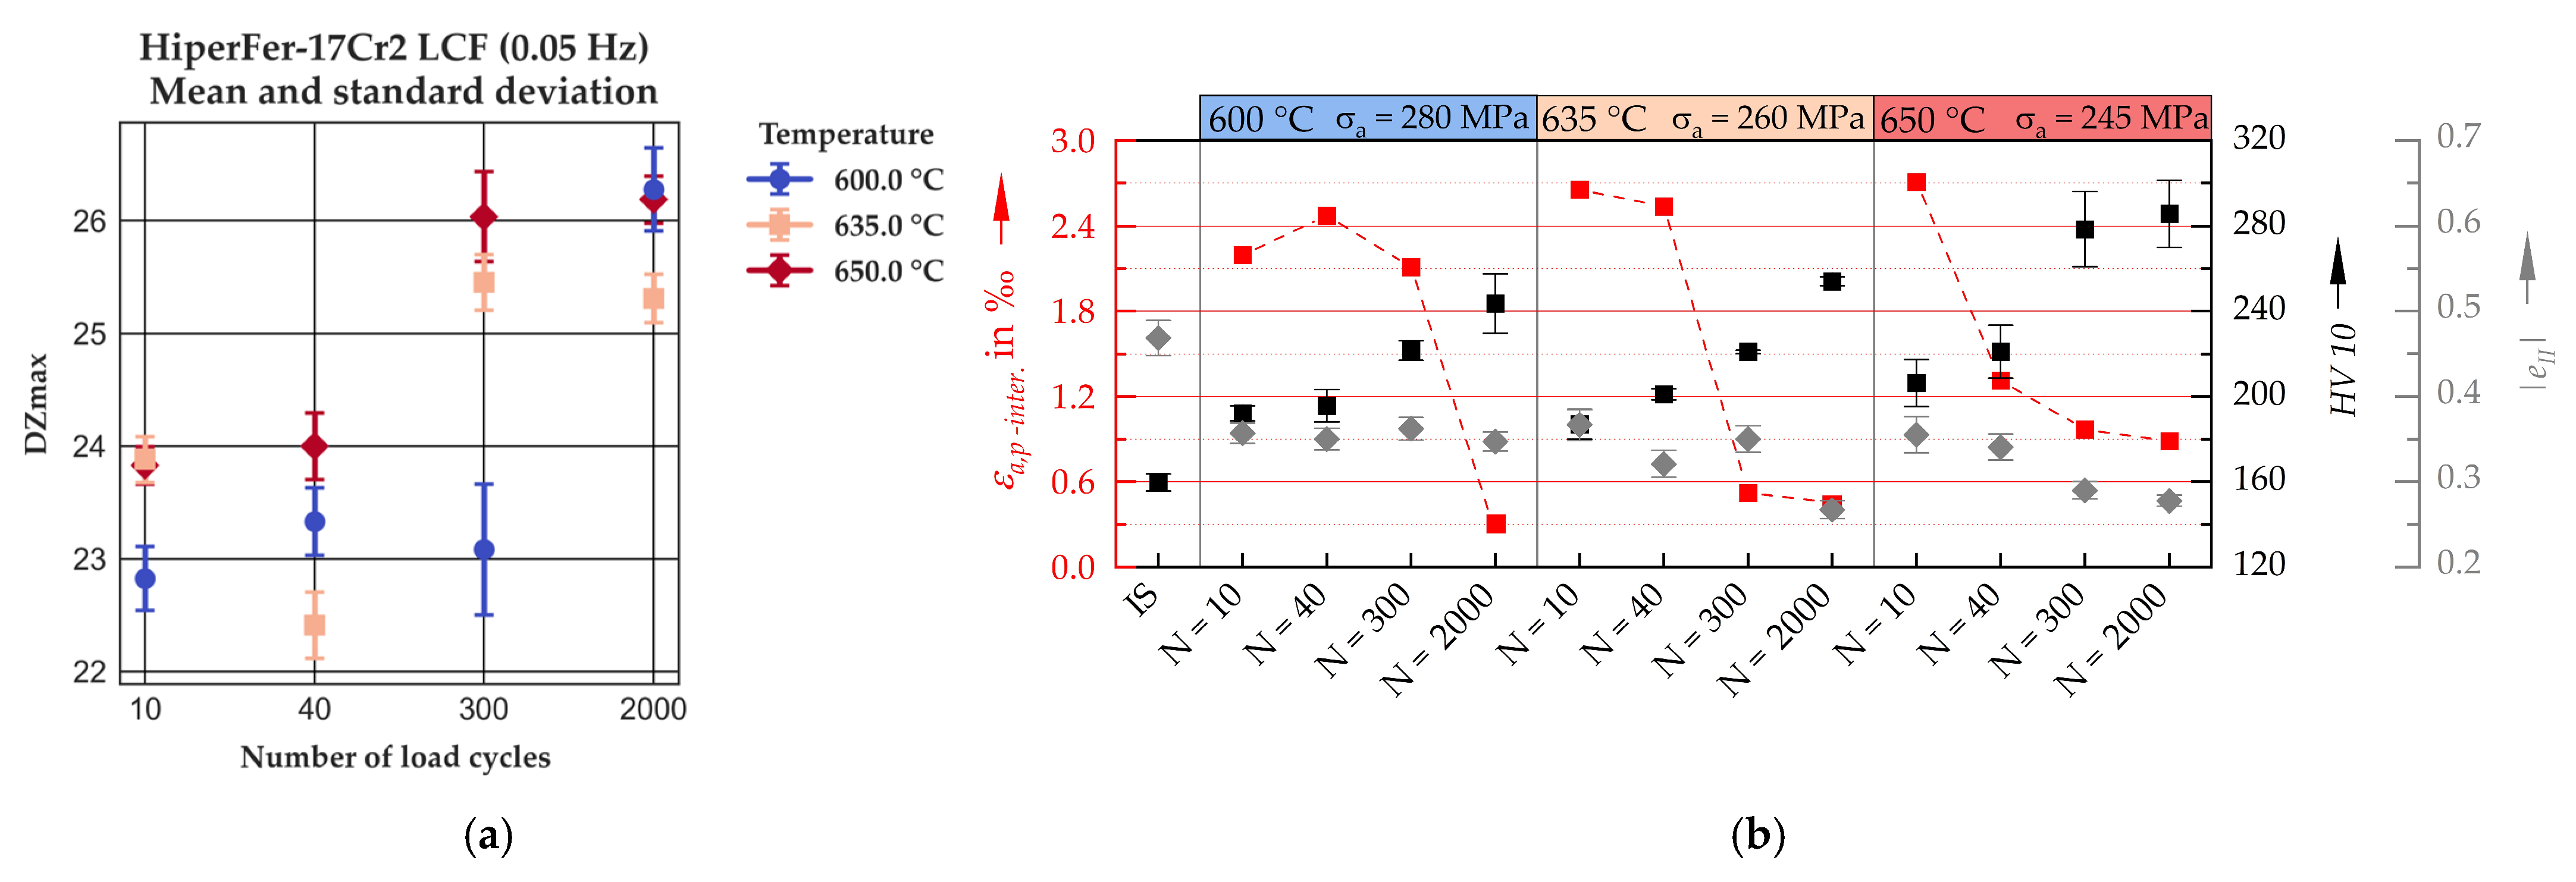
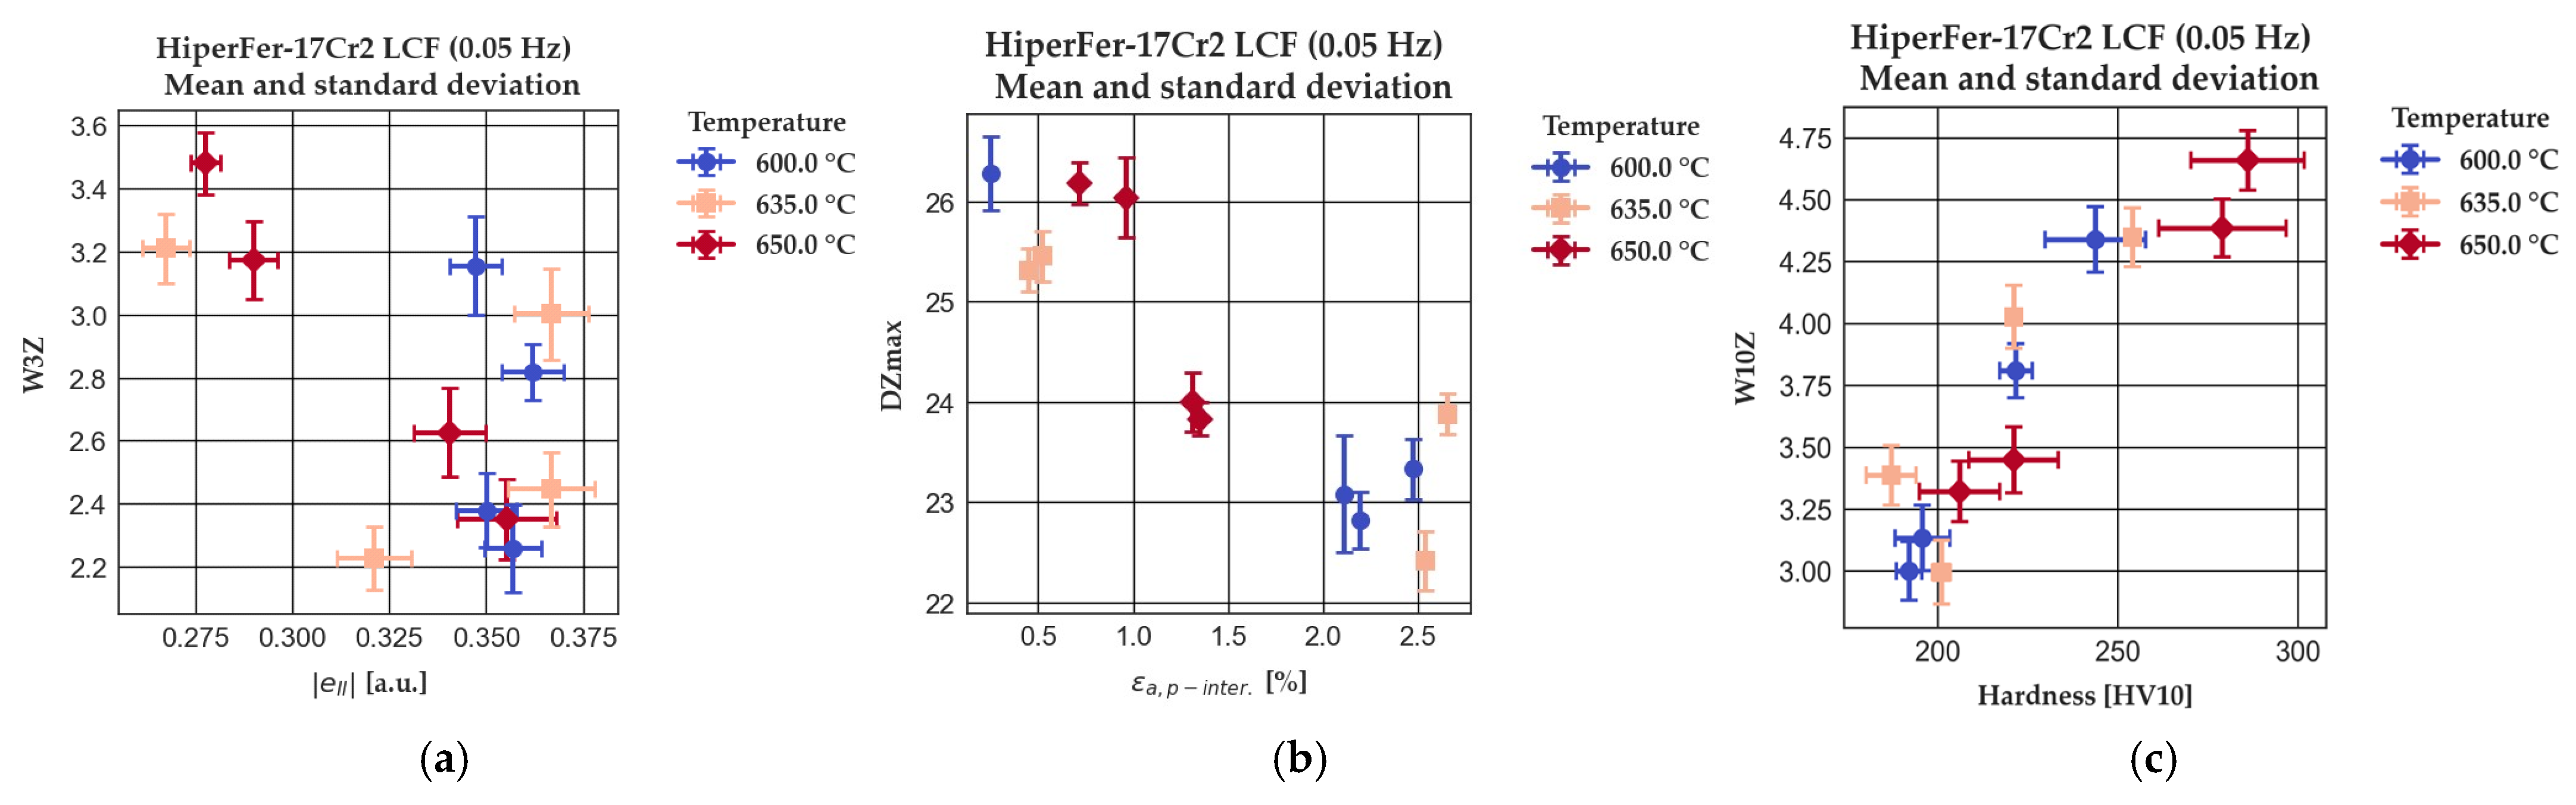
3.2.1. Low-Cycle Fatigue (LCF)

Figure 5 illustrates the correlation between one of the 3MA-X8 features (DZmax) and the number of LCF cycles, excluding the initial state and the changes occurring in the first 10 cycles. The LCF loading from 10 to 2000 cycles of HiperFer-17Cr2 causes macroscopic/wide-ranging changes in the microstructure and the mechanical properties, which correlate with changes in the magnetic properties.
The mechanical properties exhibit significant changes across varying load cycles: a notable increase in mechanical hardness is observed, ranging from 190 to 280 HV10, depending on the loading temperature, over a span of 10 to 2000 load cycles. Additionally, εa,p-inter. decreases with an increasing number of load cycles, indicating a cyclic hardening, which is mainly driven by Laves phase precipitation and corresponds to the rise in HV10 and partially corresponds to a decrease in |eII|. Note that previous work indicates that |eII| is more sensitive to changes in the precipitation state than HV10 or εa,p-inter. [14,16], which might explain the deviations in the evolution of |eII| [12].
During the first cyclic saturation phase, the microstructural changes are only weakly pronounced and substantial Laves phase precipitation sets in after this phase. This is reflected in the change in magnetic properties presented in Figure 5a. During the final cyclic hardening, thermo-mechanical-induced precipitates form, resulting in pronounced cyclic hardening and in a change in the magnetic properties. As the formation of the precipitates is initiated earlier at higher temperatures, the change in the magnetic behavior starts earlier. It can be observed that the magnetic behavior significantly changes once the formation of the precipitates starts, which corresponds more or less with the change in εa,p-inter. (Figure 5).
Since a qualitative correlation between the microstructural changes, the mechanical properties and the magnetic measurements is observed, manual correlations of the 3MA-X8 measurements with the mechanical properties are conducted to identify outliers, to recognize trends and to explore initial correlation possibilities. Most of the 3MA-X8 features that show a good correlation with the mechanical properties are derived from the incremental permeability and eddy current analysis, indicating that the significant systematic change in the material properties takes place near the surface.
In Figure 6, some examples of correlations between the mechanical measures, i.e., |eII|, HV10 and εa,p-inter., and the micromagnetic features are presented, being representative for all of the correlations determined. The hardness HV10 and plastic strain amplitude εa,p-inter. show a strong correlation with the micromagnetic properties for all temperatures (see examples in Figure 6b,c), whereas a clear correlation between the 3MA-X8 features and the cyclic hardening potential |eII| is observed only for one temperature, which is exemplarily shown for W3Z in Figure 6a. However, it shows no systematic trend when considering the results obtained at the other temperatures. As clear trends in the changes in |eII| are only obtained at 650 °C, a correlation with the micromagnetic measurements is only possible for this temperature. However, the microstructural reasons for this remain unclear and need to be analyzed in future work. Note that the cyclic hardening potential is highly sensitive to not only the density and size of precipitation, but also its coherency with the surrounding material volume, and hence, the whole precipitation state (see [16]). Since the higher temperature leads to enhanced changes in precipitation, this might explain the more pronounced and earlier changes in |eII| at this temperature.
Note that changes in the density of imperfections of the material’s lattice structure, e.g., dislocations and precipitations, influence the movement of the conduction electrons scattered at the lattice defects. These electrons are predominantly scattered by lattice vibrations (e.g., phonons) and by lattice defects. Given that the electrical conductivity of a material is proportional to the mobility of the conduction electrons, the changes in microstructure observed will result in a corresponding change in electrical conductivity. Moreover, the lattice imperfections impede the movement of the magnetic Bloch-walls and hence influence the magnetic permeability of the material. Depending on the size and distribution of the microstructural imperfections, different effects have an influence on the magnetic Bloch-wall movement: the foreign-body effect (in case of small precipitates), stress effect (in case of precipitates and dislocations) or stray field effect (in case of dislocations and big precipitates) [27].
Figure 6 demonstrates that the change in the features derived from the incremental permeability analysis DZmax (Figure 6b) is much smaller than the change in the features derived from the eddy current analysis W3Z and W10Z (Figure 6a,c). The change in W3Z and W10Z is about 30–50%, while the decrease in DZmax is approx. 15%. As the eddy current features reflect changes in both electrical conductivity and magnetic permeability [36], the results indicate that the main effect is caused by changes in the electrical conductivity.
Given that the 3MA-X8 generates a 21-dimensional feature space, manual correlation analysis becomes impractical. Therefore, ML methods are applied by utilizing multiparameter analysis to select micromagnetic features, which are most appropriate for the prediction of a targeted mechanical property. After that, the significant features are combined or ‘merged’ into a regression approach. Various regression techniques (Table 3) are trained on the datasets collected by means of the 3MA-X8, mechanical and microstructural characterization. In order to validate the regression methods, the specimens and the corresponding dataset are divided into two groups: training specimens, which include the corresponding training data, and test specimens, which include the corresponding test data. Approximately one-third of the entire set of samples (not only data points) is reserved for testing. It is important to mention that the extremes are not removed, as we aim to perform interpolation.
Figure 7 presents the correlation of the reference values measured by mechanical characterization (x-axis) and the predicted values from the model (y-axis), with the green dashed line representing an “ideal” outcome. When considering all available 3MA-X8 features, the regression regarding |eII| does not provide satisfactory results (Figure 7a), which is expected based on manual correlation analysis. The analysis of the individual 3MA-X8 features indicates that only at 650 °C significant changes in micromagnetic features correlate with an increasing |eII| (Figure 6a), and hence, the prediction of |eII| for all temperatures is not feasible. In contrast, both εa,p-inter. and HV10 (Figure 7b,c) can be better predicted. As concluded from Figure 7, a correlation of the 3MA-X8 features and the mechanical measures εa,p-inter. and HV10 are given.
Since the changes in mechanical and micromagnetic properties are related to the same microstructural effects, the next step is to investigate whether 3MA-X8 measurements can be directly correlated with microstructural features. Thus, the dependency of the 3MA-X8 feature W10Z on the precipitation density (which is given in area-%, see [12]) is shown in Figure 8a as a representative example for this correlation analysis. Although some reference values exhibit a high standard deviation, a rough correlation can be observed. By using a multidimensional approach, specifically Ridge regression, the precipitation density can be predicted based on the correlation between the 3MA-X8 features and the microscopically determined precipitation density (Figure 8b).
However, it has been observed that the Vickers hardness and the εa,p-inter. can be predicted more accurately than the precipitation density. One possible explanation for this phenomenon is that the regression approach for the prediction of Vickers hardness uses a large number of 3MA-X8 features, which already individually show a clear dependence on Vickers hardness. The individual 3MA-X8 features correlate better with the Vickers hardness than with the precipitation density, because the micromagnetic features have built up a combination of microstructural effects (see Section 2.4), which cannot be built up separately.
One potential explanation for this phenomenon is that for the prediction of the Vickers hardness, the regression approach uses a multitude of 3MA-X8 features that show a clear dependency on the Vickers hardness, influenced by both microstructural features, i.e., dislocation density and precipitation density, which are reflected together in the mechanical hardness.
This might be caused by the dependency of HV, εa,p-inter. and the micromagnetic measures on multiple microstructural features (e.g., precipitation density, dislocation density and structure, etc.). Consequently, these measures contain the integral response of all microstructural features and, hence, correlate well witch each other. In contrast, the precipitation density is only one microstructural feature and hence, a correlation with the integral measures derived from micromagnetic measurements must lead to deviations, even if the precipitation density is the dominating microstructural feature [12,13].

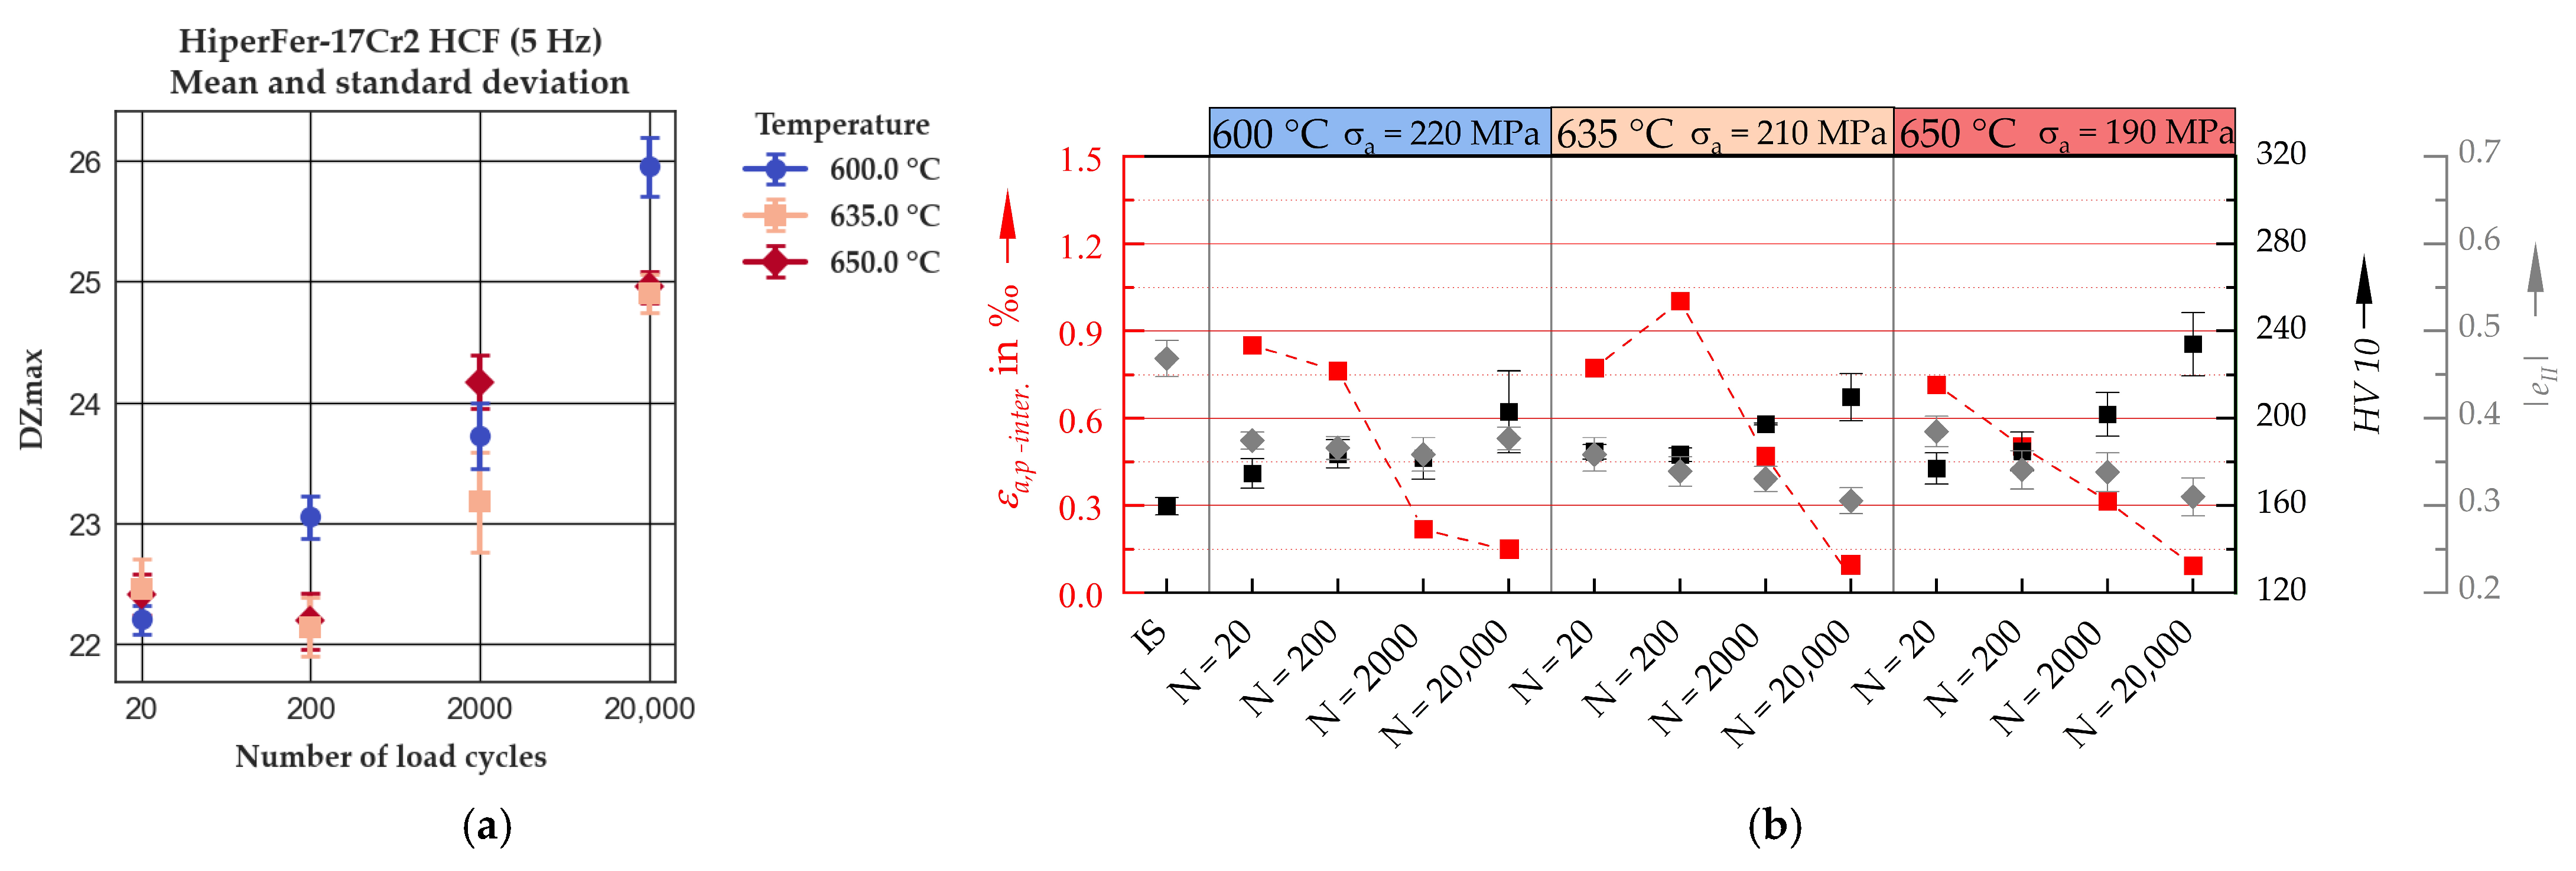
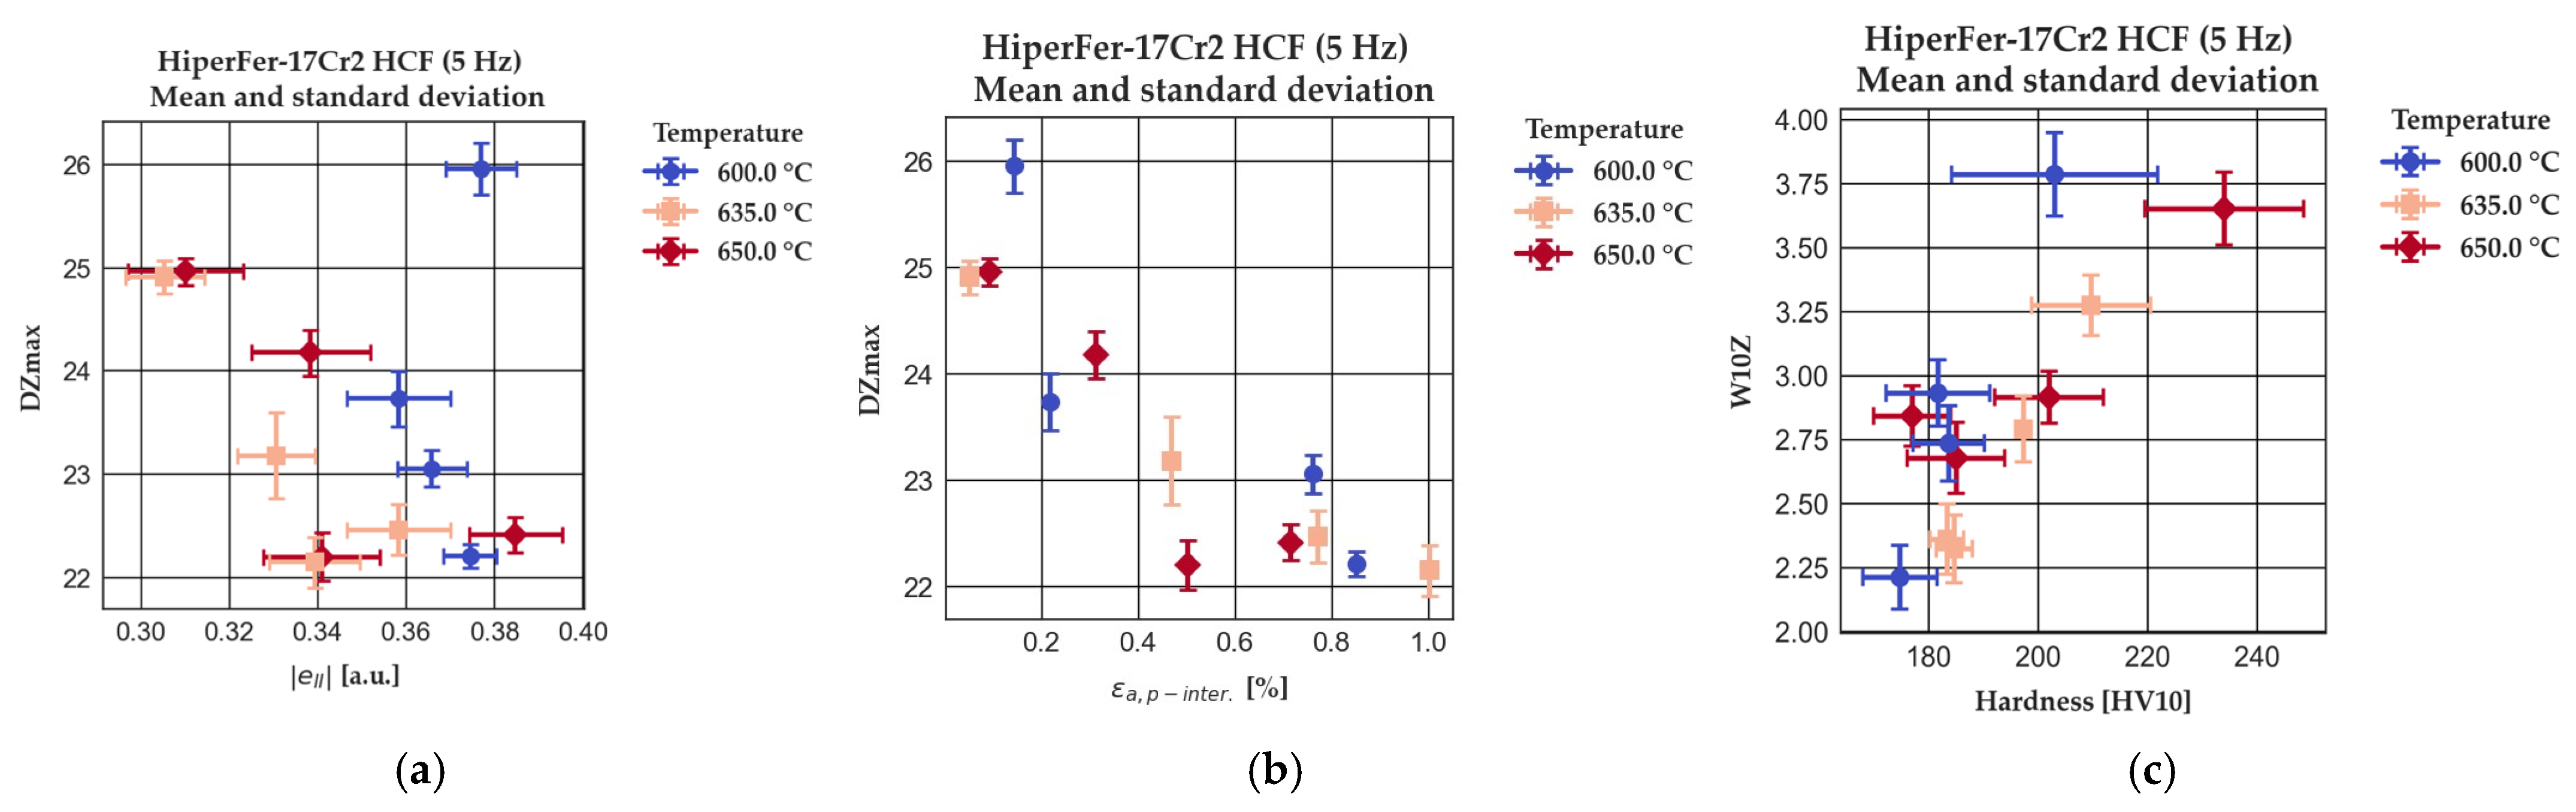
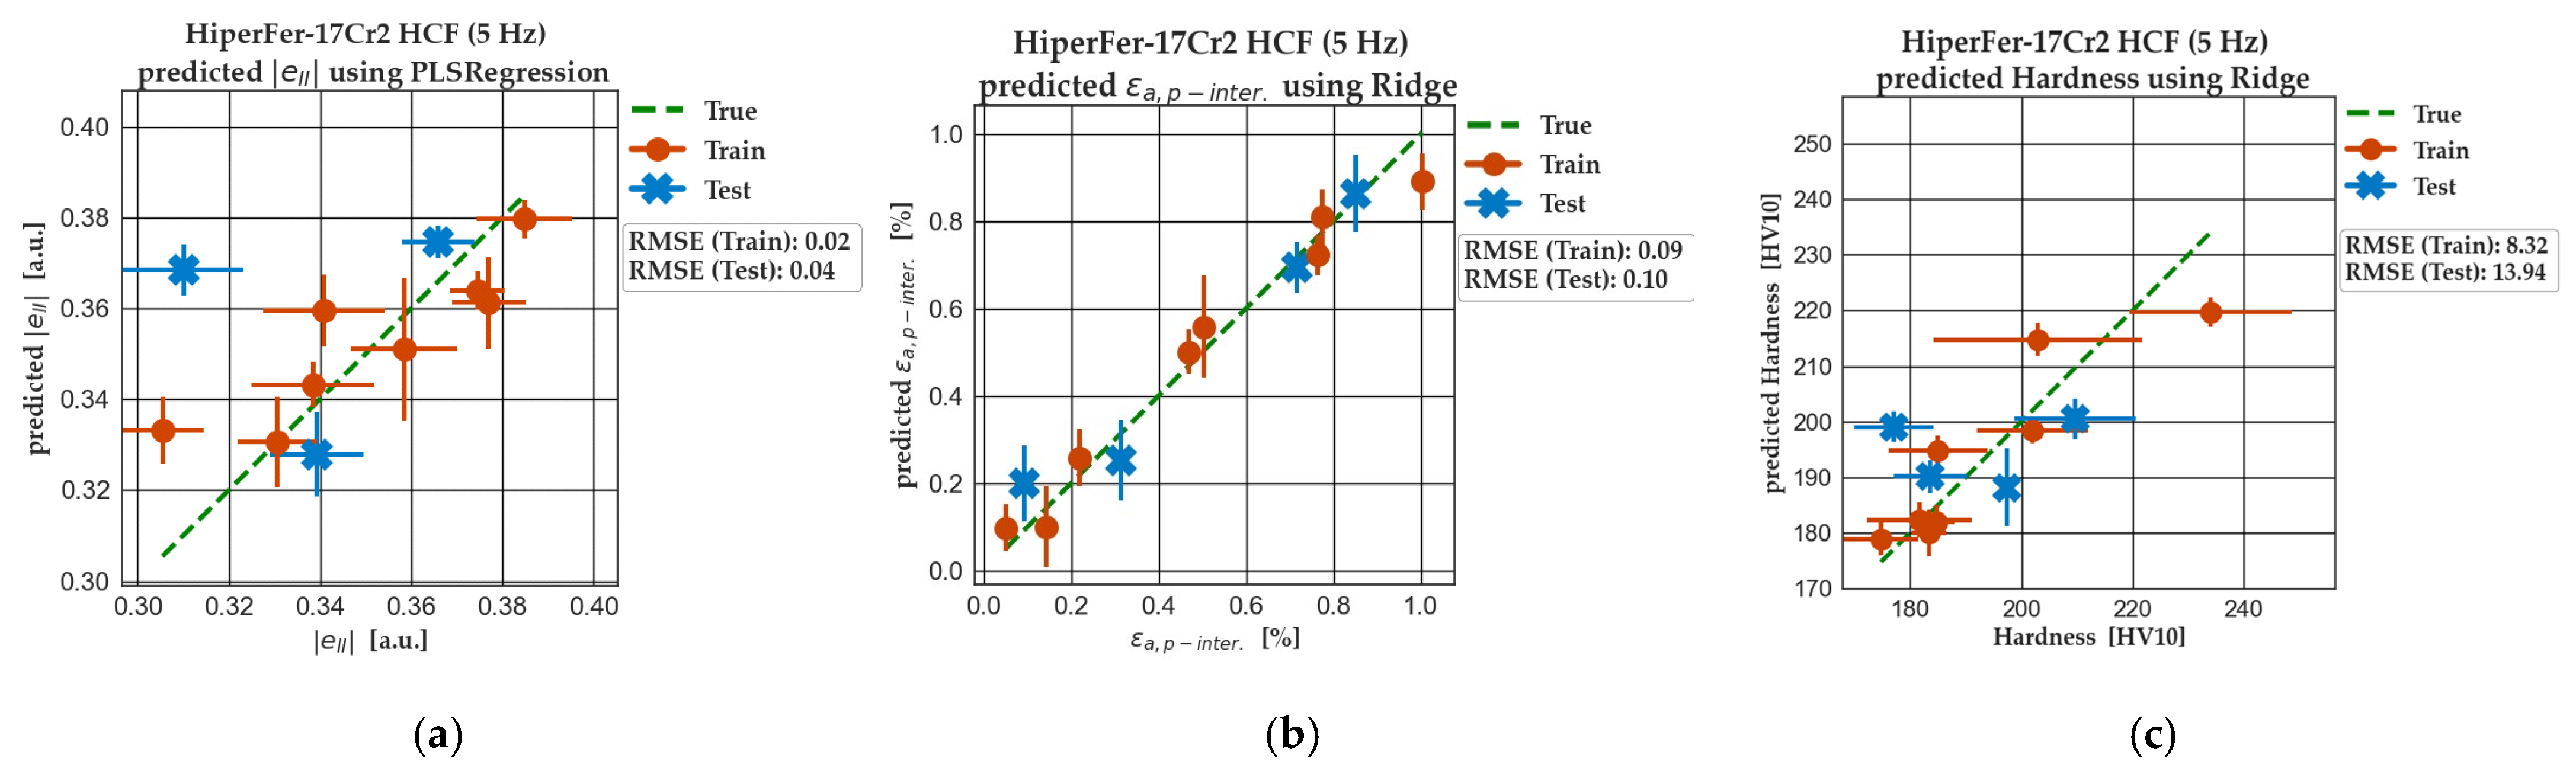
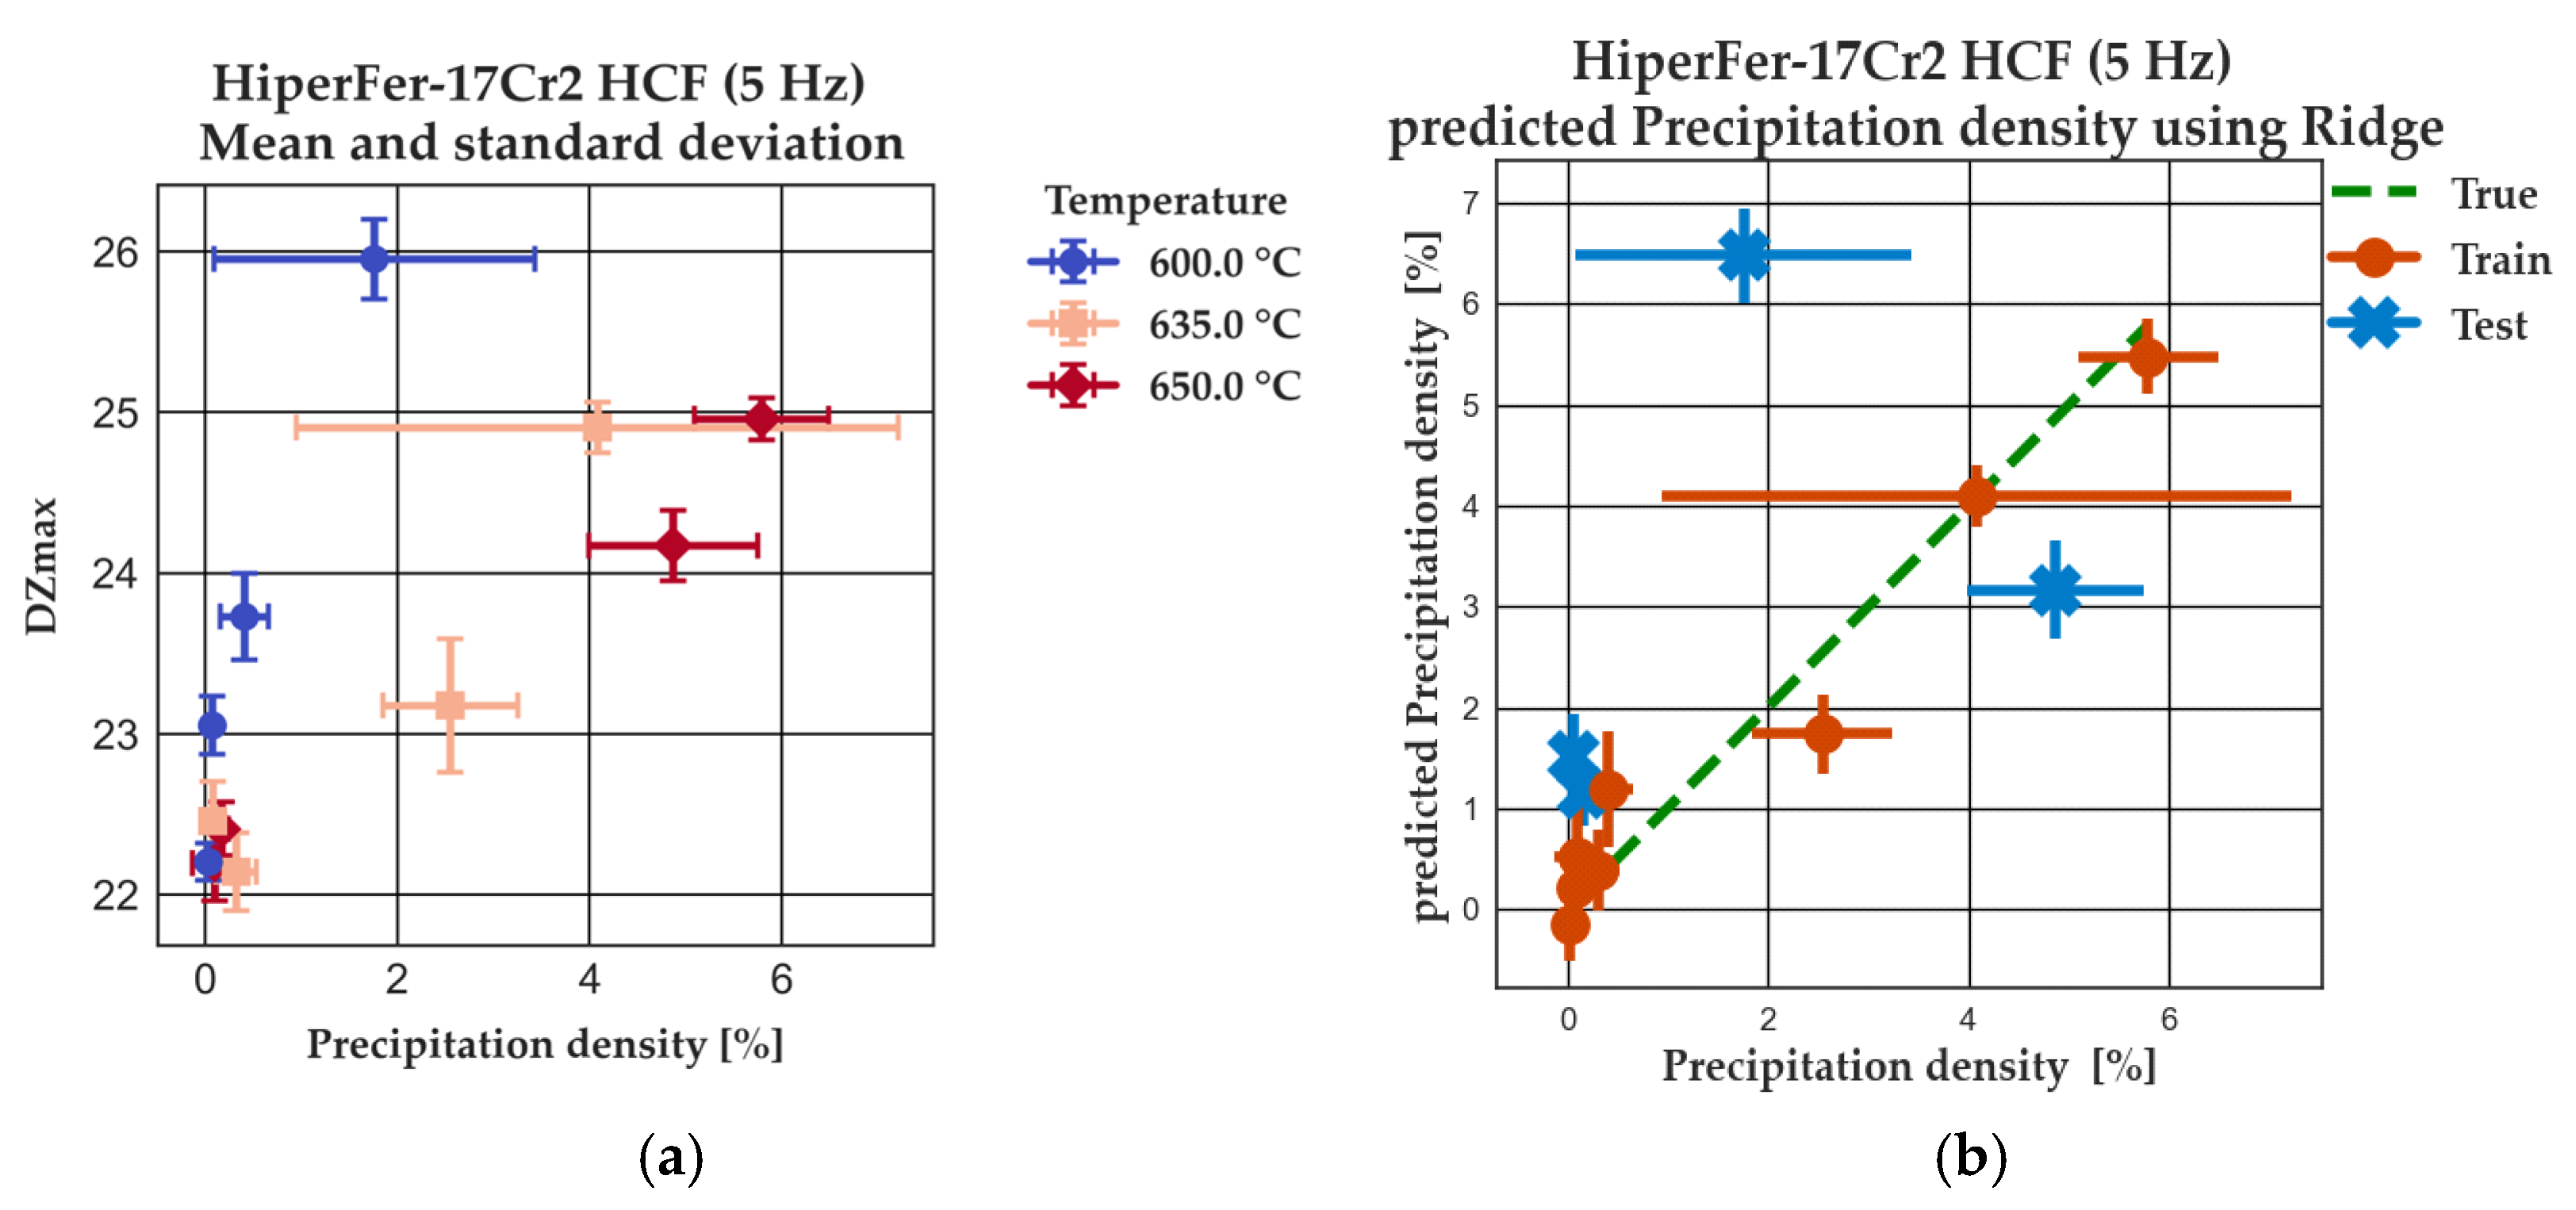
3.2.2. High-Cycle Fatigue (HCF)

The results obtained show a systematic effect of the HCF loading on the parameters derived from the eddy current and the incremental permeability analysis. As an example, Figure 9a illustrates the change in DZmax with an increasing number of HCF cycles (N) for all three temperatures, showing an increase in DZmax vs. N. Corresponding to that, generally εa,p-inter. decreases and HV10 increases with the number of load cycles (see Figure 9b). From the 20th cycle on, |eII| shows minimal changes at 600 °C, but a slight decrease at 635 °C and 650 °C with increasing N (see Figure 9b). However, for the HCF loading, εa,p-inter. and |eII| show a strong correlation, i.e., a decrease with increasing N, which indicates cyclic hardening.
To illustrate the comparison and correlation of the 3MA-X8 data with the mechanical measures, Figure 10 gives examples of the relationship between |eII|, εa,p-inter. and HV10 and different micromagnetic properties. For |eII|, at 650 °C, a correlation with DZmax can be observed, i.e., a decrease in DZmax with increasing |eII| (see Figure 10a), while the results obtained at 600 °C and 635 °C show no correlation. However, εa,p-inter. shows, at all temperatures, a strong correlation with DZmax, where increasing εa,p-inter. corresponds to decreasing DZmax (Figure 10b). Considering the hardness, W10Z increases with increasing HV10 at all temperatures.
In summary, the correlations observed for specimens loaded at the LCF conditions are clearer than for specimens loaded at the HCF conditions. This is assumed to be caused by the less pronounced microstructural changes during HCF loading due to the smaller plastic strain amplitude, and especially the lower plastic strain accumulation per time, which results in less pronounced Laves phase precipitation. Since the microstructural changes are more pronounced during LCF loading, their effect on mechanical and micromagnetic measures seems to be clearer, leading to stronger correlations.
Figure 11 displays the outcomes of the ML algorithms that are trained based on three mechanical parameters |eII|, εa,p-inter. and HV10. The dataset is again divided into training and test data using the same methodology as for LCF loading. As previously suspected from the single-feature correlation analysis, |eII| (see Figure 11a) does not exhibit a strong correlation, which corresponds to the results obtained from the specimens loaded at LCF conditions. Although the data obtained at one temperature loading show a favorable trend, the data obtained for the other temperatures complicate the model’s capacity to make an accurate prediction. For εa,p-inter. (see Figure 11b), a highly effective model is identified, capable of predicting values with a high degree of precision. In the case of the hardness prediction (see Figure 11c), the reference measurements demonstrate high standard deviations, which reduce the reliability of the model.
From Figure 12a and the results shown in [12], it is evident that there are considerable discrepancies in the precipitation density for the loaded conditions at the low temperature (600 °C) and higher temperatures (635 °C and 650 °C), i.e., a less pronounced precipitation occurs at 600 °C. Higher temperatures cause more pronounced precipitation due to enhanced diffusion processes, while recovery processes, especially regarding dislocation structure, are accelerated. In this context, it must be considered that the interaction between precipitates, dislocations and the domain walls is different depending on the precipitation structure. This introduces further complexity for accurate correlations between the microstructure and micromagnetic properties, which cannot be tackled using the limited database available so far.
Since the evolution of the precipitation morphology differs depending on the temperatures, which influences the correlations, a reasonable correlation between precipitation density [12] and DZmax can be observed when each temperature is analyzed separately (see Figure 12a). It is noteworthy that the trend exhibits a different inclination at 600 °C compared to 635 °C and 650 °C. However, the current statistical database is insufficient for training separate models for each temperature. Therefore, the model is trained on the dataset containing data corresponding to all temperatures. The different trends of the 3MA-X8 features for each temperature combined with the high potential for errors in the reference data result in unreliable outcomes (see Figure 12b).

4. Conclusions

The examination of the P91 specimens loaded in the LCF and HCF regime revealed comparably small changes in the material properties which could not be detected by means of micromagnetic techniques due to the insufficient database.
In contrast, the micromagnetic examination of specimens made of HiperFer-17Cr2 revealed that the changes in the mechanical properties induced in both of the considered loading conditions (LCF and HCF) could be detected via micromagnetic characterization. The human-driven correlations, which consisted of the identification of outliers, the recognition of trends and the initial exploration of correlation possibilities, indicated that several individual features derived from 3MA-X8 strongly correlated with the mechanical measures εa,p-inter. and hardness HV10. Consequently, the prediction of those mechanical properties based on the whole 3MA-X8 feature space was made possible by applying ML methods. The human-driven correlation of the features derived from 3MA-X8 with the mechanical parameter |eII| was found only at higher temperatures. Therefore, this mechanical parameter could not be accurately predicted when considering the 3MA-X8 feature space measured for all temperatures.
Precipitation density could be more accurately predicted in the case of HiperFer-17Cr2 loaded in the LCF than in the HCF regime. This was caused by the fact that in the case of specimens loaded at HCF conditions, the 3MA-X8 features showed different trends for different temperatures, while in the case of the specimens loaded at LCF conditions, one common trend could be observed for all temperatures. Based on the available data, the reason for this observation remains unclear and is an objective for future research.
Moreover, it was observed that the Vickers hardness can generally be predicted with better accuracy than the precipitation density. A possible explanation is that the micromagnetic features illustrated a mixture of different interaction mechanisms between the Bloch-wall movement and the microstructure imperfections: the foreign-body effect (in case of small precipitates), stress effect (in case of precipitates and dislocations) or stray field effect (in case of dislocations and big precipitates). Since the hardness was also dependent on the integral effects of these microstructural features, HV could be predicted well by means of micromagnetic measures, while the prediction of a single microstructural feature, i.e., the precipitation density, resulted in substantial deviations.
However, the first results obtained in this work indicated that there was a correlation between the micromagnetic features and the microstructural measures, which required a broader range of data to be used for accurate prediction models.

Author Contributions

Conceptualization, M.R. and B.B.; methodology, M.R., P.L. and K.S.; measurement and data evaluation, K.S., O.S. and P.L.; writing, M.R., P.L. and B.B.; supervision, B.B. and T.B.; project administration, M.R. and B.B.; funding acquisition, M.R. and T.B. All authors have read and agreed to the published version of the manuscript.

Funding

This research was funded by Federal Ministry for the environment, nature conservation, nuclear safety and consumer protection, grant number 1501649A.

Institutional Review Board Statement

Not applicable.

Informed Consent Statement

Not applicable.

Data Availability Statement

The datasets presented in this article are not readily available because, the data are part of an ongoing study.

Conflicts of Interest

The authors declare no conflicts of interest. The funders had no role in the design of the study; in the collection, analyses, or interpretation of data; in the writing of the manuscript; or in the decision to publish the results.

References

  1. Shankar, V.; Bauer, V.; Sandhya, R.; Mathew, M.D.; Christ, H.-J. Low cycle fatigue and thermo-mechanical fatigue behavior of modified 9Cr–1Mo ferritic steel at elevated temperatures. J. Nucl. Mater. 2012, 420, 23–30. [Google Scholar] [CrossRef]
  2. Nagesha, A.; Kannan, R.; Sastry, G.; Sandhya, R.; Singh, V.; Bhanu Sankara Rao, K.; Mathew, M.D. Isothermal and thermomechanical fatigue studies on a modified 9Cr–1Mo ferritic martensitic steel. Mater. Sci. Eng. A 2012, 554, 95–104. [Google Scholar] [CrossRef]
  3. Viswanathan, R.; Bakker, W. Materials for Ultrasupercritical Coal Power Plants—Boiler Materials: Part 1. J. Mater. Eng. Perform. 2001, 10, 81–95. [Google Scholar] [CrossRef]
  4. Aarab, F.; Kuhn, B. Development of Self-Passivating, High-Strength Ferritic Alloys for Concentrating Solar Power (CSP) and Thermal Energy Storage (TES) Applications. Energies 2023, 16, 4084. [Google Scholar] [CrossRef]
  5. Kuhn, B.; Talik, M.; Niewolak, L.; Zurek, J.; Hattendorf, H.; Ennis, P.J.; Quadakkers, W.J.; Beck, T.; Singheiser, L. Development of high chromium ferritic steels strengthened by intermetallic phases. Mater. Sci. Eng. A 2014, 594, 372–380. [Google Scholar] [CrossRef]
  6. Fischer, T.; Kuhn, B. Active Crack Obstruction Mechanisms in Crofer® 22H at 650 °C. Materials 2022, 15, 6280. [Google Scholar] [CrossRef]
  7. Weikert-Müller, M.; Weber, F.; Thieltges, S.; Smaga, M.; Silber, F.; Rudolph, J.; Bergholz, S.; Bechtgold, E. Development of a New Thermo-Mechanical Load and Fatigue Monitoring Approach Based on Electromagnetic Acoustic Transducers—EMUS-4-STRESS. In Volume 1: Codes & Standards, Proceedings of the ASME 2023 Pressure Vessels & Piping Conference, Atlanta, GA, USA, 16–21 July 2023; American Society of Mechanical Engineers: Atlanta, GA, USA, 2023; ISBN 978-0-7918-8744-8. [Google Scholar]
  8. Cullity, B.D.; Graham, C.D. Introduction to Magnetic Materials; Wiley: Hoboken, NJ, USA, 2008; ISBN 9780470386323. [Google Scholar] [CrossRef]
  9. Altpeter, I.; Becker, R.; Dobmann, G.; Kern, R.; Theiner, W.; Yashan, A. Robust solutions of inverse problems in electromagnetic non-destructive evaluation. Inverse Probl. 2002, 18, 1907–1921. [Google Scholar] [CrossRef]
  10. Takahashi, S.; Kobayashi, S.; Kikuchi, H.; Kamada, Y. Relationship between mechanical and magnetic properties in cold rolled low carbon steel. J. Appl. Phys. 2006, 100, 113908. [Google Scholar] [CrossRef]
  11. Valeske, B.; Tschuncky, R.; Leinenbach, F.; Osman, A.; Wei, Z.; Römer, F.; Koster, D.; Becker, K.; Schwender, T. Cognitive sensor systems for NDE 4.0: Technology, AI embedding, validation and qualification. TM—Tech. Messen 2022, 89, 253–277. [Google Scholar] [CrossRef]
  12. Lehner, P.; Blinn, B.; Fischer, T.; Kuhn, B.; Beck, T. Influence of the strain rate on the fatigue behaviour of fully ferritic high chromium steel and P91 steel at high temperatures. Int. J. Fatigue 2024, 186, 108388. [Google Scholar] [CrossRef]
  13. Lehner, P.; Blinn, B.; Beck, T. Changes in microstructure and mechanical properties of ferritic high chromium steel and P91 induced by isothermal fatigue. Mater. Sci. Eng. A 2025, 923, 147713. [Google Scholar] [CrossRef]
  14. Görzen, D.; Schwich, H.; Blinn, B.; Song, W.; Krupp, U.; Bleck, W.; Beck, T. Influence of Cu precipitates and C content on the defect tolerance of steels. Int. J. Fatigue 2021, 144, 106042. [Google Scholar] [CrossRef]
  15. Kramer, H.S.; Starke, P.; Klein, M.; Eifler, D. Cyclic hardness test PHYBALCHT—Short-time procedure to evaluate fatigue properties of metallic materials. Int. J. Fatigue 2014, 63, 78–84. [Google Scholar] [CrossRef]
  16. Schwich, H.; Görzen, D.; Blinn, B.; Beck, T.; Bleck, W. Characterization of the precipitation behavior and resulting mechanical properties of copper-alloyed ferritic steel. Mater. Sci. Eng. A 2020, 772, 138807. [Google Scholar] [CrossRef]
  17. Palanisamy, R. Review of ultrasonic methods for fatigue damage evaluation. Mater. Today Proc. 2020, 33, 3881–3885. [Google Scholar] [CrossRef]
  18. Palit Sagar, S.; Das, S.; Paridaa, N.; Bhattacharya, D.K. Non-Iinear ultrasonic technique to assess fatigue damage in structural steel. Scr. Mater. 2006, 55, 199–202. [Google Scholar] [CrossRef]
  19. Kellerer, E. Ultraschalllaminographie—Ein Neues Verfahren zur Früherkennung von Zeitstandschäden an Rohrbögen. Ph.D. Dissertation, TU München, München, Germany, 2001. [Google Scholar]
  20. Smaga, M.; Eifler, D. Fatigue Life Calculation of Metastable Austenitic Stainless Steels on the Basis of Magnetic Measurements. Mater. Test.—Mater. Compon. Technol. Appl. 2009, 51, 370–375. [Google Scholar] [CrossRef]
  21. Altpeter, I.; Tschuncky, R.; Hällen, K.; Dobmann, G.; Boller, C.; Sorich, A.; Smaga, M.; Eifler, D. Early Detection of Damage in Thermo-Cyclically Loaded Austenitic Materials; Studies in Applied Electromagnetics and Mechanics; IOS Press: Amsterdam, The Netherlands, 2012; Volume 36, pp. 130–139. ISBN 978-1-60750-967-7. [Google Scholar]
  22. Smaga, M.; Hahnenberger, F.; Sorich, A.; Eifler, D. Cyclic deformation behavior of austenitic steels in the temperature range −60 °C ≤ T ≤ 550 °C. Key Eng. Mater. 2011, 465, 439–442. [Google Scholar] [CrossRef]
  23. Sorich, A.; Smaga, M.; Eifler, D. Fatigue Monitoring of Austenitic Steels with Electromagnetic Acoustic Transducers (EMATs). Mater. Perform. Charact. 2015, 4, 263–274. [Google Scholar] [CrossRef]
  24. Yang, B.; Liaw, P.; Wang, H.; Jiang, L.; Huang, J.; Kuo, R.; Huang, J. Thermographic investigation of the fatigue behavior of reactor pressure vessel steels. Mater. Sci. Eng. 2001, 314A, 131–139. [Google Scholar] [CrossRef]
  25. Liu, J.; Strangwood, M.; Davis, C.L.; Parker, J. Non-destructive characterisation of N/Al level in P91 steels using electromagnetic sensors. Mater. Sci. Technol. 2015, 31, 1042–1050. [Google Scholar] [CrossRef]
  26. Mitra, A.; Mohapatra, J.N.; Swaminathan, J.; Ghosh, M.; Panda, A.K.; Ghosh, R.N. Magnetic evaluation of creep in modified 9Cr–1Mo steel. Scr. Mater. 2007, 57, 813–816. [Google Scholar] [CrossRef]
  27. Seeger, A. Moderne Probleme der Metallphysik; Springer: Berlin/Heidelberg, Germany, 1965; ISBN 978-3-642-87530-4. [Google Scholar]
  28. Wolter, B.; Gabi, Y.; Conrad, C. Nondestructive Testing with 3MA—An Overview of Principles and Applications. Appl. Sci. 2019, 9, 1068. [Google Scholar] [CrossRef]
  29. Zimmer, C.; Szielasko, K.; Rallabandi, Y.N.; Eichheimer, C.; Luke, M.; Youssef, S. Micromagnetic Microstructure- and Stress-Independent Materials Characterization in Reactor Safety Research. Materials 2021, 14, 5258. [Google Scholar] [CrossRef]
  30. Ankener, W.; Böttger, D.; Smaga, M.; Gabi, Y.; Straß, B.; Wolter, B.; Beck, T. Micromagnetic and Microstructural Characterization of Ferromagnetic Steels in Different Heat Treatment Conditions. Sensors 2022, 22, 4428. [Google Scholar] [CrossRef]
  31. Rabung, M.; Kopp, M.; Gasparics, A.; Vértesy, G.; Szenthe, I.; Uytdenhouwen, I.; Szielasko, K. Micromagnetic Characterization of Operation-Induced Damage in Charpy Specimens of RPV Steels. Appl. Sci. 2021, 11, 2917. [Google Scholar] [CrossRef]
  32. Vértesy, G.; Rabung, M.; Gasparics, A.; Uytdenhouwen, I.; Griffin, J.; Algernon, D.; Grönroos, S.; Rinta-Aho, J. Evaluation of the Embrittlement in Reactor Pressure-Vessel Steels Using a Hybrid Nondestructive Electromagnetic Testing and Evaluation Approach. Materials 2024, 17, 1106. [Google Scholar] [CrossRef]
  33. Szielasko, K.; Wolter, B.; Tschuncky, R.; Youssef, S. Micromagnetic materials characterization using machine learning. TM—Tech. Messen 2020, 87, 428–437. [Google Scholar] [CrossRef]
  34. Abe, F. Progress in Creep-Resistant Steels for High Efficiency Coal-Fired Power Plants. ASME J. Press. Vessel Technol. 2016, 138, 040804. [Google Scholar] [CrossRef]
  35. Altpeter, I.; Kern, R.; Höller, P. Characterization of Cementite in Steel and White Cast Iron by Micro-magnetic Nondestructive Methods. In Nondestructive Characterization of Materials III, Proceedings of the 3rd International Symposium Saarbrücken, FRG, Saarbrücken, Germany, 3–6 October 1988; Springer: Berlin/Heidelberg, Germany, 1989; pp. 606–613. [Google Scholar]
  36. García-Martín, J.; Gómez-Gil, J.; Vázquez-Sánchez, E. Non-destructive techniques based on eddy current testing. Sensors 2011, 11, 2525–2565. [Google Scholar] [CrossRef]
Figure 1. Geometry of investigated fatigue specimens with dimensions in mm.
Applsci 15 04969 g001
Figure 2. The micromagnetic multiparameter microstructure and stress analysis (3MA)-X8 system including probe, device and PC (a) and the probe, sample and fixture (b).
Applsci 15 04969 g002
Figure 3. Comparison of (a) the 3MA-X8 feature DZmax with (b) the mechanical measures, both as a function of the number of LCF cycles.
Applsci 15 04969 g003
Figure 4. Comparison of (a) the 3MA-X8 feature DZmax with (b) the mechanical measures, both as a function of the number of HCF cycles.
Applsci 15 04969 g004
Figure 5. Comparison of (a) the 3MA-X8 feature DZmax with (b) the mechanical features as a function of the number of LCF cycles for HiperFer-17Cr2.
Applsci 15 04969 g005
Figure 6. Correlation of different 3MA-X8 features with mechanical properties (a) |eII|, (b) εa,p-inter. and (c) HV10 for HiperFer-17Cr2 loaded under LCF conditions.
Applsci 15 04969 g006
Figure 7. Prediction of (a) |eII|, (b) εa,p-inter. and (c) HV10 for HiperFer-17Cr2 loaded under LCF conditions based on micromagnetic measurements.
Applsci 15 04969 g007
Figure 8. Correlation of the 3MA-X8 feature W10Z with the precipitation density (a) and the prediction of the precipitation density based on micromagnetic feature (b) for HiperFer-17Cr2 loaded under LCF conditions.
Applsci 15 04969 g008
Figure 9. Comparison of the 3MA-X8 feature DZmax (a) with the mechanical features (b) as a function of the number of HCF cycles of HiperFer-17Cr2.
Applsci 15 04969 g009
Figure 10. Correlation between the 3MA-X8 features DZmax and the mechanical properties |eII| (a) and εa,p-inter. (b) as well as between the 3MA feature W10Z and the Vickers hardness HV10 (c), for HiperFer-17Cr2 loaded under HCF conditions.
Applsci 15 04969 g010
Figure 11. Prediction of |eII| (a), εa,p-inter. (b) and HV10 (c) for HiperFer-17Cr2 loaded at HCF conditions.
Applsci 15 04969 g011
Figure 12. Correlation of the 3MA feature DZmax with precipitation density (a) and prediction of precipitation density based on micromagnetic features (b) of HiperFer-17Cr2 loaded under HCF conditions.
Applsci 15 04969 g012
Table 1. Chemical composition (in wt. %) of the investigated materials P91 and HiperFer-17Cr2.
MaterialCNCrMnSiNbWVNiMo
P910.1010.0438.80.440.360.07-0.210.260.91
HiperFer-17Cr2<0.01<0.0117.10.180.250.632.41---
Table 2. Loading conditions applied on the specimens of P91 and HiperFer-17Cr2.
Loading parameters/materialsf [Hz]0.05 (LCF)5 (HCF)
T [°C]600635650600635650
HiperFer-17Cr2σa [MPa]280260245220210190
Interruption after10; 40; 300; 2000 cycles20; 200; 2000; 20,000 cycles
P91σa [MPa]320280250310270260
Interruption after10; 300; 2000 cycles20; 2000; 20,000 cycles
Table 3. List of models used in this study.
Linear Models
Linear regression
Partial least squares regression
Ridge regression
Huber regression
Bayesian ridge regression
Disclaimer/Publisher’s Note: The statements, opinions and data contained in all publications are solely those of the individual author(s) and contributor(s) and not of MDPI and/or the editor(s). MDPI and/or the editor(s) disclaim responsibility for any injury to people or property resulting from any ideas, methods, instructions or products referred to in the content.

