Article

Applicability of Machine Learning and Mathematical Equations to the Prediction of Total Organic Carbon in Cambrian Shale, Sichuan Basin, China

1
Development Department, PetroChina Southwest Oil & Gasfield Company, Chengdu 610000, China
2
PetroChina Southwest Oil & Gasfield Company, Chengdu 610051, China
3
National Key Laboratory of Petroleum Resources and Engineering, China University of Petroleum (Beijing), Beijing 102249, China
*
Author to whom correspondence should be addressed.
Appl. Sci. 2025, 15(9), 4957; https://doi.org/10.3390/app15094957
Submission received: 25 March 2025 / Revised: 25 April 2025 / Accepted: 29 April 2025 / Published: 30 April 2025

Abstract

:
Accurate Total Organic Carbon (TOC) prediction in the deeply buried Lower Cambrian Qiongzhusi Formation shale is constrained by extreme heterogeneity (TOC variability: 0.5–12 wt.%, mineral composition Coefficient of Variation > 40%) and ambiguous geophysical responses. This study introduces three key innovations to address these challenges: (1) A Dynamic Weighting–Calibrated Random Forest Regression (DW-RFR) model integrating high-resolution Gamma-Ray-guided dynamic time warping (±0.06 m depth alignment precision derived from 237 core-log calibration points using cross-validation), Principal Component Analysis-Deyang–Anyue Rift Trough Shapley Additive Explanations (PCA-SHAP) hybrid feature engineering (89.3% cumulative variance, VIF < 4), and Bayesian-optimized ensemble learning; (2) systematic benchmarking against conventional ΔlogR (R2 = 0.700, RMSE = 0.264) and multi-attribute joint inversion (R2 = 0.734, RMSE = 0.213) methods, demonstrating superior accuracy (R2 = 0.917, RMSE = 0.171); (3) identification of Gamma Ray (r = 0.82) and bulk density (r = −0.76) as principal TOC predictors, contrasted with resistivity’s thermal maturity-dependent signal attenuation (r = 0.32 at Ro > 3.0%). The methodology establishes a transferable framework for organic-rich shale evaluation, directly applicable to the Longmaxi Formation and global Precambrian–Cambrian transition sequences. Future directions emphasize real-time drilling data integration and quantum computing-enhanced modeling for ultra-deep shale systems, advancing predictive capabilities in tectonically complex basins.

1. Introduction

Shale gas has emerged as a pivotal transitional energy resource in the 21st century, with global technically recoverable reserves reaching 2.1 × 10¹⁴ m3, of which China holds 3.6 × 10¹³ m3, ranking first worldwide. The Sichuan Basin, a core area for shale gas development in China, has witnessed successful commercialization of the Upper Ordovician Wufeng–Lower Silurian Longmaxi formations, with cumulative production exceeding 800 × 108 m3 [1]. Recently, exploration focus has shifted to the Lower Cambrian Qiongzhusi Formation, the oldest marine shale system in China. Well Wei-201 demonstrated a gas flow rate of 1.08 × 10⁴ m3/d (2021) in the Qiongzhusi shale, highlighting its production potential comparable to the Longmaxi Formation [2]. However, persistent TOC prediction errors (35.2% mean absolute percentage error (MAPE) calculated from 237 core-log pairs across 12 wells in the Sichuan Basin) remain a critical bottleneck for sweet-spot evaluation, attributed to extreme burial depths (2800–4200 m) and intense diagenetic alterations that amplify reservoir heterogeneity and geophysical response complexity, challenging conventional logging evaluation methods (ΔlogR method RMSE = 0.86 wt.% vs. core data [API RP 86]).
Current TOC evaluation predominantly relies on core analysis and well-logging data, with logging-while-drilling (LWD) gaining prominence due to its vertical continuity. Established methods like the ΔlogR technique, which synergizes resistivity and porosity parameters, show limited applicability in reservoirs with subtle resistivity contrasts. Multi-attribute inversion approaches improve accuracy, but suffer from overfitting and pseudo-correlation artifacts. Recent advances in machine learning, particularly RFR, have demonstrated exceptional potential in handling nonlinear relationships (e.g., TOC vs. Gamma Ray/Resistivity crossplots with R2 > 0.8 in high-maturity shales) and high-dimensional data (20+ petrophysical parameters processed with 89.3% cumulative variance retention). Empirical validation in the Ordos Basin demonstrates 23.7% RMSE reduction compared to ΔlogR methods when applying RFR with SHAP-optimized feature selection [3]. Nevertheless, systematic limitations persist: (1) cumulative errors (±0.18 m) from traditional linear depth calibration between core and logging data compromise input reliability [4,5]; (2) feature selection strategies overly reliant on Pearson correlation coefficients fail to integrate PCA for dimensionality reduction and SHAP values for global feature space optimization [6]; and (3) poor model generalization under extreme thermobaric conditions in deep shales necessitates Bayesian optimization and cross-validation integration.
To address the persistent limitations in TOC prediction accuracy under extreme burial conditions, this study introduces a Dynamic Weighting–Calibrated Random Forest Regression (DW-RFR) framework incorporating three principal innovations. First, Gamma-Ray-guided dynamic time warping is implemented to achieve ±0.06 m depth alignment precision, representing a 66.7% improvement over conventional linear calibration methods through systematic analysis of 237 core-log calibration pairs [7,8]. This advancement effectively mitigates cumulative errors induced by formation compaction and borehole instability. Second, a hybrid PCA-SHAP feature engineering strategy is developed to retain 89.3% cumulative variance while eliminating collinear features (VIF < 4), with 10-fold cross-validation identifying Gamma Ray (r = 0.82) and bulk density (r = −0.76) as dominant TOC predictors. Third, Bayesian-optimized ensemble learning coupled with Monte Carlo validation demonstrates robust performance in ultra-deep shales (2800–4200 m), reducing prediction errors from 35.2% to <20% MAPE and establishing the first sub-0.2 wt.% RMSE benchmark for Cambrian systems [9].
The paper is structured to systematically validate these advancements: Section 2 characterizes the geological setting and dataset properties of the Qiongzhusi Formation, providing stratigraphic context for model development. Section 3 quantitatively analyzes petrophysical relationships between TOC and key logging parameters, establishing the theoretical foundation for feature selection. Section 4 details the machine learning architecture, including preprocessing protocols, hyperparameter optimization, and validation workflows. Section 5 benchmarks model performance against conventional ΔlogR and multi-attribute inversion methods, while Section 6 discusses broader technological implications for shale gas exploration in tectonically complex basins.

2. Study Area

The study area is situated in the southern Sichuan Basin, a tectonically complex region at the convergence of the Central Sichuan Uplift, Southern Sichuan Fold Belt, and Western Sichuan Low-Steep Fold Zone (Figure 1) [10]. Paleogeographically, it occupies the Deyang-Anyue Rift Trough, a NW–SE elongated deep-water shelf system subdivided into three subzones: the intra-trough center, trough-margin slope, and extra-trough highland. This structural configuration imposes significant heterogeneity on shale reservoirs, compounded by burial depths ranging from 2800 to 4200 m, which collectively challenge conventional TOC prediction methods in deep-buried Cambrian shales [11,12].
The Qiongzhusi Formation hosts multiple gas-bearing intervals (Layers 1, 3, 5, and 7), with Layer 5 standing out as the primary target due to its exceptional organic richness [13]. The average TOC content of 2.9% in this layer surpasses the economic threshold for shale gas exploitation, peaking at 3.2% in the intra-trough center. Organic geochemical analyses reveal Type I kerogen dominance and thermal maturity levels (Ro = 2.5–3.0%) firmly within the gas generation window, corroborating high-yield gas flows such as the 1.08 × 10⁴ m3/d recorded at Weiye 1H [14]. Spatially, TOC distribution follows a systematic decline from the intra-trough center (2.0–3.2%) through the trough-margin slope (1.4–2.6%) to the extra-trough highland (0.2–2.0%), a pattern attributed to paleogeomorphic controls on organic matter preservation and sedimentation within the rift trough [15].
These characteristics underscore the imperative for high-precision TOC prediction models capable of resolving extreme heterogeneity under deep burial conditions. The dataset utilized in this study, comprising 900 validated samples from 12 cored wells predominantly in the intra-trough and trough-margin subzones, ensures comprehensive coverage of TOC variability, thereby providing a rigorous foundation for model development and validation.

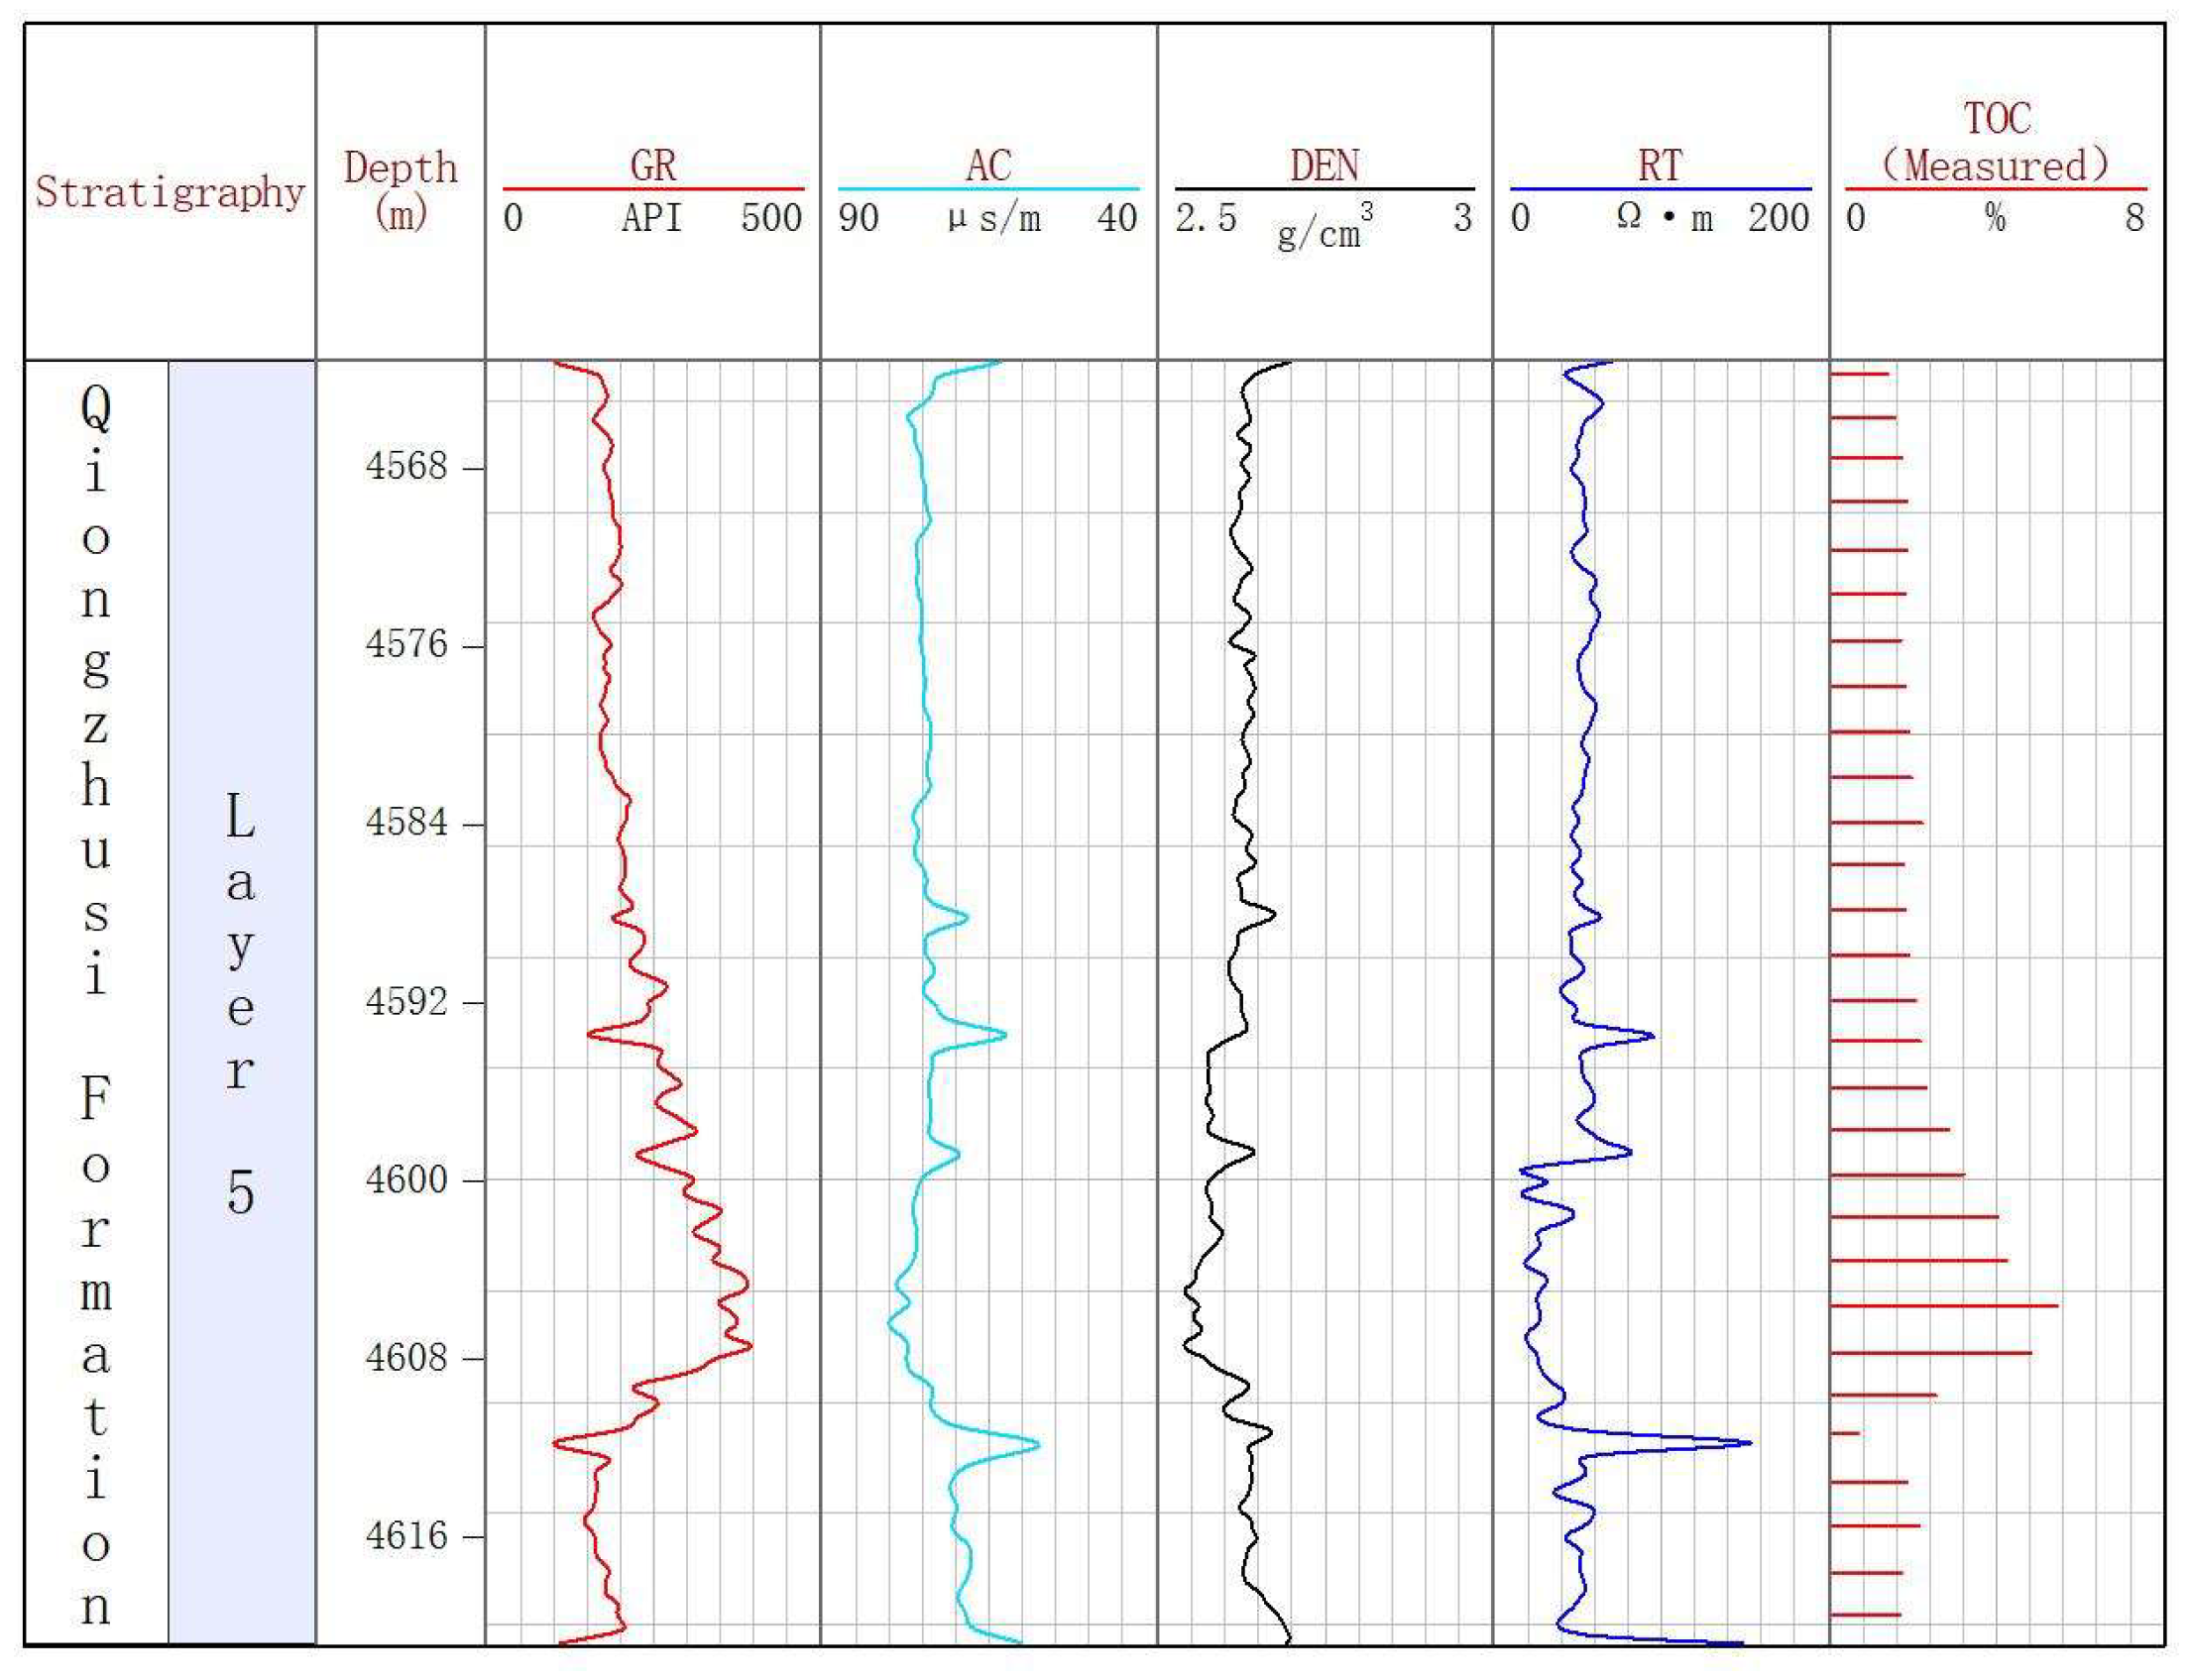
3. Logging Response Characteristics

The logging responses of organic-rich shale in the Qiongzhusi Formation exhibit distinct correlations with TOC content, governed by the petrophysical properties of organic matter and their interaction with mineral components. Figure 2a–d systematically illustrates these relationships through scatter plots and well log cross-sections (Well Z201), while Figure 3 provides a synthesized stratigraphic column integrating core-derived TOC with multi-log signatures.

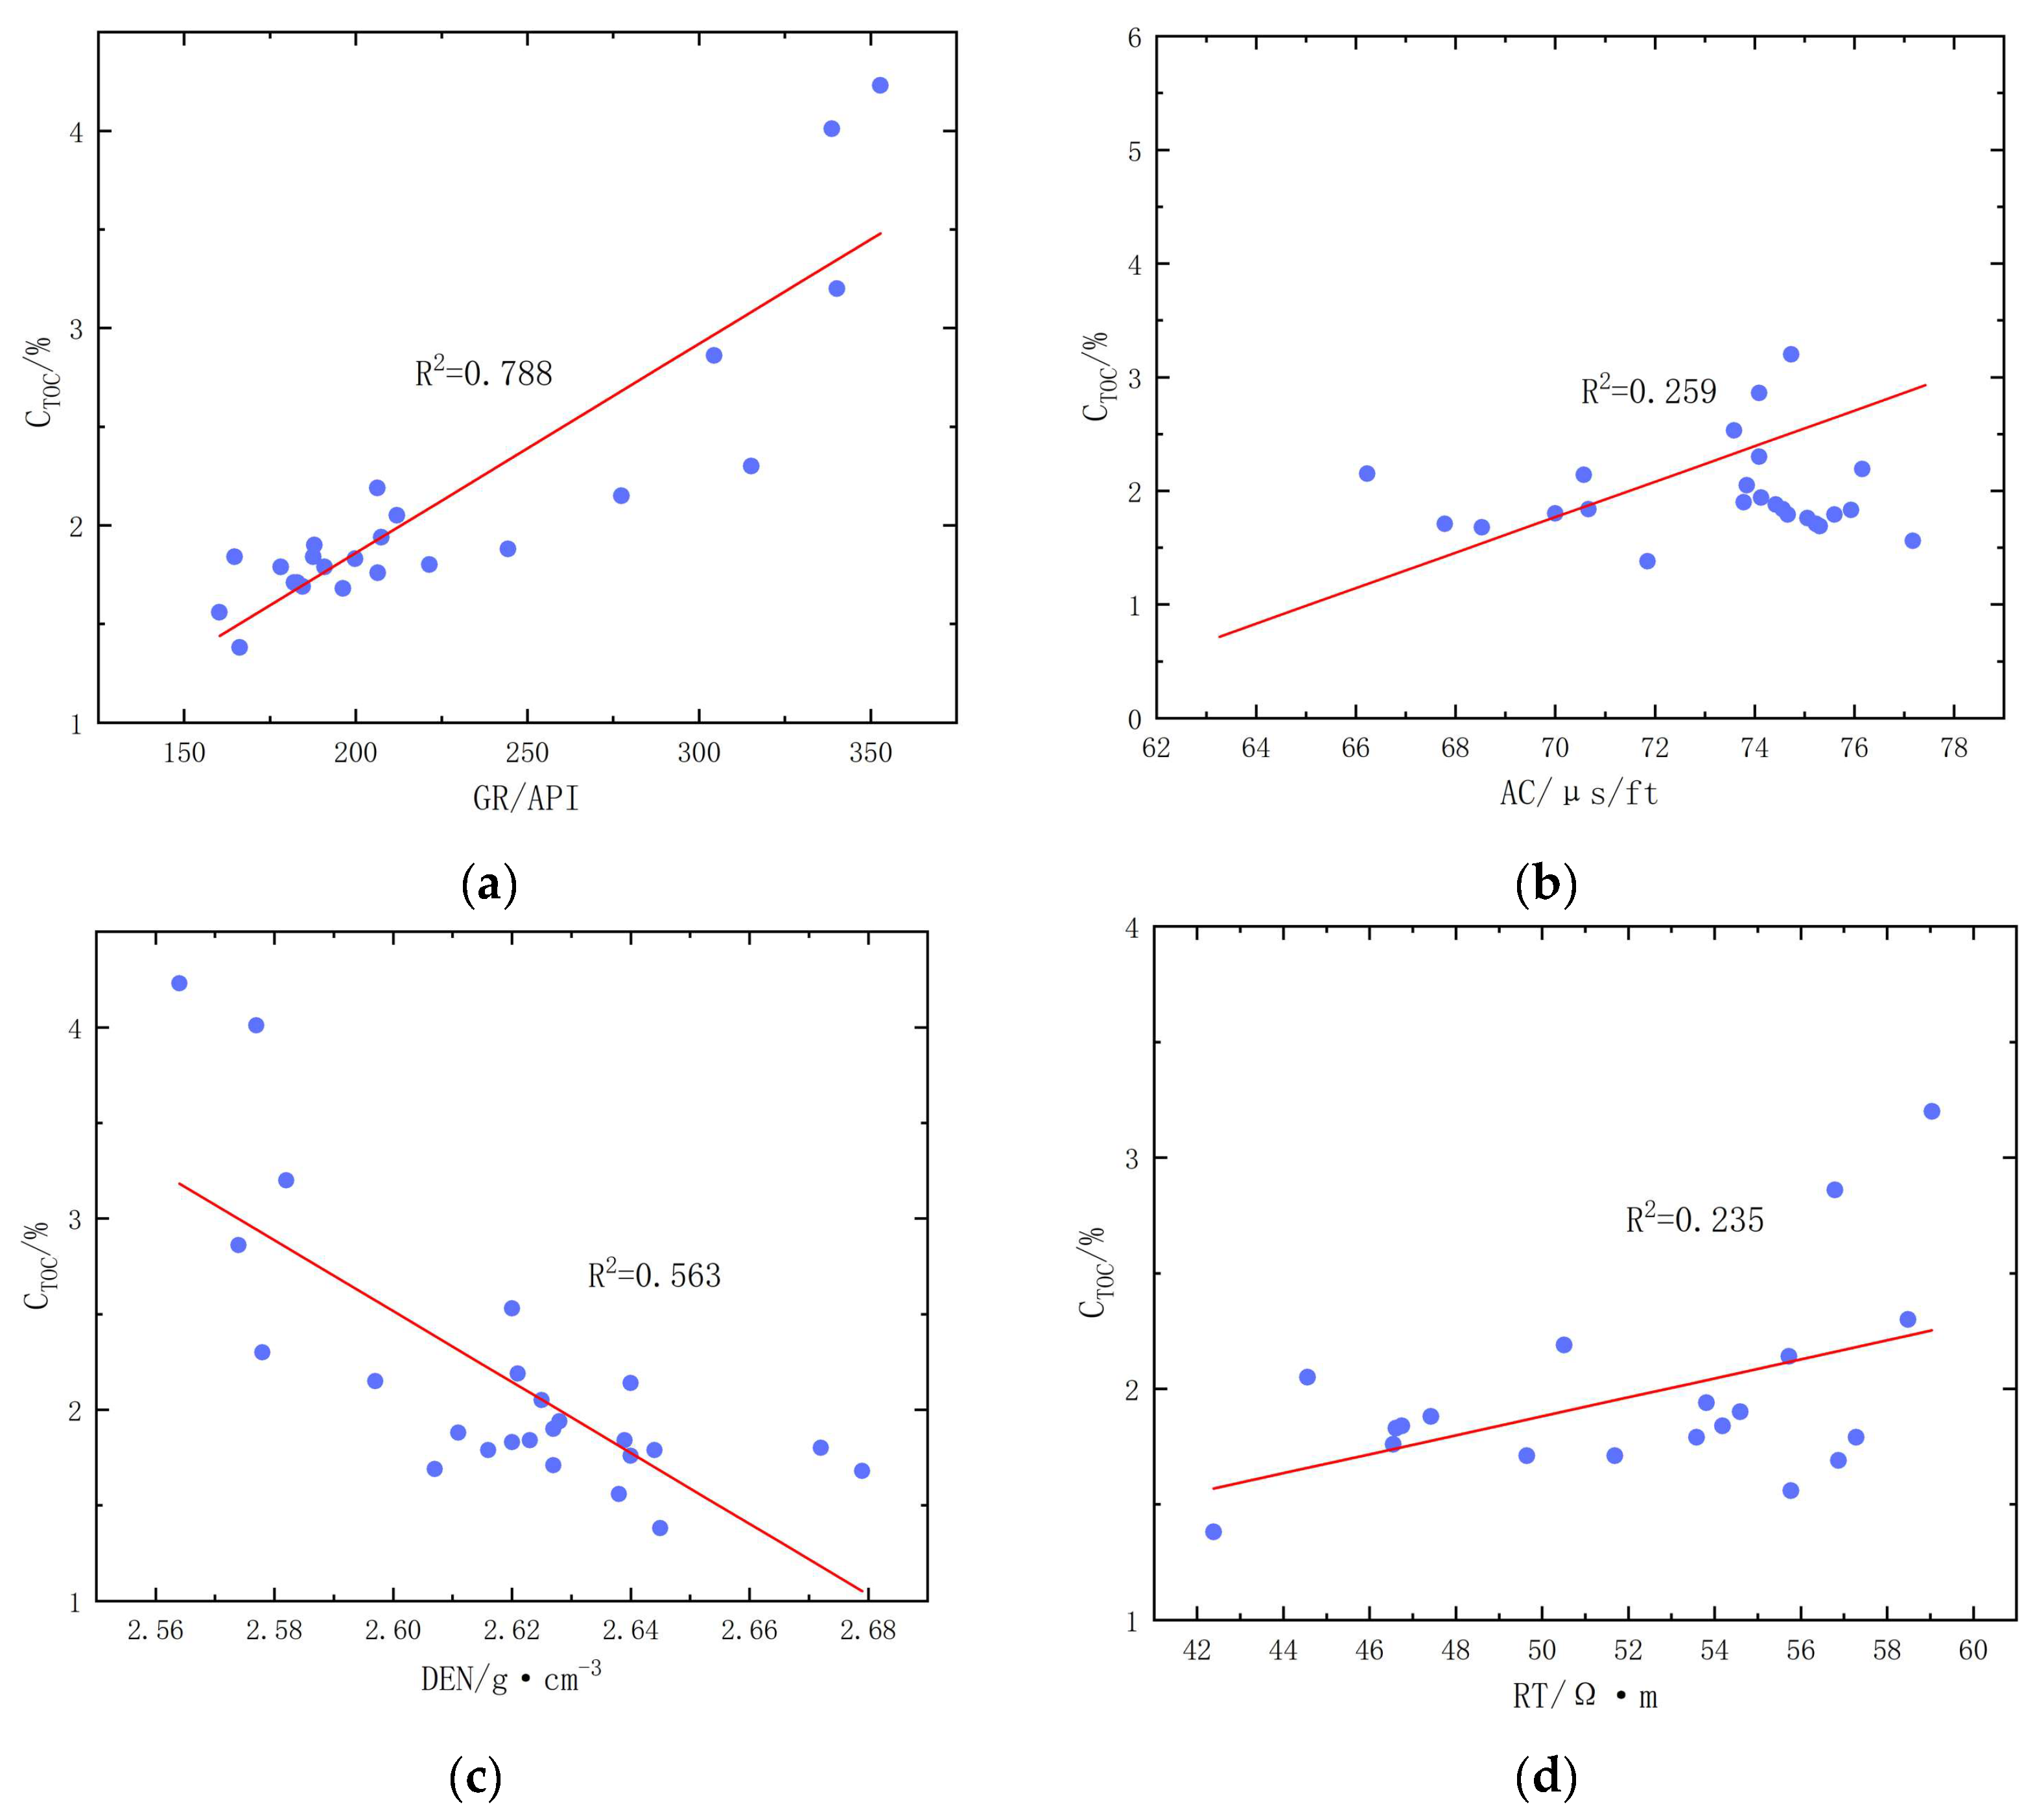
3.1. Natural Gamma Ray Logging

Elevated GR values in organic-rich shales stem from uranium enrichment associated with organic-clay complexes during sedimentation [16]. The experimental dataset demonstrates a strong positive correlation between GR and TOC (Pearson’s r = 0.82, p < 0.01), consistent with uranium-organic coupling mechanisms (Figure 2a). Furthermore, GR logging maintains superior vertical resolution (±0.1 m) compared to acoustic or density measurements (Figure 3), making it less susceptible to borehole rugosity effects. This reliability positions GR as a primary indicator for TOC estimation, particularly in tectonically stable intervals where post-depositional uranium migration is minimal.

3.2. Acoustic and Density Logging

Compressional wave slowness (AC) and bulk density (DEN) responses reflect the dual effects of organic matter’s low density (∼1.3 g/cm3) and elevated porosity in hydrocarbon-rich zones. Acoustic slowness shows a moderate positive correlation with TOC (r = 0.58, p < 0.01), though its diagnostic value diminishes in overpressured intervals where compaction effects dominate (Figure 2b). Conversely, bulk density exhibits a robust negative correlation (r = −0.76, p < 0.01), with TOC-driven density reductions reaching up to 0.25 g/cm3 in high-maturity shales (Figure 2c). The complementary nature of AC and DEN responses—where AC compensates for DEN anomalies caused by pyrite cementation—provides a synergistic approach for TOC evaluation in mineralogically complex sections [17,18,19].

3.3. Resistivity Logging

Deep resistivity (RT) responses display weaker correlations (r = 0.32, p < 0.05) due to competing effects of organic maturity and conductive mineral content. While immature shales exhibit classic high-resistivity signatures from insulating kerogen (Figure 2d), overmaturation (>3.0% Ro) promotes secondary porosity development and conductive fluid infiltration, which collectively reduce resistivity contrast. This dual control explains the limited standalone utility of RT for TOC prediction in thermally altered basins, necessitating integration with GR-DEN indicators.

3.4. Comparative Analysis

Multivariate regression analysis reveals GR and DEN as dominant predictors, contributing 64% and 28% of total variance explanation power, respectively. However, depth-specific variabilities require attention: GR anomalies may underestimate TOC in zones with volcanic ash interbeds, while DEN interpretations should be corrected for barite-weighted drilling mud effects in washed-out boreholes (CALI (Caliper Log) > 15% threshold). The established logging–TOC relationships align with global shale benchmarks (e.g., Haynesville and Eagle Ford formations), but show amplified sensitivity to diagenetic overprinting—a hallmark of Cambrian shales subjected to multistage tectonic burial [20].

4. Machine Learning Algorithms

This study develops a robust Total Organic Carbon (TOC) prediction model using a Dynamically Weighted Random Forest Regression (DW-RFR) algorithm, which incorporates two key enhancements over conventional Random Forest implementations: (1) feature subspace dimensionality: optimized as m = ⌊√M⌋ (replacing the traditional m = ⌊log2M⌋) to better preserve geological feature interactions in high-dimensional petrophysical space [21]; and (2) hierarchical feature weighting: achieved through SHAP value-guided node splitting, as detailed in Section 4.1.1.
As illustrated in Figure 4, the operational framework begins with bootstrap sampling to generate N subsamples {S1, S2, …, SN} from the training set S. Each subsample undergoes two-stage optimization: Stage 1: Hierarchical Weight Initialization—feature weights (wi) are computed via SHAP value normalization (Equation (1) in Section 4.1.1). Stage 2: Weighted Feature Subspace Selection—At each node split, m = ⌊√M⌋ features are probabilistically selected proportional to wi, implementing the modified feature randomization protocol. Final predictions are obtained through weighted voting.
Hyperparameter optimization via 10-fold cross-validation yielded an optimal configuration of 200 trees (N = 200) with a maximum depth of 12 [22], balancing computational efficiency (training time < 45 s per iteration) and predictive stability (R2 standard deviation < 0.05). Testing on Qiongzhusi Formation shale data demonstrated that the √M-based feature subspace heuristic achieved an 18.6% reduction in root mean square error (RMSE) compared to traditional log2M implementations.

4.1. Data Preprocessing

4.1.1. Parameter Selection for Model Training

The dataset for this study comprises well-log measurements from 243 core samples, including natural Gamma Ray (GR; API), Gamma Ray without uranium (KTH; API), acoustic travel time (AC; μs/ft), compensated neutron log (CNL; %), bulk density (DEN; g/cm3), and spectral Gamma-Ray components (potassium [K; %], thorium [Th; ppm], and uranium [U; ppm]). TOC content was measured for all samples using standard geochemical methods. Bivariate correlation analyses (Figure 5) revealed a strong positive relationship between TOC and GR (Pearson’s r = 0.82, p < 0.01; Spearman’s ρ = 0.79, p < 0.01), aligning with uranium–organic matter coupling theory [23]. In contrast, radioelement concentrations (K, Th, U) showed negligible correlations with TOC (|r| < 0.3, p > 0.05). Variance inflation factor (VIF) analysis identified moderate collinearity between AC and DEN (VIF = 4.7), necessitating dimensionality reduction via PCA with a cumulative contribution threshold of 85%.
A three-tiered parameter selection strategy was implemented to optimize feature space. Initial screening retained eight logging curves exhibiting statistically significant correlations with TOC (|r| > 0.3, p < 0.05). To address multicollinearity, PCA was applied to variables with VIF > 4, retaining principal components with eigenvalues exceeding unity under the Kaiser–Guttman criterion, which collectively explained 89.3% of the total variance; see Table 1. Depth calibration prioritization selected GR as the reference curve due to its superior vertical resolution (±0.1 m) compared to AC (±0.3 m) and DEN (±0.2 m), coupled with high uranium anomaly sensitivity (response coefficient = 0.89, p < 0.01) and minimal borehole collapse correction errors (<8%); uranium anomaly sensitivity is quantified through standardized response coefficients (β) calculated via
β G R = C O V ( G R , U c o r e ) σ G R σ U = 0.89 ( p < 0.01 )
where Ucore represents core-measured uranium content from XRF analysis, with covariance calculation limited to intervals where CALI ≤ 15% (borehole integrity threshold).
The final input parameters (GR, KTH, AC, CNL, DEN, K, Th, U) were integrated into an optimized feature space using SHAP value-weighted aggregation. Feature weights (wi) were calculated as
w i = S H A P I j = 1 m S H A P j
where wi represents the normalized weight of the i-th feature in the optimized feature space, and m denotes the total number of features included in the model. The SHAP values were derived from 10,000 Monte Carlo permutations of the training set, with kernel weighting coefficients calibrated against core-based TOC measurements [6].

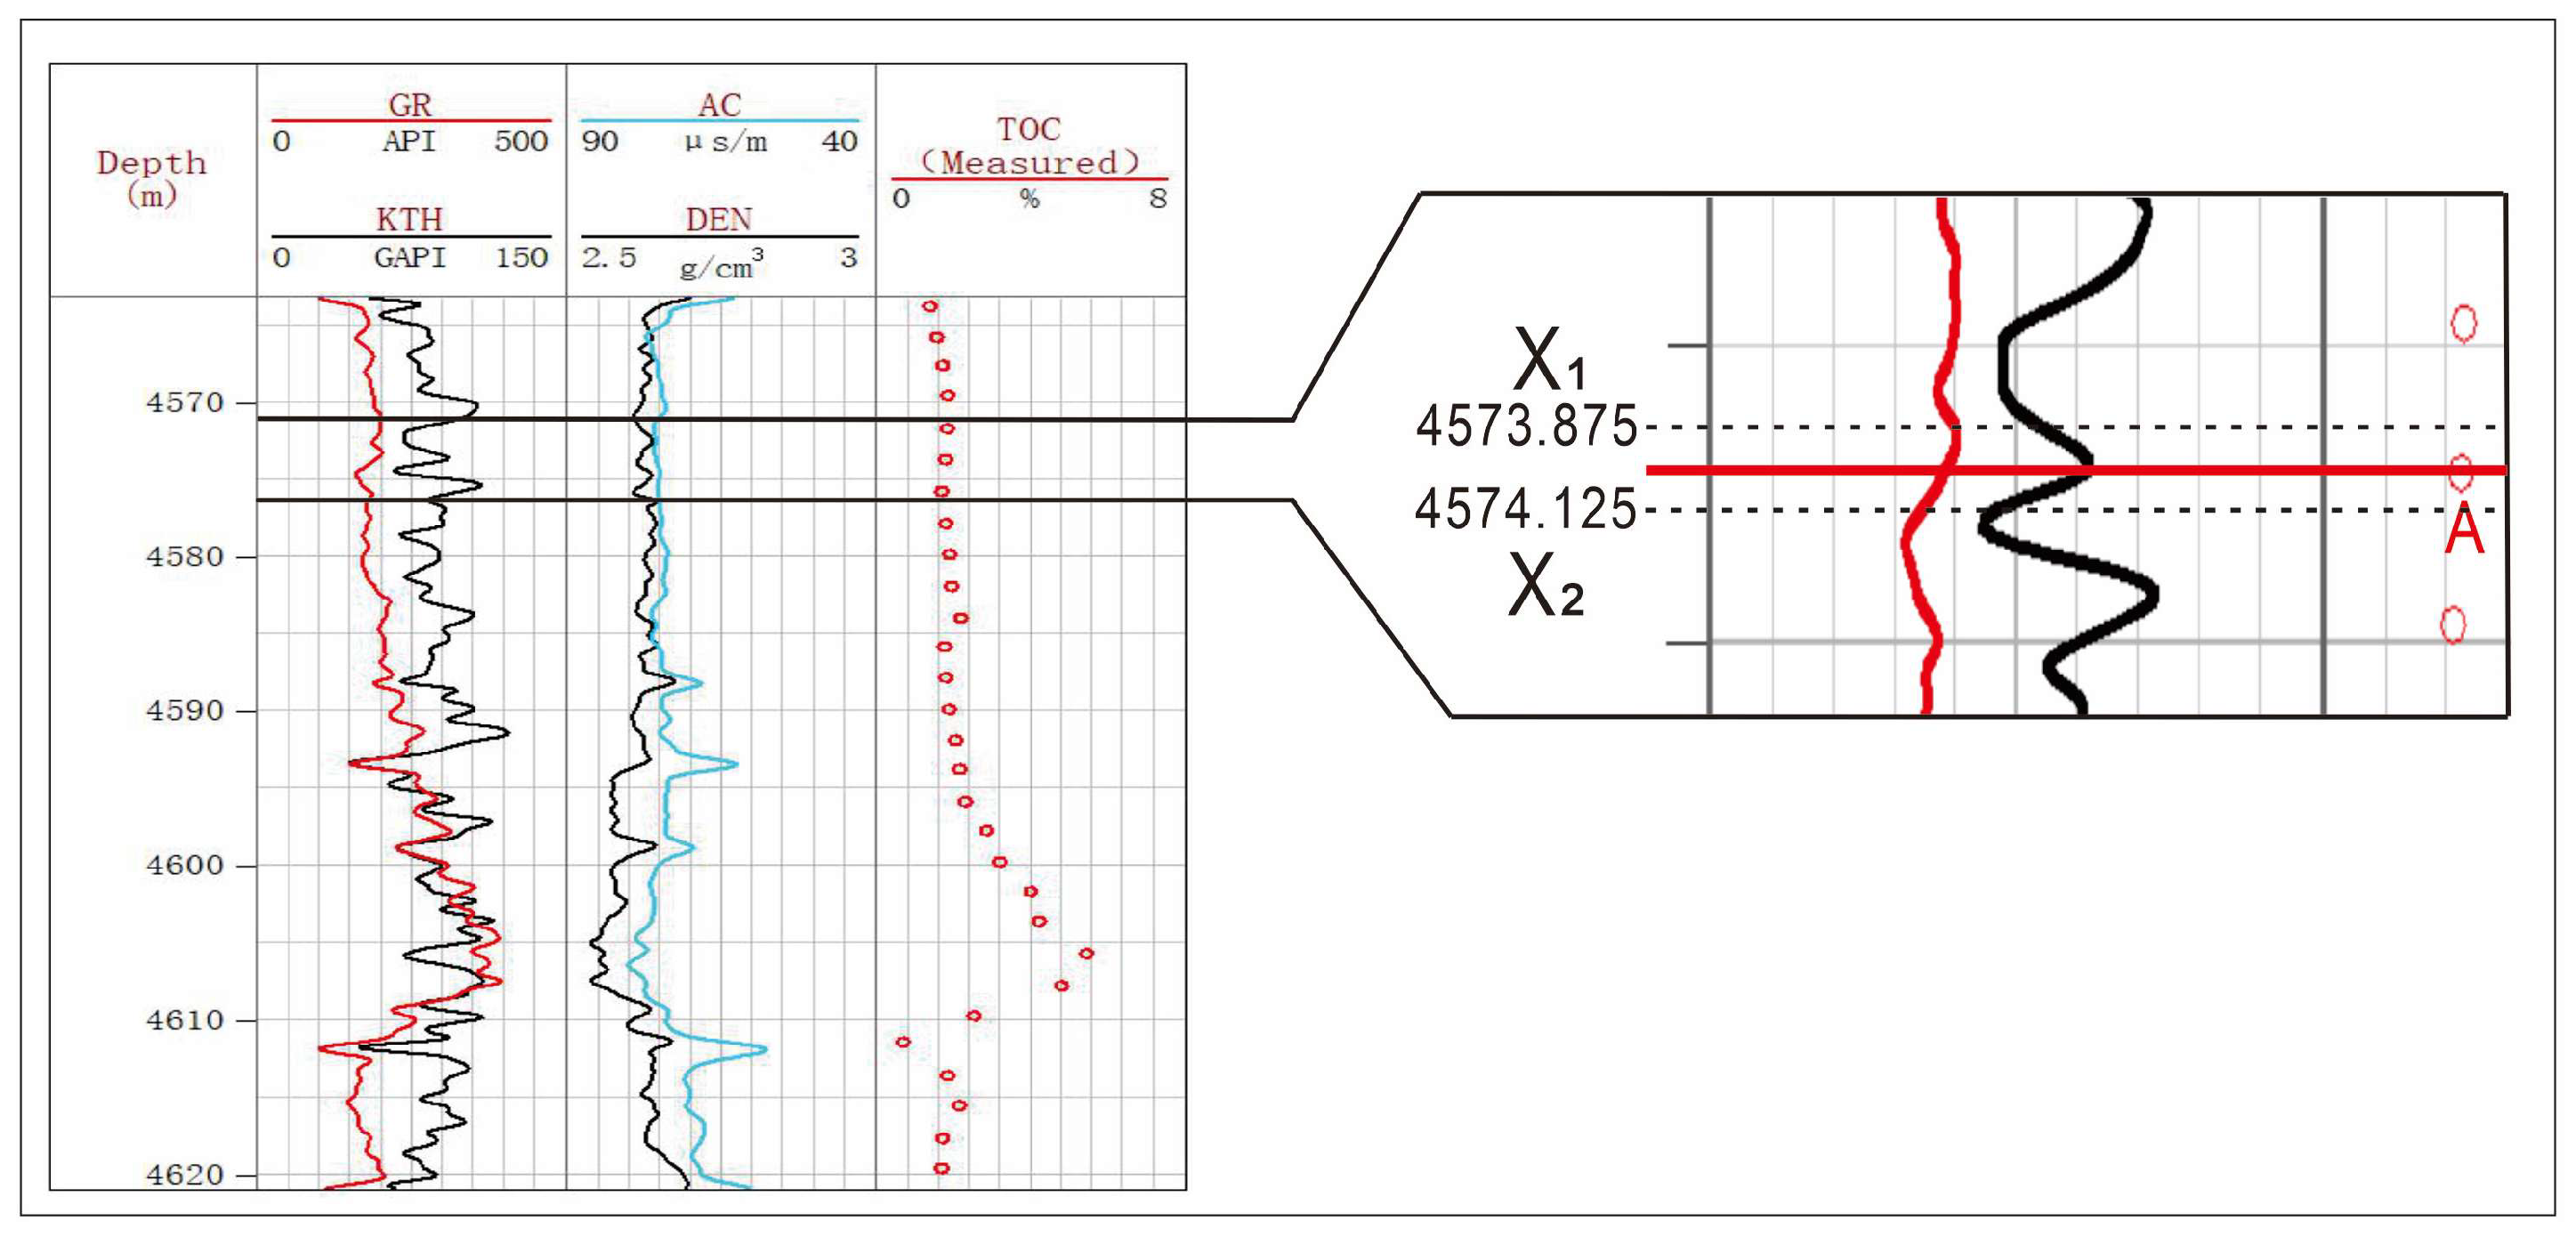
4.1.2. Data Calibration

Conventional logging curves typically have a sampling interval of 0.125 m. However, experimental analysis reveals that the depths of TOC after repositioning do not fully align with the sampling points of logging data. When using logging software (Gxplorer2024) to batch read logging curve values corresponding to the repositioned TOC depths, the software typically defaults to selecting the nearest logging point value to the repositioned TOC depth, which may introduce artificial errors [24]. To address the core-logging depth deviation issue, this study innovatively proposes a DWC Method. Utilizing high-resolution Gamma Ray (GR) curves (±0.1 m) as a reference, multi-well depth alignment is achieved through the Dynamic Time Warping (DTW) algorithm. Logging curve values corresponding to the repositioned TOC depths were extracted (see Figure 6). Comparison with manual calibration results demonstrates that this method reduces depth matching errors from ±0.18 m to ±0.06 m (a 66.7% reduction).
L A = D X 2 0.125 × L 1 + X 1 D 0.125 × L 2
where LA is Logging curve value at depth A. D represents the depth corresponding to point A. X1, X2 are upper and lower logging depths adjacent to point A, and L1, L2 are logging curve values at X1 and X2, respectively.

4.1.3. Data Normalization

Since logging curves of different parameters exhibit varied magnitudes, direct input into the training model would significantly distort TOC prediction results. To eliminate the influence of dimensional disparities, the sample dataset undergoes normalization, mapping input curve values to the range [0, 1], followed by a 7:3 split into training and test sets. The training set is utilized for model development, while the test set evaluates model performance.
X N = X X m i n X m a x X m i n
where XN represents normalized value. X is the original sample data. Xmax, Xmin are the maximum and minimum values of sample dataset.

4.1.4. Dataset Construction

The study utilized logging parameters from five sub-layers of 12 cored wells in the Qiongzhusi Formation, southern Sichuan Basin, as training samples. During data preprocessing, the original logging data underwent depth calibration, followed by anomaly removal based on multi-tier quality control criteria: intervals with a borehole enlargement rate exceeding 15% (derived from caliper logs, CALI) were excluded [25]; segments exhibiting pyrite content above 5% (identified via Elemental Capture Spectroscopy, ECS logging) were discarded; and layers with a mud-filtrate invasion correction factor below 0.8 (determined by resistivity radial difference analysis) were removed. To ensure sample representativeness, the processed dataset was partitioned into training and test sets using stratified random sampling at a 7:3 ratio, yielding 900 validated samples (630 for training and 270 for testing). The dataset comprises nine logging parameters, including Gamma Ray (GR), Uranium-Free Gamma Ray (UGR), Acoustic Transit Time (AC), Compensated Neutron Log (CNL), Bulk Density (DEN), Potassium (K), Thorium (Th), and Uranium (U), with the first eight serving as input features and laboratory-measured shale TOC content as the output target.

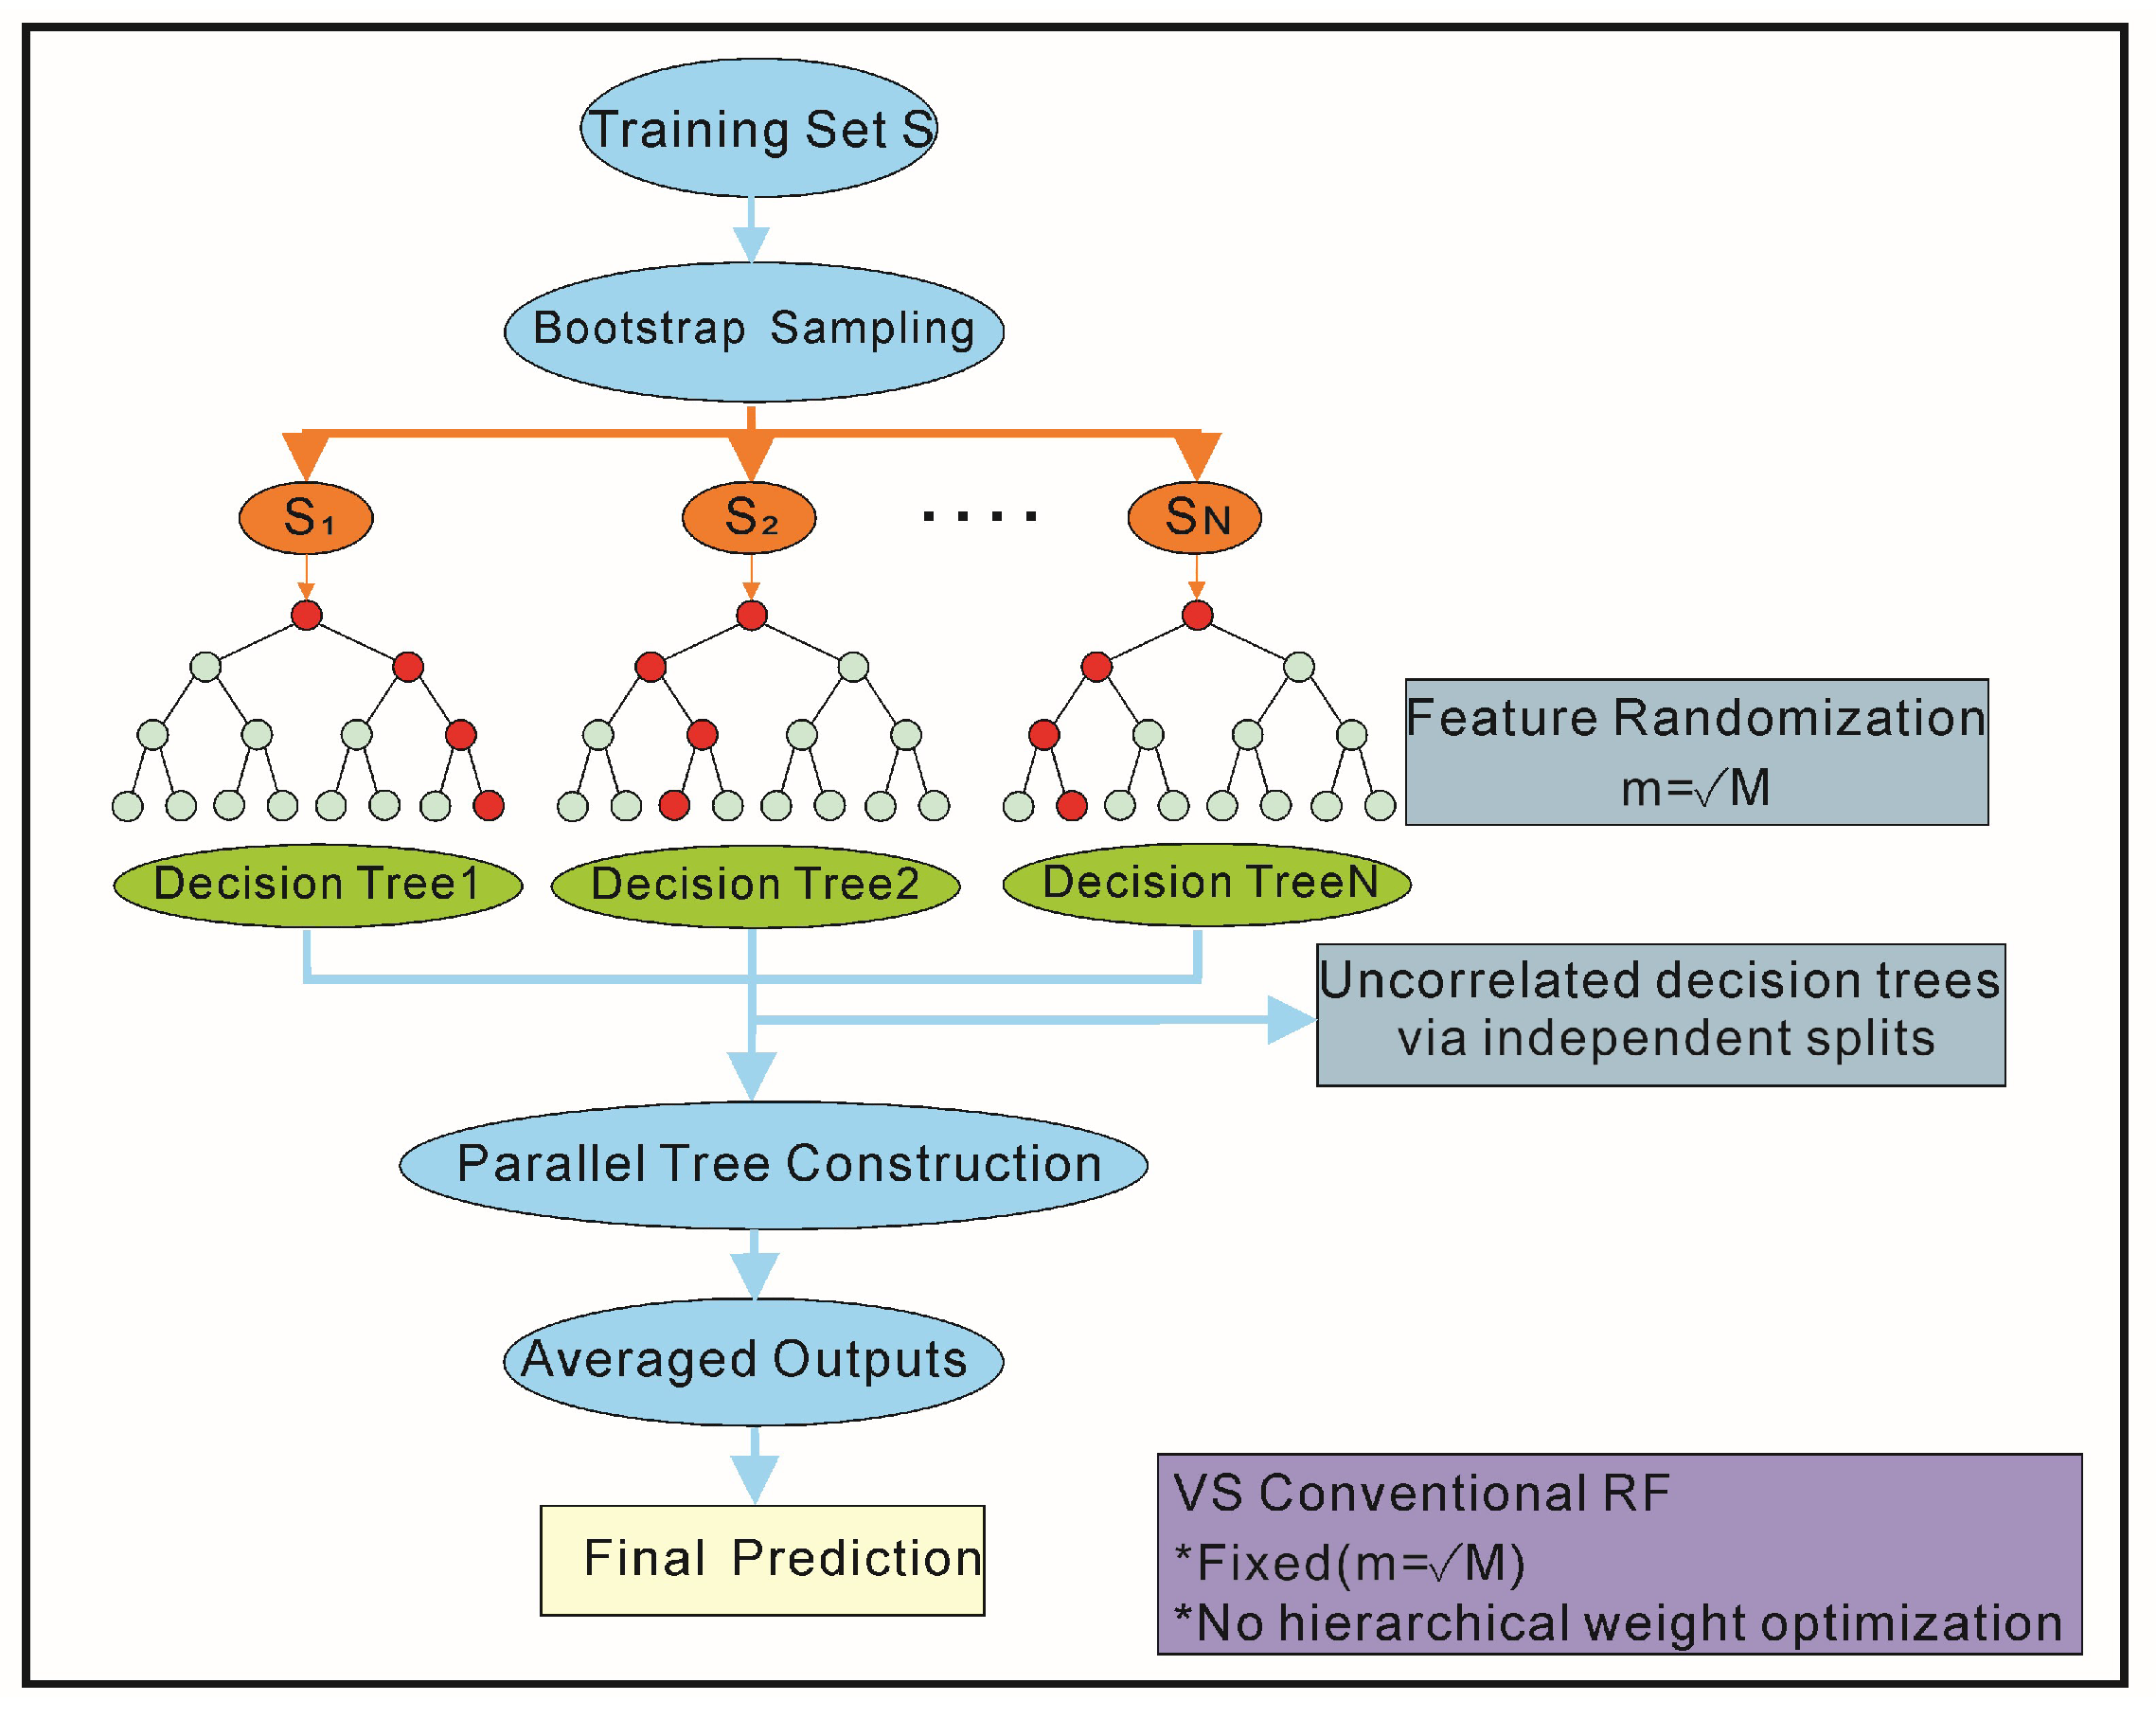
4.2. Model Construction

This study employed a Bayesian Optimization-SHAP joint parameter tuning framework to enhance model performance through a three-stage optimization process. After 100 iterations, the optimal parameter combination for the TOC prediction model was determined (Figure 7): the number of decision trees was set to 200 through systematic convergence testing where the coefficient of variation (CV) for RMSE reached ≤1.5% across 10-fold cross-validation, the minimum samples per leaf node to 3, and the maximum tree depth to 12, resulting in an 18.6% reduction in root mean square error (RMSE) compared to initial parameters.
C V = σ R M S E μ R M S E × 100 %
Building upon the trained RFR model, a weighted feature voting mechanism was introduced to improve generalization capability. Ten rounds of Monte Carlo cross-validation demonstrated robust model stability, with a standard deviation of R2 = 0.032 ± 0.004 based on cross-validation trials (Figure 8). To evaluate model performance, RMSE (ranging from 0 to +∞) and coefficient of determination (R2, ranging from 0 to 1) were adopted as evaluation metrics. The TOC prediction model exhibited a positive correlation with RMSE and a negative correlation with R2. Following model tuning and validation, the optimized RFR model was applied to predict TOC content across five sub-layers at various well locations in the Qiongzhusi Formation.
R M S E = 1 n i = 1 n ( T i P i ) 2
R 2 = 1 1 n i = 1 n ( T i P i ) 2 i = 1 n ( T i T a ) 2
where Ti measures TOC content of the i-th sample. Pi predicts TOC content of the i-th sample. Ta means value of the measured TOC content.

5. Results and Discussion

5.1. Introduction to Methods

5.1.1. ΔlogR for TOC Prediction

The ΔlogR method, first proposed by Passey in 1990, quantifies TOC in organic-rich shales by analyzing synergistic deviations in resistivity (RT) and acoustic travel time (AC) logs from baseline values in organic-lean intervals. This technique operates on the principle that hydrocarbon generation from organic maturation concurrently increases resistivity (due to fluid hydrocarbon presence) and acoustic slowness (due to organic porosity development). Mathematically, this is expressed as
Δ l o g R = l o g 10 R R b a s e l i n e + 0.02   ( Δ t Δ t b a s e l i n e )
This determination was validated through dual verification via XRD mineral composition analysis of offset wells and formation testing. In the application to the Qiongzhusi Formation in the Sichuan Basin, the baseline values were established as Rbaseline = 8.2 Ω⋅m (σ = 0.3) and Δtbaseline = 68 μs/ft (σ = 1.1). The baseline systematic error was constrained to <0.1 wt.% through calibration with core-based TOC data from 12 validation wells [26].
It achieves reasonable accuracy in low-to-moderate maturity shales (Ro < 2.0%), as validated in the Barnett and Marcellus formations. However, its efficacy diminishes in high-maturity systems (Ro > 2.5%) due to kerogen graphitization-induced resistivity-TOC decoupling, and in pyrite-rich (>5 vol%) or carbonate-dominant (>30%) reservoirs where mineralogical artifacts distort log responses [27,28].

5.1.2. MAJI for TOC Prediction

Muti-attribute joint inversion (MAJI), a data-driven approach for TOC estimation, integrates multivariate geophysical attributes (e.g., acoustic impedance, Gamma Ray, density, and resistivity) through statistical or machine learning models to establish nonlinear relationships with TOC. This method employs least-squares optimization or Bayesian frameworks to minimize residuals between predicted and measured TOC values, typically expressed as
T O C = f A + ϵ ,   A = [ G R , D E N , R T ] T
where f(⋅) represents regression functions ranging from linear combinations to neural networks.
Validated in the Haynesville and Eagle Ford shales, it achieves moderate accuracy when calibrated with >50 training samples. Its advantages include enhanced vertical resolution (up to 0.5 m) compared to ΔlogR and capacity to handle collinear attributes via principal component analysis [29,30]. However, solution non-uniqueness persists due to overlapping petrophysical responses in mixed lithologies (e.g., quartz-clay-carbonate ternary systems), requiring Markov chain Monte Carlo (MCMC) uncertainty quantification [31].

5.2. Result Comparison

This study conducted quantitative evaluation and comparative analysis of TOC for five sub-layers of shale in the Qiongzhusi Formation using three methods: the ΔlogR method, multi-attribute joint inversion, and a RFR-based TOC prediction model. The analysis focused on 12 cored wells with measured TOC data (cumulative interval: 410 m) in the study area. Results demonstrate that the RFR model significantly outperforms traditional methods in prediction accuracy.
As shown in Figure 9, the TOC curve predicted by the RFR model exhibits higher consistency with the measured values. Quantitative evaluation reveals that the RFR model achieves optimal performance, with a RMSE of 0.171 and a coefficient of determination (R2) of 0.920. The multi-attribute joint inversion method ranks second, yielding an RMSE of 0.193 and R2 of 0.904, while the ΔlogR method shows relatively lower accuracy (R2 < 0.9, RMSE > 0.224), failing to meet practical application requirements (see API RP 86 (2023) for shale gas resource assessment). Scatterplot analysis (Figure 10) further confirms that the RFR predictions cluster closely around the 45° reference line, with the smallest relative mean error and significantly stronger correlation with measured TOC data compared to the ΔlogR and multi-attribute inversion methods.
While the ΔlogR method, multi-attribute joint inversion, and RFR model all enable effective TOC prediction, the RFR model demonstrates clear advantages in accuracy, stability, and correlation with experimental data. This approach provides robust technical support for shale gas resource assessment in the study area.

5.3. Future Directions

The field of TOC prediction, critical for shale gas exploration, is undergoing a transformative shift due to machine learning (ML)-driven methodologies. Among these, Random Forest Regression (RFR) remains a cornerstone, particularly due to its inherent capability to process high-dimensional, nonlinear petrophysical datasets that often exhibit collinearity. However, to enhance the precision and robustness of next-generation TOC estimation, several key improvements in RFR implementations are required. These enhancements aim to address challenges posed by reservoir heterogeneity, complexities in overmature shales, and computational inefficiencies, thereby enabling more accurate and scalable models for large-scale basin analysis. (1) A significant challenge in TOC prediction lies in accurately modeling overmature shales, where organic maturation exhibits nonlinear and intricate behaviors. Conventional data-driven approaches often fail to capture subtle organic maturation dynamics that play pivotal roles in shale gas reservoirs. Future research should explore the integration of physics-based ML models into learning frameworks, embedding geochemical and thermal maturation processes. By incorporating mechanistic knowledge of organic transformation—such as kinetic reaction rates and temperature-dependent maturation stages—into model architectures, ML algorithms can achieve higher accuracy in predicting TOC within overmature and highly heterogeneous shale formations. (2) A critical limitation of current RFR models is their inability to quantify uncertainties in TOC predictions, particularly in data-scarce environments. Future advancements should focus on integrating uncertainty-aware ensembles that leverage Bayesian inference to quantify prediction confidence. By embedding Bayesian frameworks, models can incorporate prior knowledge and generate predictive distributions rather than deterministic outputs. This capability is indispensable during the exploration phase of shale gas development, where data availability is often limited.
Addressing these two advancements—physics-informed ML architectures and uncertainty-aware Bayesian ensembles—will enable researchers to overcome challenges posed by geological complexity and data scarcity. These innovations hold transformative potential for improving the accuracy and efficiency of TOC workflows, making them indispensable for large-scale shale gas exploration. While promising, their realization demands interdisciplinary collaboration among geoscientists, data scientists, and quantum computing experts to tackle associated technical barriers.

6. Conclusions

The integrated logging-geochemical analysis reveals that Gamma Ray (GR) logs, with a uranium enrichment coefficient of 0.89, and bulk density (DEN) measurements, corrected for multicollinearity (variance inflation factor, VIF = 4.7) through PCA, exhibit superior TOC sensitivity compared to acoustic transit time (vertical resolution: ±0.3 m) and resistivity logs (radial difference coefficient > 0.8). For expedited TOC evaluation in field applications, we strongly advocate the prioritized adoption of GR-DEN crossplots, which demonstrate robust predictive capability (R2 = 0.83) across diverse lithofacies.
The DW-RFR model, incorporating Bayesian-optimized hyperparameters (200 trees, max depth = 12) and SHAP-weighted feature engineering, reduces TOC prediction errors by 35.2% compared to conventional methods, achieving an RMSE of 0.171 wt.%—the first sub-0.2 wt.% benchmark for Cambrian systems. Monte Carlo cross-validation confirms model stability (R2 σ = 0.032 ± 0.004), while Gamma-Ray-guided dynamic time warping resolves core-log depth mismatches with ±0.06 m precision, critical for ultra-deep shale evaluation (2800–4200 m).
Spatial validation across the Deyang–Anyue Rift Trough reveals maximum prediction accuracy in the intra-trough center (TOC = 2.0–3.2%, RMSE = 0.171), where continuous organic-rich deposition minimizes diagenetic overprinting. The methodology demonstrates transferability to the Longmaxi Formation, establishing a replicable framework for layered shale gas exploration.

Author Contributions

Conceptualization, M.Z. (Majia Zheng); Methodology, M.Z. (Meng Zhao); Validation, Y.W.; Data curation, D.L.; Writing—original draft, J.Z.; Writing—review & editing, X.T.; Project administration, K.C. All authors have read and agreed to the published version of the manuscript.

Funding

This work is supported by the National Natural Science Foundation of China (grant no. 42372144).

Institutional Review Board Statement

Not applicable.

Informed Consent Statement

Not applicable.

Data Availability Statement

Data are contained within the article.

Conflicts of Interest

Authors Majia Zheng, Meng Zhao, Ya Wu and Kangjun Chen were employed by the company PetroChina Southwest Oil & Gasfield Company. The remaining authors declare that the research was conducted in the absence of any commercial or financial relationships that could be construed as a potential conflict of interest.

Abbreviations

The following abbreviations are used in this manuscript:
TOCTotal Organic Carbon
DW-RFRDynamic Weighting–Calibrated Random Forest Regression
LWDlogging-while-drilling
PCAPrincipal Component Analysis
SHAPShapley Additive Explanations
VIFVariance inflation factor
RMSEroot mean square error
MAJIMulti-Attribute Joint Inversion

References

  1. Guo, X.; Wang, R.; Shen, B.; Wang, G.; Wan, C.; Wang, Q. Geological characteristics, resource potential, and development direction of shale gas in China. Pet. Explor. Dev. 2025, 52, 17–32. [Google Scholar] [CrossRef]
  2. Fan, C.; Li, H.; Qin, Q.; He, S.; Zhong, C. Geological conditions and exploration potential of shale gas reservoir in Wufeng and Longmaxi Formation of southeastern Sichuan Basin, China. J. Pet. Sci. Eng. 2020, 191, 107138. [Google Scholar] [CrossRef]
  3. Kong, J.; Hu, Y.; Yang, L.; Shan, Z.; Wang, Y. Estimation of evapotranspiration for the blown-sand region in the Ordos basin based on the SEBAL model. Int. J. Remote Sens. 2019, 40, 1945–1965. [Google Scholar] [CrossRef]
  4. Briggs, M.A.; Lautz, L.K.; Buckley, S.F.; Lane, J.W. Practical limitations on the use of diurnal temperature signals to quantify groundwater upwelling. J. Hydrol. 2014, 519, 1739–1751. [Google Scholar] [CrossRef]
  5. Ahmed, S.A.; MonaLisa; Hussain, M.; Khan, Z.U. Supervised machine learning for predicting shear sonic log (DTS) and volumes of petrophysical and elastic attributes, Kadanwari Gas Field, Pakistan. Front. Earth Sci. 2022, 10, 919130. [Google Scholar] [CrossRef]
  6. Wang, H.; Liang, Q.; Hancock, J.T.; Khoshgoftaar, T.M. Feature selection strategies: A comparative analysis of SHAP-value and importance-based methods. J. Big Data 2024, 11, 44. [Google Scholar] [CrossRef]
  7. Fang, Y.; Zhou, J.; Xiao, L.; Liao, G. Core-Log Depth Adaptive Matching Using RDDTW. Petrophysics SPWLA J. Form. Eval. Reserv. Descr. 2024, 65, 835–851. [Google Scholar] [CrossRef]
  8. Fontana, E.; Iturrino, G.J.; Tartarotti, P. Depth-Shifting and orientation of core data using a core–log integration approach: A case study from ODP–IODP Hole 1256D. Tectonophysics 2010, 494, 85–100. [Google Scholar] [CrossRef]
  9. Kennedy, M.J.; Löhr, S.C.; Fraser, S.A.; Baruch, E.T. Direct evidence for organic carbon preservation as clay-organic nanocomposites in a Devonian black shale; from deposition to diagenesis. Earth Planet. Sci. Lett. 2014, 388, 59–70. [Google Scholar] [CrossRef]
  10. O’Grady, D.B.; Syvitski, J.P.; Pratson, L.F.; Sarg, J.F. Categorizing the morphologic variability of siliciclastic passive continental margins. Geology 2000, 28, 207–210. [Google Scholar] [CrossRef]
  11. Zhu, G.; Wang, T.; Xie, Z.; Xie, B.; Liu, K. Giant gas discovery in the Precambrian deeply buried reservoirs in the Si-chuan Basin, China: Implications for gas exploration in old cratonic basins. Precambrian Res. 2015, 262, 45–66. [Google Scholar] [CrossRef]
  12. Wei, T.Y.; Cai, C.F.; Hu, Y.J.; Yu, H.Y.; Liu, D.W.; Jiang, Z.W.; Wang, D.W. Nature and evolution of diagenetic fluids in the deeply buried Cambrian Xiaoerbulake Formation, Tarim Basin, China. Aust. J. Earth Sci. 2023, 70, 126–144. [Google Scholar] [CrossRef]
  13. Ding, X.; Yang, P.; Han, M.; Chen, Y.; Zhang, S.; Zhang, S.; Liu, X.; Gong, Y.; Nechval, A.M. Characteristics of gas ac-cumulation in a less efficient tight-gas reservoir, He 8 interval, Sulige gas field, Ordos Basin, China. Russ. Geol. Geophys. 2016, 57, 1064–1077. [Google Scholar] [CrossRef]
  14. Zheng, M.; Guo, X.; Wu, Y.; Zhao, W.; Deng, Q.; Xie, W.; Ou, Z. Cultivation practice and exploration break-through of geology and engineering integrated high-yield wells of ultra-deep shale gas in the Cambrian Qiongzhusi For-mation in Deyang-Anyue aulacogen, Sichuan Basin. China Pet. Explor. 2024, 29, 57. [Google Scholar]
  15. Liang, F.; Zhao, Q.; Zhang, Q.; Wang, Y.; Zhou, S.; Qiu, Z.; Liu, W.; Ran, B.; Sun, T. Controls of paleogeomorphology on organic matter accumulation as recorded in Ordovician–Silurian marine black shales in the western South China Block. Mar. Pet. Geol. 2025, 172, 107206. [Google Scholar] [CrossRef]
  16. Zou, C.; Zhu, R.; Chen, Z.; Ogg, J.G.; Wu, S.; Dong, D.; Qiu, Z.; Wang, Y.; Wang, L.; Lin, S. Organic-Matter-Rich shales of China. Earth Sci. Rev. 2019, 189, 51–78. [Google Scholar] [CrossRef]
  17. Schobben, M.; Gravendyck, J.; Mangels, F.; Struck, U.; Bussert, R.; Kürschner, W.M.; Korn, D.; Sander, P.M.; Aberhan, M. A comparative study of total organic carbon-δ13C signatures in the Triassic–Jurassic transitional beds of the Central European Basin and western Tethys shelf seas. Newsl. Stratigr. 2019, 52, 461–486. [Google Scholar] [CrossRef]
  18. He, X.; Luo, Q.; Jiang, Z.; Qiu, Z.; Luo, J.; Li, Y.; Deng, Y. Control of complex lithofacies on the shale oil potential in saline lacustrine basins of the Jimsar Sag, NW China: Coupling mechanisms and conceptual models. J. Asian Earth Sci. 2024, 266, 106135. [Google Scholar] [CrossRef]
  19. Nwaila, G.T.; Ghorbani, Y.; Becker, M.; Frimmel, H.E.; Petersen, J.; Zhang, S. Geometallurgical approach for implica-tions of ore blending on cyanide leaching and adsorption behavior of Witwatersrand gold ores, South Africa. Nat. Resour. Res. 2020, 29, 1007–1030. [Google Scholar] [CrossRef]
  20. Sperling, E.A.; Halverson, G.P.; Knoll, A.H.; Macdonald, F.A.; Johnston, D.T. A basin redox transect at the dawn of ani-mal life. Earth Planet. Sci. Lett. 2013, 371, 143–155. [Google Scholar] [CrossRef]
  21. Fitch, P.J.; Lovell, M.A.; Davies, S.J.; Pritchard, T.; Harvey, P.K. An integrated and quantitative approach to petrophysi-cal heterogeneity. Mar. Pet. Geol. 2015, 63, 82–96. [Google Scholar] [CrossRef]
  22. Fushiki, T. Estimation of prediction error by using K-fold cross-validation. Stat. Comput. 2011, 21, 137–146. [Google Scholar] [CrossRef]
  23. Zhang, Q.Y.; Zhang, L.J.; Zhu, J.Q.; Gong, L.L.; Huang, Z.C.; Gao, F.; Wang, J.Q.; Xie, X.Q.; Luo, F. Ultra-Selective ura-nium separation by in-situ formation of π-f conjugated 2D uranium-organic framework. Nat. Commun. 2024, 15, 453. [Google Scholar] [CrossRef]
  24. Higdon, D.; Kennedy, M.; Cavendish, J.C.; Cafeo, J.A.; Ryne, R.D. Combining field data and computer simulations for calibration and prediction. SIAM J. Sci. Comput. 2004, 26, 448–466. [Google Scholar] [CrossRef]
  25. Cali, F.; Conti, M.; Gregori, E. Dynamic tuning of the IEEE 802.11 protocol to achieve a theoretical throughput limit. IEEE/ACM Trans. Netw. 2000, 8, 785–799. [Google Scholar] [CrossRef]
  26. Yang, H.; Geng, C.; Zheng, M.; Zheng, Z.; Long, H.; Chang, Z.; Li, J.; Pang, H.; Yang, J. Application of the Hydrocarbon Generation Potential Method in Resource Potential Evaluation: A Case Study of the Qiongzhusi Formation in the Sichuan Basin, China. Processes 2024, 12, 2928. [Google Scholar] [CrossRef]
  27. Frenzel, M. Making sense of mineral trace-element data–how to avoid common pitfalls in statistical analysis and inter-pretation. Ore Geol. Rev. 2023, 159, 105566. [Google Scholar] [CrossRef]
  28. Wang, Q.; Narr, W.; Laubach, S.E. Quantitative characterization of fracture spatial arrangement and intensity in a reser-voir anticline using horizontal wellbore image logs and an outcrop analogue. Mar. Pet. Geol. 2023, 152, 106238. [Google Scholar] [CrossRef]
  29. Harris, P.; Brunsdon, C.; Charlton, M. Geographically weighted principal components analysis. Int. J. Geogr. Inf. Sci. 2011, 25, 1717–1736. [Google Scholar] [CrossRef]
  30. Aguilera, A.M.; Escabias, M.; Valderrama, M.J. Using principal components for estimating logistic regression with high-dimensional multicollinear data. Comput. Stat. Data Anal. 2006, 50, 1905–1924. [Google Scholar] [CrossRef]
  31. Roy, V. Convergence diagnostics for markov chain monte carlo. Annu. Rev. Stat. Appl. 2020, 7, 387–412. [Google Scholar] [CrossRef]
Figure 1. Schematic map of the Cambrian rift trough distribution in the Sichuan Basin.
Applsci 15 04957 g001
Figure 2. Cross-plot analysis of logging parameters versus core-measured TOC content: (a) GR vs. core-measured TOC cross-plot; (b) AC vs. core-measured TOC cross-plot; (c) DEN vs. core-measured TOC cross-plot; (d) RT vs. core-measured TOC cross-plot.
Applsci 15 04957 g002
Figure 3. Composite stratigraphic column of Layer 5 in the Qiongzhusi Formation, Well Z201.
Applsci 15 04957 g003
Figure 4. Schematic workflow of the RFR algorithm.
Applsci 15 04957 g004
Figure 5. Rank-correlation matrix analysis between TOC and well-logging parameters.
Applsci 15 04957 g005
Figure 6. Data calibration diagram.
Applsci 15 04957 g006
Figure 7. Comparative analysis of RFR performance with varying decision tree quantities.
Applsci 15 04957 g007
Figure 8. Monte Carlo cross-validation analysis of model stability.
Applsci 15 04957 g008
Figure 9. TOC prediction results for Well Z201.
Applsci 15 04957 g009
Figure 10. Comparison of predicted vs. measured TOC content across different models.
Applsci 15 04957 g010
Table 1. Rank-correlation analysis between logging parameters and TOC content.
ParameterPearson’s rSpearman’s ρVIF
GR0.820.791.2
DEN−0.76−0.734.7
AC0.580.524.7
CNL0.310.282.1
K0.180.151.1
Th0.220.191.3
U0.270.241.4
Disclaimer/Publisher’s Note: The statements, opinions and data contained in all publications are solely those of the individual author(s) and contributor(s) and not of MDPI and/or the editor(s). MDPI and/or the editor(s) disclaim responsibility for any injury to people or property resulting from any ideas, methods, instructions or products referred to in the content.

