Abstract
With the rapid development of society and technology, the physical health of university students has become a critical concern, influencing both individual well-being and the national talent pool. This study employs an improved K-means algorithm integrated with machine learning models to analyze university students’ fitness data and develop personalized health intervention strategies. The enhanced K-means algorithm overcomes the limitations of traditional clustering approaches, leading to improved clustering accuracy and stability. Machine learning models—including Random Forest, decision trees, Gradient Boosting Trees, and logistic regression—were utilized to validate the clustering outcomes and to identify key health indicators associated with different student groups. Based on the clustering and model analysis, targeted intervention programs are proposed, such as strength training for groups with low muscular explosiveness, endurance training for those with stamina deficiencies, and flexibility exercises for groups exhibiting limited mobility. This integrated analytical framework provides a scientifically grounded tool for comprehensive health assessments and offers actionable, data-driven recommendations for student health management. Future research will focus on optimizing algorithmic performance, enhancing data diversity, and broadening the application scope to further improve the effectiveness and feasibility of health interventions.
1. Introduction
With the rapid development of society and the continuous advancement of technology, human quality of life has been greatly improved, and public health awareness has reached unprecedented heights. As the future pillars and hopes of the nation, the physical health of university students not only affects personal well-being and the full potential of individuals but also serves as an important indicator of the quality of national talent reserves and the competitiveness of the nation. Therefore, conducting systematic testing and in-depth research on the physical health of university students is of profound and significant importance [1]. This process is not only a comprehensive review and scientific assessment of the current physical condition of university students but also provides a solid data foundation and theoretical basis for the future formulation of physical health standards in higher education admission systems and the optimization of physical education curricula. Through precise measurement and in-depth analysis, weak areas in students’ physical health can be effectively identified, providing guidance for personalized health interventions and educational direction, thus promoting the comprehensive development and improvement of students’ physical and mental health.
In response to the demands of the era, the Ministry of Education of the People’s Republic of China comprehensively revised and officially implemented the “National Student Physical Health Standards” in July 2014. This revision aims to construct a more scientific, comprehensive, and systematic student physical health monitoring and evaluation system, encouraging students to actively participate in physical exercise, guiding schools to deepen reforms in physical education and teaching, and promoting the vigorous development of school sports nationwide [2,3]. The new standards are specifically designed for university students and include a series of test items such as Body Mass Index (BMI), 50 m sprint, sit-and-reach test, vital capacity, standing long jump, pull-ups (for males)/1 min sit-ups (for females), 1000 m run (for males)/800 m run (for females), with detailed scoring criteria and evaluation methods to ensure the objectivity and validity of the test results. An overview of the test items and their corresponding weights is presented in Table 1.

Table 1.
National student physical health standards—test items and weights.
A similar emphasis on youth physical fitness can be observed globally. In the United States, the Youth Risk Behavior Surveillance System (YRBSS), administered by the Centers for Disease Control and Prevention (CDC), regularly monitors physical activity levels, body weight status, and related health behaviors among high school and college-aged populations [4]. Studies have reported a steady decline in aerobic capacity and muscular endurance among American college students over the past decade, largely attributed to sedentary lifestyles and changes in physical education engagement [5]. In Europe, initiatives such as the European Union Physical Activity Guidelines and the Health Behaviour in School-aged Children (HBSC) study have highlighted rising concerns about declining physical fitness among youth and called for a stronger integration of health promotion programs within educational institutions [6,7]. While approaches and measurements vary, common trends—including insufficient physical activity, increasing BMI levels, and reduced lung capacity—have been identified across multiple regions.
In Japan, national surveillance data encompassing over 16 million children and adolescents between 2013 and 2021 revealed a gradual but significant decline in physical fitness, with an accelerated deterioration observed during the COVID-19 pandemic. Notably, measures of aerobic capacity and muscular endurance declined markedly, indicating widespread reductions in daily physical activity and structured exercise opportunities [8]. Additionally, evidence from another study suggests that changes at the policy level—such as the implementation of revised national school guidelines—may inadvertently lead to declines in physical activity and cardiorespiratory fitness among school-age populations [9]. Similar patterns have been identified in Korea, where a large-scale cross-sectional analysis demonstrated that both insufficient physical activity and prolonged sedentary behavior independently contribute to increased body weight among adolescents, emphasizing the complex interplay of lifestyle behaviors on youth health [10]. These findings collectively underscore the need for comprehensive, behaviorally and structurally informed interventions to counteract the global trend of declining youth fitness and health.
However, despite large-scale data collection efforts in China and abroad, the mining and analysis of student physical fitness data remain relatively underdeveloped. Existing studies predominantly rely on traditional statistical methods or simple clustering algorithms (e.g., K-means) [11], which often struggle to process high-dimensional data or provide actionable insights. Furthermore, post-clustering interpretations and individualized intervention strategies are often lacking or poorly integrated.
To address these limitations, recent research has explored more sophisticated machine learning methods. For instance, Yao et al. applied a back-propagation neural network to model university students’ health profiles, achieving a classification accuracy of 90.22% [11]. Zhao and Shu combined convolutional neural networks with evolutionary algorithms to assess physical fitness more effectively [12]. In the international context, Yarım et al. employed Support Vector Machines (SVMs), Radial Basis Function Neural Networks (RBFNNs), and Tree Boosting to predict fitness levels in Turkish students, with SVM outperforming others in terms of prediction accuracy [13]. These studies demonstrate the growing potential of intelligent algorithms in physical health prediction and assessment.
Nevertheless, several challenges remain. Clustering techniques like K-means require the prior specification of the number of clusters and suffer from instability due to random initialization. Studies by Awaluddin et al. and Zhang et al. attempted to improve the traditional K-means algorithm, yet issues such as suboptimal feature selection and interpretability persist [14,15,16]. Additionally, while machine learning models improve predictive performance, their integration into a cohesive framework for physical fitness profiling and intervention design is still evolving.
Against this backdrop, the present study proposes an integrated analytical framework that combines improved K-means clustering with multiple machine learning models (Random Forest, decision tree, Gradient Boosting Tree, and logistic regression). After conducting univariate and multivariate analyses to ensure data consistency, the framework applies a dimension-reduction-enhanced K-means variant to identify meaningful health subgroups among college students. Classification models are subsequently used to validate the clustering structure and predict students’ health trends. Based on the model outputs, targeted and interpretable intervention strategies are formulated to support personalized physical education and health promotion at the university level.
2. Model Construction and Algorithm Enhancement
In this study, we initially focused on analyzing variations in physical fitness scores over four years. We selected the variables that significantly influenced the clustering results while excluding non-significant ones to streamline the analysis process. After data preparation, we employed Principal Component Analysis (PCA) for dimensionality reduction, retaining only the most representative features. The optimal number of clusters (K) was then determined for both male and female groups using clustering analysis. Following clustering, distinct patterns in physical health indicators were identified. These patterns allowed us to propose targeted physical health intervention strategies tailored to each group’s characteristics. By using multiple machine learning methods (K-means, Random Forest, decision trees, Gradient Boosting Trees, and logistic regression), we validated the reliability of the clustering results. This ensured that the analysis was scientifically rigorous and provided a solid data foundation for developing personalized health management plans.
Figure 1 below illustrates the experimental flow chart, outlining the key steps of the clustering and analysis process, which ultimately led to the development of targeted intervention strategies for improving physical health.
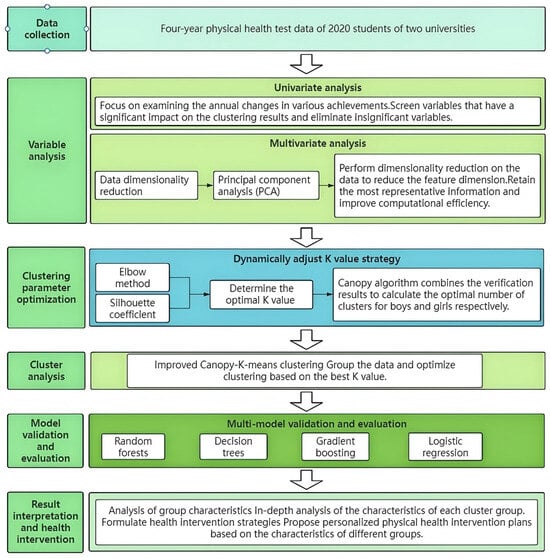
Figure 1.
Experimental flow chart.
2.1. Univariate and Multivariate Analysis
Univariate and multivariate analyses were conducted to identify key variables influencing student physical health. These analyses provided insights into the factors that most significantly impacted health status, forming the foundation for grouping students based on their health indicators. By examining these variables, we were able to categorize students into distinct groups, each with unique physical health profiles. This clustering then allowed for the formulation of personalized intervention strategies tailored to the specific needs of each group.
In particular, Principal Component Analysis (PCA) [17,18] was employed for dimensionality reduction and transforms multiple independent variables into a set of new, uncorrelated variables (principal components) that retain as much of the original data’s variance as possible [19,20]. This step helped in identifying the core health indicators that shaped the groups, providing clearer data support for the development of targeted health management plans.
2.2. Improved K-Means Algorithm
The improved K-means algorithm [21] combines the canopy algorithm [22,23] with traditional K-means clustering to enhance the clustering efficiency and accuracy of large-scale datasets. The K-means algorithm performs fine clustering within each canopy, reducing the complexity of global searches and improving clustering efficiency [24]. This method accelerates the computational process through initial grouping and fine-tuning, while also enhancing the accuracy of clustering results, particularly for large-scale datasets. This approach allowed for a more accurate grouping of students, which was essential for formulating personalized health management plans.
2.3. Validation and Evaluation
To comprehensively evaluate the scientific validity and practical applicability of the canopy-K-means clustering results, a variety of assessment methods were employed. Machine learning models—including logistic regression [25,26], decision trees [27], Random Forest [28], and XG Boost version 3.0.0 [29]—were used to indirectly verify the rationality and stability of the clustering structure by analyzing the relationships between physical health indicators and student groupings. These models confirmed the robustness of the clustering features and identified key variables that significantly contributed to group differentiation, providing data-driven insights for designing personalized health intervention strategies. Evaluation metrics such as the silhouette coefficient, accuracy, F1 score, and confusion matrices were utilized to assess the cohesion, separation, and classification performance of the clusters, thereby ensuring the reliability and practical relevance of the clustering outcomes.
2.3.1. Logistic Regression Model
The logistic regression model [25] is a classification model used when the dependent variable is binary, taking values of 0 (non-occurrence) or 1 (occurrence). It assumes a linear relationship between the independent variables and the log-odds of the outcome. The model predicts the probability of the event occurring using the logistic (sigmoid) function [26].
The formula for the logistic regression model is as follows:
Here, are the coefficients learned through maximum likelihood estimation (MLE), ensuring predicted probabilities align closely with actual outcomes. Logistic regression is simple, efficient, and interpretable, making it well-suited for binary classification. However, it may struggle with complex or highly nonlinear data patterns.
2.3.2. Decision Tree Model
The decision tree [27] model is a prediction model based on a tree-like structure. It recursively splits the data to construct the tree, where each node represents a feature, each branch represents a feature value, and the leaf nodes represent the prediction results. The advantages of decision trees are their ease of understanding and interpretability, as well as their ability to handle nonlinear relationships and missing values. However, they are prone to overfitting.
The principal formula for the decision tree model is as follows:
where is the predicted output, is the input feature vector, and is the function learned by the decision tree.
2.3.3. Random Forest Model
The Random Forest [28] is an ensemble learning method based on multiple decision trees, commonly used for classification and regression. Unlike logistic regression, it does not assume a linear relationship between variables. Instead, it builds multiple trees using Bootstrap sampling, and each tree selects a random subset of features at each split to reduce feature dominance. The final prediction is made by aggregating the outputs of all trees—majority voting for classification and averaging for regression.
The classification formula is as follows:
where is the predicted class label, is the number of trees, is the output of the tree, and is the indicator function.
2.3.4. XG Boost Model
The XG Boost [29] is a tree-based ensemble learning algorithm that builds decision trees using gradient boosting. Each tree is trained on the residuals of the previous ones, allowing the model to capture nonlinear relationships and handle high-dimensional data effectively.
The model is defined as follows:
where is the predicted value, is the input feature vector, is the output of the decision tree, and is the total number of trees. XG Boost uses gradient boosting to iteratively train multiple decision trees, each correcting the errors of the previous tree, improving prediction accuracy.
In summary, logistic regression offers simplicity and interpretability, making it well-suited for binary classification problems with linear relationships. Decision tree models provide flexibility in capturing complex, nonlinear patterns. Random Forest enhances predictive accuracy and robustness by aggregating multiple decision trees. XG Boost delivers high efficiency and superior performance, particularly in handling large-scale and complex datasets.
3. Experimental Design
3.1. Dataset Description
The research data in this study are sourced from the Physical Fitness Testing Centers of Yunnan Agricultural University and Southwest Forestry University. Both universities are located in Kunming City, Yunnan Province, China, and have similar student populations and academic disciplines. Both universities offer a four-semester physical education curriculum, with similar courses, hours, and organizational structures.
The dataset contains the complete physical fitness testing data of the 2020 undergraduate cohort at both universities from the academic years 2020 to 2023. Due to variations in the organizing personnel and data collection methods each year, the data formats differ across years, presenting challenges in data aggregation and processing. The dataset consists of 29,834 rows and includes the following: (1) six basic information attributes for each student, including name, student ID, college, gender, class, and the year of the fitness test; (2) scores and corresponding grades for various fitness tests, such as Body Mass Index (BMI), vital capacity, 50 m sprint, 1000 m run (for males)/800 m run (for females), sit-and-reach, standing long jump, pull-ups (for males)/1 min sit-ups (for females), and others; and (3) 27 exam-related attributes, including standard total score, additional points, overall exam score, and overall score classification.
The quality of the data directly impacts the effectiveness of the model analysis [30,31]. In this study, the primary focus of data preprocessing was on handling sensitive information, redundant attributes irrelevant to the research, missing values, and outliers that were clearly inconsistent with expected patterns. Comprehensive data preprocessing was carried out on the student health data, including data anonymization, data cleaning, data filtering, and data integration. Sensitive information in the dataset, such as student names, college, major, additional points, and others, which are not helpful for the analysis task, were deleted. Attributes such as the total score, total score grade, height, gender, and BMI score had missing values and outliers, totaling 678 entries. The processed data are shown in Table 2.
Table 2.
Processed student health data.
3.2. Variable Analysis
3.2.1. Univariate Analysis
Univariate analysis [32] serves as a foundational step in this study, offering critical insights into the distribution, variability, and potential anomalies of individual features. Through the use of histograms, kernel density estimation (KDE) plots, and boxplots, it becomes possible to identify key data characteristics such as multimodal distributions, outliers, and skewness—factors that are essential for guiding subsequent data cleaning, normalization, and transformation processes.
Figure 2 visualizes the distribution of various physical fitness indicators among university students using histograms with kernel density estimation (KDE) curves and boxplots. The histograms show the frequency of values for each variable, with the KDE curve revealing the overall distribution and potential modes. This helps identify characteristics like multimodal distributions, skewness, and outliers, which guide data preprocessing. For example, the weight score shows a bimodal distribution, indicating the presence of both underweight and overweight/obese groups, while the sit-up score is right-skewed, suggesting that many students struggle with this test. The boxplot adds further detail, showing the interquartile range (IQR), with outliers represented by dots outside the whiskers. For instance, the weight variable shows significant variability with many outliers, and the Lung Capacity Function Score has a slight right skew, with some low outlier scores. The sit-and-reach and standing long jump scores show near-normal distributions, while the 800 m run has a multimodal distribution, likely due to differences in endurance across subgroups. Lastly, the year variable is evenly distributed across academic years (2020–2023), as shown by both the histogram and boxplot. This temporal consistency ensures that the dataset is not biased by any specific year, enhancing the generalizability of the findings across all years. Analyzing the year variable helps confirm the validity of the data and strengthens the study’s conclusions.
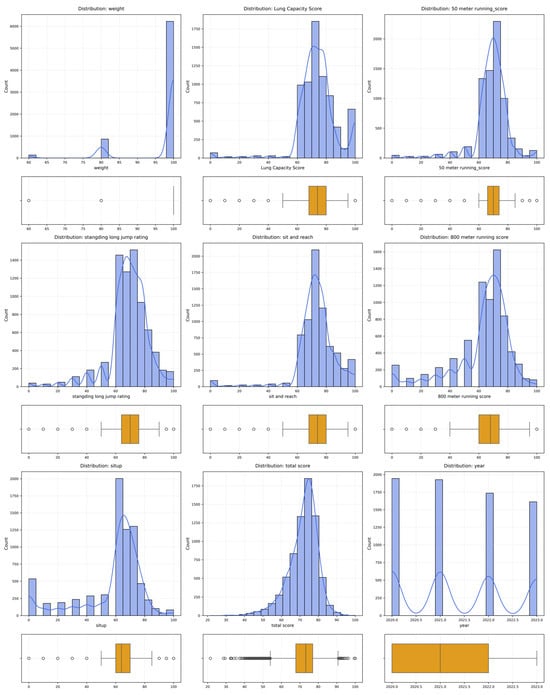
Figure 2.
Univariate analysis results for each column of the dataset.
The integration of univariate analysis is motivated by its ability to enhance the accuracy, robustness, and interpretability of clustering and machine learning models. By enabling a detailed understanding of the behavior of each physical fitness indicator, this approach ensures that meaningful patterns are preserved and not masked by noise or inconsistencies in the dataset. Furthermore, isolating the distributional properties of individual variables facilitates the development of precise, evidence-based intervention strategies tailored to the specific health profiles of college students, thereby increasing the practical relevance and scientific impact of the study’s findings.
3.2.2. Multivariate Analysis
To investigate the interrelationships among physical fitness indicators, multivariate analysis [32] was employed. Figure 3 presents the Pearson correlation heatmap of selected physical fitness indicators. Pearson’s correlation coefficient was employed because it quantifies linear associations between continuous variables, which is suitable given that most physical fitness test scores approximate a normal distribution [33]. This type of multivariate analysis enables the simultaneous evaluation of interrelationships among multiple variables, allowing for the detection of interaction effects and multicollinearity that are not discernible through univariate methods alone. Such an approach provides a more comprehensive understanding of how different fitness components contribute to overall physical health and lays the foundation for predictive modeling and targeted intervention design.
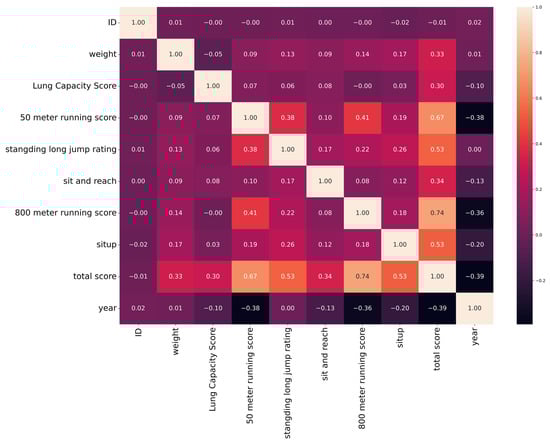
Figure 3.
Results of multivariate analysis of the dataset.
The heatmap reveals several noteworthy correlations. The 800 m running score shows a moderate positive correlation with the total fitness score (r = 0.74), while sit-up performance also demonstrates a moderate association (r = 0.53). The 50 m sprint score is positively correlated with the 800 m score (r = 0.41), indicating that both reflect aspects of cardiovascular endurance. The standing long jump rating exhibits a weak-to-moderate correlation with sprint performance (r = 0.38), suggesting a shared component of lower-body power. In contrast, the ‘year’ variable shows negative correlations with several performance indicators, including the 50 m sprint score (r = −0.38) and total score (r = −0.39), possibly reflecting a temporal decline in students’ fitness levels.
Correlation strengths were interpreted according to Cohen’s conventional thresholds: |r| < 0.1 (negligible), 0.1 ≤ |r| < 0.4 (weak), 0.4 ≤ |r| < 0.7 (moderate), and |r| ≥ 0.7 (strong). This objective classification clarifies the significance of observed relationships and ensures consistent interpretation across variables [34,35].
The analysis was extended by employing a Pearson correlation heatmap to quantify linear associations between variables, such as the moderate to strong relationships observed between 800 m running scores and total fitness score (r = 0.74) or between sit-up performance and total score (r = 0.53). It also reveals potentially redundant variables and inverse trends over time, with the ‘year’ variable negatively correlated with multiple performance metrics, suggesting a temporal decline in physical outcomes. This multivariate approach deepens our understanding of the interconnected nature of physical fitness components, beyond what univariate methods alone can reveal.
In Figure 4, the pair plot serves as an integrative tool that validates and visually reinforces insights from both Figure 3 and Figure 4. The diagonal histograms in Figure 4 confirm earlier distributional observations, such as skewness in BMI and sit-up scores, while the off-diagonal scatter plots visualize the correlations outlined in Figure 4, such as the alignment between the sit-and-reach and total score, or the weak association between pull/sit-ups and overall performance. Additionally, it enables the rapid identification of outliers and nonlinear patterns not easily captured by correlation matrices, while also informing the refinement or exclusion of non-informative features based on visual redundancy or distributional anomalies.
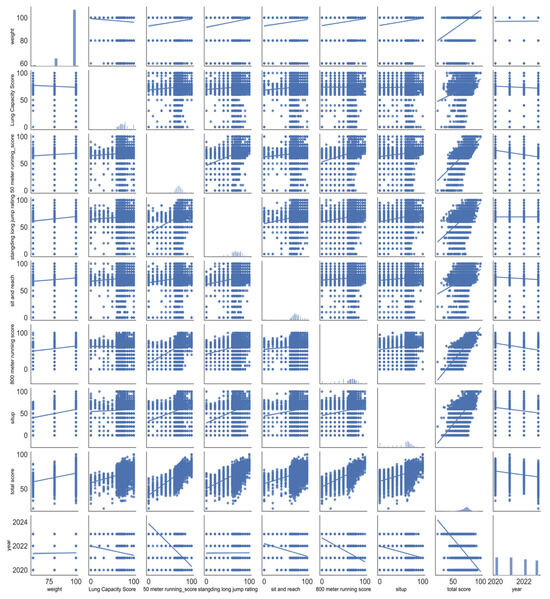
Figure 4.
Dataset pairing diagram.
In summary, Figure 2, Figure 3 and Figure 4 collectively provide a layered and complementary framework for exploratory data analysis (EDA), facilitating both distributional assessment and inter-variable relationship exploration. Figure 4 offers a detailed univariate perspective on each physical fitness indicator through kernel density estimates and boxplots, highlighting key distributional features such as the bimodal nature of the BMI-derived weight score, skewed sit-up performance, and the presence of multiple outliers across several tests. These findings underscore the heterogeneity in physical fitness components among university students, prompting further investigation into data quality and subgroup characteristics.
Figure 4, in subsequential presentation and cross-validation across Figure 2, Figure 3 and Figure 4, not only strengthens the reliability of the analytical findings but also illustrates a systematic EDA pipeline. Starting from univariate distribution assessment, advancing through multivariate correlation analysis, and culminating in integrated visualization for feature and anomaly evaluation, this approach ensures a robust foundation for subsequent modeling and targeted interventions in physical fitness research.
3.3. Cluster Analysis
According to the descriptive statistics and visual analysis of Figure 5 and Figure 6, it can be seen that there are obvious differences between the test items in the dataset used in this study. In order to gain a deeper understanding of the students’ physical health, we selected the scores of each test item as feature attributes for cluster analysis in order to obtain more reference-worthy results. The feature attribute boxplots shown in Figure 7 and Figure 8 provide valuable insights into the central tendency, dispersion, data value distribution, and outliers of the extracted feature attributes. As can be seen from the figure, the preprocessed data showed better evaluation effects in all aspects, paving the way for further experiments and analysis. According to the National Student Physical Fitness Standards (revised in 2014), boys and girls have two different items in the physical fitness test, that is, in addition to the same five test items of BMI, vital capacity, 50 m run, sit-up, and standing long jump tests, girls have 800 m run and 1 min sit-up tests, and boys have 1000 m run and pull-up tests. Therefore, boys and girls will be tested and analyzed separately. Before the cluster analysis, we normalized the physical test data, where we used weight and height to calculate the students’ BMI, and obtained the BMI score according to the physical fitness test standards for college students. The following cluster analysis is based on the processed data.
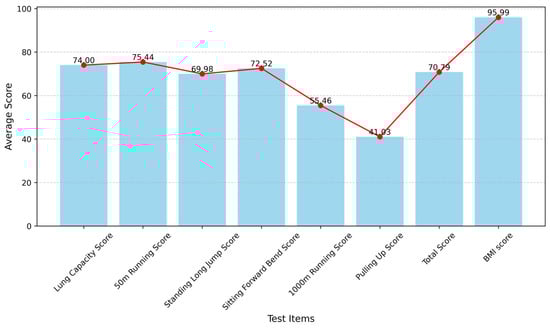
Figure 5.
The male average score of each test item after preprocessing.
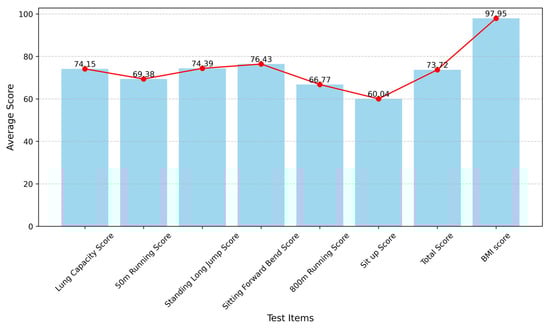
Figure 6.
The female average score of each test item after preprocessing.
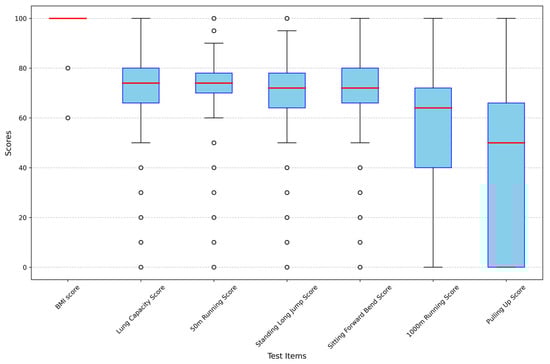
Figure 7.
Boxplot of each characteristic attribute of males in the dataset. Note: “The red line in each box represents the median value of the corresponding characteristic attribute”.
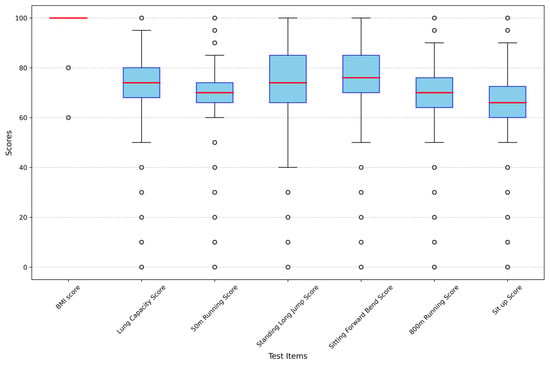
Figure 8.
Boxplot of each characteristic attribute of females in the dataset. Note: “The red line in each box represents the median value of the corresponding characteristic attribute”.
3.3.1. Selection of the Optimal K Value
- K-means Clustering and Determination of the Optimal K Value
In this study, K-means clustering is employed to uncover potential grouping patterns in the physical health test data of the 2020 cohort of students from Yunnan Agricultural University and Southwest Forestry University. Considering that the effectiveness of the K-means algorithm is highly sensitive to the number of clusters (K) and the initial centroid selection, this study integrates the canopy algorithm as a preprocessing step to enhance clustering performance and robustness. The canopy algorithm rapidly divides the dataset into overlapping subsets (canopies) using a loose similarity measure defined by two distance thresholds (T1 > T2). A canopy refers to a preliminary cluster or region that helps roughly group similar data points. This step effectively reduces the computational complexity of K-means by narrowing the search space for centroid initialization and providing a more informed basis for selecting the optimal K value. Following the canopy-based partitioning, fine-grained clustering is conducted within each canopy using the K-means algorithm. This hierarchical approach not only improves clustering accuracy but also enhances computational efficiency, particularly for handling the high-dimensional and large-volume dataset collected in this study.
In our study, the canopy algorithm served not only as a coarse clustering method to group similar data points, but also played a critical role in narrowing the range of candidate values for K in the subsequent K-means clustering. Specifically, based on the initial canopy partitioning, we limited our search for the optimal number of clusters to the range of K = 3 to 10 for male students, and K = 4 to 10 for female students. This reflects the data characteristics revealed by the canopy structure and helped reduce computational overhead while maintaining clustering quality. To further ensure the scientific validity of the clustering results, this study combines the elbow method with the Calinski–Harabasz index to determine the optimal number of clusters. Additionally, the silhouette score is employed to assess the overall quality of the clustering outcomes.
- 2.
- Application of the Elbow Method
The elbow method is a commonly used technique for determining the optimal K value [36]. The core idea is that as the number of clusters (K) increases, the intra-cluster cohesion improves, and the sum of squared errors (SSE) decreases gradually. When K reaches the true number of clusters, the rate of decline in SSE slows down significantly, forming an “elbow” point in the graph. The K value corresponding to this “elbow” is considered the optimal number of clusters.
However, the elbow method can be somewhat subjective in practice, especially when the data distribution is complex or when the “elbow” is not distinct. Relying solely on the elbow method may lead to bias. Therefore, this study introduces the Calinski–Harabasz index [37] as a supplementary verification tool.
- 3.
- Introduction and Validation of the Calinski–Harabasz Index
The Calinski–Harabasz index (CH index) is an important metric for evaluating the effectiveness of clustering. The calculation formula is as follows:
is the total number of data points and is the number of clusters. The greater the between-cluster dispersion, the more distinct the differences between clusters. The smaller the within-cluster compactness, the closer the data points within the same cluster are to each other. Thus, the optimal clustering solution corresponds to the value of that maximizes the index, as it represents the best clustering outcome [38,39].
- 4.
- Cluster Analysis for Male and Female Groups
K-means clustering is applied separately to the data of the male and female groups. The silhouette score [40] and Calinski–Harabasz index are calculated for each group, and the trends of these indicators are plotted as shown in Figure 9 and Figure 10. These plots are used to visualize the changes in the clustering quality as a function of K and assist in identifying the optimal number of clusters for both the male and female groups.
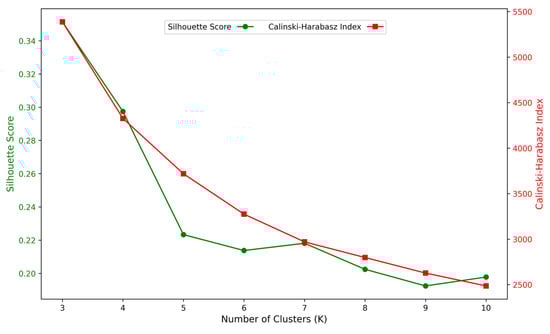
Figure 9.
Corresponding relationship between SEE and K value of male group.
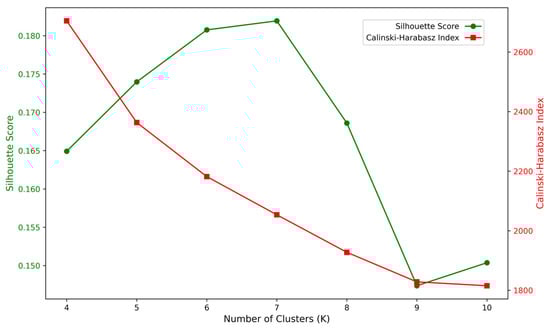
Figure 10.
Corresponding relationship between SEE and K value of the female group.
The results indicate that when K = 3, the Calinski–Harabasz index reaches its maximum value (5387.11), while the silhouette score is 0.351379, which is the highest among all K values. This suggests that the clustering quality is optimal. Therefore, the optimal number of clusters for the male group is three.
For the female group, when K = 4, the Calinski–Harabasz index reaches its maximum value (2704.64), and the silhouette score is also relatively high (0.164922). Based on these two metrics, the optimal number of clusters for the female group is determined to be four.
- 5.
- Dimensionality Reduction and Accuracy of Results
To enhance the interpretability and visualization of high-dimensional data, Principal Component Analysis (PCA) was employed to reduce the feature space to three principal components. As shown in Figure 11, this dimensionality reduction strategy preserved approximately 79.52% of the total variance in the male group and 70.92% in the female group, indicating that the majority of the original information was effectively retained despite the dimensionality reduction.
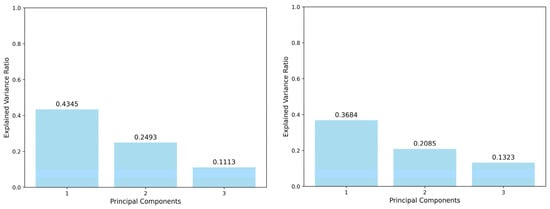
Figure 11.
Histogram of the proportion of variance explained by PCA.
The transformed three-dimensional feature space reveals a more distinguishable and structured distribution of samples, thereby facilitating more intuitive and effective clustering by the K-means algorithm. This transformation addresses the challenges posed by high-dimensional datasets, which are often difficult to interpret or process directly, especially when performing unsupervised learning tasks such as clustering.
The first three principal components capture the dominant variance across the dataset and serve as a compact yet informative representation of the original feature space. The improved clustering separability observed in the PCA-transformed data provides robust support for the subsequent classification and pattern analysis.
To better construct a comprehensive physical health portrait of students, it is essential to identify the most distinguishing features that characterize different clusters. In this study, prior to constructing the student health portraits, we treated the clustering labels as target variables and conducted feature importance analysis using four widely adopted supervised learning models: XG Boost, Random Forest, decision tree, and logistic regression. Each model was trained using the same set of features employed during clustering as input variables (X), with the clustering classification results as the target variable (y). For XG Boost [41], the model was configured with default parameters, except for n_estimators = 100 and random_state = 123. Similar settings were adopted for Random Forest and decision tree models, while logistic regression was configured with solver = ‘lbfgs’ and max_iter = 1000 to ensure convergence.
After training, we extracted feature importance scores from each model: for tree-based models (XG Boost, Random Forest, and decision tree), the built-in feature_importances_ attribute was used; for logistic regression, the absolute values of the model coefficients were taken as a proxy for importance, as they reflect the contribution of each feature to the decision boundary.
Given the inherent differences in how each model defines and computes feature importance—such as gain-based importance in tree-based models versus coefficient magnitude in linear models—combining these values directly would risk conflating fundamentally different interpretative mechanisms. Therefore, to ensure methodological transparency and interpretative clarity, we chose to present the results separately. This approach is consistent with best practices in explainable machine learning, which emphasize model-specific interpretation [42,43,44].
To maintain methodological rigor, we did not average feature importance scores across all models due to the distinct mechanisms underlying their calculation. Instead, we first present feature importance based on logistic regression coefficients for the male group (Figure 12). Then, we show the averaged and normalized importance scores obtained from three tree-based models for the male group (Figure 13). Similarly, for the female group, Figure 14) presents feature importance based on logistic regression, while Figure 15 displays the corresponding results from the tree-based models. This sequential organization provides an intuitive comparison of the most influential attributes under different model assumptions.
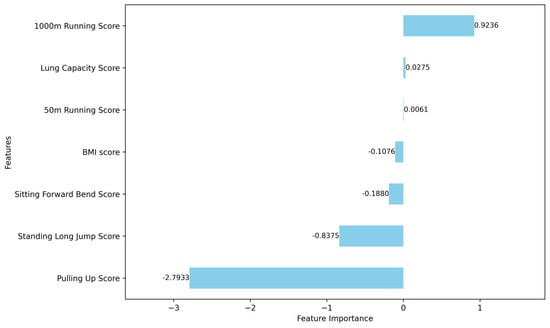
Figure 12.
Results of the analysis of feature importance in logistic regression for male group characteristics.
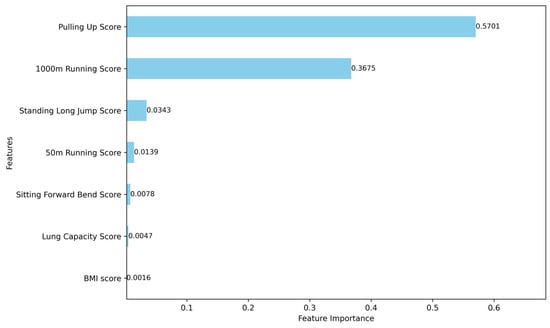
Figure 13.
Results of the feature importance analysis for male group characteristics using three tree-based algorithms.
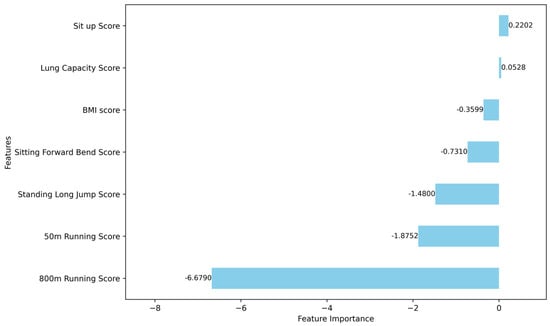
Figure 14.
Results of the analysis of feature importance in logistic regression for female group characteristics.
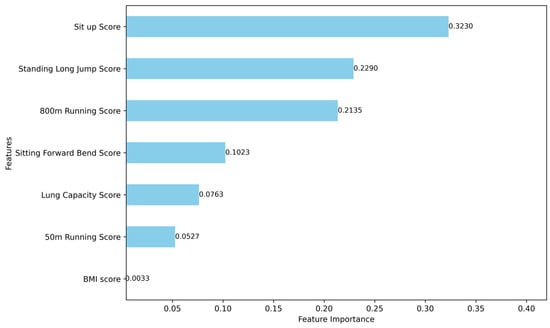
Figure 15.
Results of the feature importance analysis for female group characteristics using three tree-based algorithms.
The analysis of feature importance reveals that certain physical performance indicators exhibit greater discriminative power in the clustering analysis. For the male group, the most distinguishing features include pull-up performance, 1000 m run performance, 50 m sprint performance, and standing long jump performance. For the female group, the key differentiating features are sit-up performance, standing long jump performance, 800 m run performance, and sit-and-reach performance. These features should therefore be prioritized when interpreting clustering results and constructing personalized health profiles for students. Their prominence underscores their significance in capturing the distinct physical fitness characteristics of male and female students.
3.3.2. Analysis of Clustering Results
The optimal number of clusters and initial cluster centroids were determined and used as inputs for the K-means algorithm. K-means was then executed to iteratively refine the clustering within each canopy cluster, ensuring an accurate grouping. At the conclusion of the iterations, the clustering results were analyzed, revealing that the female group could be categorized into four distinct clusters, while the male group was divided into three clusters. Each cluster exhibited unique characteristics across various physical fitness test indicators. The clustering outcomes and visualizations are presented using 3D scatter plots, as shown in Figure 16 and Figure 17, effectively illustrating the distribution and differences among clusters.

Figure 16.
Visualization of the clustering results of the improved canopy-K-means algorithm based on Principal Component Analysis (PCA) for the male group.
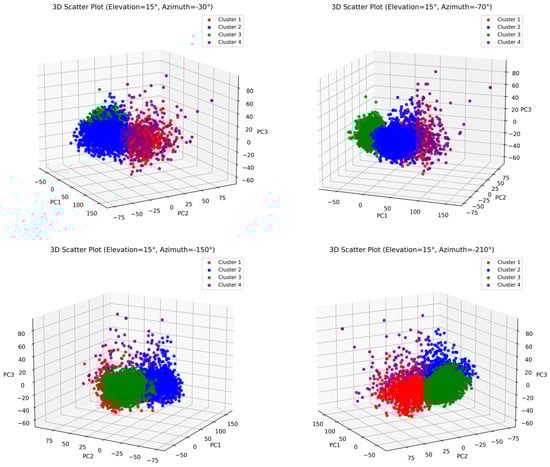
Figure 17.
Visualization of the clustering results of the improved canopy-K-means algorithm based on Principal Component Analysis (PCA) for the female group.
The specific results are analyzed in the following tables. The final clustering results of the boys’ group are detailed in Table 3, and the final clustering results of the girls’ group are detailed in Table 4. Table 3 and Table 4 present the results of K-means clustering for male and female student groups, respectively. Each numerical value in the tables represents the mean score of a specific physical fitness indicator within the corresponding cluster. For instance, in Table 3, Cluster 1 of the male group (n = 4342) shows relatively balanced performance across all items, with moderate scores in both endurance (1000 m running score: 70.73) and strength (pull-up score: 68.75). In contrast, Cluster 2 (n = 1930) demonstrates a sharp decline in endurance (1000 m running score: 12.73), despite slightly better scores in flexibility and explosive strength. This suggests the existence of a subgroup that may require targeted cardiovascular or aerobic capacity training.
Table 3.
K-means clustering results for the male group.
Table 4.
K-means clustering results for the female group.
Similarly, in the female group shown in Table 4, Cluster 3 (n = 4379) consistently achieves the highest average scores across nearly all indicators, including BMI (98.95), standing long jump (83.70), and overall health results (80.76), suggesting a high-performing cohort. Conversely, Cluster 2 (n = 1771) reveals a significant deficiency in core strength, as reflected by a low sit-up score (17.65), despite average performance in other areas.
These cluster-specific profiles not only reflect differences in physical health status among students but also highlight the necessity for customized training or intervention programs. By identifying these distinct group characteristics, educational institutions can more effectively allocate resources and design targeted fitness programs to address the unique needs of each subgroup.
The radar chart of the physical fitness test for male and female students and the trend chart of each item are shown in Figure 18 and Figure 19:
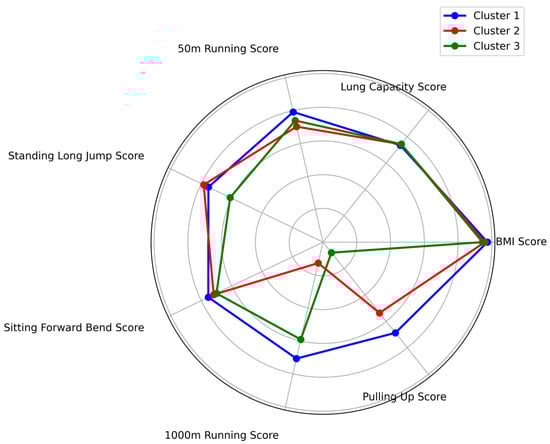
Figure 18.
Radar chart of the average performance of students in all categories in the male group on each test item.
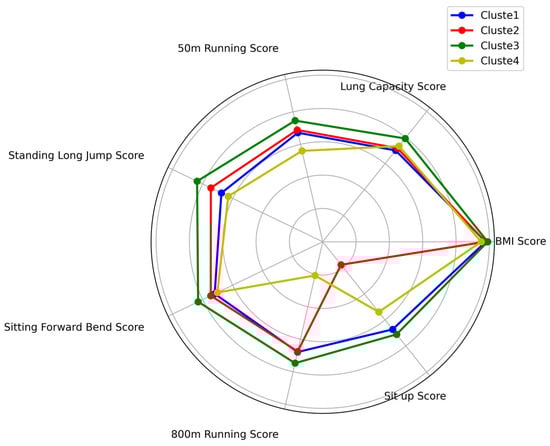
Figure 19.
Radar chart of the average performance of students in all categories in the female group on each test item.
As shown in Table 3 and Table 4, along with Figure 18 and Figure 19, the male students are categorized into three distinct clusters, while the female students are grouped into four clusters. Each cluster demonstrates unique performance characteristics across various physical fitness indicators.
- Male Group Classification
Cluster 1 (Group with Outstanding Overall Abilities)
Students in this cluster demonstrated higher average scores across all indicators, reflecting strong overall physical fitness. Notably, their scores in the 50 m sprint, standing long jump, sit-and-reach, and 1000 m run were significantly better than those of other clusters. This group comprised 38.86% of the male students.
Cluster 2 (Group with Weak Upper and Lower Limb Strength)
This group showed low scores in the pull-up test (53.71 points), indicating insufficient upper limb strength. Additionally, their standing long jump scores were the lowest (78.40 points), suggesting weak lower limb explosive power. This cluster represented 17.26% of the male students.
Cluster 3 (Group with Weak Aerobic Endurance and Upper Limb Strength)
Students in this cluster scored poorly in the 1000 m run (59.14 points) and pull-up test (7.99 points), highlighting deficiencies in endurance and upper limb strength. This group exhibited lower overall physical fitness, accounting for 43.88% of the male students.
- 2.
- Female Group Classification
Cluster 1 (Group with Weak Aerobic Endurance)
This group had the lowest scores in the 800 m run (67.87 points), indicating poor endurance. This cluster comprised 35.13% of the female students.
Cluster 2 (Group with Weak Core Strength)
Students in this cluster had the lowest scores in the sit-up test (17.65 points), reflecting insufficient core strength. This group accounted for 13.93% of the female students.
Cluster 3 (Group with Good Overall Abilities)
This group achieved the highest average scores across all indicators, demonstrating strong overall physical fitness. They excelled particularly in the standing long jump, 50 m sprint, and sit-up tests. This cluster represented 51.61% of the female students.
Cluster 4 (Group with Weak Lower Limb Explosive Power)
Students in this group scored the lowest in the standing long jump test (62.93 points), suggesting weak lower limb explosive power. This cluster comprised 10.32% of the female students.
- 3.
- Conclusions
As shown in Table 3 and Table 4 and Figure 18 and Figure 19, male students were categorized into three clusters: a group with outstanding overall fitness, a group with weak upper and lower limb strength, and a group with weak aerobic endurance and upper limb strength. Female students were divided into four clusters: those with weak aerobic endurance, weak core strength, strong overall abilities, and weak lower limb explosive power. Each cluster reflects distinct physical fitness profiles, providing a basis for targeted intervention strategies.
Building upon the clustering analysis results, this divergence in physical fitness trends is shaped by a combination of physiological structures, gender-specific training patterns, and test event designs. Moreover, the COVID-19 pandemic played a critical role [45,46], as restrictions on access to sports facilities, reduced physical activity, and lack of professional guidance during this period significantly impacted students’ physical condition. Pandemic-induced lifestyle changes—such as prolonged screen time, irregular sleep, and poor dietary habits—further exacerbated the decline in fitness levels, particularly among male students in strength- and endurance-based events, and among female students in flexibility-related domains.
The detailed analysis revealed that, in the male group, weaknesses were primarily concentrated in upper limb strength (pull-up test) and endurance (1000 m run), particularly in Clusters 2 and 3, which together accounted for 61.14% of male students. In the female group, deficiencies were more diverse, focusing on endurance (800 m run), core strength (sit-up test), and lower limb explosive power (standing long jump). These findings underscore the gender differences in physical fitness characteristics and highlight the necessity of developing gender-specific, personalized intervention strategies that address the distinct needs of each group to effectively enhance overall fitness levels.
4. Validation of Clustering Results
4.1. Algorithm Validation
To ensure the stability and rationality of the clustering results and feature importance analysis, four machine learning algorithms—Random Forest, decision tree, Gradient Boosting decision tree (GBDT), and logistic regression—were employed for validation. The evaluation metrics were divided into male and female groups and presented in tabular form (Table 5 and Table 6) to provide detailed numerical insights.
Table 5.
Evaluation metrics of four models for validation in the male group.
Table 6.
Evaluation metrics of four models for validation in the female group.
The clustering performance for male and female student groups was validated using four machine learning algorithms. The results demonstrated that all models effectively confirmed the stability and rationality of the clustering outcomes. Specifically, for the male group, the logistic regression model exhibited the highest performance, achieving superior values across all four evaluation metrics (accuracy, precision, recall, and F1 score). This indicates exceptional accuracy and stability. Gradient Boosting Trees and Random Forest models followed closely, delivering excellent performance, whereas the decision tree model showed slightly lower results, yet still maintained a high level of validation efficacy.
In the female group, the logistic regression model also performed exceptionally well, with all evaluation metrics approaching unity, thereby substantiating the reliability of the clustering results. Gradient Boosting Trees and Random Forest models demonstrated performance marginally lower than those observed in the male group but remained consistently stable and effective. The decision tree model, while exhibiting relatively weaker performance, still maintained a reasonable degree of accuracy.
Overall, the consistent validation results across the four machine learning algorithms affirm the reasonableness and stability of the clustering analysis. Notably, the logistic regression model achieved the best performance in both male and female groups, providing robust data support for subsequent physical fitness interventions.
4.2. Intervention Strategy Customization
Based on the clustering results, targeted intervention strategies have been developed for students at the two universities. These strategies aim to improve students’ physical fitness levels through scientifically designed and personalized training programs tailored to their specific physical characteristics.
4.2.1. Male Group
Cluster 1 (Excellent Comprehensive Ability Group, 38.86%): This group of students demonstrates well-balanced physical fitness, with scores in all categories higher than those of other clusters. To maintain this advantage, the training program should emphasize diversity and scientific approaches, further enhancing strength, speed, endurance, and flexibility. For example, a combination of strength training (such as weighted squats, pull-ups), speed training (such as sprinting and shuttle runs), and endurance training (such as interval running and long-distance running) will promote overall fitness improvement. Additionally, incorporating fun challenges, such as physical competitions and team training activities, can stimulate student interest and motivation, ensuring the long-term maintenance of high fitness levels.
Cluster 2 (Lower Limb Strength Weakness Group, 17.26%): Students in this cluster exhibit insufficient lower limb explosiveness and weak upper body strength, as evidenced by low scores in standing long jump and pull-up events. Interventions for this group should focus on targeted training, such as lower limb explosiveness exercises (e.g., squat jumps, lunge jumps, box jumps) to enhance lower limb muscle explosiveness. Additionally, assisted pull-up training (e.g., resistance band-assisted pull-ups, weighted push-ups) should be incorporated to gradually improve upper body strength. Core strength training (e.g., planks, sit-ups) should also be included to enhance body stability and promote balanced physical development. Through consistent and focused training, the physical capabilities of this group can be effectively improved.
Cluster 3 (Aerobic Endurance and Upper Limb Strength Weakness Group, 43.88%): This group shows relatively poor fitness performance, particularly in the 1000 m run and pull-up events, indicating deficiencies in endurance and upper body strength. The intervention for this group should primarily focus on aerobic endurance and basic strength training. For endurance training, methods such as jogging, interval running, and variable-speed running can be used, gradually increasing the duration and intensity of training to improve aerobic endurance. For strength training, pull-up assistance exercises (e.g., resistance band-assisted pull-ups, hanging exercises) and basic strength exercises (e.g., push-ups, burpees, core stability training) should be implemented to gradually increase upper body strength and overall basic strength. Regular goal setting and fitness progress evaluations should be conducted to motivate students, helping them gradually improve their fitness level.
4.2.2. Female Group
Cluster 1 (Aerobic Endurance Weakness Group, 35.13%): This group of female students shows the lowest scores in the 800 m run, indicating poor aerobic endurance. To improve endurance, systematic aerobic training should be implemented, such as jogging, interval running, and variable-speed running, with two to three sessions per week, gradually increasing the duration and intensity of running. Additionally, low-intensity aerobic exercises, such as jump rope, cycling, and swimming, can be introduced to increase the variety of training and enhance student participation. Regular testing of 800 m run performance should be conducted, with phase-wise quantitative goals set to progressively improve endurance and help students establish good aerobic exercise habits.
Cluster 2 (Core Strength Weakness Group, 13.93%): This group demonstrates weak core strength, as reflected in the lowest scores for sit-ups. Targeted core strength training should be implemented, such as sit-ups, planks, Russian twists, and leg raises, with a focus on strengthening the abdominal and lower back muscles. Initially, simple movements and low sets should be used, gradually increasing intensity and sets, such as progressing from 20 sit-ups per set to 30. In addition, whole-body stability training, such as bridge exercises and side planks, should be incorporated to enhance overall body balance and stability, preventing injuries during training. The ultimate goal is to strengthen core strength and improve physical fitness.
Cluster 3 (Comprehensive Ability Good Group, 51.61%): This group of female students performs well across all fitness indicators, demonstrating strong overall physical fitness. To maintain this advantage, the training plan should emphasize comprehensive physical development through diverse training programs that promote balanced improvement in different physical qualities. For example, combining strength training (e.g., weighted squats, burpees), speed training (e.g., 50 m sprints, shuttle runs), and flexibility training (e.g., stretching exercises, yoga) will further enhance physical fitness. Additionally, reinforcing training for standing long jump, 50 m sprint, and sit-ups will ensure the consolidation of strengths. Fun and competitive physical activities (e.g., relay races, challenges) should be incorporated to stimulate student enthusiasm and encourage sustained training, thereby maintaining physical fitness advantages.
Cluster 4 (Lower Limb Explosiveness Weakness Group, 10.32%): This group exhibits weak lower limb explosiveness, with the lowest scores in the standing long jump. To address this issue, targeted lower limb explosiveness training should be implemented, such as squat jumps, box jumps, lunge jumps, and single-leg jumps to strengthen lower limb muscle power. Additionally, strength training exercises, such as weighted squats and deadlines, should be used to improve muscle endurance and explosiveness in the lower limbs. For the standing long jump, technical guidance should be provided to optimize jump posture and ensure efficient force output. Regular evaluations of long jump performance should be conducted, and training plans should be adjusted according to progress to gradually enhance lower limb explosiveness and jumping performance.
By tailoring scientific and rational intervention measures to address specific issues within different groups, students’ physical fitness in weak areas can be effectively improved, leading to an overall increase in health levels. The male group should focus on improving endurance, strength, and lower limb explosiveness, while the female group should concentrate on enhancing endurance, core strength, and lower limb strength, ultimately achieving balanced physical development across different groups.
5. Conclusions
This study identified meaningful physical fitness profiles among university students through clustering and classification techniques, revealing clear differences in fitness patterns and intervention needs between male and female groups. The findings offer valuable insights for designing tailored health promotion strategies in educational settings.
For male students, three distinct groups were revealed: one demonstrating overall balanced physical fitness, another with weak lower limb strength, and a third with poor aerobic endurance and upper body strength. These results informed the development of focused interventions, such as combined training to maintain balanced performance and targeted regimens to improve specific deficiencies in strength and endurance. Female students were categorized into four groups: those with poor aerobic endurance, weak core strength, strong overall fitness, and inadequate lower limb explosiveness. Based on these groupings, corresponding training recommendations were proposed, including aerobic conditioning programs, progressive core stability training, and exercises to enhance muscular power and movement efficiency.
Importantly, the results highlighted gender-specific differences in the impact of fitness indicators. For instance, vital capacity was more strongly associated with physical fitness levels in male students, while flexibility and core strength had greater influence among females. These differentiated patterns were translated into actionable, group-specific recommendations, ensuring the practical relevance of the findings in guiding physical education curricula and individualized training plans.
Overall, this study demonstrates how data-driven approaches can inform precise, personalized interventions to enhance student health and fitness. Future research should continue to validate these intervention strategies longitudinally and explore scalable implementation frameworks that incorporate behavioral data and professional supervision, aiming to support sustainable improvements in student health outcomes.
6. Outlook
This study constructed a scientifically systematic analytical framework to perform an in-depth analysis of university students’ physical fitness data. Through multivariable clustering analysis and various machine learning models, this study achieved the efficient clustering of student groups and predicted trends in their health levels. Despite the achievements of this study, several limitations and avenues for future research remain.
First, the dataset used in this study is sourced from a specific region and university, which may introduce regional and institutional biases. Future research could expand the sample size to include students from different regions and age groups to enhance the generalizability and representativeness of the findings. Second, while this study employed various machine learning models for validation and prediction, the field of machine learning is constantly evolving, with new algorithms and models emerging. Future research could explore more advanced machine learning techniques to further improve the accuracy and robustness of physical fitness assessments for university students. Furthermore, the intervention strategies developed in this study are based on the current data analysis results; however, their practical application may be influenced by various factors. Future research could combine field-based intervention experiments to verify the effectiveness of these strategies and make adjustments based on feedback. On the technical front, with the advancement of big data and cloud computing technologies, future studies could analyze larger datasets to uncover deeper patterns and trends. Moreover, real-time data processing and analysis technologies could be explored to provide immediate feedback and dynamic adjustments for student health management. Finally, the results of this study provide decision-making support for educational departments and school sports administrators. However, the translation of research outcomes into actual policies and action plans requires further exploration and practical implementation. Future research could collaborate with policymakers to examine how to effectively integrate research findings into school sports reform policies.
In conclusion, this study provides new perspectives and methodologies for analyzing student physical health data. Future research will delve deeper into aspects such as data range, algorithm application, intervention effectiveness verification, and technological integration, with the aim of making a greater contribution to enhancing student physical health levels.
Author Contributions
R.G.: writing—review and editing, writing—original draft, and methodology. R.D.: investigation and supervision. N.L.: validation. L.Y.: data curation. C.C.: data curation. Y.C.: data curation. J.Z.: writing—review and editing, funding acquisition, and conceptualization. J.Y.: writing—review and editing, funding acquisition, and conceptualization. All authors have read and agreed to the published version of the manuscript.
Funding
This study was supported by the Yunnan Provincial Department of Education Research Fund Project “Research on the Construction of University Physical Education Learner Portraits Based on Big Data” (Project No.: 2023Y0939).
Institutional Review Board Statement
Not applicable.
Informed Consent Statement
Not applicable.
Data Availability Statement
The original contributions presented in this study are included in the article. Further inquiries can be directed to the corresponding author.
Conflicts of Interest
The authors declare no conflicts of interest.
References
- Zhang, S.; Qi, H.; Shan, Y.; Lan, H.; Cao, Y.; Xin, W.; Ou, T.; Tang, W. An Interview study of college students’ health emergency literacy in the context of COVID-19 normalized prevention and control. Altern. Ther. Health Med. 2023, 29, 293–297. [Google Scholar] [PubMed]
- World Health Organization. Global Recommendations on Physical Activity for Health; World Health Organization: Geneva, Switzerland, 2010; p. 60. [Google Scholar]
- Ortega, F.B.; Ruiz, J.R.; Castillo, M.J.; Sjöström, M. Physical fitness in childhood and adolescence: A powerful marker of health. Int. J. Obes. 2008, 32, 1–11. [Google Scholar] [CrossRef] [PubMed]
- Simon, S.D. Centers for Disease Control and Prevention (CDC); Springer: Berlin/Heidelberg, Germany, 2022; pp. 158–161. [Google Scholar]
- Keating, X.D.; Guan, J.; Piñero, J.C.; Bridges, D.M. A meta-analysis of college students’ physical activity behaviors. J. Am. Coll. Health. 2005, 54, 116–126. [Google Scholar] [CrossRef] [PubMed]
- World Health Organization. Global Action Plan on Physical Activity 2018–2030: More Active People for a Healthier World; World Health Organization: Geneva, Switzerland, 2019. [Google Scholar]
- Inchley, J.; Currie, D.B.; Budisavljevic, S.; Torsheim, T.; Jastad, A.; Cosma, A.; Kelly, C.; Arnasson, A.M. Spotlight on Adolescent Health and Wellbeing: Findings from the 2017/2018 Health Behaviour in School-Aged Children (HBSC) Survey in Europe and Canada. International Report. Volume 1: Key Findings; WHO Regional Office for Europe: Geneva, Switzerland, 2020. [Google Scholar]
- Kidokoro, T.; Tomkinson, G.R.; Lang, J.J.; Suzuki, K. Physical fitness before and during the COVID-19 pandemic: Results of annual national physical fitness surveillance among 16,647,699 Japanese children and adolescents between 2013 and 2021. J. Sport Health Sci. 2023, 12, 246–254. [Google Scholar] [CrossRef]
- Kuwahara, K.; Amagasa, S.; Yamaoka, K. Declines in Physical Activity and Cardiorespiratory Fitness After Implementing new National School Guidelines. J. Adolesc. Health. 2024, 74, 385–387. [Google Scholar] [CrossRef]
- Cho, K.O.; Lee, S.; Kim, Y.S. Physical activity and sedentary behavior are independently associated with weight in Korean adolescents. J. Lifestyle Med. 2014, 4, 47. [Google Scholar] [CrossRef]
- Yao, S. Construction of relationship model between college students’ psychological status and epidemic situation based on BP neural network. Comput. Intell. Neurosci. 2022, 2022, 5115432. [Google Scholar] [CrossRef]
- Zhao, H.; Shu, C. Original Research Article Student sports data analysis and physical fitness evaluation based on convolutional neural networks. J. Auton. Intell. 2024, 7. [Google Scholar] [CrossRef]
- Akay, M.F.; Çetin, E.; Yarım, İ.; Bozkurt, Ö.; Erdem, S. Development of Physical Fitness Prediction Models for Turkish Secondary School Students Using Machine Learning Methods. Gümüşhane Üniversitesi Fen Bilim. Derg. 2018, 1, 7–10. [Google Scholar]
- Zhang, L.; Jiao, Y. Analysis and Research on College Students’ Physical Fitness Test Data Based on K-means Clustering Algorithm. In Proceedings of the 2023 4th International Conference on Machine Learning and Computer Application, Hangzhou, China, 27–29 October 2023. [Google Scholar]
- Zhang, C. Application of K-means clustering algorithm in mental health education evaluation of college students. In Innovative Computing, Proceedings of the 5th International Conference on Innovative Computing, Guam, GU, USA, 11-14 January 2022; Springer: Berlin/Heidelberg, Germany, 2022. [Google Scholar]
- Awaluddin, M.F.; Nurtanio, I.; Zainuddin, Z. Mapping and Prediction of Stunting Potential Using K-Means Clustering and Support Vector Regression (Case Study of Palopo City). In Proceedings of the 2024 7th International Conference on Information and Communications Technology (ICOIACT), Ishikawa, Japan, 20–21 November 2024; IEEE: Piscataway, NJ, USA, 2024. [Google Scholar]
- Huang, X.; Gao, J.; Huang, H. Semi-supervised Clustering Ensemble with Pairwise Constraints Based on PCA Dimension Reduction. Comput. Mod. 2021, 1, 94–99. [Google Scholar]
- Xu, B.; Zheng, L.; Wang, K.; Song, C. Dim targets detection based on local gray probability analysis. J. Laser Infrared 2005, 35, 187189. [Google Scholar]
- Pearson, K. LIII. On lines and planes of closest fit to systems of points in space. Lond. Edinb. Dublin Philos. Mag. J. Sci. 1901, 2, 559–572. [Google Scholar] [CrossRef]
- Miao, R.; Li, B. A user-portraits-based recommendation algorithm for traditional short video industry and security management of user privacy in social networks. Technol. Forecast. Soc. Chang. 2022, 185, 122103. [Google Scholar] [CrossRef]
- Wang, S.; Liu, C.; Xing, S. A Review of K-means Clustering Algorithm Research. J. East China Jiaotong Univ. 2022, 39, 119–126. [Google Scholar]
- Shen, G.; Jiang, Z. A canopy bisecting k-means algorithm based on density and central index. Comput. Eng. Sci. 2022, 44, 372. [Google Scholar]
- Wang, J.; Wang, J.; Song, J.; Xu, X.; Shen, H.T.; Li, S. Optimized cartesian k-means. IEEE Trans. Knowl. Data Eng. 2014, 27, 180–192. [Google Scholar] [CrossRef]
- Ji, R.; Yang, J.; Wu, Y.; Li, Y.; Li, R.; Chen, J.; Yang, J. Construction and analysis of students’ physical health portrait based on principal component analysis improved Canopy-K-means algorithm. J. Supercomput. 2024, 80, 15940–15973. [Google Scholar] [CrossRef]
- Kleinbaum, D.G.; Dietz, K.; Gail, M.; Klein, M.; Klein, M. Logistic Regression; Springer: Berlin/Heidelberg, Germany, 2002. [Google Scholar]
- Harris, J.K. Primer on binary logistic regression. Fam. Med. Community Health 2021, 9, e1290. [Google Scholar] [CrossRef]
- Ying, L.U. Decision tree methods: Applications for classification and prediction. Shanghai Arch. Psychiatry 2015, 27, 130. [Google Scholar]
- Breiman, L. Random forests. Mach. Learn. 2001, 45, 5–32. [Google Scholar] [CrossRef]
- Chen, T.; Guestrin, C. Xgboost: A scalable tree boosting system. In Proceedings of the 22nd ACM SIGKDD International Conference on Knowledge Discovery and Data Mining, San Francisco, CA, USA, 13–17 August 2016. [Google Scholar]
- Cui, S.; Wang, D.; Wang, S.; Xia, J.; Wang, Y.; Jin, Y. Prostate cancer diagnosis method based on gmm-rbf neural network. J. Manag. Sci. 2018, 31, 33–47. [Google Scholar]
- Wang, S.; Wang, Y.; Wang, D.; Yin, Y.; Wang, Y.; Jin, Y. An improved random forest-based rule extraction method for breast cancer diagnosis. Appl. Soft Comput. 2020, 86, 105941. [Google Scholar] [CrossRef]
- Groppe, D.M.; Urbach, T.P.; Kutas, M. Mass univariate analysis of event-related brain potentials/fields I: A critical tutorial review. Psychophysiology 2011, 48, 1711–1725. [Google Scholar] [CrossRef]
- Schober, P.; Boer, C.; Schwarte, L.A. Correlation coefficients: Appropriate use and interpretation. Anesth. Analg. 2018, 126, 1763–1768. [Google Scholar] [CrossRef]
- Ratner, B. The correlation coefficient: Its values range between +1/−1, or do they? J. Target. Meas. Anal. Mark. 2009, 17, 139–142. [Google Scholar] [CrossRef]
- Cohen, J. Statistical Power Analysis for the Behavioral Sciences; Routledge: London, UK, 2013. [Google Scholar]
- Bholowalia, P.; Kumar, A. EBK-means: A clustering technique based on elbow method and k-means in WSN. Int. J. Comput. Appl. 2014, 105, 9. [Google Scholar]
- Wang, X.; Xu, Y. An improved index for clustering validation based on Silhouette index and Calinski-Harabasz index. In IOP Conference Series: Materials Science and Engineering; IOP Publishing: Bristol, UK, 2019. [Google Scholar]
- Liang, S.; Han, D.; Yang, Y. Cluster validity index for irregular clustering results. Appl. Soft Comput. 2020, 95, 106583. [Google Scholar] [CrossRef]
- Jiang, W.; Chi, W.; Yao, L.; Zheng, C. Model Construction of Enterprise Business Portrait Based on Cluster Analysis and Random Forest. In Proceedings of the 2024 IEEE 13th International Conference on Communication Systems and Network Technologies (CSNT), Jabalpur, India, 6–7 April 2024; IEEE: Piscataway, NJ, USA, 2024. [Google Scholar]
- Zhai, M.Y.; Cheng, J.; Wang, S.T.; Wang, Y.Z. Portraying student education based on the k-prototype clustering method. J. Dalian Univ. Technol. (Soc. Sci.) 2021, 42, 22–31. [Google Scholar]
- Ji, H.; Ni, F.; Liu, J.; Lu, Q.; Zhang, X.; Que, Z. Prediction of telecom customer churn based on XGB-BFS feature selection algorithm. Comput. Technol. Dev. 2021, 31, 21–25. [Google Scholar]
- Molnar, C. Interpretable Machine Learning; Lulu. com: Morrisville, NA, USA, 2020. [Google Scholar]
- Rudin, C. Stop explaining black box machine learning models for high stakes decisions and use interpretable models instead. Nat. Mach. Intell. 2019, 1, 206–215. [Google Scholar] [CrossRef]
- Lundberg, S.M.; Lee, S. A unified approach to interpreting model predictions. Adv. Neural Inf. Process. Syst. 2017, 30, 4768–4777. [Google Scholar]
- Guo, Y.; Liao, M.; Cai, W.; Yu, X.; Li, S.; Ke, X.; Tan, S.; Luo, Z.; Cui, Y.; Wang, Q. Physical activity, screen exposure and sleep among students during the pandemic of COVID-19. Sci. Rep. 2021, 11, 8529. [Google Scholar] [CrossRef] [PubMed]
- Yang, X.; Yu, H.; Liu, M.; Zhang, J.; Tang, B.; Yuan, S.; Gasevic, D.; Paul, K.; Wang, P.; He, Q. The impact of a health education intervention on health behaviors and mental health among Chinese college students. J. Am. Coll. Health. 2020, 68, 587–592. [Google Scholar] [CrossRef] [PubMed]
Disclaimer/Publisher’s Note: The statements, opinions and data contained in all publications are solely those of the individual author(s) and contributor(s) and not of MDPI and/or the editor(s). MDPI and/or the editor(s) disclaim responsibility for any injury to people or property resulting from any ideas, methods, instructions or products referred to in the content. |
© 2025 by the authors. Licensee MDPI, Basel, Switzerland. This article is an open access article distributed under the terms and conditions of the Creative Commons Attribution (CC BY) license (https://creativecommons.org/licenses/by/4.0/).