Article

Smart Buildings and Digital Twin to Monitoring the Efficiency and Wellness of Working Environments: A Case Study on IoT Integration and Data-Driven Management

1
Department of Astronautics, Electrical and Energy Engineering (DIAEE), Sapienza University of Rome, 00184 Rome, Italy
2
Ordine degli Ingegneri della Provincia di Roma, 00185 Rome, Italy
*
Author to whom correspondence should be addressed.
Appl. Sci. 2025, 15(9), 4939; https://doi.org/10.3390/app15094939
Submission received: 20 December 2024 / Revised: 19 March 2025 / Accepted: 23 April 2025 / Published: 29 April 2025

Abstract

:
Quality and efficiency of the work environment are essential to the well-being, health and productivity of employees. Despite the increasing focus on these aspects, many workplaces currently do not fully meet the needs and expectations of employees, with negative consequences for their well-being and productivity. The research aims to develop a system based on the Smart Building and Digital Twin paradigm, focusing on the implementation of various IoT components, the creation of automation flows for energy-efficient lighting, HVAC and indoor air quality control systems, and decision support through real-time data visualization enabled by user interfaces and dashboards integrating the geometric and information model (BIM). The system also aims to provide a tool for both monitoring and simulation/planning/decision support through the processing and development of machine learning (ML) algorithms. In relation to emergency management, real-time data can be acquired, allowing information to be shared with users and building managers through the creation of dashboards and visual analysis. After defining the functional requirements and identifying all3 the monitorable quantities that can be translated into requirements, the system architecture is described, the implementation of the case study is illustrated and the preliminary results of the first data collection campaign and initial estimates of future forecasts are shown.

1. Introduction

Satisfying the needs of employees is crucial for building managers as it has a major impact on well-being and productivity [1]. Although information and communication technologies (ICT) have enabled greater control and customization of building systems, they may not yet fully meet users’ expectations. Recent research has aimed to help managers understand the activities, preferences and conditions of employees in their working environment by collecting and integrating data generated by occupants and buildings themselves [2]. However, challenges remain in representing domain knowledge and integrating heterogeneous data.
In the last decade, the Architecture, Engineering, Construction and Operations (AECO) sector has shown a significantly increased interest in data-driven management of built environments and the development of the Digital Twin (DT) concept [3]. Semantic Web technologies and the Linked Building Data (LBD) approach have facilitated the integration of information from different sources, overcoming the limitations of BIM. This has enabled a better understanding of the interactions between buildings and occupants, initiating a shift towards building management approaches centered on occupants [4].
Buildings are responsible for about 40% of total energy consumption in industrialized countries, and therefore offer great opportunities and potential for improving energy efficiency through the introduction of advanced Smart Building-oriented technological solutions.
Advances in building intelligence involve the use of connected devices and automation tools, such as sensors and actuators, which enable efficient energy management while maintaining occupant comfort. However, internal responses to control changes can be slow, resulting in periods of temporary discomfort [5]. Traditionally, efforts have been made to maintain stable internal conditions through constant reference points, but this approach is energy inefficient. With the increase of renewable energy sources, buildings need to offer more energy flexibility, such as Demand Response programs [6,7]. Model Predictive Control (MPC) is well suited to these new requirements.
To address the practical challenges of applying MPC, predictive models need to be developed that take into account the physical properties of the building, weather forecasts, occupancy forecasts and thus, consumption [8]. The developed framework creates a virtual replica of the building’s physical environment and helps building managers to optimize energy use and monitor building performance while ensuring adequate comfort levels for users.

1.1. Literature Review

The workplace is a complex system in which the physical space and its occupants interact dynamically. It is crucial to evaluate the performance of the workplace by understanding how it supports workers’ activities and meets their needs. Many studies have examined the impact of various physical and non-physical factors on worker satisfaction, productivity and well-being [9]. To understand how these factors affect workers, it is necessary to collect and integrate both the objective characteristics of buildings and the subjective conditions of workers. New approaches, such as the use of smartphone apps and wearable devices, are replacing traditional methods, such as post-occupancy surveys to collect real-time feedback from occupants [10]. Occupant-centered workplace management requires a system that integrates data generated by buildings and by workers themselves. Recent studies have demonstrated the potential of using BIM, sensor networks and semantic web technologies for this purpose [4,11]. However, specific solutions for the management of indoor work environments are still under development.
He et al. presented an innovative system for night-time occupancy detection in university buildings, using an algorithm based on the brightness of lights instead of additional sensors. This method exploits existing surveillance cameras, achieving 98.67% accuracy and improving building management. In addition, it introduces a 3D GIS model based on photogrammetry and laser scanning for a more accurate representation of interior spaces. The study offers an effective and cost-efficient solution to optimize campus security and energy efficiency, with potential applications in other building contexts [12]. Tsang et al. explored an occupant-centric approach to monitoring and improving indoor environmental quality (IEQ) in a high-rise office building in Hong Kong using an IoT sensor network. For 15 months, real-time data was collected from 12 points in the building, monitoring parameters such as temperature, humidity, air quality, lighting and noise. This method, which is more accurate than traditional periodic surveys, made it possible to analyze instantaneous environmental changes and improve space management, contributing to occupant well-being, comfort and productivity. The study highlights the importance of intelligent, tailored solutions to optimize both the human experience and energy efficiency in buildings [13]. Jing et al. proposed an advanced home energy management system (EMS) to optimally integrate electric vehicles (EVs) and photovoltaic (PV) systems to improve grid sustainability and reduce energy costs for homeowners. The method uses an optimization strategy based on time-of-use (TOU) tariffs, household consumption patterns and EV variables, such as charging times and battery status. The system operates in two phases: one based on solar availability and the other on PV generation forecasts. The results show a significant reduction in energy costs and improved electricity stabilization, demonstrating that homes with PV and EVs perform better than homes with EVs only [14]. Sayed et al. proposed an innovative approach to improve energy efficiency in the home by integrating a digital twin (DT) on the home assistant platform. Using IoT devices and sensors, the system creates a virtual replica of the home environment, providing real-time data on energy consumption, personalized suggestions for savings and an advanced occupancy detection mechanism based on machine learning (ML). Tested in the lab, the system achieved 95.12% accuracy in occupancy detection and 80% positive feedback for its recommendation system. The results demonstrate the potential of DT technology to reduce energy waste and costs, promote sustainable practices and improve user comfort in smart homes [15].
The integration of BIM with static and dynamic data has become increasingly important in the AECO sector, leading to the emergence of the DT concept [16,17,18,19]. Research has shown that the use of Semantic Web technologies and related data can facilitate the development of semantic DT enriched with specific information [20,21]. Despite the lack of a standardized approach to DT creation, the use of a modular approach with BIM data can provide flexibility and scalability [20,22,23]. This modular DT framework can be realized through the adoption of standardized information containers, such as Industry Foundation Classes (IFC) and the building SMART Data Dictionary (bSDD), which allow different information to be stored and exchanged while ensuring compatibility [24,25,26,27]. Previous studies have demonstrated the effectiveness of these containers for storing, integrating and visualizing building information in a variety of use cases [28,29]. Based on this knowledge, a customized platform based on these standards is proposed for the development of the DT prototype of some working environments.

1.2. Research Objective

The development of sensor networks to monitor and control indoor environments relies on DT technology, IoT devices that enhance real-time data collection and management [30,31]. A DT framework enables the creation of a virtual replica of physical space, allowing precise monitoring and optimization of key environmental and energy parameters [32].
An IoT-based sensor network is proposed to enable the seamless integration of data acquisition, real-time visualization, predictive analysis and automated control within intelligent indoor environments. The system consists of three basic components: sensor layers, gateways and back-end processing platforms. Sensors collect key data such as energy consumption, indoor air quality (IAQ), thermal comfort, lighting and occupancy, while gateways transmit this information to a centralized back-end system. The back-end infrastructure uses advanced data processing, machine learning algorithms and visualization tools to enable real-time assessment and decision-making to optimize indoor environmental conditions [33].
A critical aspect of the proposed DT model is the interoperability of communication protocols, ensuring compatibility across multiple IoT devices. The system uses MQTT and HTTP for real-time data transfer, Modbus for energy meters and ONVIF for video surveillance. In addition, the back-end infrastructure is designed for highly efficient data storage and processing, using PostgreSQL, InfluxDB and Power BI dashboards for data visualization and long-term storage [34].
The proposed DT-based framework aims to improve energy efficiency, environmental quality and space use in smart buildings. By integrating real-time monitoring, predictive analytics and automated control mechanisms, the system contributes to improved sustainability, occupant comfort and operational efficiency in indoor environments.

2. Methodology

The development of the DT for monitoring and controlling the indoor air quality and energy aspects of the building was conducted through a structured methodological process, aimed at ensuring the effective integration of digital technologies with the operational needs of the facility. Initially, an in-depth analysis of the specific requirements was carried out, based on Michael Grieves’ definition and the needs of the case study. This made it possible to identify the key parameters to be monitored, the required functionalities and the key performance indicators for assessing the effectiveness of DT. Next, the system architecture was designed, ensuring a high level of interoperability between devices and communication protocols. Suitable protocols were chosen for the transmission of environmental and energy data and integrated communication networks that would allow a stable connection between sensors, actuators and control systems. In parallel, an infrastructure for data collection and management was developed, implementing advanced platforms for information processing and visualization.
The first step in creating the DT is to clearly define its objectives and functional scope. The primary goal is to monitor and optimize indoor air quality, energy consumption and overall environmental comfort, while ensuring seamless interoperability between hardware and software components. The system must support real-time data collection, predictive analytics through machine learning and automated control mechanisms. A network of IoT devices must be deployed to collect real-time environmental and energy data. Smart electricity meters and energy monitoring plugs will measure instantaneous and average electricity consumption, while dedicated air quality sensors will track parameters such as temperature, humidity, volatile organic compounds (tVOCs), particulate matter (PM2.5 and PM10) and CO2 concentrations. Additional thermal comfort and lighting sensors will be installed to assess comfort metrics, such as Predicted Mean Vote (PMV) and Percentage of Dissatisfied (PPD). Occupancy detection will be achieved using motion sensors and camera-based people counting systems powered by computer vision algorithms. Actuators, such as automated window mechanisms or HVAC, will be integrated to dynamically respond to environmental changes. The interoperability of the system relies on a well-structured communication infrastructure. IoT devices and sensors will communicate using MQTT and HTTP protocols, while Modbus will be used for energy meters. The data transmission network will be based on a combination of wi-fi and ethernet, with local area network (LAN) connections providing stability for critical components such as energy meters and weather controllers. A central message broker, such as Mosquitto MQTT, will facilitate real-time data exchange between devices. Data will be processed and stored on a dedicated infrastructure, ensuring long-term archiving and real-time availability. PostgreSQL and InfluxDB will handle structured and time-series data respectively, while lightweight databases such as SQLite can be used for local caching. A Linux-based server with multi-core CPU capabilities, at least 64GB of RAM and a CUDA-enabled GPU will be required to efficiently process ML algorithms. Uninterruptible power supplies (UPS) will be required to maintain system stability in the event of power failures. Once the data collection system is in place, the next phase is to develop predictive models for energy consumption, indoor air quality and environmental comfort. ML techniques will be applied to historical data sets to train models capable of predicting trends and detecting anomalies. The system will use open source libraries such as TensorFlow, Scikit-learn and KNIME to develop predictive analytics pipelines. Models will be continuously refined through real-time feedback loops to improve accuracy and adaptability. Automation mechanisms will be implemented to optimize operational efficiency. By integrating control logic with predictive insights, the system will dynamically adjust ventilation, heating and lighting conditions to maintain optimal indoor comfort while minimizing energy consumption. Edge computing capabilities will be used to process time-sensitive data locally, reducing latency in decision-making processes. A comprehensive visualization platform will be developed for effective system monitoring and control. Interactive dashboards will provide real-time insight into key performance indicators (KPIs) such as power consumption, air quality trends and occupancy levels. Power BI will be used to aggregate and present data in an intuitive format, while Node-RED will facilitate workflow automation and integration between different system components. A 3D visualization module will be integrated, allowing facility managers to interact with a digital representation of the building and make informed decisions based on real-time sensor data. Before full deployment, the DT will undergo rigorous validation to ensure accuracy and reliability. Real-world data will be compared with simulated predictions to evaluate the performance of ML models. Stress tests will be conducted to assess the resilience of the system under different operational conditions. The validation phase will also involve refining control algorithms to improve system responsiveness and efficiency. Through this structured approach, a fully functional DT can be replicated with high fidelity. The integration of real-time data processing, predictive analytics and automated control mechanisms ensures that the system remains adaptive and scalable. The combination of advanced visualization tools and a secure infrastructure enables efficient facility management, leading to the monitoring of energy efficiency and indoor environmental quality.
Based on these assumptions, it is possible to describe and list the specific needs of a DT model, identified as follows:
  • Manage IoT data in real time and store it in dedicated DBs;
  • Real-time data visualization using three-dimensional models;
  • Application of machine learning models to the data for its interpretation, prediction and processing of aggregated metrics on dashboards optimized for human–computer interaction;
  • Implementations on physical elements based on collected data;
  • Maintenance and management of infrastructure with appropriate security standards at different levels of access;
  • Use of open data to share information with external databases (maintaining security levels).
The requirements defined in this way were then translated into Capabilities, based on “The DT Capabilities Periodic Table” (Digital Twin Consortium) and developed into a DT project [35].

2.1. Functional Requirements

Given the application to be developed, the key elements identified for the realization of the DT model of the infrastructure are:
  • Analysis and forecasting of the power consumption of the main equipment that make up the case study:
    • monitoring of electrical consumers using smart plugs to analyze instantaneous and average power (W), status (on-off) and time of use (min);
    • monitoring the consumption of electric actuators (door and window movement) in terms of instantaneous power (W), status (on-off) and time of use (min);
    • monitoring of general electrical consumption of utilities, lighting, air conditioning;
  • Indoor Environmental Quality (IEQ) monitoring and forecasting:
    • analysis and prediction of air quality using dedicated sensors (tVOC, PM2.5, PM10, temperature, relative humidity, CO2) to obtain complex data (IAQ and CO2 limit UNI EN ISO 16000 [36]);
    • analysis and prediction of thermal comfort using dedicated sensors (temperature, relative humidity) to obtain complex data (PMV, PPD);
    • analysis and prediction of lighting comfort using dedicated sensors (luminosity);
    • control of window opening (open/closed);
  • Analysis of presence through dedicated sensors (presence). Possibility of counting people (number) using computer vision with dedicated cameras;
  • Interoperability of communication protocols (MQTT, HTTP, etc.) and use of common standards (Wi-Fi, Ethernet, Zigbee, etc.) with the possibility of external access to data [37];
  • Data management on dedicated infrastructure;
  • Data visualization through aggregated metrics.
These functional requirements identify all the monitorable quantities within the case study and can be translated into system requirements.

2.2. System Requirements

The operability of the infrastructure is ensured by means of a system requirements analysis that indicates in detail the expected characteristics:
  • Communication protocols used:
    • MQTT for environmental sensors;
    • HTTP for environmental sensors and video streams;
    • Modbus for energy meters;
    • OPC UA as an alternative to the previous points [38].
  • Communication networks:
    • IP over Wi-Fi (WLAN) for environmental sensors and actuators;
    • IP over LAN for electricity meters and weather controllers.
  • Data centralizers:
    • Mosquito MQTT Broker Service;
    • Schneider EcoStruxure for power-meter.
  • Data platform:
    • NodeRed;
    • data processing using custom software ML techniques (Python 3.13, JavaScript ES 15);
    • Power BI dashboard for integrated data presentation based on functional requirements;
    • 3D model visualization with metadata.
  • Database (long-term storage of 3 years or 1 Tb of data):
    • PostgreSQL;
    • InfluxDB;
    • SQLlite.
  • Linux data server and local processing and virtualization with GPU video processing capability:
    • Multicore CPU with at least 8 cores, 16 threads, 2.2 ghz;
    • 1Tb storage;
    • CUDA hardware GPU with 12 gb RAM for AI algorithm processing and video stream display;
    • 64 gb RAM;
    • PSU with uninterruptible power supply.
  • Machine learning systems based on open source and commercial libraries with potential use of dedicated data processing software (e.g., KNIME 4.18);
  • Sensor accuracy based on devices on the market for home automation;
  • Multi-user access from the DT platform based on concepts inherited from ISO 27000 [39] in order to guarantee at least one user and one administrator level.

2.3. Key Performance Indicators

The main KPIs to be achieved by the whole system are then defined:
  • Monitoring and forecasting of electrical and thermal consumption at the integrated level of the rooms and of each element connected to the system (W, kWh, time);
  • Monitoring and prediction of indoor air quality (IAQ, CO2, time) and thermal comfort (PMD, PVM, time);
  • Monitor and predict occupancy (people/time);
  • Optimization of thermal comfort, air quality and noise reduction by creating specific algorithms for the movement of windows and doors;
  • Reducing energy consumption and noise and improving indoor air quality and environmental comfort through the creation of dedicated algorithms for space utilization proposals;
  • Real-time monitoring through data visualization via 3D models and dashboards;
  • Data storage for 3 years;
  • Maintaining data security through authentication systems for multi-user access to the platform;
  • Maintenance of system interoperability through the use of standard communication protocols (MQTT, HTTP, API, REST, ONVIF, etc.).

2.4. Validation Matrix

The different requirement levels and KPIs are correlated in the following validation matrix (Table 1).

3. System Development

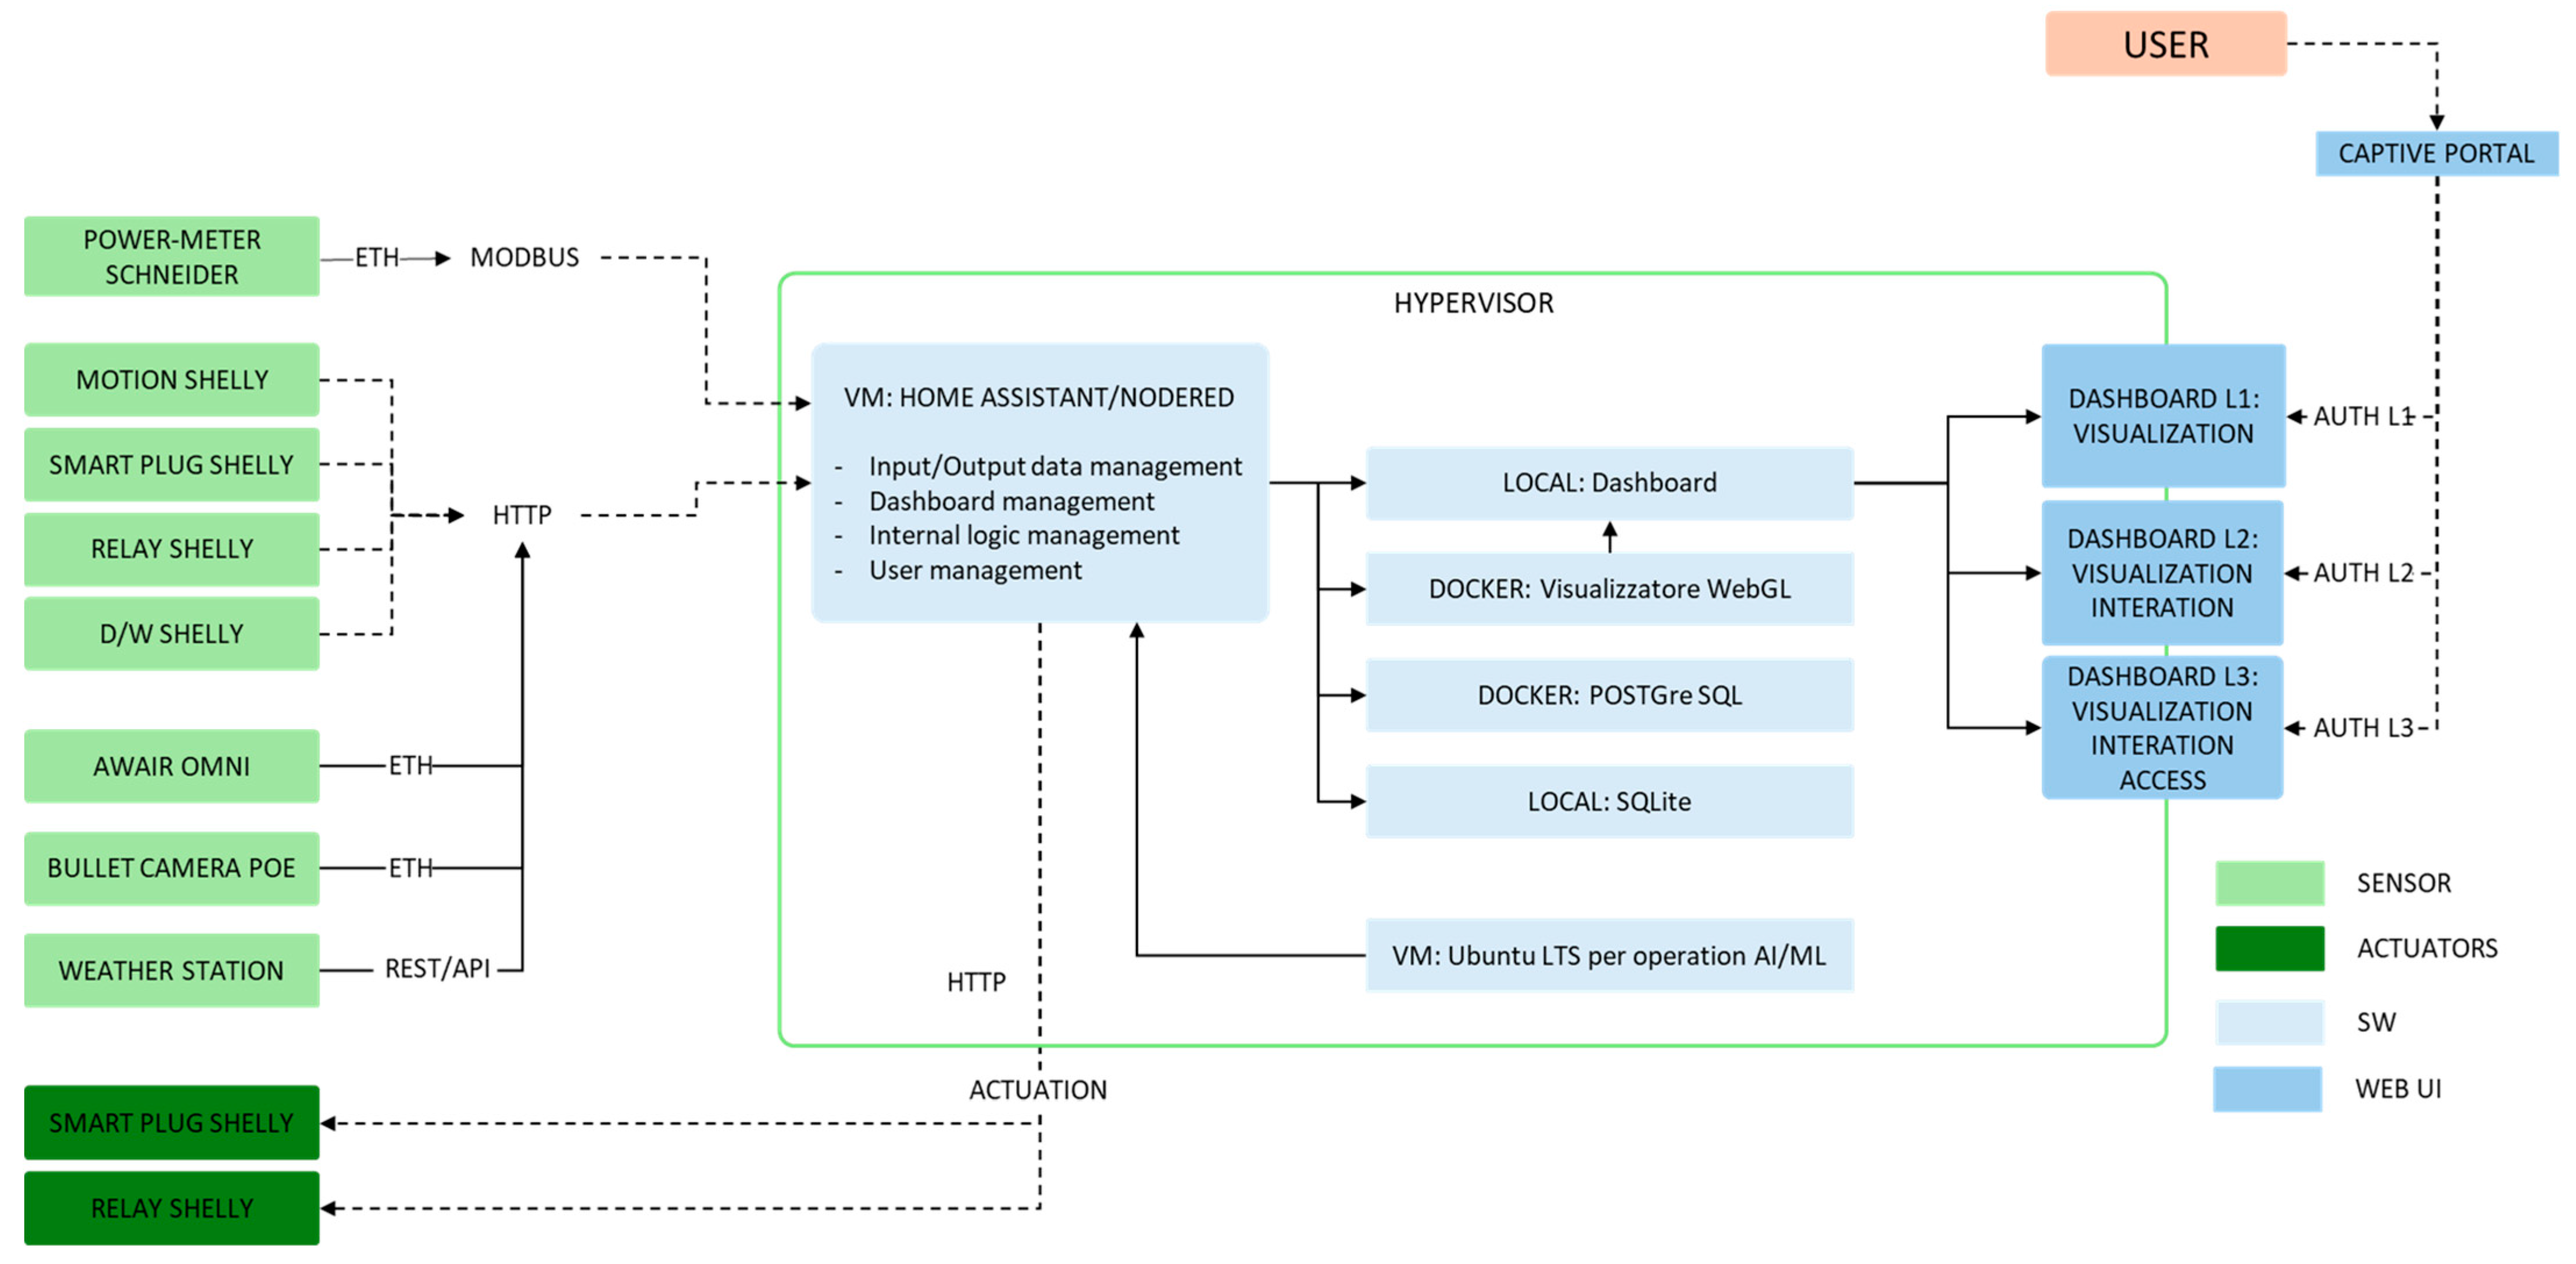
3.1. Software Architecture

This chapter describes the selected software architecture, including the communication protocols and the data management platform with associated services. Figure 1 shows the developed architecture schematically.

3.2. Communication Protocols

Communication between the devices and the EDGE server node is managed using different IoT communication protocols. The use of the HTTP protocol allows connection and exchange with any device that has the appropriate configuration and registration on the general network, thus respecting a stable and reliable communication standard as required by DT infrastructures. MQTT, on the other hand, is a messaging protocol designed for IoT networks. The use of the MQTT protocol requires a specific Broker service to be run separately as a service within server nodes or centralizers. Where possible, the use of HTTP is preferred to reduce the number of software services active on the server. Modbus is a communication protocol used to transfer information over serial lines between industry-standard electronic devices. ONVIF is a standard dedicated to the management of video streams from IP cameras and is preferable to data access via FTP as it allows individual frames to be requested directly from the device and has low latency. REST handles data calls over http via APIs used to communicate with local or external servers to access the available data. Another advantage is the ability to request traffic from the management platform as needed to reduce network traffic, determine the update frequency for each device and ensure system stability.
During the design of the infrastructure, an attempt was made to standardize the type of data protocols used as much as possible, preferring hardware from the same manufacturer (where possible) and equipped with open communication libraries already integrated in the main existing DT platforms. For example, Shelly peripherals are equipped internally with a web server to allow direct access to the network without the need to configure a dedicated MQTT broker service. These devices are therefore able to send traffic measurements over a standard connection. The Modbus protocol is used to connect Schneider electricity meters; these devices are wired and physically integrated into the network via Ethernet cable. The weather station works via REST API through the manufacturer’s Davis service. Finally, the cameras operate via ONVIF. Each peripheral device has a static IP assigned to it when it connects to the network segment; these IPs are used to connect the specific peripheral device to the management platform and ensure its continuity in the event of a system reboot.
Schneider’s internal power meter management uses an internal radio protocol for wireless communication between the current clamps and the power meter. The system is configurable via proprietary ECO Struxure 4.0. When integrating other devices that use MQTT and do not have an internal web server, the Mosquito Broker is used. This open source message broker implements the above protocol and is widely used for lighting message management in various communication scenarios.

3.3. Data Platform

The choice of platform was driven by the experimental nature of the use case. Therefore, platforms and open source software that could be modified and integrated with custom components were preferred. Based on previous experience and the state of the art in the field, different platforms based on similar operating logics were compared. The following platforms were selected:
  • Node-RED: a platform developed by IBM, now open source, based on JavaScript Node.js for event and peripheral management, it supports workflow through nodes and offers great flexibility [40].
  • Open Hab, an event and peripheral management platform developed by IntelliJ, based on Java, has a web-based approach to event creation and management. The platform supports over 200 different OEMs through the use of bindings. Built-in support for application management [41].
  • Open Remote, a Java-based platform that provides a web-based approach to creating and managing peripherals. App-based management support possible [42].
  • Home Assistant, platform developed in Python (https://www.python.org/), combined with a web-based approach, with support for agnostic hardware from any vendor, and support for management via integrated app [43].
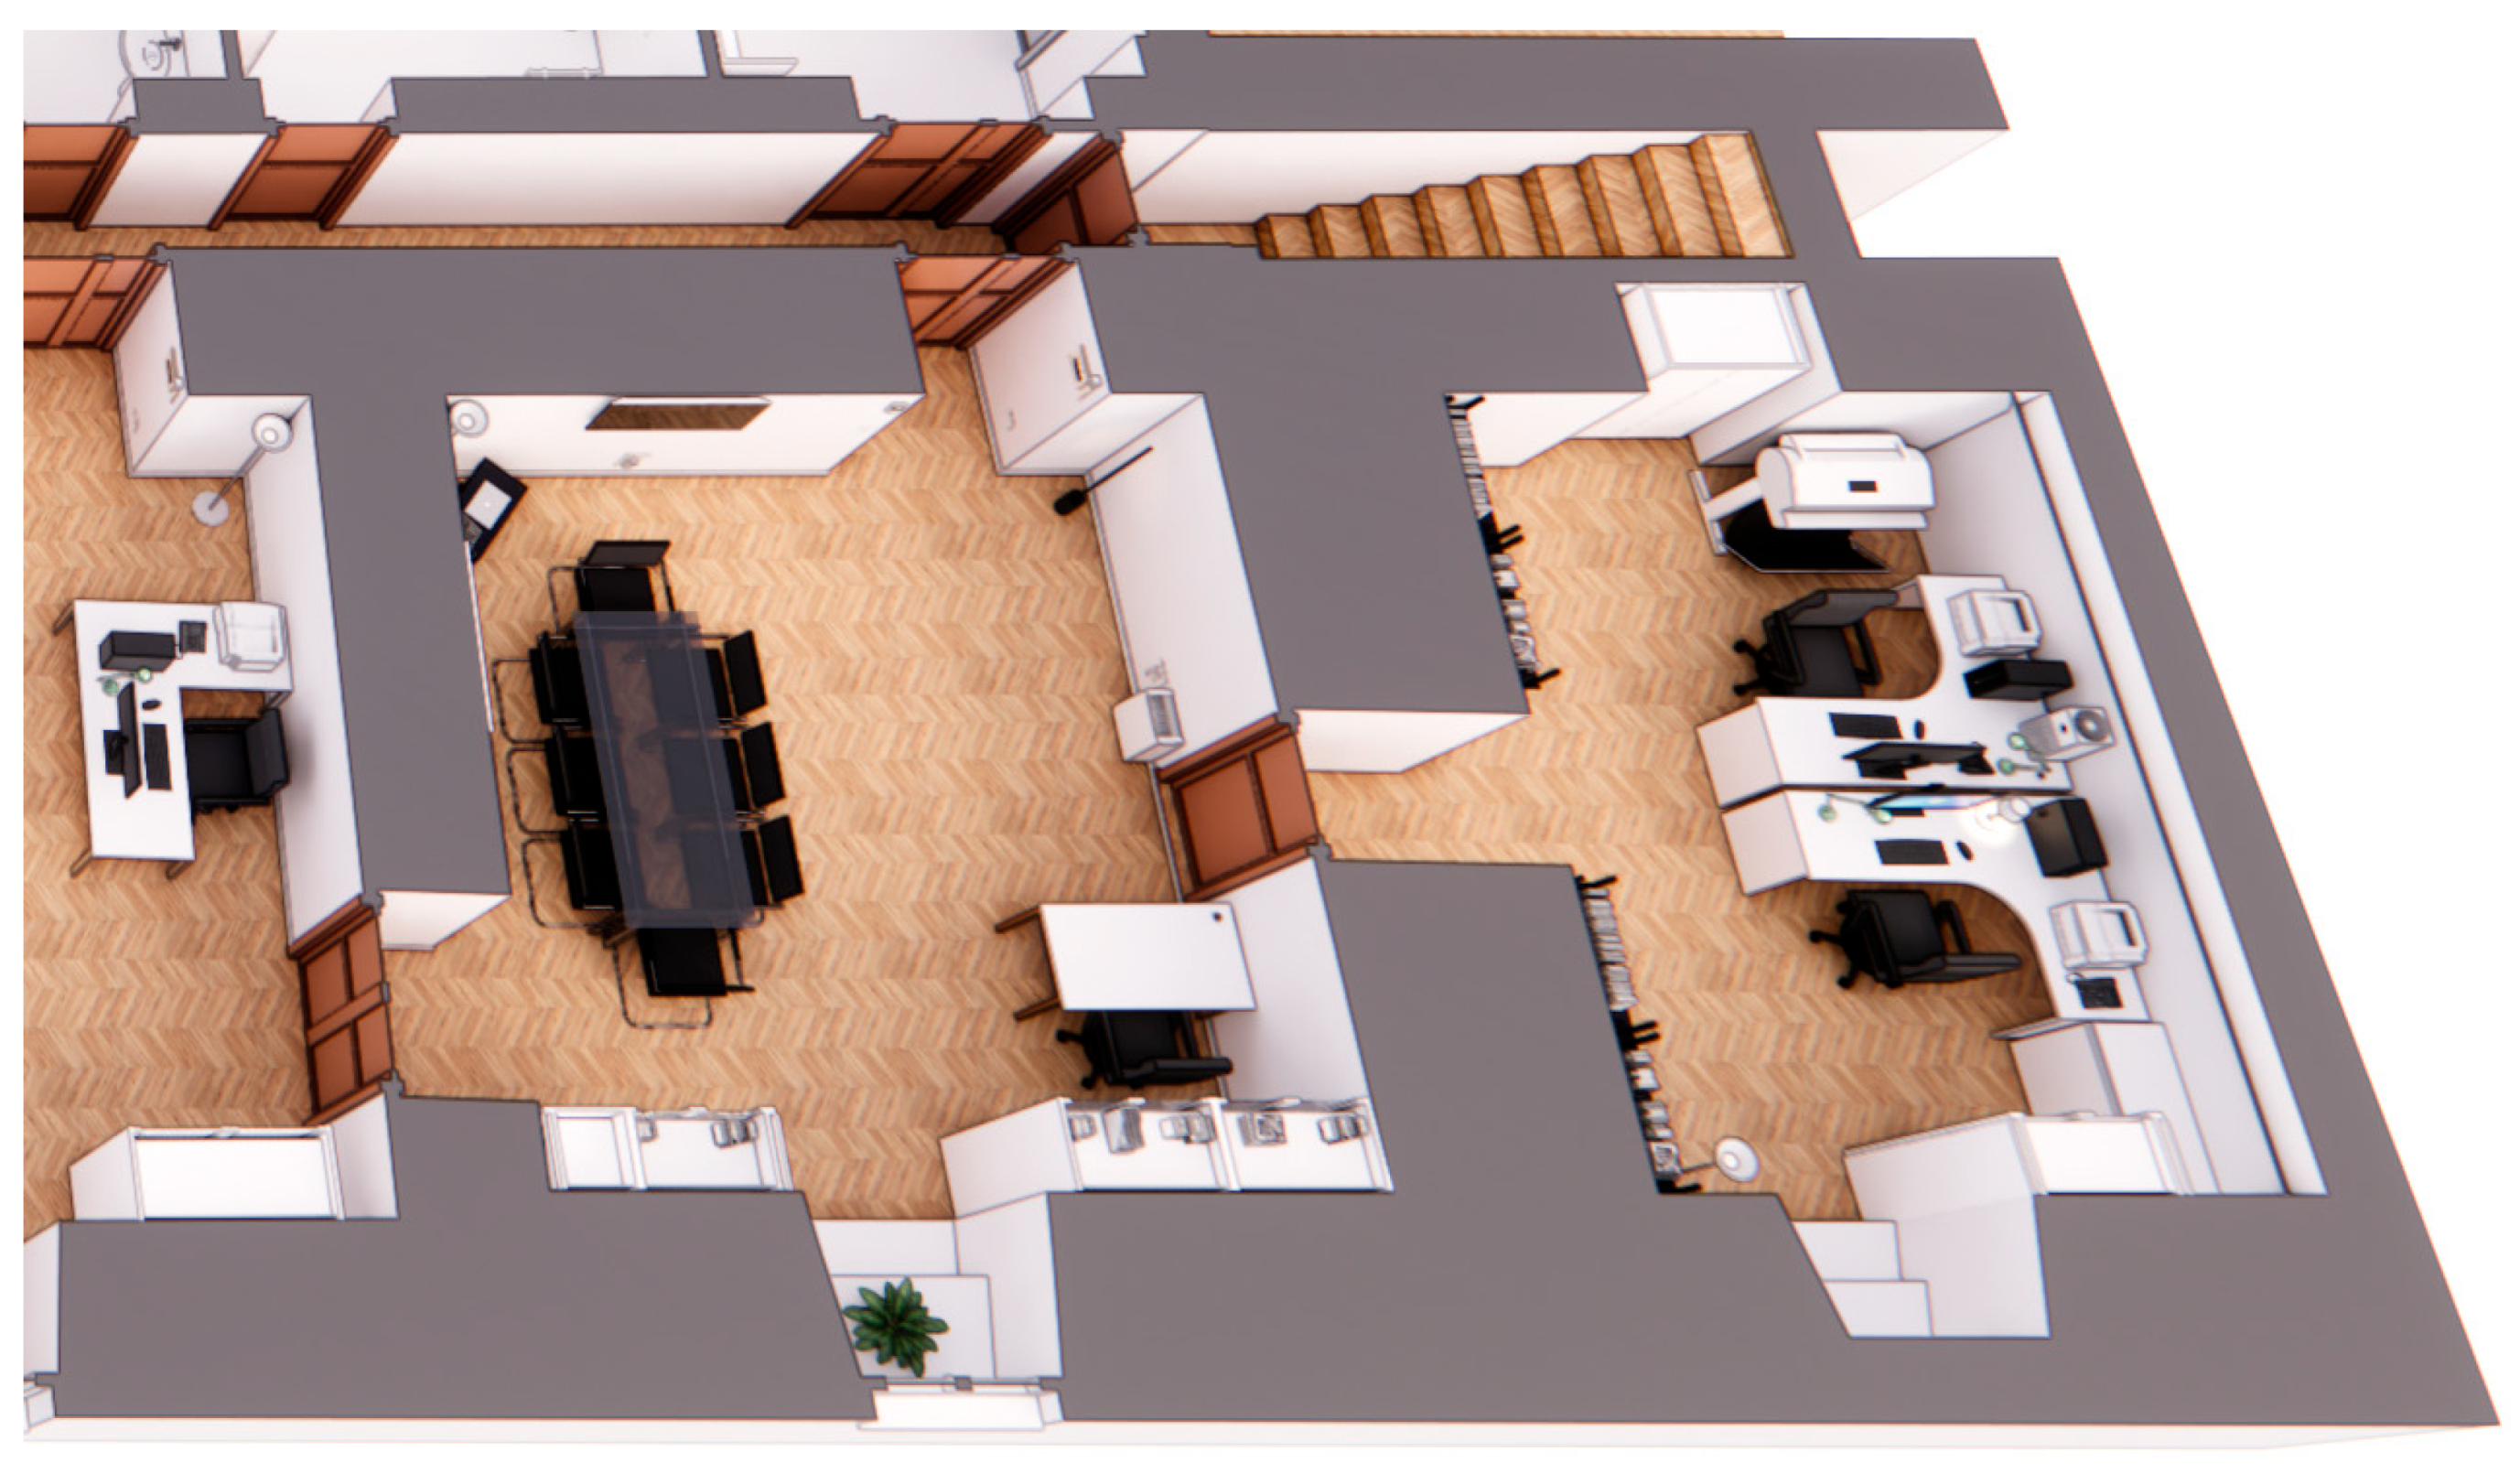
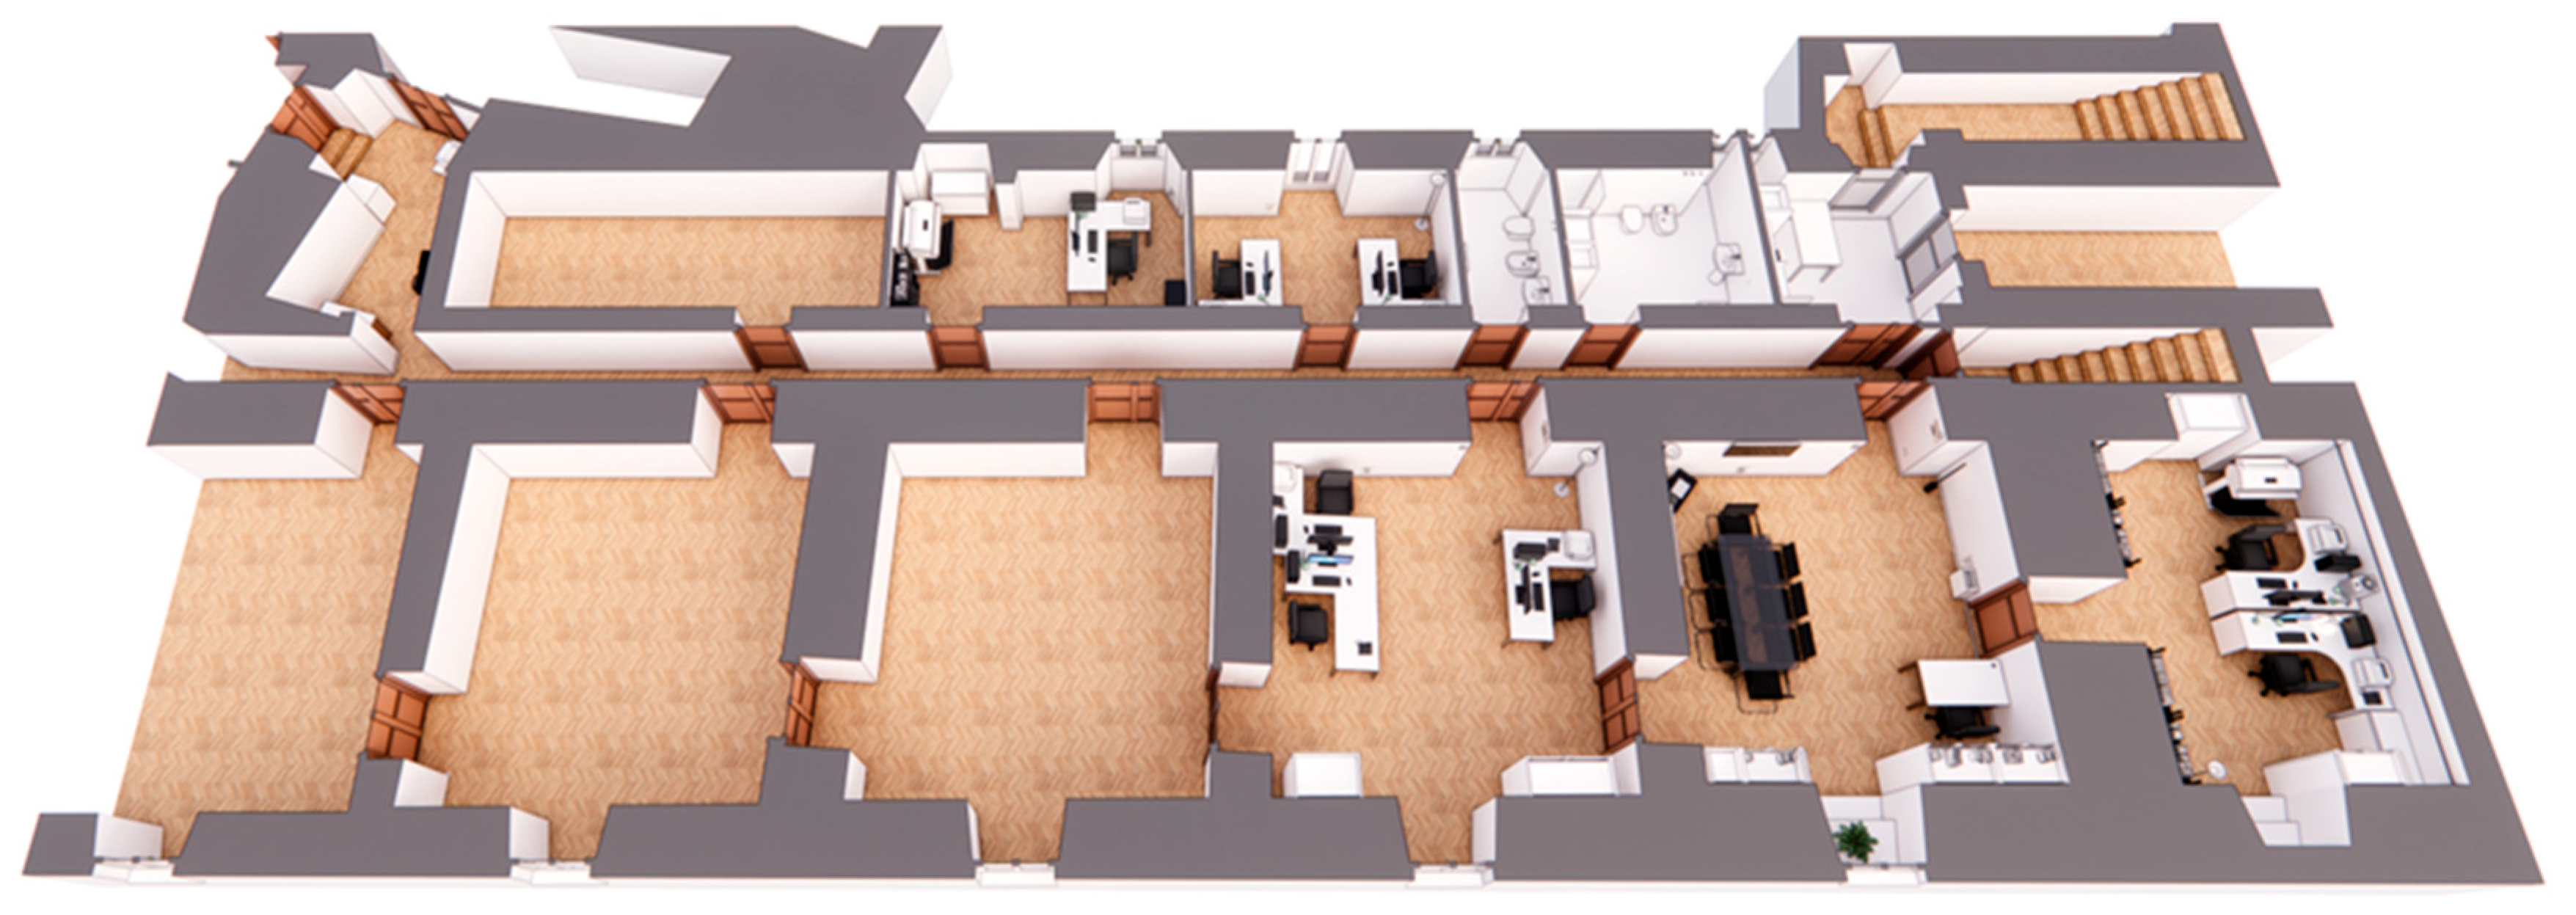
Several features were required, such as the ability to create differentiated access policies based on user rights, the presence of communication and data management libraries, the ability to associate databases of innovative types (temporal or non-sequential instead of sequential), the ability to visualize data, platform stability, and available support and documentation.
The choice was therefore Node-RED, which has all the above characteristics and allows the implementation of control logics. The platform was installed via a preconfigured virtual machine on a Debian machine. Node-RED has native support for the main IoT communication protocols and offers a visual programming environment with an extensive library of nodes, making it very easy to develop IoT applications, reducing development time and guaranteeing high system reliability, since it is a platform that has been used by millions of users to date. It is also possible to connect and program processing nodes internally to the platform using custom code written in Python or using external open source software, such as KNIME.
Data storage is divided into two parts: PostgreSQL for optimized long-lived storage and SQLlite for low-lived data. When hybrid storage is required to train predictive and machine learning models and to test innovative storage technologies, InFlux DB (temporal database) is used, which allows data to be configured and managed via a web interface. Power BI was chosen as the main tool for data aggregation and visualization, providing analysis and reports that give a deeper, more readable and measurable view of the results. Blogic Vcad 3.0 was selected as the solution to integrate and contextualize multiple data sources by simultaneously visualizing BIM models within reports and dashboards. This application, which is fully integrated with Power BI, offers a high level of interactivity, allowing users to explore the details of the information and navigate between the different components of the models to better understand the relationships and interactions between the elements themselves and the data in real time.
Finally, it was decided to organize access to the platform by different users with different levels of access to edit information, as required by the ISO 27000 standard.

4. Case Study

The aim of the project is to create a prototype, identified with some of the offices on the first floor of an office building, which is part of historical and institutional building in Rome, that will allow experimentation with digital technologies and processes oriented towards a real-time management and monitoring of parameters identified as relevant for the management and energy efficiency of buildings, the predictive maintenance of components, as well as the safety, use and enhancement of spaces according to the paradigms of the Smart Building and the DT.
In general, the aim of the project is to implement real estate management models based on digital tools and methods oriented towards Building Information Modelling (BIM), and therefore, towards the valorization of the BIM survey and restitution that started in 2024 for all the buildings belonging to the entire compendium.
Specifically, the data to be collected, monitored and controlled mainly concerns four types of domains:
  • Energy management and efficiency;
  • Indoor air quality control;
  • Predictive maintenance;
  • Management and optimization of office space.
The rooms selected are used as a meeting room, individual office and press area (Figure 2), and they are particularly significant as they represent the most potentially critical working environments in terms of energy efficiency, environmental quality and thermo-hygrometric comfort.
Digitization strategy subsequently included the extension of the system to a larger number of monitored environments in order to collect a more representative sample of applications and to verify the effectiveness of DT in more complex and diverse operational contexts (Figure 3). This development is essential to ensure the scalability and adaptability of the system in real applications.
In further extension of the system, it was applied to additional room types, including single offices, open-plan offices, and service rooms, which encompass buvette, toilets and printer areas. These new operational contexts are characterized by a marked heterogeneity of operating conditions, which introduces new design and management challenges that the DT must address to ensure effective automation and optimal resource management:
  • In individual offices, the main challenge lies in the customization of environmental comfort conditions. Occupants may have individual preferences in terms of parameters such as temperature, lighting and ventilation. The DT must therefore implement advanced predictive models to optimize the adjustment of these parameters while maintaining a balance between user satisfaction and energy consumption reduction. Machine learning systems, based on historical data analysis, can be used to identify individual preference patterns and dynamically adapt the operation of systems.
  • Open space offices have very different operational dynamics, with occupancy levels that can vary significantly throughout the day. In this context, it is necessary to implement strategies that balance the thermal and lighting comfort of several people at the same time. Computational models based on thermal and lighting simulations can be integrated into the DT to optimize the distribution of energy resources. In addition, the use of distributed sensors allows the system to monitor changes in occupancy in real time and adjust system settings for optimal energy efficiency.
  • Service environments, such as buvette, present a particular challenge in terms of intermittent use. In these spaces, peaks in occupancy occur at short intervals, requiring dynamic management of lighting and air conditioning systems. The DT can use presence detection algorithms and occupancy prediction models to activate systems only when necessary, minimizing energy waste. At the same time, the analysis of the collected data allows the detection of any anomalies in the operation of the systems and the planning of proactive maintenance interventions.
  • In the printing area, the main critical issue is the discontinuous use of electronic equipment such as printers and copiers and the management of air pollutants produced by these devices. These include ultra-fine particles, nitrogen oxides (NOx) and volatile organic compounds (VOCs), which can have a negative impact on indoor air quality. DT needs to integrate pollutant dispersion models and advanced ventilation strategies, possibly supported by the use of high-efficiency filters and air cleaners. Continuous monitoring of equipment status allows the identification of inefficient usage conditions or potential failures, promoting predictive maintenance, optimizing energy consumption and minimizing operational downtime.
The integration of a digital twin into operationally heterogeneous environments represents a complex but indispensable challenge in the development of intelligent and sustainable management solutions. This approach ensures an optimal equilibrium between comfort, energy efficiency and environmental sustainability, leading the way for the large-scale deployment of DT systems in a variety of contexts within the building sector.
An economic analysis was carried out to identify the components and costs associated with the implementation of environmental monitoring and control systems in working environments (Table 2). For each environment analyzed, a detailed classification of the necessary equipment categories was carried out, identifying sensors, actuators and other technological instruments with reference to specific models and their unit costs.
In the analyzed contexts, energy management systems play a predominant role, with particular emphasis on monitoring electricity consumption through smart meters and smart plugs. These devices have been selected for their ability to provide real-time data and to enable timely corrective action. For example, the use of contact sensors and automated window and door actuators helps both to improve energy efficiency and maintain indoor air quality. Environmental quality management was addressed through specific equipment such as multi-parameter sensors capable of detecting parameters such as carbon dioxide, temperature, relative humidity, volatile organic compounds and particulate matter. These devices, combined with air purifiers, support the improvement of occupational well-being and help to maintain healthy indoor conditions. In addition, the use of motion sensors and video cameras with computer vision capabilities enables effective monitoring of occupancy and space utilization, allowing better management of resources and optimisation of energy flows, with a potential positive impact on operating costs. The total cost for each environment was calculated by summing fixed and variable costs, focusing on the breakdown of costs per workstation. The estimates show a diversification of needs according to the specific characteristics of the environments, confirming the importance of a personalized and integrated approach to system design.

4.1. Electricity Consumption Sensors

The number of sensors, i.e., smart plugs, for analyzing electricity consumption is due to the need to individually monitor the consumption of the users present in the rooms and to correlate their data with the presence data from the cameras to simulate consumption profiles. The sensors can monitor the instantaneous power required by the user (W), the total electrical consumption (kWh) by integrating the power over time (min) and, if necessary, switch the connected devices on or off to reduce consumption due to the presence of hardware on standby or to service utilities (coffee machines, floor lamps, etc.).
The presence of a panel power meter allows the monitoring of total consumption (kWh) and power demand (W), considering and separating data from lighting, air conditioning, sockets not covered by smart plugs and energy losses due to transport.

4.2. Motion Sensors

Room occupancy is monitored by presence sensors and cameras capable of using computer vision algorithms. All rooms are monitored by occupancy sensors, with occupancy counting delegated to cameras only for rooms where more than one person is expected to be present at the same time.

4.3. IAQ Sensors

The assessment of indoor air quality (IAQ) and thermal comfort is carried out by integrating the data available from a number of sensors. In particular, IAQ is ensured by the presence of sensors capable of simultaneously analyzing the concentration level of tVOC, PM2.5, PM10 and CO2 in terms of ppm. For this reason, one air quality sensor per room is planned. Considering the recirculation of air in the different rooms due to thermal loads, it is not necessary to provide for a higher number, since small variations of values within the rooms are not relevant for monitoring IAQ and thermal comfort (the minimum measurable value and the error of these sensors are normally lower than the concentration variations naturally present in the rooms). The sensors will also be able to provide air quality evaluations through aggregated metrics (IAQ indices), and SW-side algorithms will be implemented to check compliance with the relevant ISO standard.

4.4. IEQ Sensors

To assess temperature, sensors are placed in each room to record temperature in degrees (°C) and humidity in relative humidity (RH). This information is obtained from occupancy sensors (temperature), IAQ sensors (temperature and humidity) and window sensors (temperature). The data is acquired both punctually and aggregated through machine learning logics to obtain a general data capable of describing each environment also at a predictive level by carrying out PVM and PPD calculations as described in UNI EN ISO 7730:2006 [44].

4.5. Lighting Sensors

The overall assessment of the indoor illuminance is realized using of Luxmeters (Lux) installed inside the presence sensors, the IAQ sensor and the magnetic contact sensors for the doors/windows. As with the assessment of thermal comfort, the data are both aggregated and averaged to create a comprehensive and timely measurement based on the information collected in the environment. In addition, in the future, the data obtained in this way may be used for the evaluation of lighting comfort at work surface level (Standard UNI EN 12464-1 [45]) and for the dimming of luminaires (currently not supported by the lighting system).

4.6. Actuators

Smart plugs, the automatic window opening system and relays are the main actuators in the case study. The actuation of devices needs to be carefully evaluated, as switching off lighting systems is a security risk. Indeed, switching off sockets can cause data loss from computer equipment, damage connected equipment, or interrupt ongoing experiments. Smart plugs are installed in each room and left 24 h each day. The number of plugs is sufficient to monitor electrical loads and remotely control the individual locations to which they are connected. The relays, on the other hand, are placed in the electrical box to monitor the loads and control the lights (on/off), and in the box to control the servomotor responsible for opening and closing the windows. Each of the actuators is able to record the total power consumption in W, the system status and the time of use. Historical data allows the use of machine learning logic to develop usage models and make future predictions. Finally, the actuators are complemented by the role of maintenance personnel and users who, through human-in-the-loop logic, can carry out the actions recommended by the system where automatic actuators are not or cannot be installed.

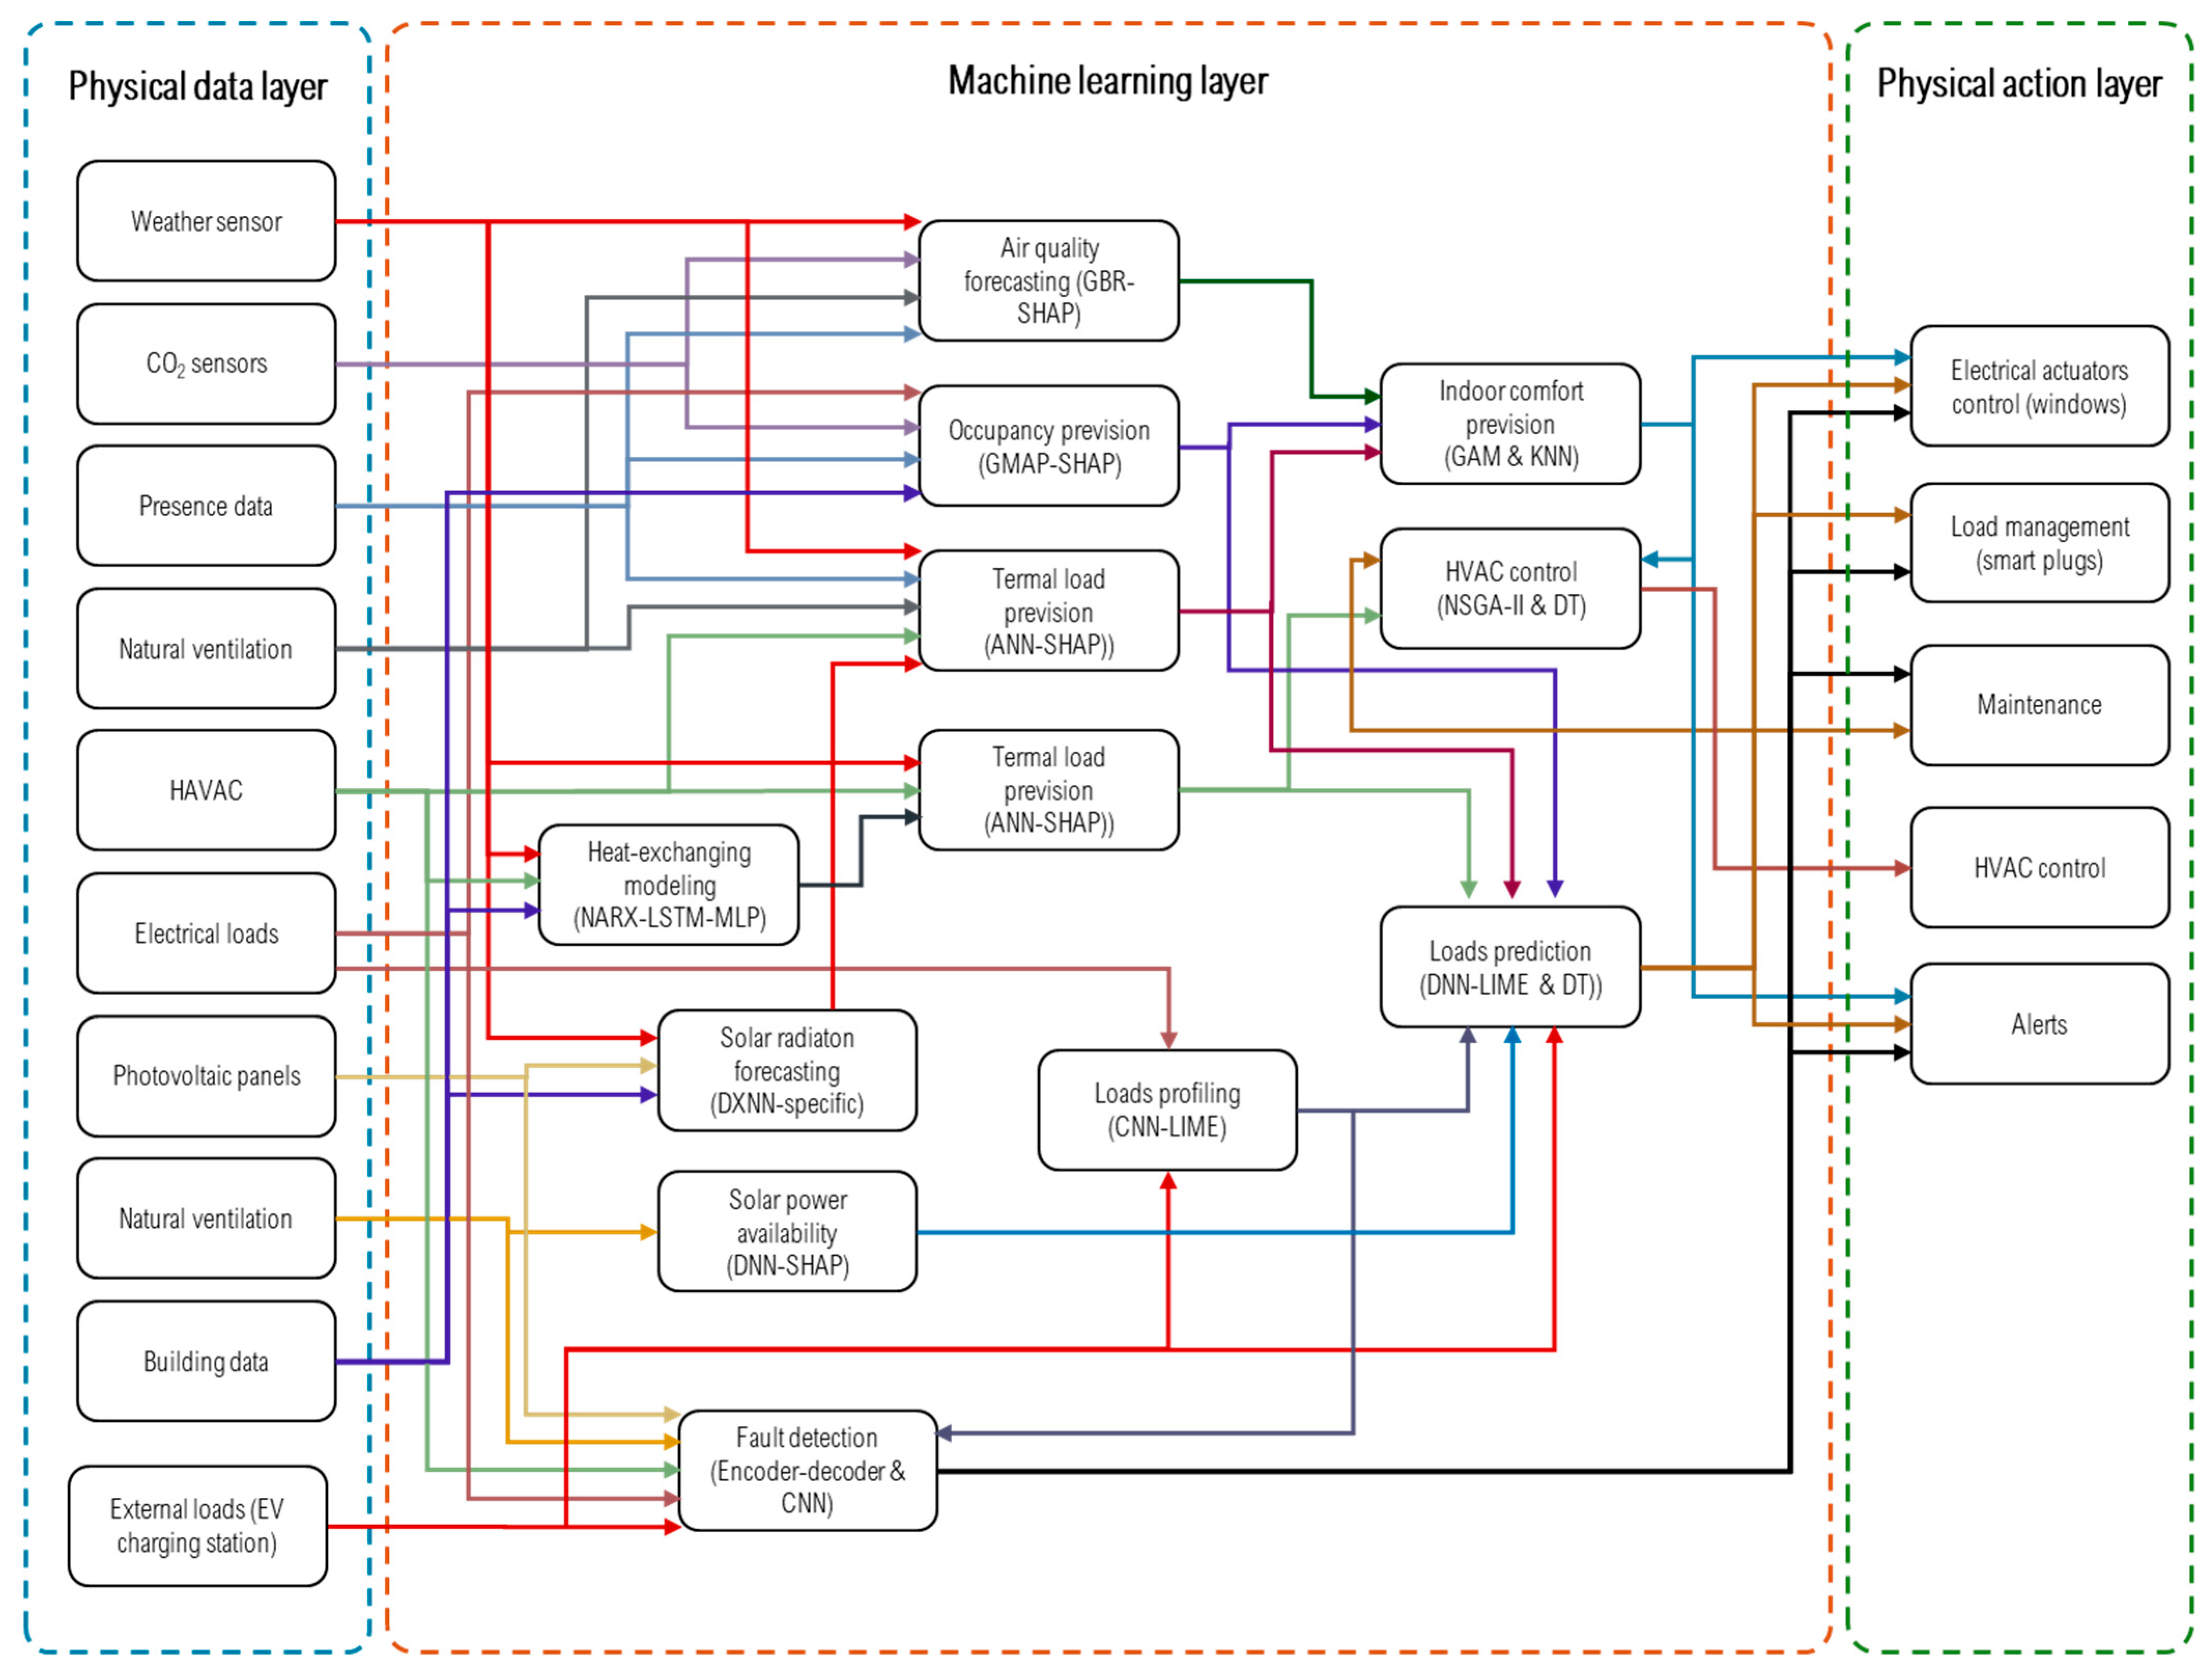
5. Machine Learning Algorithms

Maintaining optimal indoor environmental conditions is critical to the well-being of occupants. Accurate monitoring of temperature, relative humidity and understanding of occupancy plays a critical role in providing predictive information for optimal management of heating and cooling systems. This is particularly important in the absence of a building management system (BMS).
As a final aspect of the study, indoor air quality was analyzed, focusing on CO2 levels to assess occupancy status. The method used involved defining CO2 thresholds, pre-processing the collected data and using algorithms to estimate occupancy, with temperature and humidity controlled to avoid external influences. The critical threshold of 600 ppm CO2 was set as an indication of inadequate ventilation. Data pre-processing, essential for the continuity and integrity of the analysis, included the elimination of missing values and appropriate format conversions.
A specific algorithm has been implemented to estimate occupancy based on CO2 levels, assuming that each individual contributes 40 ppm CO2 to the reference concentration. Analysis of the severity of CO2 critical threshold exceedances makes it possible to visualize the periods when air quality is compromised and to correlate this data with the estimated occupancy of space. This assessment is crucial to understanding the impact of air quality on occupant health and comfort. In the second part of the study, the focus shifted to indoor environmental standards such as temperature and humidity, which are critical to maintaining a healthy and energy-efficient environment. The monitoring of these parameters was integrated with machine learning algorithms such as Long Short-Term Memory (LSTM) networks, a class of recurrent neural networks (RNNs) that are particularly efficient at processing sequential data, to accurately predict future energy consumption, thereby optimizing energy use and reducing operating costs. Energy consumption forecasting uses historical data to identify patterns over time, training LSTM models to recognize seasonal variations and daily cycles. The model was then validated through error analysis and graphical visualizations showing the accuracy of the prediction against real data. In summary, this approach has demonstrated the potential of LSTM networks to handle complex temporal data and provides a methodological framework for efficient energy management in buildings without advanced management systems.
Based on the state-of-the-art studies, a list of machine learning models for data analysis is proposed below. The schematic in Figure 4 shows the different models that are suitable to meet the requirements of the DT system. It should be noted that the following is a proposal, and the effectiveness of the solution can only be assessed after a data acquisition and training phase. This list is broader than the project objective and not all the proposed prediction models will be developed and integrated into the Digital Twin system.
The data architecture consists of a network of interconnected nodes structured into three distinct layers: a physical layer, a machine learning (ML) layer and a physical action layer. The physical layer contains the primary physical data collected from sensors, while the ML layer processes and extracts relevant information from the physical data. The physical action layer is responsible for defining the main outputs and actions of the DT system. Data generated as input/output by a particular node or model can subsequently serve as input to the next node within the architecture. The selection of ML techniques is based on an extensive review of the relevant literature and is outlined below:
  • Air quality can be assessed using a Gradient Boosting Regression (GBR) model in conjunction with SHapley Additive exPlanations (SHAP). This model can act both as a classifier—categorizing air quality as poor, fair or good—and as a regressor to estimate predicted values. The GBR-SHAP model is applicable to both indoor and outdoor air quality assessments and can be used as an input to comfort estimation and load prediction models, especially when integrated with a ventilation system model. For natural ventilation prediction, a Deep Q-Network (DQN) model can be used to analyze the impact of window openings on air quality, particularly in scenarios where elevated outdoor particulate matter (PM) concentrations are expected. The use of SHAP allows users to interpret the model predictions and gain insight into the expected air quality conditions in the coming hours. In addition, the input data can be supplemented with information from local weather services to improve forecast accuracy.
  • Thermal loads contribute significantly to the overall energy consumption of a building. ML techniques can be used to assess the impact of external environmental conditions on total heat loss and to evaluate potential interventions to improve building insulation. For thermal load modelling, an Artificial Neural Network (ANN) combined with Local Interpretable Model-agnostic Explanations (LIME) can be used to improve the interpretability of the results [46]. In high natural ventilation scenarios, such as Near Zero Energy Buildings (NZEBs), it is possible to isolate and quantify the contribution of natural ventilation to thermal loads using an ANN model with SHapley Additive exPlanations (SHAP) [47]. Identifying the most influential factors affecting thermal loads allows the detection of critical inefficiencies that should be addressed to improve the overall energy performance of the building. The thermal load prediction model uses input data related to weather conditions, occupancy levels, natural ventilation rates, HVAC system operation, and building geometries and materials. The output of the model can then be used as input for electrical power supply models and air quality prediction models.
  • The aim of this model is to evaluate the indoor thermal comfort of a building. Generalized Additive Models (GAMs) have been identified as particularly suitable for thermal comfort prediction tasks [48]. K-Nearest Neighbors (KNN) and Decision Tree models can be used to generate warnings and provide recommendations to users and stakeholders. It is important to note that thermal comfort is subject to regulatory standards, as described in EN ISO 7730. Therefore, it is recommended to include empirical rules to ensure that the model keeps comfort levels within an acceptable range. The model takes data from air quality forecasting, occupancy forecasting and thermal load forecasting as input. Generated outputs include real-time alerts, activation of building electrical actuators (e.g., automated window opening), and data transfer to the HVAC control model for further optimization.
  • Load profiling is essential to understand the devices connected to an electrical network and to detect potential faults in the system. To address this task, a machine learning model based on a Convolutional Neural Network (CNN) has been proposed, complemented with Local Interpretable Model-Agnostic Explanations (LIME) to improve the interpretability of the CNN model [49]. The implementation of a load profiling model is also valuable for detecting fraudulent energy consumption and identifying malicious users, as demonstrated by Wang et al. [50]. In addition, accurate load profiling is a critical requirement for decision makers involved in building energy management and optimization. The model uses data input from electrical loads (e.g., HVAC systems, lifts) and external loads (e.g., electric vehicle charging stations). The generated energy profiles serve as input for subsequent load forecasting models, enabling more efficient energy management.
  • Load prediction is a fundamental objective of any energy monitoring system using machine learning techniques. Numerous studies in literature have explored different methodological approaches to address this challenge. As a reference, Geyer et al. proposed a DNN model enhanced with LIME for improved interpretability [51]. In addition, other researchers have developed alerts and recommendations based on decision tree models [52]. The ability to interpret load predictions is a critical requirement for stakeholders as it enables effective management of the energy system, identification of dominant loads, and the development of comprehensive energy reports to assess the energy classification of a building. This model uses data input from the HVAC efficiency prediction model, load profile prediction, solar energy prediction, thermal load prediction and occupancy prediction. The model’s output includes real-time alerts, actuator controls and maintenance recommendations, enabling optimal energy management and operational efficiency.
Given the equipment currently installed in the building, a number of ML models were tested using a pre-existing dataset from a previous experiment conducted by the same research team. This dataset was originally collected from an office environment. The data used for training purposes is historical and does not always correspond to the exact variables that will be monitored in the Digital Twin (DT) system currently under development. Therefore, a specific performance analysis was performed to evaluate the effectiveness of the ML models that will be integrated in the final DT infrastructure.

6. Results

6.1. Air Quality Forecasting

An analysis of indoor air quality based on CO2 concentration was carried out to estimate room occupancy using a data-driven approach. The methodology involved defining thresholds for CO2 levels, pre-processing the data and performing the necessary calculations. All analyses were performed under conditions where temperature and humidity remained within the operating range of the sensors. This precaution ensures that the results are not influenced by environmental factors, thereby providing a more accurate assessment of the impact of indoor air quality on occupant health and comfort. The concentration of CO2 is a key indicator for assessing indoor air quality, as defined in DIN 1946-6 [53]. When CO2 levels exceed a critical threshold, they can adversely affect the health, comfort and cognitive performance of occupants. While the standard threshold is 1000 ppm, this study used a more conservative limit of 600 ppm. Beyond this level, air quality begins to deteriorate, potentially leading to adverse health effects due to inadequate ventilation. The placement of the CO2 sensors was determined according to the guidelines of UNI EN ISO 16000, which provides recommendations for sensor placement to ensure accurate measurements. Figure 5 shows the measured CO2 concentrations recorded from 15 November 2024 to 31 January 2025.

6.2. Thermal Comfort

Maintaining optimal environmental conditions within indoor spaces is imperative for ensuring occupant well-being. Accurate monitoring of temperature, relative humidity, and room occupancy levels is pivotal for thermal load forecasting and management, a fact that is particularly salient in the absence of a Building Management System (BMS). In such cases, the transition between heating and cooling operations is neither instantaneous nor uniform, necessitating strategic planning of heat loads by operators. This challenge is further compounded in older buildings, which were not originally designed to accommodate HVAC or air conditioning systems. In office environments, a moderate level of occupancy is expected. For the thermal comfort analysis, the following assumptions were made:
-
Temperature: indoor temperatures should be maintained between 18 °C and 22 °C during winter and between 23 °C and 26 °C during summer. These temperature ranges have been determined to enhance comfort and efficiency while minimising health risks associated with extreme cold or heat exposure. The same ranges are considered optimal for most individuals based on the Perceived Mean Vote (PMV) model;
-
Humidity: the relative humidity should be maintained between 50% and 80% to prevent excessively dry air, which can lead to respiratory issues, and to inhibit the growth of pathogens and allergens.
The temperature and humidity trends for the period between 15 November 2024 and 31 January 2025 are shown in Figure 6.
The continuous monitoring of temperature and humidity plays a critical role in energy consumption management. It is well established that air conditioning systems represent the primary energy load in many buildings, particularly in offices and schools. Implementing energy forecasting based on environmental monitoring is essential for several key reasons:
-
Thermal comfort and energy efficiency: maintaining optimal temperature and humidity levels is directly linked to occupant thermal comfort. By ensuring appropriate indoor environmental conditions that minimize the reliance on energy-intensive systems (such as heating and air conditioning units), significant energy savings can be achieved.
-
Data-driven operational decisions: the collection of real-time environmental data from temperature and humidity sensors enables informed decision-making regarding energy usage optimization. For instance, real-time monitoring allows for the dynamic adjustment of lighting and electronic devices, which contribute to indoor heat generation. By strategically managing these systems, comfortable conditions can be maintained while minimizing energy consumption.
This data-driven approach enhances energy efficiency and sustainability, supporting the development of intelligent building management strategies.

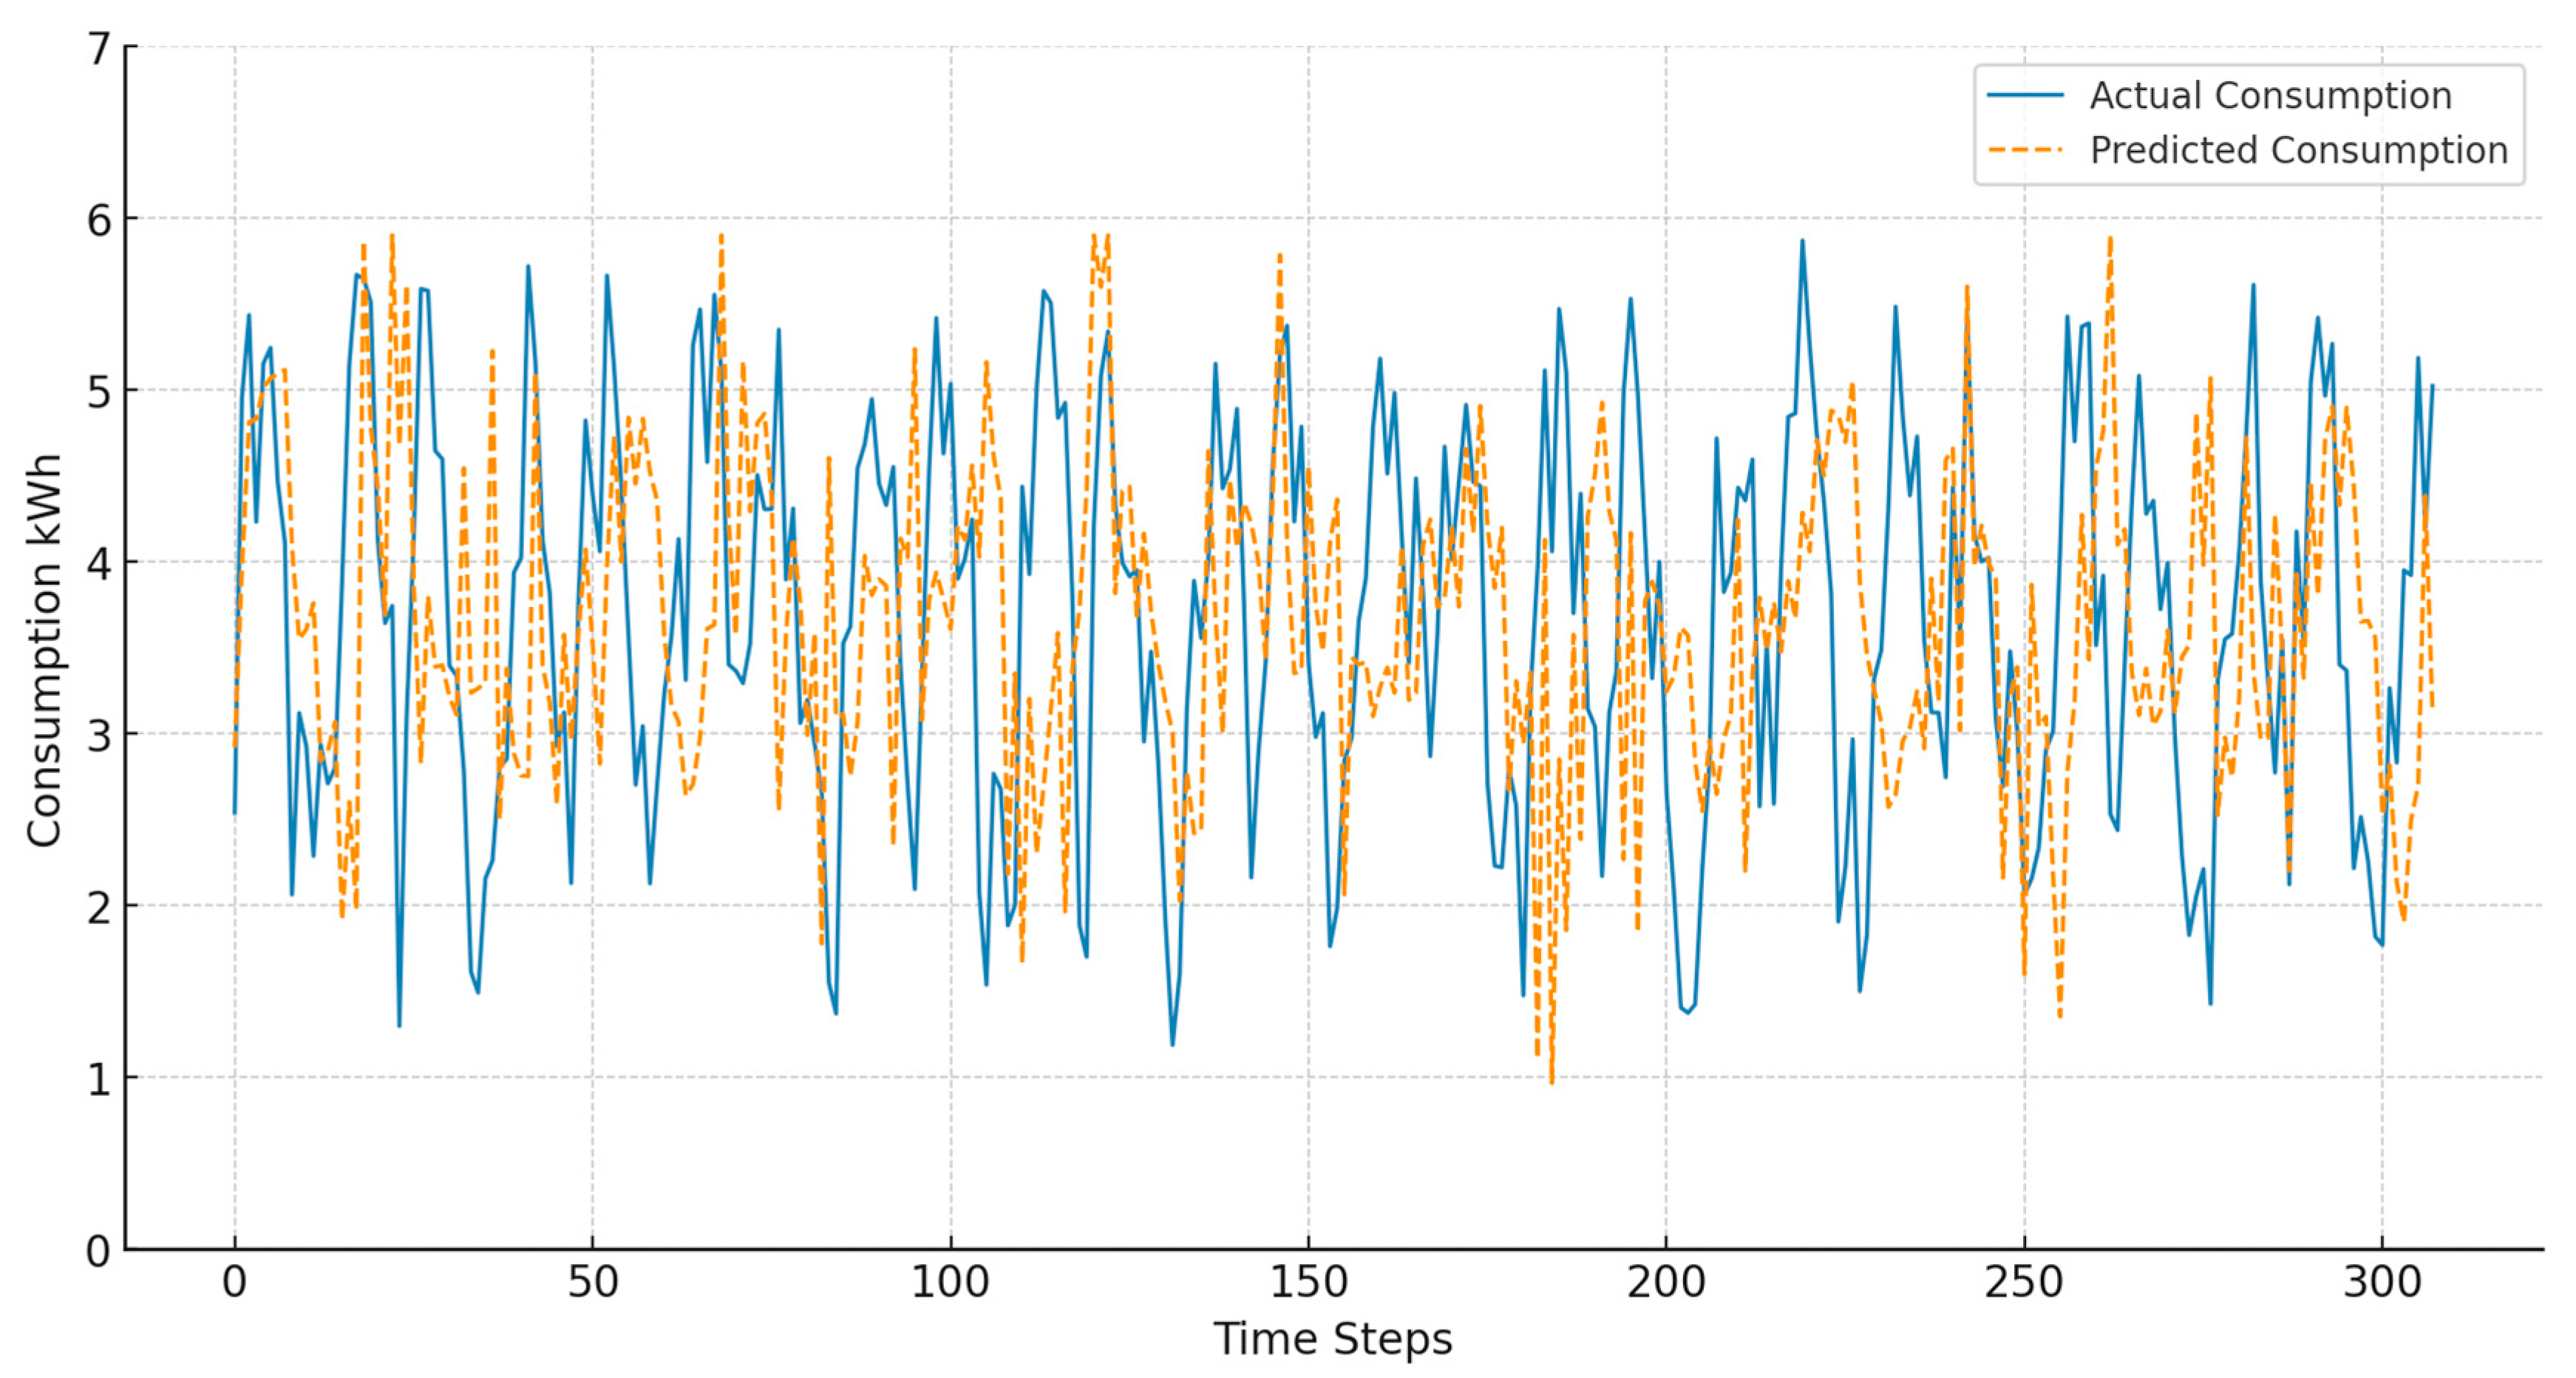
6.3. Power Consumption

A LSTM network has been developed to accurately forecast energy consumption by leveraging temperature and humidity data collected from sensors. LSTM models are particularly well-suited for processing temporal data, as they can identify patterns and correlations within datasets that include temperature, humidity, and energy use. The application of this model enables strategic energy planning, ensuring that environmental conditions remain within optimal ranges while minimizing unnecessary energy consumption. Furthermore, analysing the relationship between environmental conditions and energy consumption allows for the identification of potential energy-saving opportunities, i.e., specific conditions or time periods that lead to increased energy demand. This analysis can reveal opportunities for targeted interventions to enhance energy efficiency. Integrating temperature and humidity monitoring into an energy optimisation strategy provides a deeper understanding of key influencing factors. The employment of this data-driven model aims to achieve a substantial reduction in energy consumption, while concurrently advancing sustainability objectives and reducing operational expenses, all without compromising occupant comfort. This strategy underscores the significance of environmental monitoring as a pivotal element of effective energy management in indoor environments. Figure 7 presents the energy consumption trend analysis for the period from 15 December 2024 to 31 January 2025. The analysis represents the total energy consumption (in kWh) of all electrical loads within the environment, and the observed cyclic pattern reflects fluctuations in office occupancy and daily activities.

6.4. Data Preparation and Training

Before training the model, a series of data preprocessing steps were implemented to ensure the accuracy and reliability of the input data:
  • Data loading and cleanup: the dataset was initially retrieved from the database. Preliminary processing steps, such as interpolating missing values, were applied to maintain data integrity and ensure that the model is trained on a complete and coherent dataset.
  • Temporal aggregation to hourly intervals: the original dataset, which was recorded at minute-level granularity, was resampled by computing hourly average values. This transformation reduces data complexity by minimizing short-term fluctuations while preserving broader temporal trends in energy consumption.
  • Normalization: since LSTM networks and other neural architectures are scale-sensitive, power consumption values were normalized to a {0,1} range using the MinMaxScaler algorithm. This normalization step is crucial to enhance the stability and efficiency of the training process.
  • Sequence generation: the LSTM model requires sequential input data to identify temporal dependencies. A sliding window method was applied, converting the dataset into a supervised learning problem, where a fixed number of past time steps are used to predict future values.
  • Model architecture: the LSTM model was designed to capture both short-term and long-term correlations in the data. Additionally, dropout layers were incorporated into the architecture to mitigate overfitting, by randomly omitting units during training, thus enhancing the model’s generalization ability.
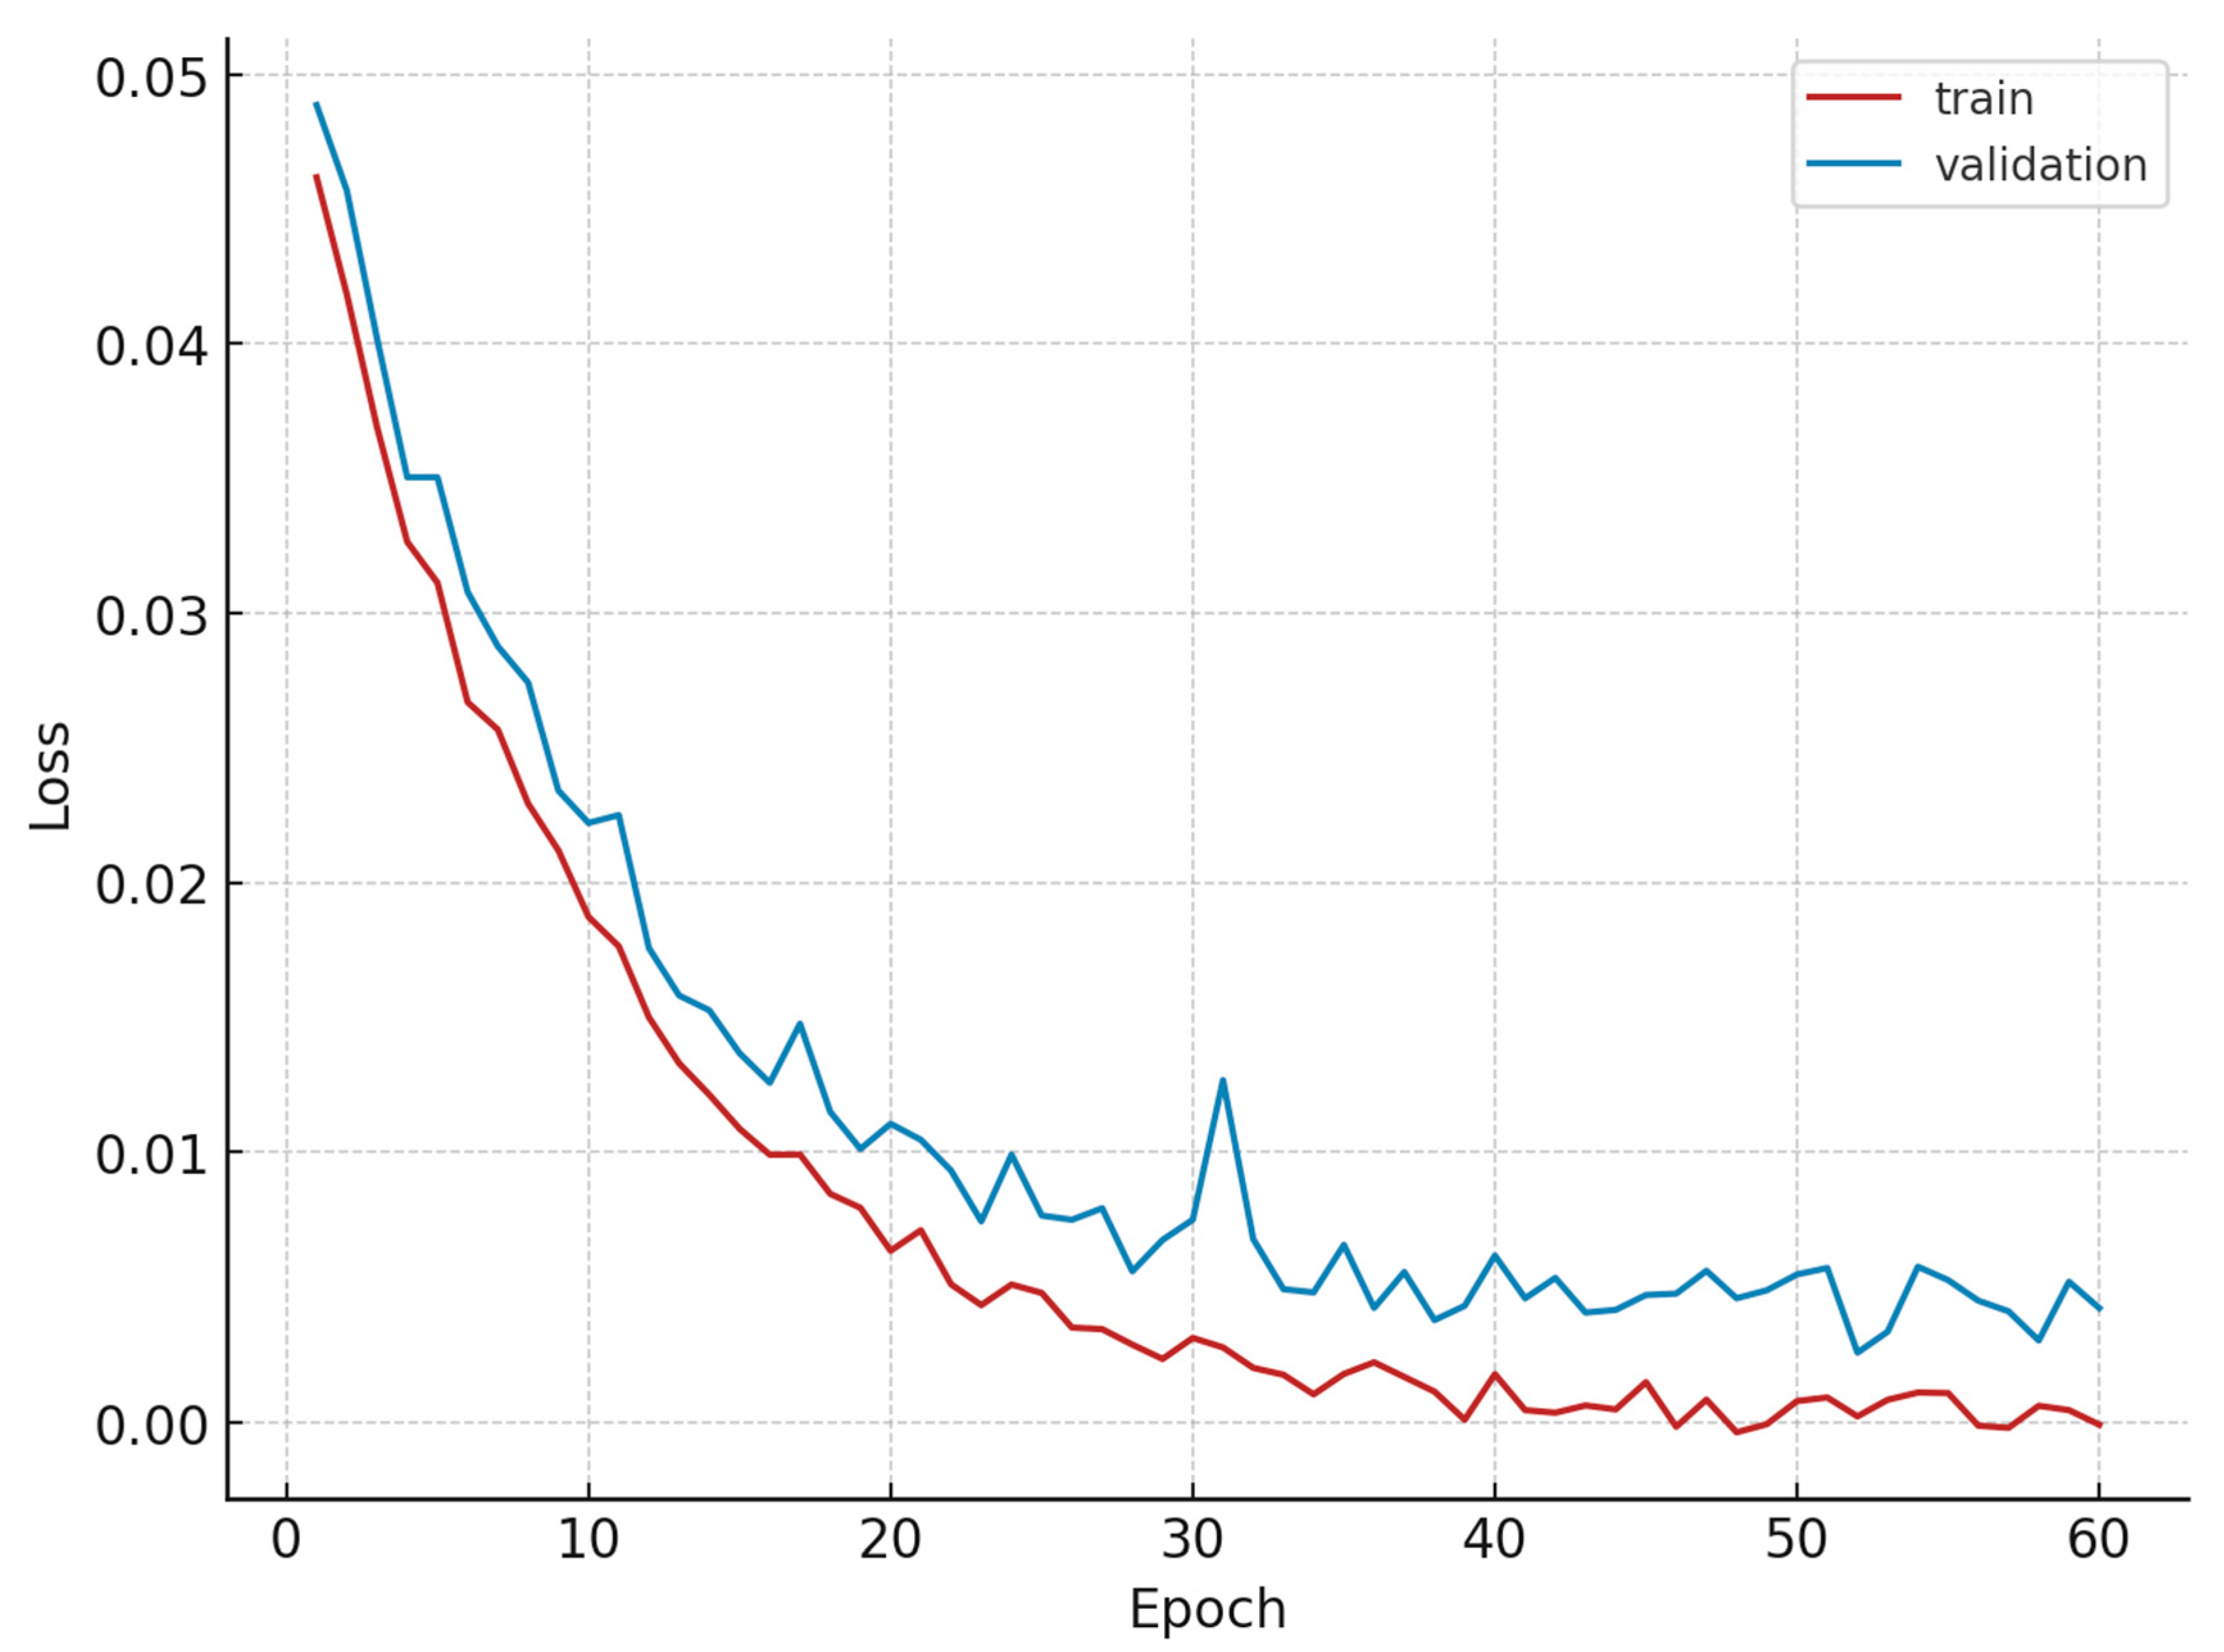
  • Training and validation: the model was trained using the preprocessed time-series sequences, with a portion of the dataset reserved for validation purposes. This validation process ensured that overfitting was monitored and prevented. The training convergence curve is illustrated in Figure 8.
  • Post-training evaluation: the trained model was evaluated using real-time data to assess its predictive accuracy. The Root Mean Square Error (RMSE) obtained was 0.04, indicating a high level of accuracy in forecasting energy consumption trends.
The graphs in Figure 9 illustrate the comparison between actual and predicted energy consumption. The low prediction error observed in the ANN model demonstrates its high accuracy in predicting energy consumption. This result highlights the model’s ability to effectively capture general trends and seasonal variations in energy consumption.
The energy consumption prediction model uses historical data to identify patterns and temporal trends in energy consumption. By analyzing periodic variations and absolute consumption levels, particularly during peak demand periods, the model is trained to accurately predict future energy demand. This approach enables a data-driven strategy to optimize energy management and improve efficiency.

7. Conclusions

The study developed a system based on smart building and DT paradigms, integrating IoT components, automation flows for energy efficiency and machine learning algorithms for monitoring and predicting energy consumption and indoor environmental quality. Through real-time visualization of aggregated data in BIM models and interactive dashboards, the system provides an advanced tool for decision support, predictive management and optimization of energy resources and indoor environmental quality. The experimental application demonstrates the potential of this technology to improve energy efficiency and occupant comfort through continuous monitoring and the ability to make decisions based on real-time data. The results show that the integration of digital technologies in the building context can lead to a more sustainable and intelligent management of spaces, with significant benefits in terms of energy efficiency, air quality and environmental comfort.
The experimental implementation of the system within the building demonstrated the effectiveness of the proposed methodology, confirming how the combined use of the IoT and DT enables detailed monitoring of environmental conditions and optimization of energy resources. ML, in particular, showed great potential in predicting future consumption and supporting more efficient operational decisions, thus contributing to sustainability and occupant comfort. At this research level, the results obtained represent an initial validation of the system, based on an initial campaign of measurements. Although they already demonstrate the effectiveness of the developed framework, further developments will be necessary to extend the application of the approach to the whole building. The proposed approach has some limitations that need to be addressed through further research. In order to test it in a building-scale application scenario, the DT prototype is currently being extended in terms of the number of rooms monitored, the different uses and the monitoring period. In addition, other platform services are being developed, such as the implementation of a web application for collecting user feedback, which can be used to explore the system’s ability to identify problems and propose spatial solutions.
As the quantity of data collected over time increases, the accuracy of predictions improves, enabling the formulation of sophisticated strategies for enhancing energy efficiency and environmental quality. The proliferation of sensors and the incorporation of additional functionalities will refine the predictive model, thereby enhancing the system’s capacity to adapt to variations in usage and the requirements of occupants. The subsequent evolution of this technology will encompass the augmentation of the platform and the incorporation of additional data sources, thereby further consolidating digital building management strategies and promoting an increasingly sustainable and intelligent approach to the maintenance and use of working spaces [54,55].
In conclusion, the project lays the foundations for further developments in the field of building management through digital tools, with the aim of extending these solutions to a wide range of buildings and contexts, as well as promoting a more innovative and sustainable approach to building management.

Author Contributions

Conceptualization, G.P., S.A. and F.M.; methodology, G.P., S.A. and F.M.; validation, G.P., S.A. and F.M.; formal analysis, G.P., S.A. and F.M.; investigation, G.P., S.A. and F.M.; resources, G.P., S.A. and F.M.; data curation, G.P., S.A. and F.M.; writing—original draft preparation, G.P. and S.A.; writing—review and editing, G.P., S.A. and F.M.; visualization, G.P., S.A. and F.M.; supervision, G.P.; funding acquisition, G.P. All authors have read and agreed to the published version of the manuscript.

Funding

The work was funded by Sapienza University Research Call 2022—CUP B89J21032850001, project title: Automatic electrical microgrid management system through machine learning techniques.

Institutional Review Board Statement

Not applicable.

Informed Consent Statement

Not applicable.

Data Availability Statement

The original contributions presented in this study are included in the article. Further inquiries can be directed to the corresponding author.

Conflicts of Interest

The authors declare no conflict of interest.

Abbreviations

AIArtificial Intelligence
APIApplication Programming Interface
BIMBuilding Information Modeling
BMSBuilding Management System
CO2Carbon Dioxide
CUDACompute Unified Device Architecture
DBsDatabases
DQNDeep Q-Network
DTDigital Twin
GPUGraphics Processing Unit
HTTPHypertext Transfer Protocol
IAQIndoor Air Quality
IEQIndoor Environmental Quality
InfluxDBTime-Series Database
IoTInternet of Things
ISOInternational Organization for Standardization
KNIMEKonstanz Information Miner
KPIKey Performance Indicator
LANLocal Area Network
LSTMLong Short-Term Memory
MLMachine Learning
ModbusSerial communication protocol
MQTTMessage Queuing Telemetry Transport
NodeRedFlow-based development tool for visual programming
ONVIFOpen Network Video Interface Forum
PM10Particulate Matter 10
PM2.5Particulate Matter 2.5
PMVPredicted Mean Vote
PostgreSQLRelational Database Management System
Power BIBusiness Intelligence Tool by Microsoft
PPDPercentage of People Dissatisfied
PSUPower Supply Unit
RESTRepresentational State Transfer
RNNRecurrent Neural Network
SHAPSHapley Additive exPlanations
SQLStructured Query Language
SQLliteLightweight SQL Database
tVOCTotal Volatile Organic Compounds
Wi-FiWireless Fidelity
WLANWireless Local Area Network

References

  1. Vischer, J.C.; Wifi, M. The Effect of Workplace Design on Quality of Life at Work. In Handbook of Environmental Psychology and Quality of Life Research; Springer: Cham, Switzerland, 2017; pp. 387–400. [Google Scholar] [CrossRef]
  2. Donkers, A.; Yang, D.; de Vries; Baken, N. Real-Time Building Performance Monitoring using Semantic Digital Twins. In Proceedings of the LDAC2021—9th Linked Data in Architecture and Construction Workshop, Luxembourg, 11–13 October 2021. [Google Scholar]
  3. Sacks, R.; Brilakis, I.; Pikas, E.; Xie, H.S.; Girolami, M. Construction with digital twin information systems. Data-Centric Eng. 2020, 1, e14. [Google Scholar] [CrossRef]
  4. O’Brien, W.; Wagner, A.; Schweiker, M.; Mahdavi, A.; Day, J.; Kjærgaard, M.B.; Carlucci, S.; Dong, B.; Tahmasebi, F.; Yan, D.; et al. Introducing IEA EBC annex 79: Key challenges and opportunities in the field of occupant-centric building design and operation. Build. Environ. 2020, 178, 106738. [Google Scholar] [CrossRef]
  5. Kim, H.; Park, J. Editorial Special Issue on Human Interaction with the Built Environment. Build. Environ. 2022, 228, 109879. [Google Scholar] [CrossRef]
  6. Bolzoni, A.; Parisio, A.; Todd, R.; Forsyth, A. Model Predictive Control for optimizing the flexibility of sustainable energy assets: An experimental case study. Int. J. Electr. Power Energy Syst. 2021, 129, 106822. [Google Scholar] [CrossRef]
  7. Esnaola-Gonzalez, I.; Díez, F. Integrating Building and IoT data in Demand Response solutions. In Proceedings of the 7th Linked Data in Architecture and Construction Workshop (LDAC 2019), Lisbon, Portugal, 19–21 June 2019. [Google Scholar]
  8. Maturo, A.; Vallianos, C.; Buonomano, A.; Athienitis, A. Model predictive control for energy flexibility of a building coupled with advanced solar and energy storage technologies. In Proceedings of the SDEWES 2022, 17th Conference on Sustainable Development of Energy, Water and Environment Systems, Paphos, Cyprus, 6–10 November 2022. [Google Scholar]
  9. Al Horr, Y.; Arif, M.; Katafygiotou, M.; Mazroei, A.; Kaushik, A.; Elsarrag, E. Impact of indoor environmental quality on occupant well-being and comfort: A review of the literature. Int. J. Sustain. Built Environ. 2016, 5, 1–11. [Google Scholar] [CrossRef]
  10. Nagy, Z.; Gunay, B.; Miller, C.; Hahn, J.; Ouf, M.M.; Lee, S.; Hobson, B.W.; Abuimara, T.; Bandurski, K.; André, M.; et al. Ten questions concerning occupant-centric control and operations. Build. Environ. 2023, 242, 110518. [Google Scholar] [CrossRef]
  11. Zahid, H.; Elmansoury, O.; Yaagoubi, R. Dynamic Predicted Mean Vote: An IoT-BIM integrated approach for indoor thermal comfort optimization. Autom. Constr. 2021, 129, 103805. [Google Scholar] [CrossRef]
  12. He, Y.; Yu, X.; Liang, Q.; Yu, P.; Xie, Z.; Xia, L.; Qin, M. Intelligent Monitoring and Visualization System for High Building Nighttime Utilization Based on Image Processing. Sensors 2024, 24, 6793. [Google Scholar] [CrossRef]
  13. Tsang, T.-W.; Mui, K.-W.; Wong, L.-T.; Chan, A.C.-Y.; Chan, R.C.-W. Real-Time Indoor Environmental Quality (IEQ) Monitoring Using an IoT-Based Wireless Sensing Network. Sensors 2024, 24, 6850. [Google Scholar] [CrossRef]
  14. Jing, T.; Zhao, Y. Optimizing energy consumption in smart buildings: A model for efficient energy management and renewable integration. Energy Build. 2024, 323, 114754. [Google Scholar] [CrossRef]
  15. Sayed, A.N.; Bensaali, F.; Himeur, Y.; Dimitrakopoulos, G.; Varlamis, I. Enhancing building sustainability: A Digital Twin approach to energy efficiency and occupancy monitoring. Energy Build. 2025, 328, 115151. [Google Scholar] [CrossRef]
  16. Mavrokapnidis, D.; Katsigarakis, K.; Pauwels, P.; Petrova, E.; Korolija, I.; Rovas, D. A linked-data paradigm for the integration of static and dynamic building data in digital twins. In Proceedings of the 8th ACM International Conference on Systems for Energy-Efficient Buildings, Cities, and Transportation, Coimbra, Portugal, 17–18 November 2021; ACM: New York, NY, USA, 2021; pp. 369–372. [Google Scholar] [CrossRef]
  17. Bakhshi, S.; Ghaffarianhoseini, A.; Ghaffarianhoseini, A.; Najafi, M.; Rahimian, F.; Park, C.; Lee, D. Digital twin applications for overcoming construction supply chain challenges. Autom. Constr. 2024, 167, 105679. [Google Scholar] [CrossRef]
  18. Ozturk, G.B. Digital Twin Research in the AECO-FM Industry. J. Build. Eng. 2021, 40, 102730. [Google Scholar] [CrossRef]
  19. Moshood, T.D.; Rotimi, J.O.B.; Shahzad, W.; Bamgbade, J.A. Infrastructure digital twin technology: A new paradigm for future construction industry. Technol. Soc. 2024, 77, 102519. [Google Scholar] [CrossRef]
  20. Abdelrahman, M.M.; Chong, A.; Miller, C. Personal thermal comfort models using digital twins: Preference prediction with BIM-extracted spatial–temporal proximity data from Build2Vec. Build. Environ. 2022, 207, 108532. [Google Scholar] [CrossRef]
  21. Jiang, L.; Shi, J.; Wang, C.; Pan, Z. Intelligent control of building fire protection system using digital twins and semantic web technologies. Autom. Constr. 2023, 147, 104728. [Google Scholar] [CrossRef]
  22. Bruttini, A.; Hagedorn, P.; Cleve, F.; Getuli, V.; Capone, P.; König, M. A Semantic Digital Twin Prototype for Workplace Performance Assessment. In CONVR 2023—Proceedings of the 23rd International Conference on Construction Applications of Virtual Reality; Firenze University Press: Florence, Italia, 2023; pp. 1193–1205. [Google Scholar] [CrossRef]
  23. Tan, Y.; Chen, P.; Shou, W.; Sadick, A.M. Digital Twin-driven approach to improving energy efficiency of indoor lighting based on computer vision and dynamic BIM. Energy Build. 2022, 270, 112271. [Google Scholar] [CrossRef]
  24. Polter, M.; Scherer, R.J. Management of BIM-based digital twins in multimodels. In ECPPM 2022—eWork and eBusiness in Architecture, Engineering and Construction 2022; CRC Press: London, UK, 2023; pp. 123–130. [Google Scholar] [CrossRef]
  25. BuildingSMART, Industry Foundation Classes (IFC). Available online: https://www.buildingsmart.org/standards/bsi-standards/industry-foundation-classes/ (accessed on 4 November 2024).
  26. BuildingSMART Data Dictionary (bSDD). Available online: https://www.buildingsmart.org/users/services/buildingsmart-data-dictionary/ (accessed on 4 November 2024).
  27. Kifouche, A.; Baudoin, G.; Hamouche, R.; Kocik, R. Generic sensor network for building monitoring: Design, issues, and methodology. In Proceedings of the 2017 IEEE Conference on Wireless Sensors (ICWiSe), Miri, Malaysia, 13–14 November 2017; pp. 1–6. [Google Scholar] [CrossRef]
  28. Son, S.; Lee, G.; Jung, J.; Kim, J.; Jeon, K. Automated generation of a model view definition from an information delivery manual using idmXSD and buildingSMART data dictionary. Adv. Eng. Inform. 2022, 54, 101731. [Google Scholar] [CrossRef]
  29. Martins, P.; Ramos, A.; Pina, E.; Váz, P.; Silva, J.; Abbasi, M. Smart Building Control: An Android Application for Enhanced Monitoring and Management in the Internet of Things Era. Procedia Comput. Sci. 2024, 238, 594–601. [Google Scholar] [CrossRef]
  30. Vakalis, D.; Hellwig, R.T.; Schweiker, M.; Gauthier, S. Challenges and opportunities of Internet-of-Things in occupant-centric building operations: Towards a life cycle assessment framework. Curr. Opin. Environ. Sustain. 2023, 65, 101383. [Google Scholar] [CrossRef]
  31. Tanasiev, V.; Pătru, G.C.; Rosner, D.; Sava, G.; Necula, H.; Badea, A. Enhancing environmental and energy monitoring of residential buildings through IoT. Autom. Constr. 2021, 126, 103662. [Google Scholar] [CrossRef]
  32. Ngonidzashe, M.B.; Tuncay, E. A simple Node-RED implementation for digital twins in the area of manufacturing. Trends Comput. Sci. Inf. Technol. 2023, 8, 50–54. [Google Scholar] [CrossRef]
  33. Patti, G.; Leonardi, L.; Testa, G.; Bello, L.L. PrioMQTT: A prioritized version of the MQTT protocol. Comput. Commun. 2024, 220, 43–51. [Google Scholar] [CrossRef]
  34. Sicari, S.; Rizzardi, A.; Coen-Porisini, A. Security&privacy issues and challenges in NoSQL databases. Comput. Netw. 2022, 206, 108828. [Google Scholar] [CrossRef]
  35. Digital Twin Consortium, Home Page. Available online: https://www.digitaltwinconsortium.org/ (accessed on 7 November 2024).
  36. UNI EN ISO 16000; Aria Interna. UNI: Rome, Italy, 2016.
  37. Padma, B.; Erukala, S.B. End-to-end communication protocol in IoT-enabled ZigBee network: Investigation and performance analysis. Internet Things 2023, 22, 100796. [Google Scholar] [CrossRef]
  38. Korodi, A.; Nițulescu, I.-V.; Fülöp, A.-A.; Vesa, V.-C.; Demian, P.; Braneci, R.-A.; Popescu, D. Integration of Legacy Industrial Equipment in a Building-Management System Industry 5.0 Scenario. Electronics 2024, 13, 3229. [Google Scholar] [CrossRef]
  39. ISO/IEC 27000; Information Security Management Systems (ISMS) Family of Standard. ISO: Geneva, Switzerland, 2013.
  40. Borissova, D.I.; Danev, V.K.; Rashevski, M.B.; Garvanov, I.G.; Yoshinov, R.D.; Garvanova, M.Z. Using IoT for Automated Heating of a Smart Home by Means of OpenHAB Software Platform. IFAC-PapersOnLine 2022, 55, 90–95. [Google Scholar] [CrossRef]
  41. Uwiringiyimana, M.M.; Nandagopal, G.; Guan, Y.; Vinkovič, S.; Kölsch, J.; Heinz, C. IoT Platforms. In IoT Platforms, Use Cases, Privacy, and Business Models: With Hands-on Examples Based on the VICINITY Platform; Zivkovic, C., Guan, Y., Grimm, C., Eds.; Springer International Publishing: Cham, Switzerland, 2021; pp. 21–49. [Google Scholar] [CrossRef]
  42. Leskovsky, R.; Kucera, E.; Haffner, O.; Rosinova, D. Proposal of Digital Twin Platform Based on 3D Rendering and IIoT Principles Using Virtual/Augmented Reality. In Proceedings of the 2020 Cybernetics & Informatics (K&I), Velke Karlovice, Czech Republic, 29 January–1 February 2020; pp. 1–8. [Google Scholar] [CrossRef]
  43. Ragupathi, C.; Prakash, R. Forecasting energy consumption using enhanced LSTM. AIP Conf. Proc. 2022, 2452, 050006. [Google Scholar] [CrossRef]
  44. UNI EN ISO 7730:2006; Ergonomia degli ambienti termici. UNI: Rome, Italy, 2016.
  45. UNI EN 12464-1; Illuminazione dei Luoghi di Lavoro. UNI: Rome, Italy, 2021.
  46. Di Natale, L.; Svetozarevic, B.; Heer, P.; Jones, C.N. Physically Consistent Neural Networks for building thermal modeling: Theory and analysis. Appl. Energy 2022, 325, 119806. [Google Scholar] [CrossRef]
  47. Park, H.; Park, D.Y. Comparative analysis on predictability of natural ventilation rate based on machine learning algorithms. Build. Environ. 2021, 195, 107744. [Google Scholar] [CrossRef]
  48. Charalampopoulos, I. A comparative sensitivity analysis of human thermal comfort indices with generalized additive models. Theor. Appl. Climatol. 2019, 137, 1605–1622. [Google Scholar] [CrossRef]
  49. Wastensteiner, J.; Michael Weiss, T.; Haag, F.; Hopf, K. Explainable AI for tailored electricity consumption feedback–An experimental evaluation of visualizations experimental evaluation of visualizations. In ECIS 2021 Proceedings; Association for Information Systems (AIS): Atlanta, GA, USA, 2021. [Google Scholar]
  50. Wang, M.; Wang, Z.; Geng, Y.; Lin, B. Interpreting the neural network model for HVAC system energy data mining. Build. Environ. 2022, 209, 108449. [Google Scholar] [CrossRef]
  51. Geyer, P.; Singh, M.M.; Chen, X. Explainable AI for engineering design: A unified approach of systems engineering and component-based deep learning demonstrated by energy-efficient building design. Adv. Eng. Inform. 2024, 62, 102843. [Google Scholar] [CrossRef]
  52. Mollo Neto, M.; Silva Montanhani, M.E.; Gobbo de Freitas Bueno, L.; Harada, E.d.S.; Florentino Pereira, D. Data Mining Generating Decision Trees to Alert System Against Death and Losses in Egg Production. Int. J. Innov. Educ. Res. 2020, 8, 737–747. [Google Scholar] [CrossRef]
  53. DIN 1946-6; Ventilazione e climatizzazione. Deutsches Institut für Normung: Berlin, Germany, 2019.
  54. Piras, G.; Muzi, F.; Tiburcio, V.A. Enhancing Space Management through Digital Twin: A Case Study of the Lazio Region Headquarters. Appl. Sci. 2024, 14, 7463. [Google Scholar] [CrossRef]
  55. Agostinelli, S.; Cumo, F.; Marzo, R.; Muzi, F. Digital Construction Strategy for Project Management Optimization in a Building Renovation Site: Machine Learning and Big Data Analysis. In Lecture Notes in Civil Engineering; Springer: Cham, Switzerland, 2023; Volume 306. [Google Scholar] [CrossRef]
Figure 1. Software architecture.
Applsci 15 04939 g001
Figure 2. Prototype environments.
Applsci 15 04939 g002
Figure 3. Environments implemented in the DT.
Applsci 15 04939 g003
Figure 4. Machine Learning architecture.
Applsci 15 04939 g004
Figure 5. CO2 levels over time.
Applsci 15 04939 g005
Figure 6. The figure shows the trends in temperature (green) and humidity (yellow) during a typical week. The section highlighted in yellow is the optimal winter temperature zone.
Applsci 15 04939 g006
Figure 7. Measured energy trends.
Applsci 15 04939 g007
Figure 8. Training convergence curve.
Applsci 15 04939 g008
Figure 9. Actual energy consumption trends compared to forecast.
Applsci 15 04939 g009
Table 1. Classification of KPIs developed in this research, listed by objective.
ObjectivesKPI
1
Energy management and efficiency
1.1
Multi-zone climate management
1.1.1
Mode-dependent and independent temperature control for different rooms in the building
1.2
Automatic lighting
1.2.1
Automatic switching on and off of lighting depending on the presence of people
1.3
Deactivation of temperature control with open window
1.3.1
Deactivation of heating and cooling systems localized to the individual room when doors and windows are open
1.4
Heating and cooling in economy when people are absent
1.4.1
Automation of the heating system in relation to the presence or absence of persons
1.5
Management and monitoring of electrical and thermal energy consumption data
1.5.1
Application of machine learning algorithms to highlight patterns and define efficiency-oriented strategies
1.6
Reduction of malfunctions and inefficiencies
1.6.1
Capability of remote monitoring and control of equipment
2
Environmental quality control
2.1
Automatic air exchange
2.1.1
Automation of the opening of windows and doors both on a time/temperature basis and according to the use of certain more critical rooms, such as meeting rooms and printer rooms by detecting the concentration of airborne pollutants.
3
Space management and optimization
3.1
Improvement of knowledge levels of the building stock
3.1.1
Establishment of an unambiguous and distributed data source to support decision-making processes
3.2
Analysis of room occupancy data
3.2.1
Definition of strategies for the valorization and optimization of the use of spaces, as well as for the simulation of scenarios in response to critical events and/or emergencies
4
Interoperability of communication protocols (MQTT, http, etc.) and use of shared standards (Wi-Fi, Ethernet, Zigbee, etc.) with the possibility of external access to data
4.1
Communication protocols used
4.1.1
Multi-user access to the platform equipped with authentication systems to maintain data security
4.2
Communication networks
4.2.1
Use of standard communication protocols (MQTT, http, API, REST, ONVIF, etc.)
4.3
Data centralizers
4.4
Database
4.5
Multi-user access from the DT platform based on ISO27000 in order to guarantee at least one user and one administrator level.
5
Data maintenance on dedicated infrastructure
5.1
Data platform
5.1.1
Data storage for 3 years
5.2
Database
5.3
Data server
6
Data visualization using aggregated metrics.
6.1
Machine learning systems based and open source commercial libraries
6.1.1
Monitoring and forecasting electricity consumption
6.1.2
Monitoring and forecasting air quality and thermal comfort
6.1.3
Space occupancy monitoring and forecasting
6.1.4
Monitoring of light and noise comfort
6.1.5
Monitoring and forecasting photovoltaic
6.1.6
Monitoring of charging station use
6.1.7
Creation of dedicated algorithms for the movement of frames
6.1.8
Visualization of data via 3D models and
Table 2. Classification of room categories by intended use and cost estimation.
Meeting Room
TypeRif. ModelDescriptionqt.FunctionPrimary UseSecondar UseUnit Cost
smart meter ShellyStatus measurement and implementation of window opening/closing1sensor/
actuator
IAQ-€53.00
actuator for double-blade clampingGEZE RWA K 600 GAutomatic window opening1actuatorIAQ-€300.00
smart meter for switch panelShellyMonitoring of electrical consumption of indoor air conditioning units1sensor/
actuator
energy management-€53.00
electric box with manual switchBticinoControl on/off of indoor air conditioning units1actuatorenergy management--
smart plugShellyElectricity consumption monitoring and control of devices (TV, lamp. purifier)3sensor/
actuator
IAQ-€19.14
air purifierXiaomiAir quality control1actuatorIAQ-€150.00
motion sensorShellyPresence detection1sensorspace managementenergy management€45.19
CO2, T, HRAmpelEnvironmental quality monitoring2sensorIAQIEQ; energy
management
€100.00
cameraTBDPresence counting with integrated computer vision1sensorspace management energy management
touch sensorShelly Door/WindowWindow opening/closing status detector1sensorenergy managementsecurity
management
€24.80
Total €883.41
Individual Office
TypeRif. ModelDescriptionqt.FunctionPrimary UseSecondar UseUnit Cost
smart meter for switch panelShellyElectrical consumption monitoring of indoor air conditioning units1sensors/
actuator
energy management €53.00
electric box with manual switchBticinoOn/off control of indoor air conditioning units1actuatorenergy management
motion sensorShellyPresence detection1sensorsspace management (monitoring)energy management (cdz);€45.19
touch sensorShelly Door/WindowStatus detector opening/closing fixtures1sensorsenergy managementsecurity management€24.80
smart plugShellyElectrical consumption monitoring and device control (n.1 floor lamp) 1sensors/
actuator
IAQ €19.14
Total fixed costs €142.19
smart plugShellyMonitoring the power consumption of workstations 1sensorsenergy management €19.14
smart plugShellyMonitoring of electricity consumption and control of devices (no. 1 printer, no. 1 desk lamp) 2sensors/
actuator
IAQ €19.14
Total per station €57.42
Open Space Office
TypeRif. ModelDescriptionqt.FunctionPrimary UseSecondar UseUnit Cost
smart meter for switch panelShellyElectrical consumption monitoring of indoor air conditioning units1sensors/actuatorenergy management €53.00
electric box with manual switchBticinoOn/off control of indoor air conditioning units1actuatorenergy management -
motion sensorShellyPresence detection1sensorsspace management (monitoring)energy management (cdz);€45.19
touch sensors Shelly Door/WindowStatus detector opening/closing fixtures1sensorsenergy managementsecurity management€24.80
smart plugShellyElectrical consumption monitoring and device control (n.1 floor lamp) 1sensors/actuatorIAQ €19.14
CO2, T, HRAmpelEnvironmental quality monitoring2sensorsIAQIEQ; energy management€100.00
smart meterShellyMeasurement of window opening/closing status and implementation1sensors/actuatorIAQ €53.00
actuator for double-blade clampingGEZE RWA K 600GAutomatic window opening1actuatorIAQ €695.13
Total fixed costs €695.13
smart plugShellyMonitoring the power consumption of workstations 1sensorsEnergy management €19.14
smart plugShellyMonitoring of electricity consumption and control of devices (no. 1 printer, no. 1 desk lamp) 2sensors/actuatorIAQ €19.14
Total per station €57.42
Buvette
TypeRif. ModelDescriptionqt.FunctionPrimary UseSecondar UseUnit Cost
smart plugShellyMonitoring of electricity consumption and control of devices (no. 1 coffee, no. 1 fridge, no. 1 microwave, no. 1 purifier)4sensors/
actuator
IAQ-
air purifier Air quality control1actuatorIAQ-€150.00
motion sensorShellyPresence detection1sensorsspace management (monitoring)energy management€45.19
touch sensors Shelly Door/WindowStatus detector opening/closing fixtures1sensorsenergy managementsecurity management€24.80
CO2, VOC, T, HR, PM2.5, light sensorAWAIR OmniEnvironmental quality monitoring1sensorsIAQIEQ; energy management€500.00
Total €796.55
Services Environment
TypeRif. ModelDescriptionqt.FunctionPrimary UseSecondar UseUnit Cost
smart plugShellyMonitoring of electricity consumption and control of devices (no. 1 boiler) 1sensor/actuatorIAQ €19.14
motion sensorShellyPresence detection1sensorspace management (monitoring)energy management€45.19
touch sensorShelly Door/WindowStatus detector opening/closing fixtures1sensorenergy managementsecurity management€24.80
Total per station €89.13
Archive
TypeRif. ModelDescriptionqt.FunctionPrimary UseSecondar UseUnit Cost
smart meter for switch panelShellyMonitoring of electricity consumption and control of indoor air-conditioning units1sensor/
actuator
energy management €53.00
electric box with manual switchBticinoMonitoring on/off air conditioning internal unit 1actuatorenergy management
motion sensorShellyPresence detection1sensorspace management (monitoring)energy management€45.19
touch sensorShelly Door/WindowStatus detector opening/closing fixtures1sensorenergy managementsecurity management€24.80
smart plugShellyElectricity consumption monitoring and device control (No. 1 floor lamp) 1sensor/
actuator
IAQ €19.14
smart plugShellyElectricity consumption monitoring of workstations1sensorenergy management €19.14
Total per station €161.27
Disclaimer/Publisher’s Note: The statements, opinions and data contained in all publications are solely those of the individual author(s) and contributor(s) and not of MDPI and/or the editor(s). MDPI and/or the editor(s) disclaim responsibility for any injury to people or property resulting from any ideas, methods, instructions or products referred to in the content.

