1. Introduction
Sheet metal forming is a worldwide manufacturing process, where sheet blanks with a basic outline are plastically deformed between dies to obtain parts with complicated shapes and desired tolerances. It is a sector that has a significant economic impact and is at the forefront of manufacturing processes. Sheet metal-forming processes usually leave little scrap and manufacture the final part in a very short time: usually a few strokes of a press. As a result, many parts are produced in less time, which helps in large production quantities, where tool costs can be easily amortized. They are used extensively throughout the automobile, aerospace, electronics and household appliance industries to produce complex parts [
1,
2,
3,
4].
Despite its many obvious advantages, sheet metal forming has some drawbacks. Dies with aggressive geometry, and the abusive use of small radii, are often some of the key aspects that generate the fracture [
5] of metal sheets during the forming process [
6]. Fracture caused by excessive stretching in sheet metal forming has been extensively investigated [
7].
Wrinkling occurs when compressive stresses in the flange reach a critical point of instability [
8], most likely in regions where the work piece is unsupported or when the blank-holder force is insufficient. The wrinkling can be prevented by increasing the blank-holder force and by redesigning the draw beads in order to create tensile stress in those flanges to compensate the compressive stresses.
The springback phenomenon is related to the elastic strain recovery, and it consists of the change in the shape of a part at the end of the deformation process when it is released from the forming tool-associated forces [
9]. It is physically driven by the stress state reached at the end of the forming process and by the elastic response of the formed part. This phenomenon pushes parts away from their design and targeted dimensions. Minimizing springback issues can shorten the overall project timeline by reducing the need for iterative testing and adjustments during the design phase. Improved control over springback leads to quicker product iterations and a reduced time to market, which is critical in the competitive home appliances industry. Stamping tooling accounts for a substantial fraction of the investment in home appliance projects, and excessive springback can necessitate costly modifications or even complete redesigns of tooling, impacting the project budget and additional delays.
Historical efforts to reduce the collateral effects created by springback have usually been carried out by trial and error methods. Manufacturing a physical part to verify the functional and dimensional assessment is a costly procedure. It also includes the design stage of the piece itself and the tooling involved in the manufacturing process, which is usually one die per stage and also the trimming tools. Once the physical die is set up, first pieces are manufactured. Those parts are checked to determine if the piece complies with all the dimensional and functional requirements. In the event that the part requirements are not fulfilled, the process must be repeated from the beginning. This process, depending on the part, can take months of trial and error looping. This long process and the costs related put a great pressure on the viability of different projects.
Hence, a great concern in sheet metal-forming design is making an appropriate prediction of the final shape of a formed part without the need for prototyping or trial and error with the springback playing a key role in this final shape of the part. Numerical tools are needed to reduce trial and error cycling on physical prototypes. Of all the numerical techniques described so far, the Finite Element Method (FEM) has become established and nowadays is the preferred choice [
10] for springback prediction following forming processes.
On the face of it, the concept of springback seems simple, but the prediction of springback has proven to be quite challenging. Complex material behavior, extensive sliding contact between tools and metal sheets and large deformations define all the processes. These aspects mean that the numerical approach of the process is complicated.
One of the first studies on the springback of sheet metal forming carried out by finite element analysis was performed by Esat et al. [
11]. Numerical results and experimental results reached a very good agreement for simple geometries, which are achieved by using commercially available models. The model is built with shell elements with an implicit time integration scheme.
To handle contact within rigid and deformables bodies, a penalty method algorithm was implemented. Narasimhan and Lovell [
12] set up a scenario where both explicit and implicit methods are banded together. The explicit method has been used to reproduce the process, while the implicit method has only been used during the springback phase. Panthi et al. [
2] dealt with a large deformation algorithm to analyze the modeling of a bending process of a metal sheet by simulation and showed that the results agree with the experimental test.
Thus, in the early stages of springback numerical simulation, the main contributions were focused on developing the best FEM approach to simulate the process. However, although the accuracy of the results was promising, there was room for improvement. So, in recent years, the mathematical modeling of constitutive laws of materials has received a lot of attention. Due to the cold-rolling process, the materials used in forming manufacturing are generally orthotropic. Moreover, austenitic steels’ final material properties depend on the actual austenitic and martensitic composition that evolves with the deformation of the material. This is because the phase transformation results in different hardening curves for different stress states. Strain-dependent hardening and plastic anisotropy are studied in [
13]. Complex shapes of the dies cause the metal to flow through them to bend in one direction and then rebend in the opposite direction. This behavior under loading and unloading conditions, driven by the Bauschinger effect [
14], has a great impact on the resulting stress states at the end of the forming process.
The Bauschinger effect refers to the phenomenon where a material that has been plastically deformed in one direction exhibits a reduced yield stress upon loading in the reverse direction. In a recent study, a physically based self-consistent model was developed to examine the microscopic lattice response of pre-strained Type 316H polycrystalline austenitic stainless steel and to explain the Bauschinger effect observed at the macroscopic scale [
15]. This effect is fundamentally attributed to changes in the internal structure of the steel induced by the initial deformation. Microscopically, plastic deformation creates an inhomogeneous distribution of residual stresses and dislocation structures inside the material. These internal stress fields act as back-stresses that facilitate dislocation motion when the load is reversed. As a result, upon load reversal, the pre-existing dislocation arrangements and residual stresses reduce the resistance to plastic flow, causing early yielding in the opposite direction. This manifests as a drop in the yield point on the reverse stress–strain curve compared to the initial direction.
Firat [
16] considered a U-channel stamping analysis to anticipate springback deformations. Kinematic hardening is modeled, maintaining the dimension of the primary yield surface and moving this surface. The location of the center of the initial yield surface is the back-stress. He developed a kinematic hardening model with a cumulative back-stress. Gau and Kinzel [
17] demonstrate the grade of implication of the Bauschinger effect on springback with an experimental edge bending trial.
All of the above-mentioned efforts have the goal of accurately predicting the final stress state after forming, which is crucial for springback determination, and research in the field has been focused on this aspect [
18]. However, it is rather uncommon to find research focused on complex components employed in industrial applications.
There are many process parameters which have a great effect on the final stress reached by the material during the stamping forming process, hence determining dimensional accuracy of parts [
19]. The die clearance, blank-holder force, die radius, and coefficient of friction are key parameters of the sheet metal-forming process that drive the thinning and thickening. Many studies have been carried out on tool geometry as well as the variability of process parameters to show how this affects springback [
20,
21,
22].
Despite the many advances in simulation and development [
23], the day-to-day sheet metal-forming process keeps facing difficulties. When designed parts are pushed to allowed extreme tolerances, even the minimum microstructural variation in the material could lead to a significative divergence in the final stress state after forming. This is the reason why changes in the press setup should be made to correct these deviations, even between different batches of metal blanks. This setup could lead to a large effect on the quality of the final sheet metal-forming process, including undesirable springback of the final part.
The objective of this study is to investigate the effect of blank-holder force (BHF) on a real industrial component—a gas cooktop part made from unstable austenitic steel 1.4301, which is characterized by its complex geometry. Unlike many studies that focus on simpler components, this research provides valuable insights into the practical applications of sheet metal forming, using springback as the determining factor for manufacturing quality. The work not only presents experimental results but also compares them with predictions from the widely recognized Barlat Yld2000 numerical model, which is used to predict the yield behavior of anisotropic materials. The paper offers a comprehensive overview of the entire process, from the experimental determination of model parameters to the correlation with simulated results, detailing the experimental setup for measuring springback displacement and describing the full simulation chain from the forming process to springback measurements. Ultimately, both experimental and numerical results are analyzed to evaluate the performance of the process and validate the relationship between BHF and springback.
2. Materials and Methods
2.1. Constitutive Model
Constitutive models embody a mathematical framework for describing the mechanical behavior of the material. From the simplest to the most advanced model, all of them rely on a diverse number of parameters to represent various mechanical characteristics of the material.
It is imperative to adequately quantify these parameters that feed the equations which govern the adopted constitutive model in order to run reliable numerical simulations. This calibration of the model represents the mechanical characterization of the actual material.
Mechanical characterization is made through experimental tests. Normally, it is not possible to experimentally measure each of the parameters necessary to construct a constitutive model representing a material, but can be accomplished in an indirect method from other measurements. In this study, a comprehensive experimental framework was employed. Initially, tensile tests were performed to establish the baseline stress–strain response, which allowed for the calibration of the yield stress and hardening behavior by delineating the elastic-to-plastic transition and the post-yield strain hardening.
Complementing the tensile tests, hydraulic bulge tests were conducted, wherein the material was subjected to biaxial tension. This testing method minimizes stress concentrations typically encountered in uniaxial tests, thereby generating a more uniform deformation field. The uniform, biaxial stress distribution inherent in the bulge test delays the onset of localized necking, which is a common failure mode in tensile tests, allowing the material to sustain larger deformations before failure.
Additionally, Miyauchi tests were utilized to assess directional properties and the evolution of anisotropy under deformation. The Miyauchi test data help calibrate parameters that influence the shape and orientation of the yield surface.
Finally, tension–compression tests reveal the material’s asymmetry in tension versus compression. Incorporating these data into the calibration process adjusts the yield function to account for differences in yielding under compressive versus tensile loading, which is important for accurately predicting behavior in forming simulations where compressive stresses are common.
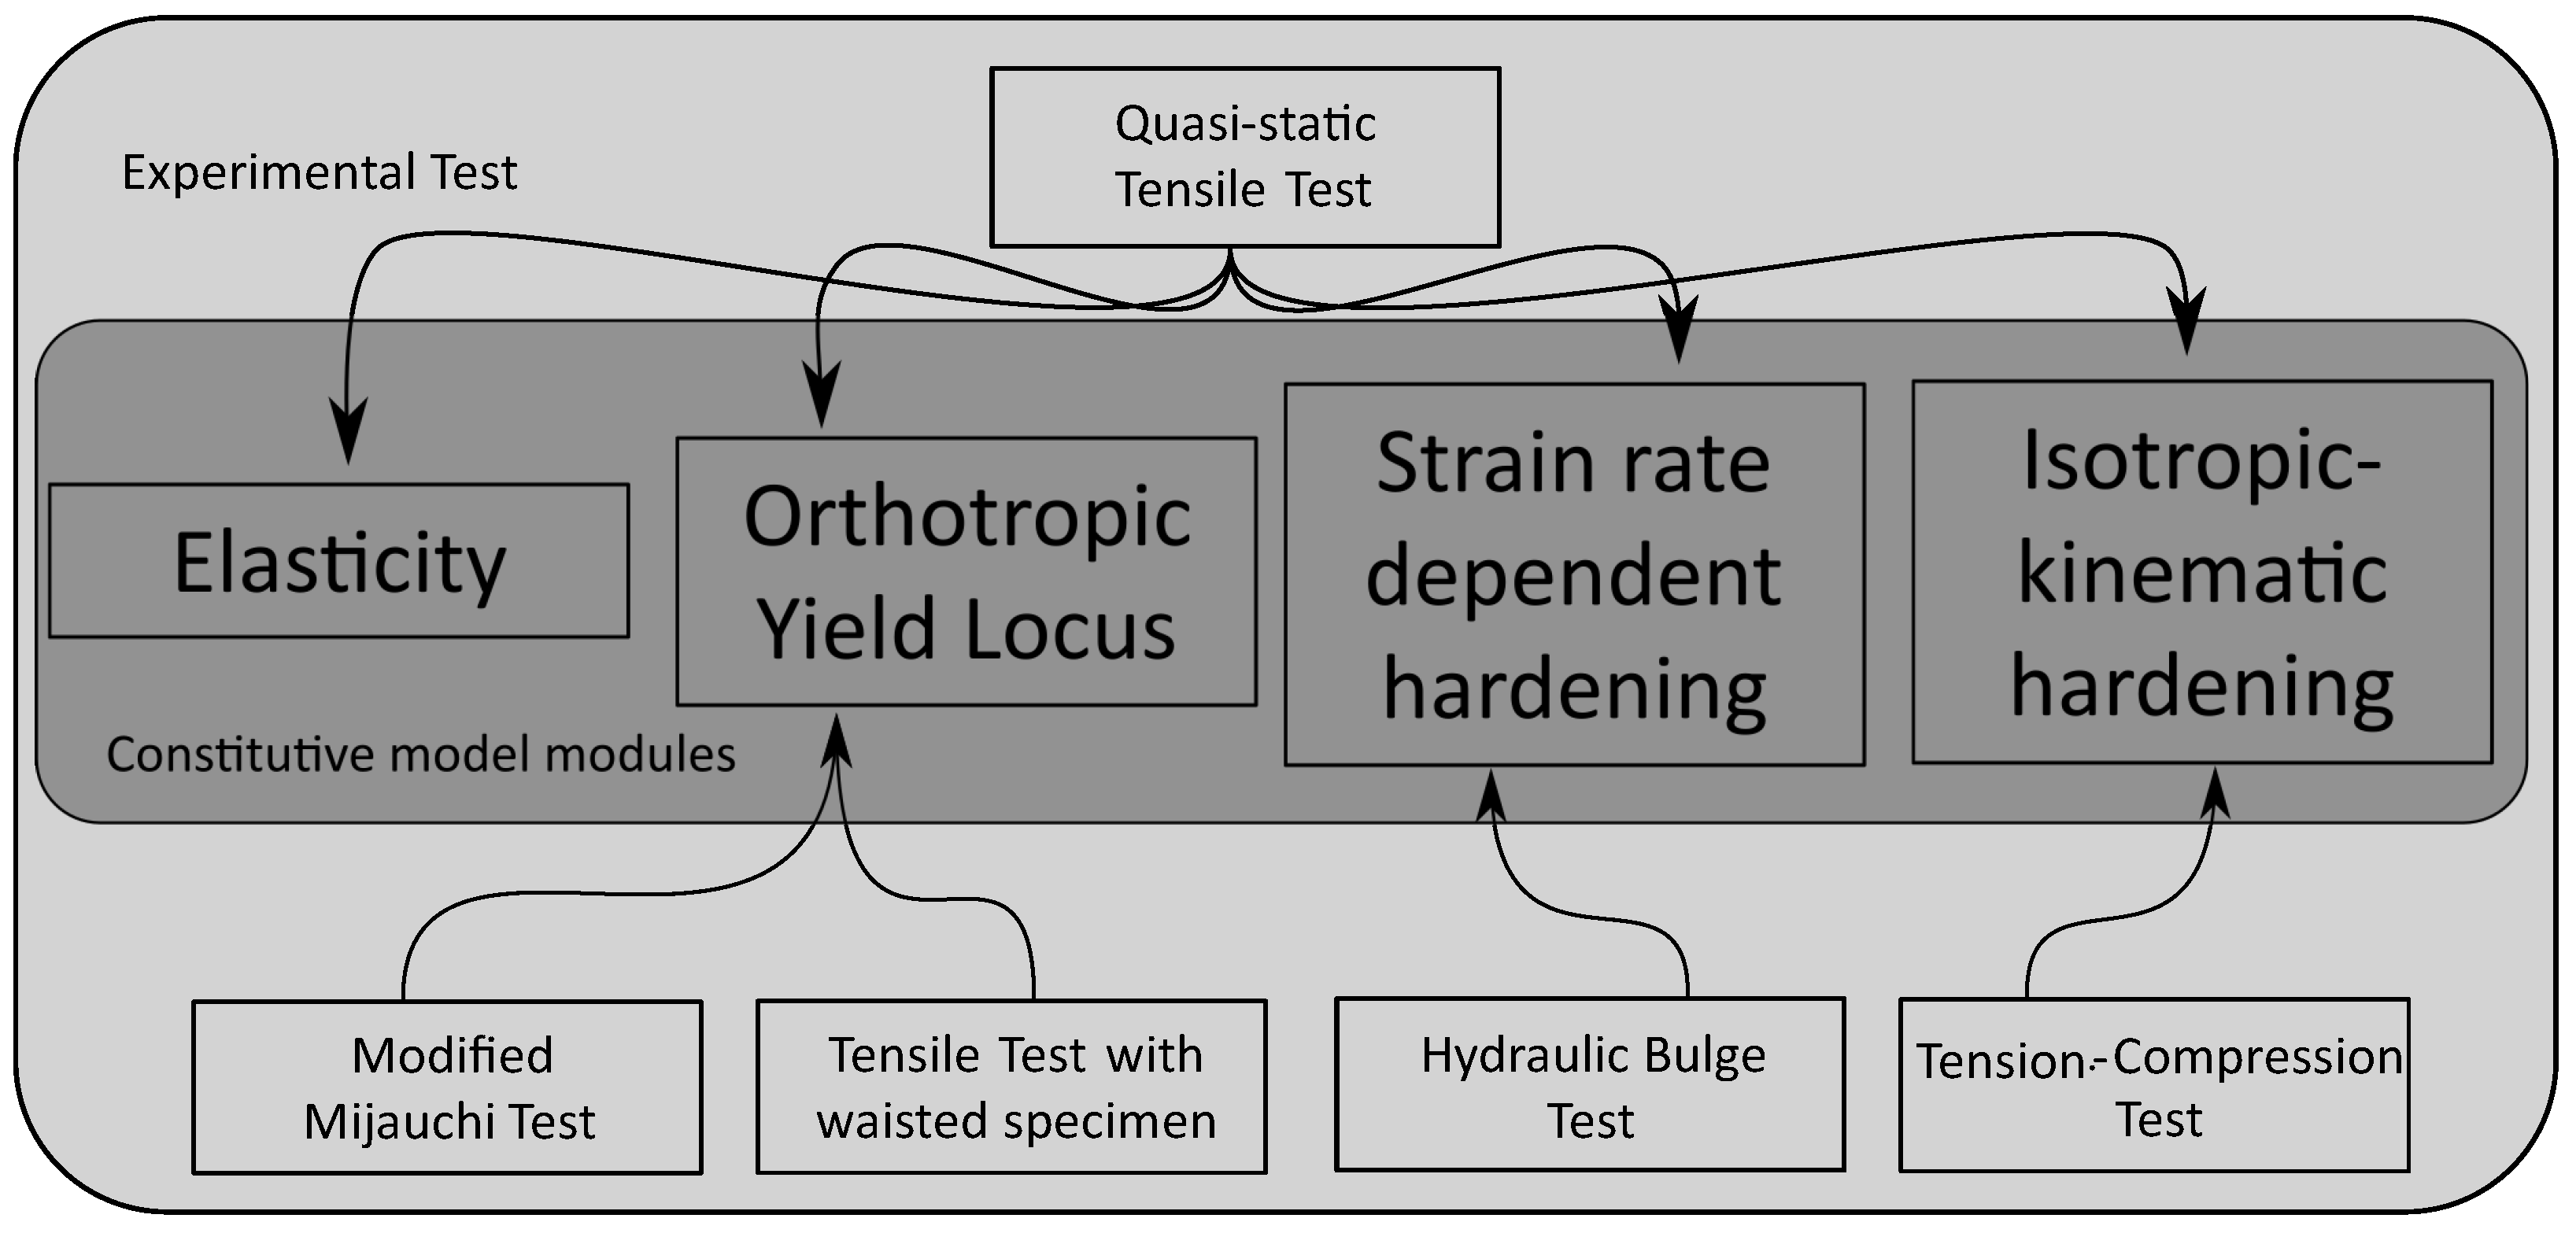
A material model can be constructed as an assembly of different modules, in which each one of these modules is the numerical description of a characteristic of the mechanical behavior of the material.
Figure 1 represents the material constitutive modelization separated by modules.
Yield Criteria
Exceeding the elastic limit of a material implies exiting the elastic regime to enter the plastic state. When considering a multiaxial stress case, such as those occurring in drawing processes, in order to find that point of regime shifting, a dependence between the principal stresses is required.
Mathematically, this is expressed by an implicit function, which is referred to as the yield function:
where
,
,
are the principal stresses and
Y is the yield stress obtained from a simple uniaxial test (tension, compression or shearing). In a three-dimensional space where the three spatial axes are the principal stresses, Equation (
1) depicts a surface commonly known as the
. In the case of plane stress (
), the yield surface degenerates into a curve in the principal stresses plane.
There is a significant contribution of the plastic anisotropy of sheet metal on the final stress distribution produced during a forming process [
24].
In this study, we will apply the non-quadratic anisotropic yield function developed to describe plane strain states, which are commonly referred to as Yld2000 [
3].
The yield function is defined as follows
where
a is the exponent describing the lattice structure of the metal where [
25] recommends a value of 6 for body-centered lattice and 8 for face-centered lattice.
is the eigenvalue of the tensor
. This tensor is the result of linear transformations of the stress tensor
, where
The linear transformation tensors and are completely determined using eight independent anisotropy coefficients to owing to the orthotropic symmetry of the rolled sheet.
and are the linear transformation tensors. They are constructed from different anisotropy coefficients, to , of the material under study.
The details of implementation can be found in the studies conducted by [
3].
However, there have been developments in advanced yield surface formulations and hardening models aimed at improving the predictive accuracy for complex behaviors of sheet metals such as BBC 2005, Barlat Yld2004-18p, and HAH, kinematic-hardening laws such as the Yoshida–Uemori model, and crystal plasticity approaches as applied to non-stable austenitic steels. The BBC2005 yield function [
26] is mathematically equivalent to Yld2000-2d, offering similar accuracy in representing initial anisotropy. For materials exhibiting stronger anisotropy and more complex yield loci, an extended version, BBC2008, was developed. This model provides the flexibility to capture complex yield surfaces, and it has been successfully used to predict earing profiles in aluminum alloys [
27]. To address general three-dimensional stress states, Yld2004-18p [
28] incorporates up to 18 anisotropy parameters through linear stress tensor transformations. Although its calibration demands additional tests, it predicts the plastic response of highly anisotropic materials with excellent accuracy but a higher computational cost.
More recent developments [
29] aim to incorporate yield surface evolution. The Homogeneous Anisotropic Hardening (HAH) model blends an anisotropic yield function (Yld2000-2d) with evolution laws for distortional hardening. This allows the yield surface to change shape and position under non-proportional loading, capturing transient anisotropy and evolving r-values. These advanced models, while computationally more intensive, provide significantly improved predictions for strain-path-dependent behavior.
With regard to the industrial implementation, many of the discussed models have found their way into commercial FEA software, bridging academic developments with practical use. LS-DYNA has a rich library: Hill48, Barlat Yld91 and Yld2000, and Barlat Yld2004-18p are available, as well as Yoshida–Uemori. Abaqus provides Hill48 and a general anisotropic yield potential that users have used to implement Barlat/Yld models and even HAH formulations. PAM-STAMP and AutoForm, specialized for sheet forming, offer built-in advanced yield criteria. PAM-STAMP includes Hill48, Vegter 2017, BBC 2005/2008, etc., and allows mixed isotropic–kinematic hardening. AutoForm has also incorporated user-defined yield surfaces in recent versions to meet the demands of AHSS forming.
Despite these successes, there are trade-offs. More complex models require more material testing for calibration. Industrial users will adopt a new model only if its benefits clearly outweigh the costs. The trend shows an increasing adoption of advanced anisotropy models as the material behavior becomes a limiting factor in simulation accuracy.
The choice of the Yld2000 model for this study is based on two key aspects: previous work has demonstrated that the Hill48 model does not adequately capture the complexity of non-stable austenitic steel 1.4301, underestimation of yield stresses, and r-values. Hill48 with conventional isotropic hardening drastically under-predicts yield stresses in certain directions once plastic strain increases [
30,
31], leading to its dismissal for this application; moreover, the Barlat Yld2000 model is the most widely adopted in the industry and was the first approach applied to this industrial application [
32,
33,
34].
Its continued relevance in the field is due to its proven accuracy and reliability in capturing the complex mechanical responses of materials under various loading conditions. The model’s capability to describe orthotropic yield loci and incorporate isotropic–kinematic hardening effects makes it particularly suitable for the study of sheet metals, such as the austenitic steel 1.4301 used in this research. By employing the Barlat Yld2000 model, this study leverages a well-established and validated framework to ensure the reliability and comparability of the simulation results. This choice not only facilitates a deeper understanding of the springback phenomenon in industrial applications but also enables a meaningful comparison between experimental data and numerical predictions, reinforcing the study’s findings with a robust theoretical foundation.
2.2. Material Characterization
Austenitic stainless steel 1.4301 was selected based on its superior degree of corrosion resistance, validated by rigorous high-quality standards testing protocols, ensuring exceptional durability in aggressive environments such as acids and high temperatures. Furthermore, the alloy’s stability at elevated temperatures is notable, as it effectively resists decolorization, which is a critical factor in home appliances where thermal exposure could compromise aesthetic integrity.
Traditional austenitic stainless steels with 0.18 Cr and 0.08 Ni composition undergo a martensitic phase transformation when a change in temperature, stress or plastic strain occurs [
35]. This is due to the fact that the FCC lattice of the austenite is not thermodynamically stable at room temperature. To initiate the phase transformation, the critical activation energy must be exceeded [
36].
The phase transformation of austenitic steels depends on multiples conditions, such as the initial amount of martensite, temperature, strain rate and stress state. The intrinsic hardening of the material is coupled to the relative composition of austenite and martensite. The output of this hardening behavior is different hardening curves for different stress states while generating a high sensitivity to strain rate at the same time. Since springback simulation is the final focus of this study, it is important to describe the yield strength after load reversal during unloading; therefore, an isotropic–kinematic hardening model is needed.
The experimental work for the definition of the material data considered in the modules mentioned in
Figure 1 is centered on three of them: orthotropic yield locus, strain rate-dependent hardening and isotropic–kinematic hardening.
2.2.1. Orthotropic Yield Locus
The Lankford value (r-value) [
37] is a material parameter widely used to evaluate the out-of-plane plastic anisotropy of sheet metal. It is defined as the ratio of the plastic strain in the ortogonal direction of the applied load to the plastic strain in the thickness direction (out-of-plane) while performing a uniaxial tensile test [
38].
Quasi-static tensile tests at a strain rate of 0.004
is performed in
,
and
to the rolling direction for
mm blank thickness. From this experimental work-hardening test, the planar orthotropy of the yield strength and Lankford coefficients are extracted, as shown in
Figure 2.
The resulting parameters for the material selected are listed in
Table 1 and
Table 2.
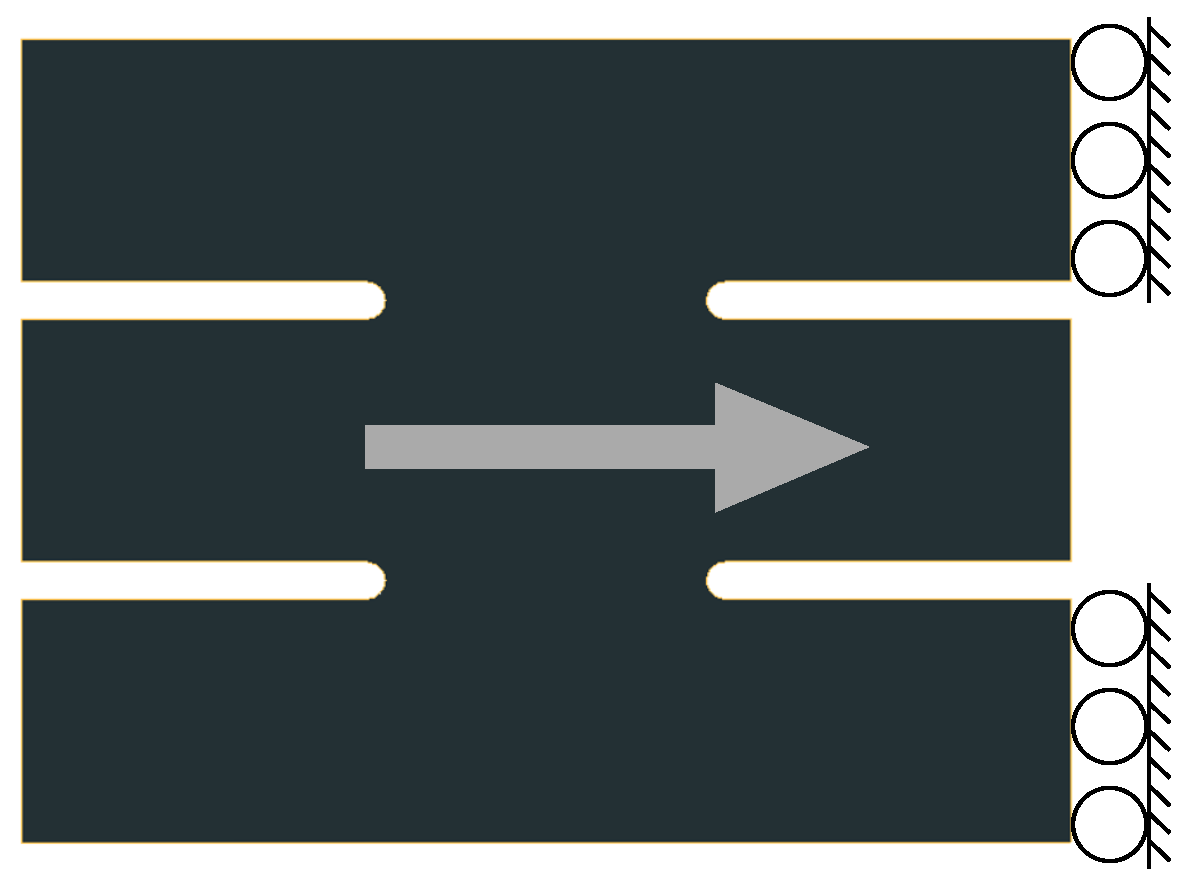
The yield strength in equibiaxial tension is also an input for building the yield locus. To fullfill the yield locus, a modified Miyauchi test [
39] with grooves in the shear deformation zone is used. Miyauchi sugessted a simple shear test with two shear zones. As shown in
Figure 3, the specimen has three bars that are all fixed or clamped to the universal machine.
These three bars are connected by the regions that will be analyzed. When the middle bar is loaded, the connecting regions will be deformed by shear deformation. One of the advantages of this test is that this geometry reduces the rotation of the shear zone during loading. From this test, the yield limit and flow stress in pure shear are obtained together with the yield strength in shear.
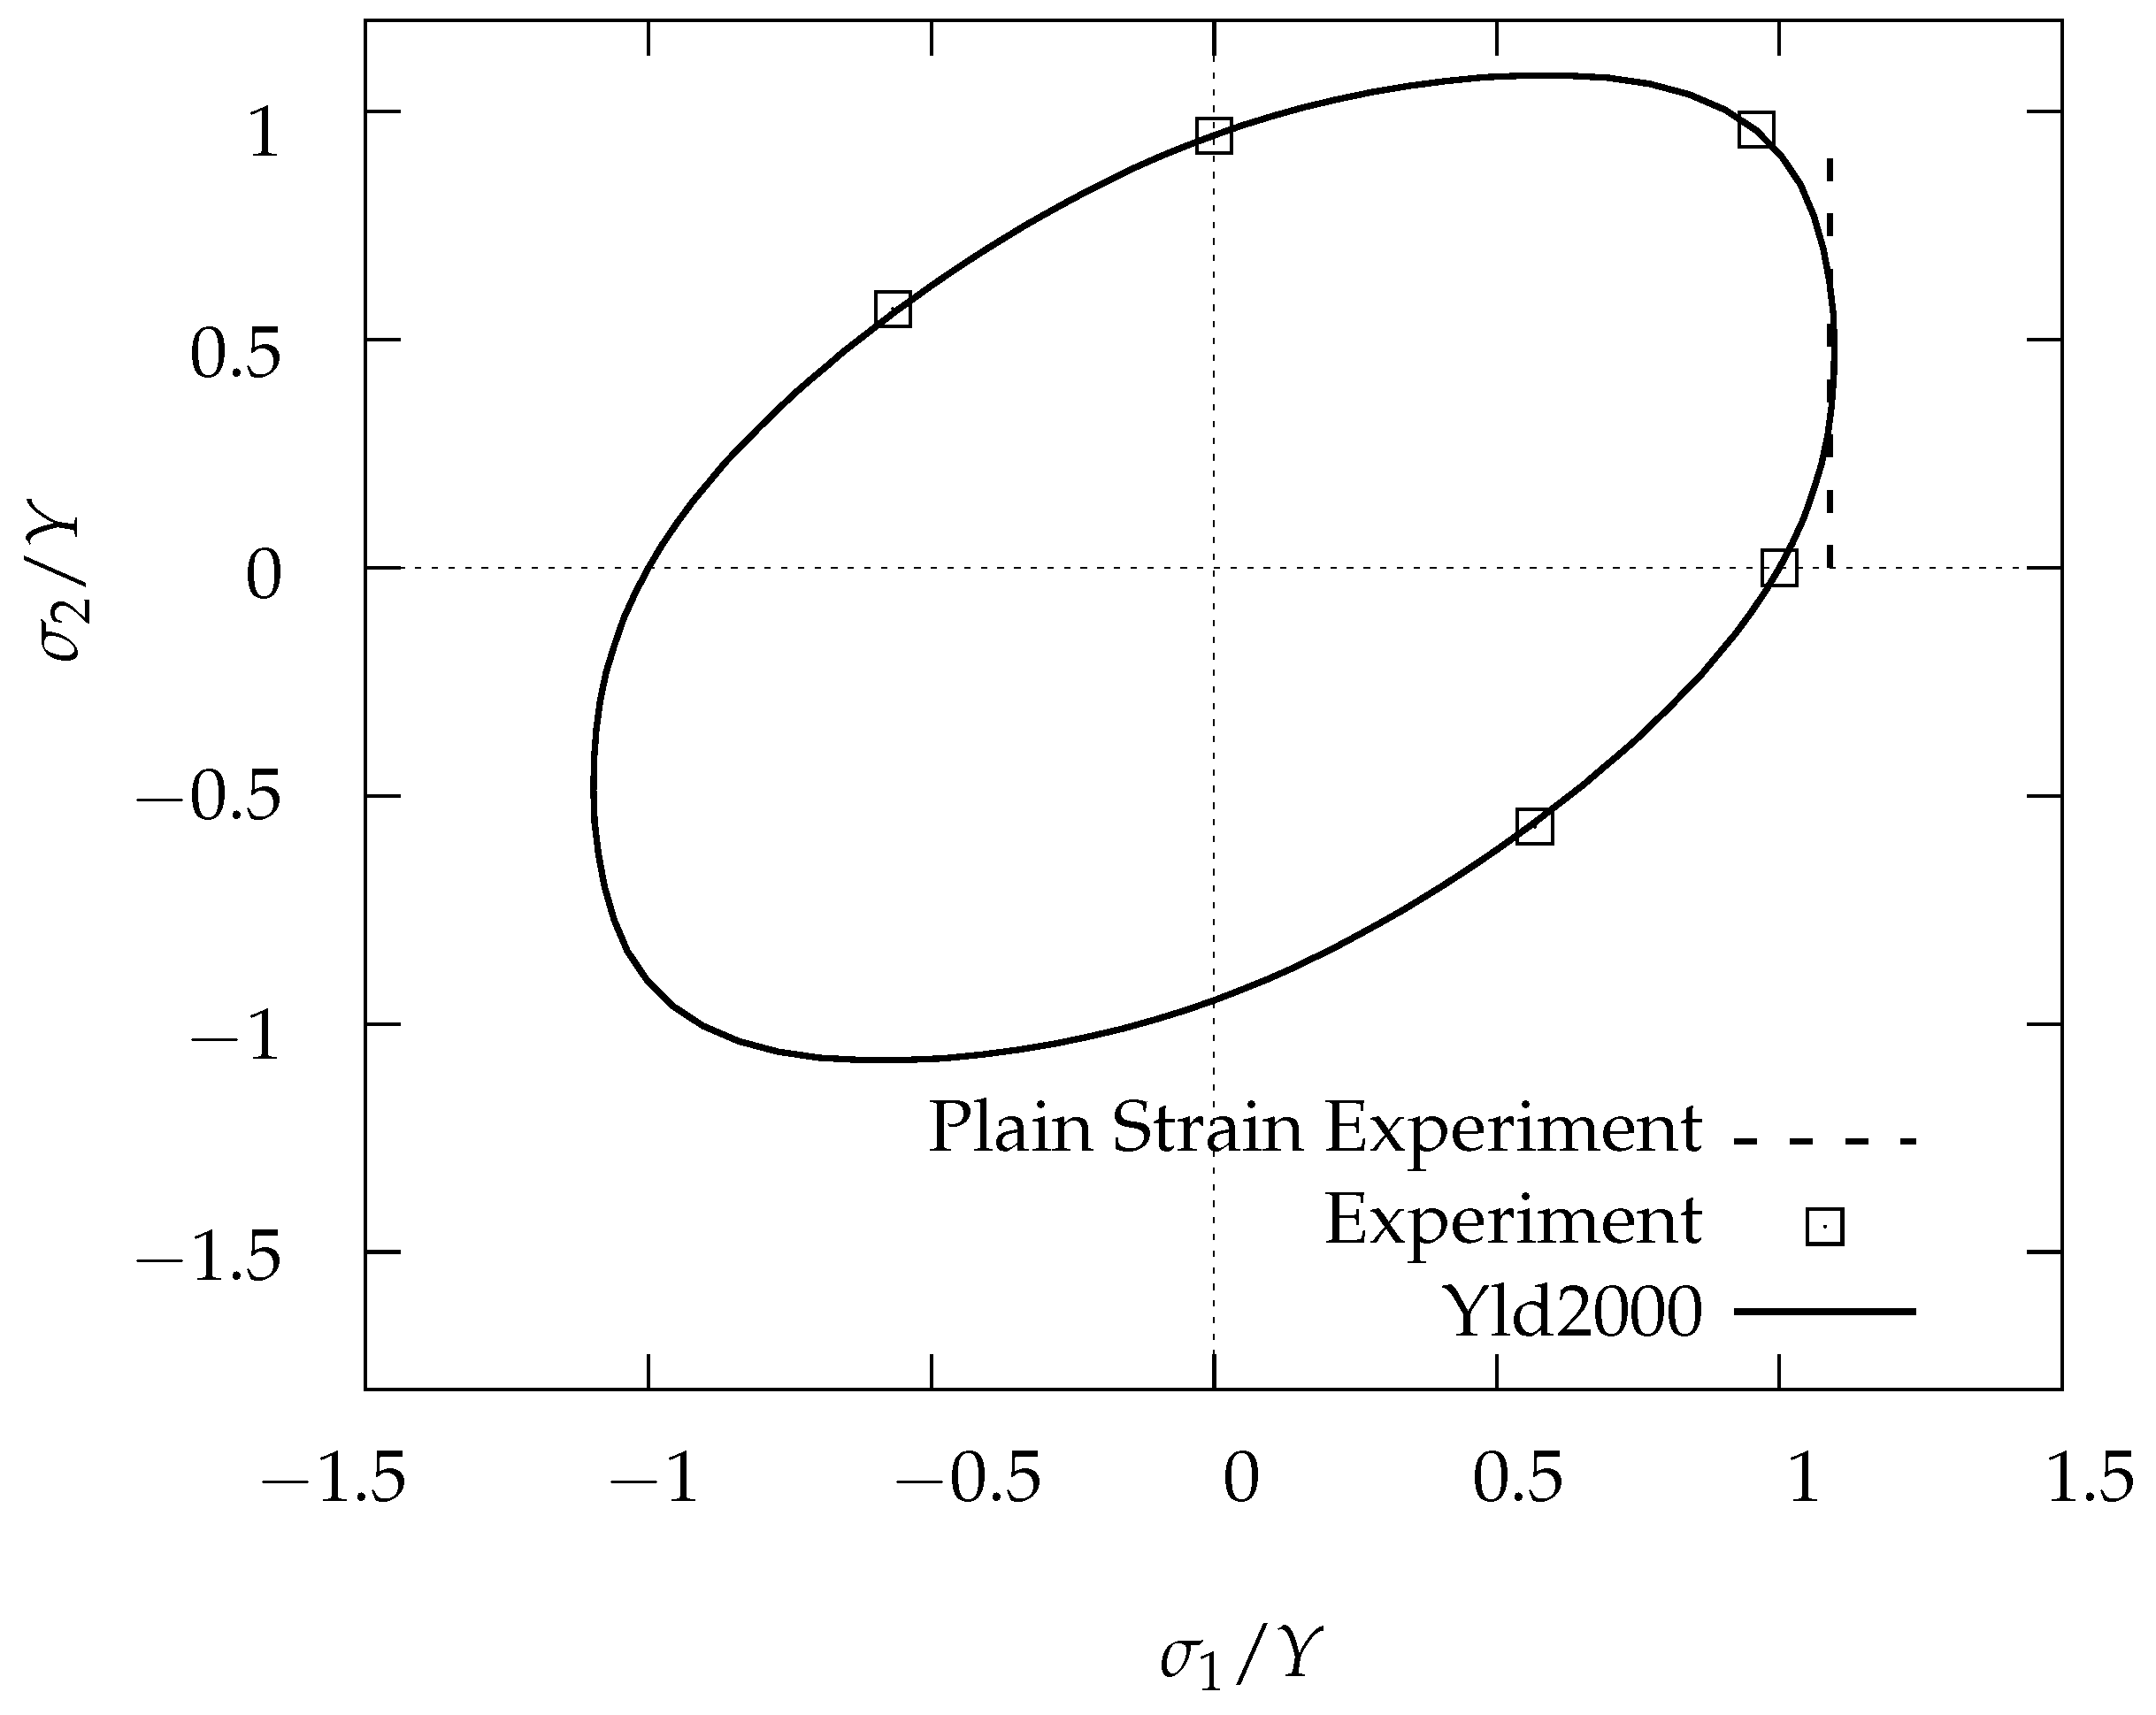
A tensile test with a wasted specimen (plane strain tension in the center of the specimen) is used to iteratively calibrate the size of the yield locus in plane strain tension (mainly by changing the exponent of the yield locus). In
Figure 4, experimental results are shown together with the yield locus described by Equation (
2).
2.2.2. Strain Rate-Dependent Hardening
Contrary to the traditional assumption that strain rate effects are negligible in predicting cold-work metal flow, recent studies have demonstrated that strain rate can play a significant role, particularly with respect to springback phenomena. Increased strain rate sensitivity enhances the limiting draw ratio [
40], thereby altering the stress distribution during forming and implying a corresponding influence on springback behavior. Similarly, high strain rates delay the onset of plastic instability, promoting more homogeneous deformation and reducing localized stress concentrations that typically exacerbate springback upon unloading [
41]. Furthermore, investigations by [
42] observed that high-speed processes, such as impact hydroforming, yield enhanced formability and a more favorable springback response, as the rapid deformation minimizes the time available for stress relaxation and residual stress accumulation. A methodology that correlates higher strain rates with reduced springback in sheet metals further substantiated these findings [
43], thereby emphasizing the importance of incorporating strain rate effects into predictive models for improved accuracy in industrial applications.
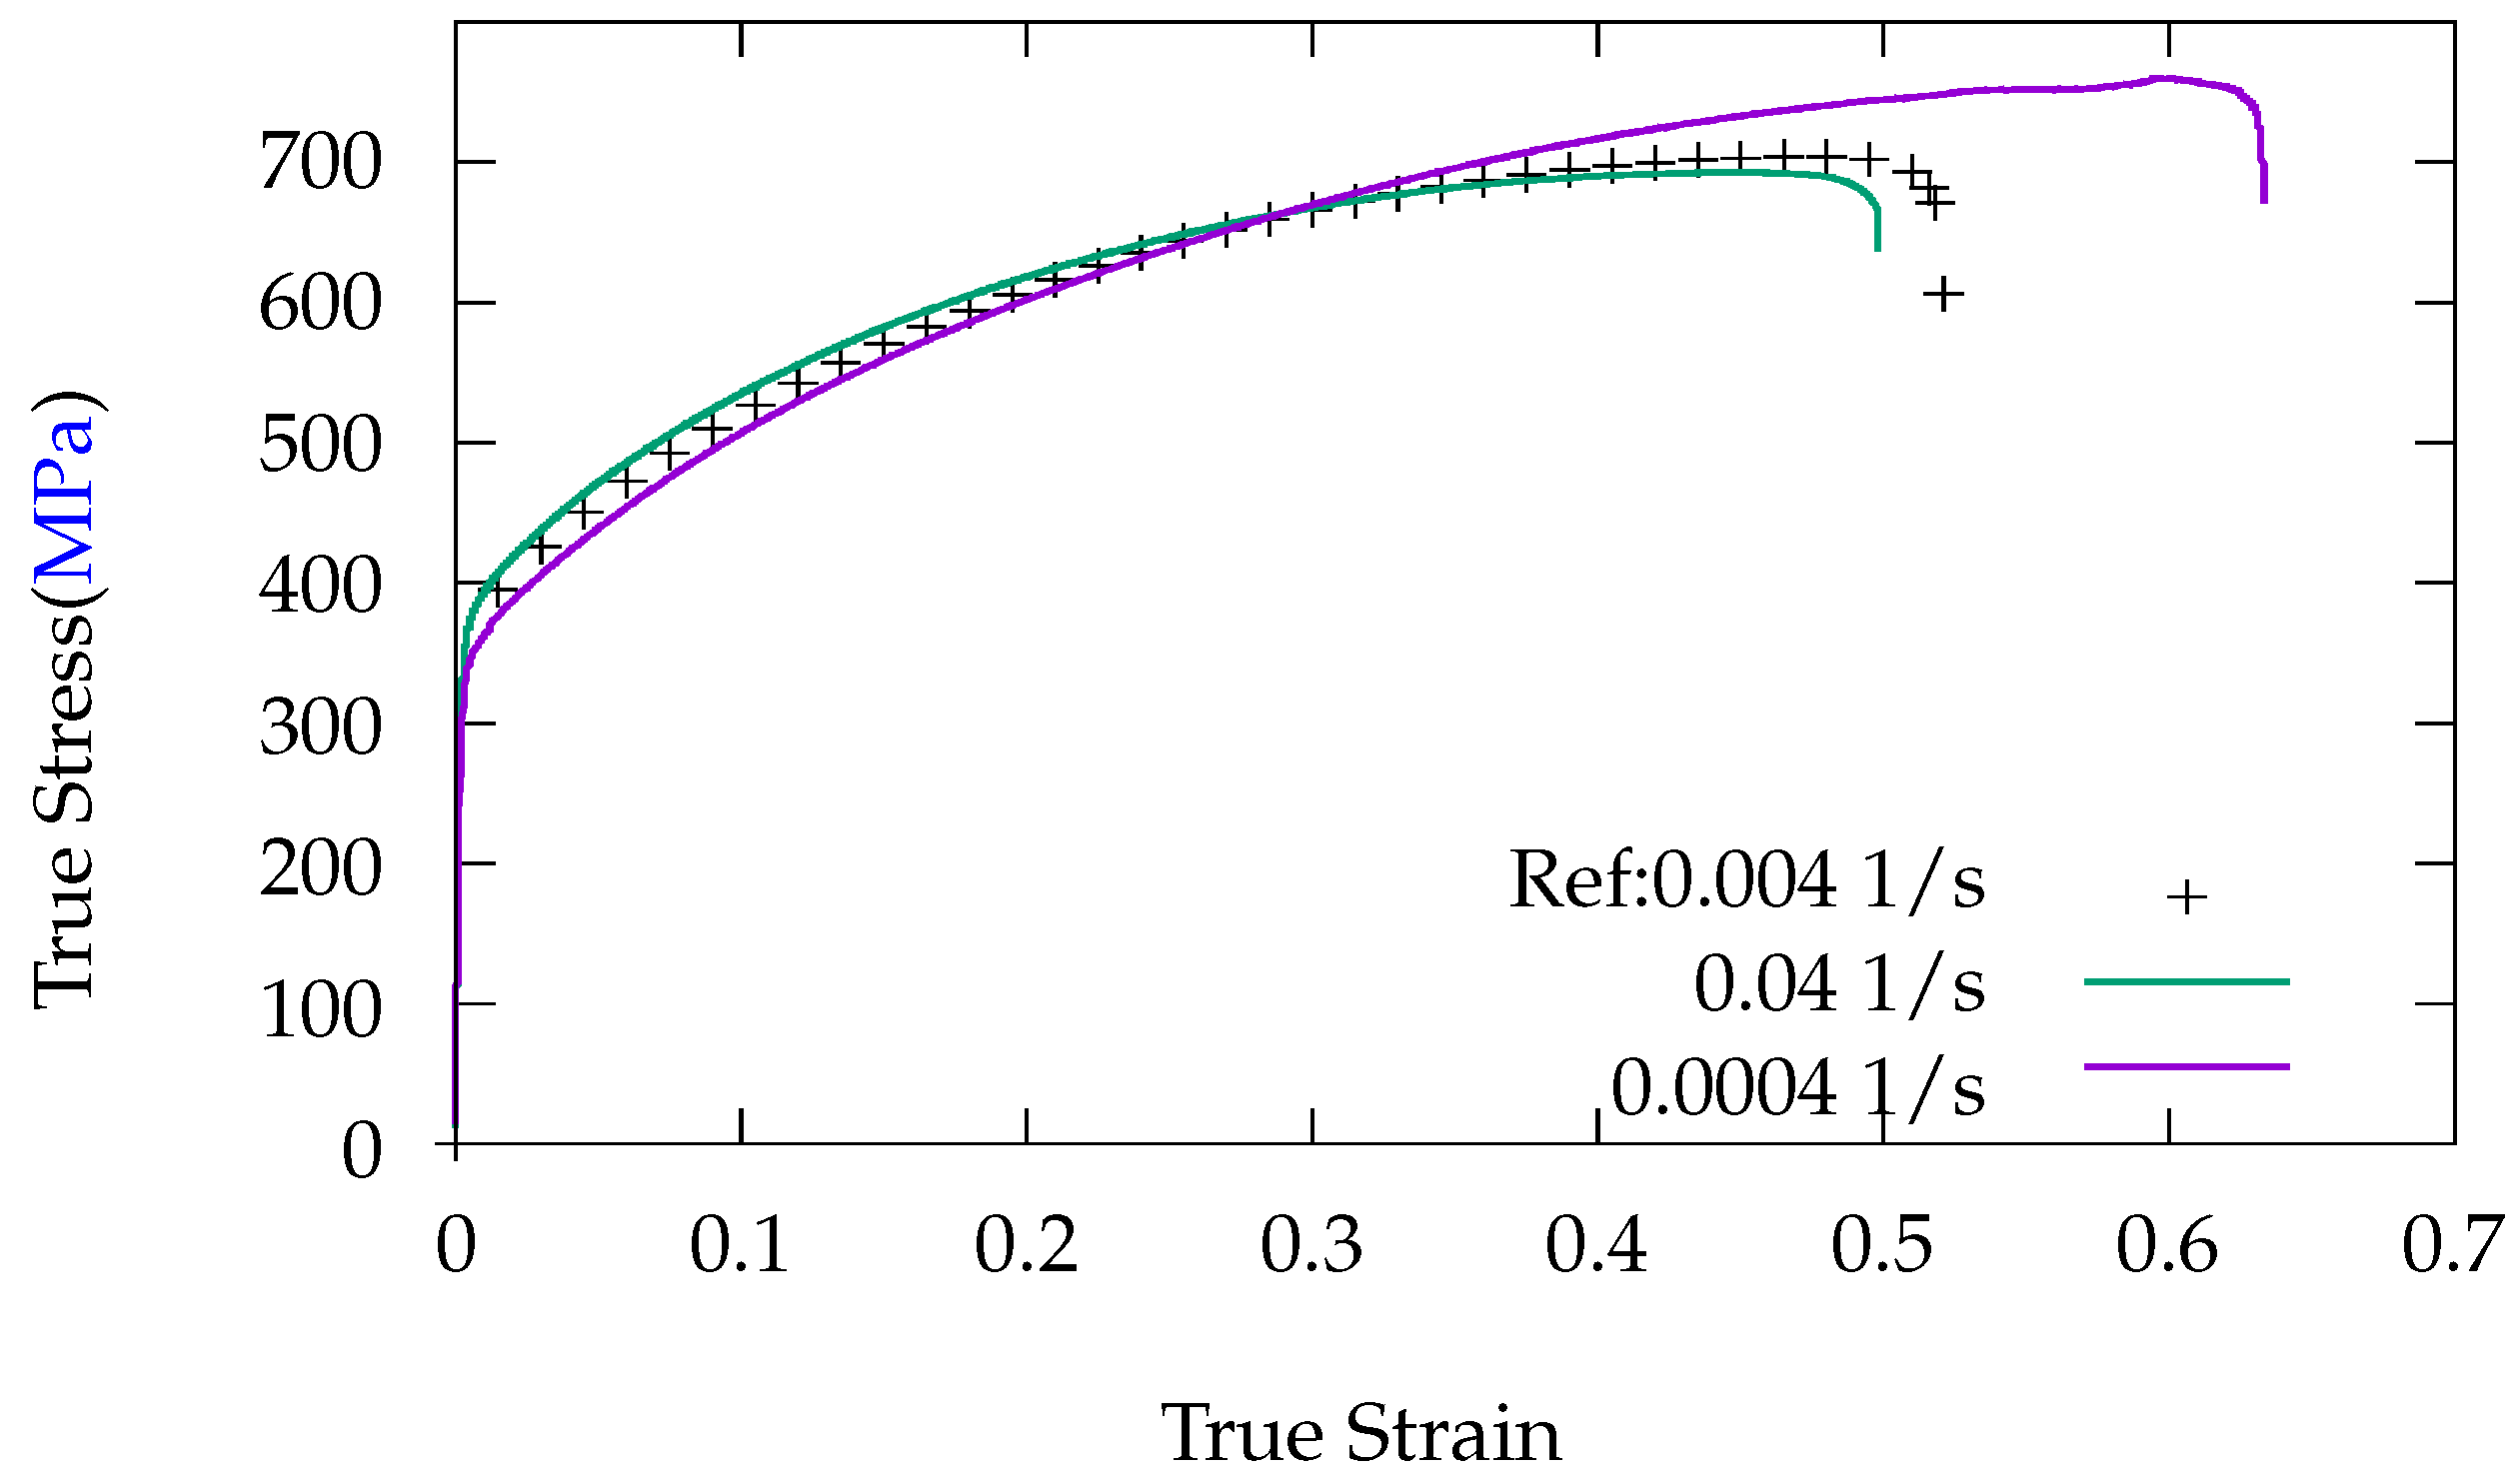
To determine the sensitivity to strain rate of the material, further uniaxial tensile tests are conducted. A strain rate bracketing is defined with a factor of 10 relative to the quasi-static tensile reference strain rate 0.004
. In
Figure 5, experimental results are shown.
The evaluation of the strain hardening in the uniaxial tension test is limited to the uniform elongation. Significantly higher equivalent strains can be reached in a deep drawing process. It is not known which numerical strain-hardening law can be applied for the extrapolation of the strain hardening up to high strains. In order to describe the flow behavior for high equivalent strains correctly, testing techniques other than uniaxial tension, that allow the measurement of the flow stress up to high levels of plastic strain, must be used. A bulge test with a controlled strain rate is performed. The hydraulic bulge test gathers the strain-hardening curve in a regime beyond the uniform elongation of the tensile tests and is used to identify the best analytical strain-hardening model in addition to the tensile test data.
Swift [
44], Ghosh [
45] and Hockett-Sherby [
46] have been compared in this study. A fitting procedure is applied to identify the strain-hardening law that describes the hardening best. Since Hockett–Sherby produces the optimal fit to the experimental curves, work hardening is approximated by its stress–strain relation from reference strain rate data [
46].
The initial yield stress (
), saturation yield (
), exponent in the Hockett–Sherby approach (n) and plastic strain (c) parameters are shown in
Table 3.
Determination of the yield locus parameters involves normalizing experimental yield stresses and r-values using the rolling direction as a reference. Data from uniaxial, biaxial, and shear tests are integrated into a gradient-based optimization that minimizes squared differences between predicted and measured values. Weighting factors are applied to balance the contributions from each test. The yield locus exponent is constrained to remain within a realistic range (typically capped at 8) to avoid unphysical sharp corners. Iterative plane strain simulations fine-tune the exponent to accurately capture the material’s anisotropic behavior.
2.2.3. Isotropic–Kinematic Hardening
To quantify the isotropic–kinematic hardening, additional tension–compression and compression–tension tests are performed. To describe the evolution and saturation of the Bauschinger effect, uniaxial compression tests after different prestrains under tension are performed. To describe the relaxation of kinematic hardening after load, reversal uniaxial tension tests following a predeformation under compression are performed as well.
Figure 6 shows the performance of Yld2000 for the compression/tension test.
2.3. Procedures
2.3.1. Part Manufacturing Process
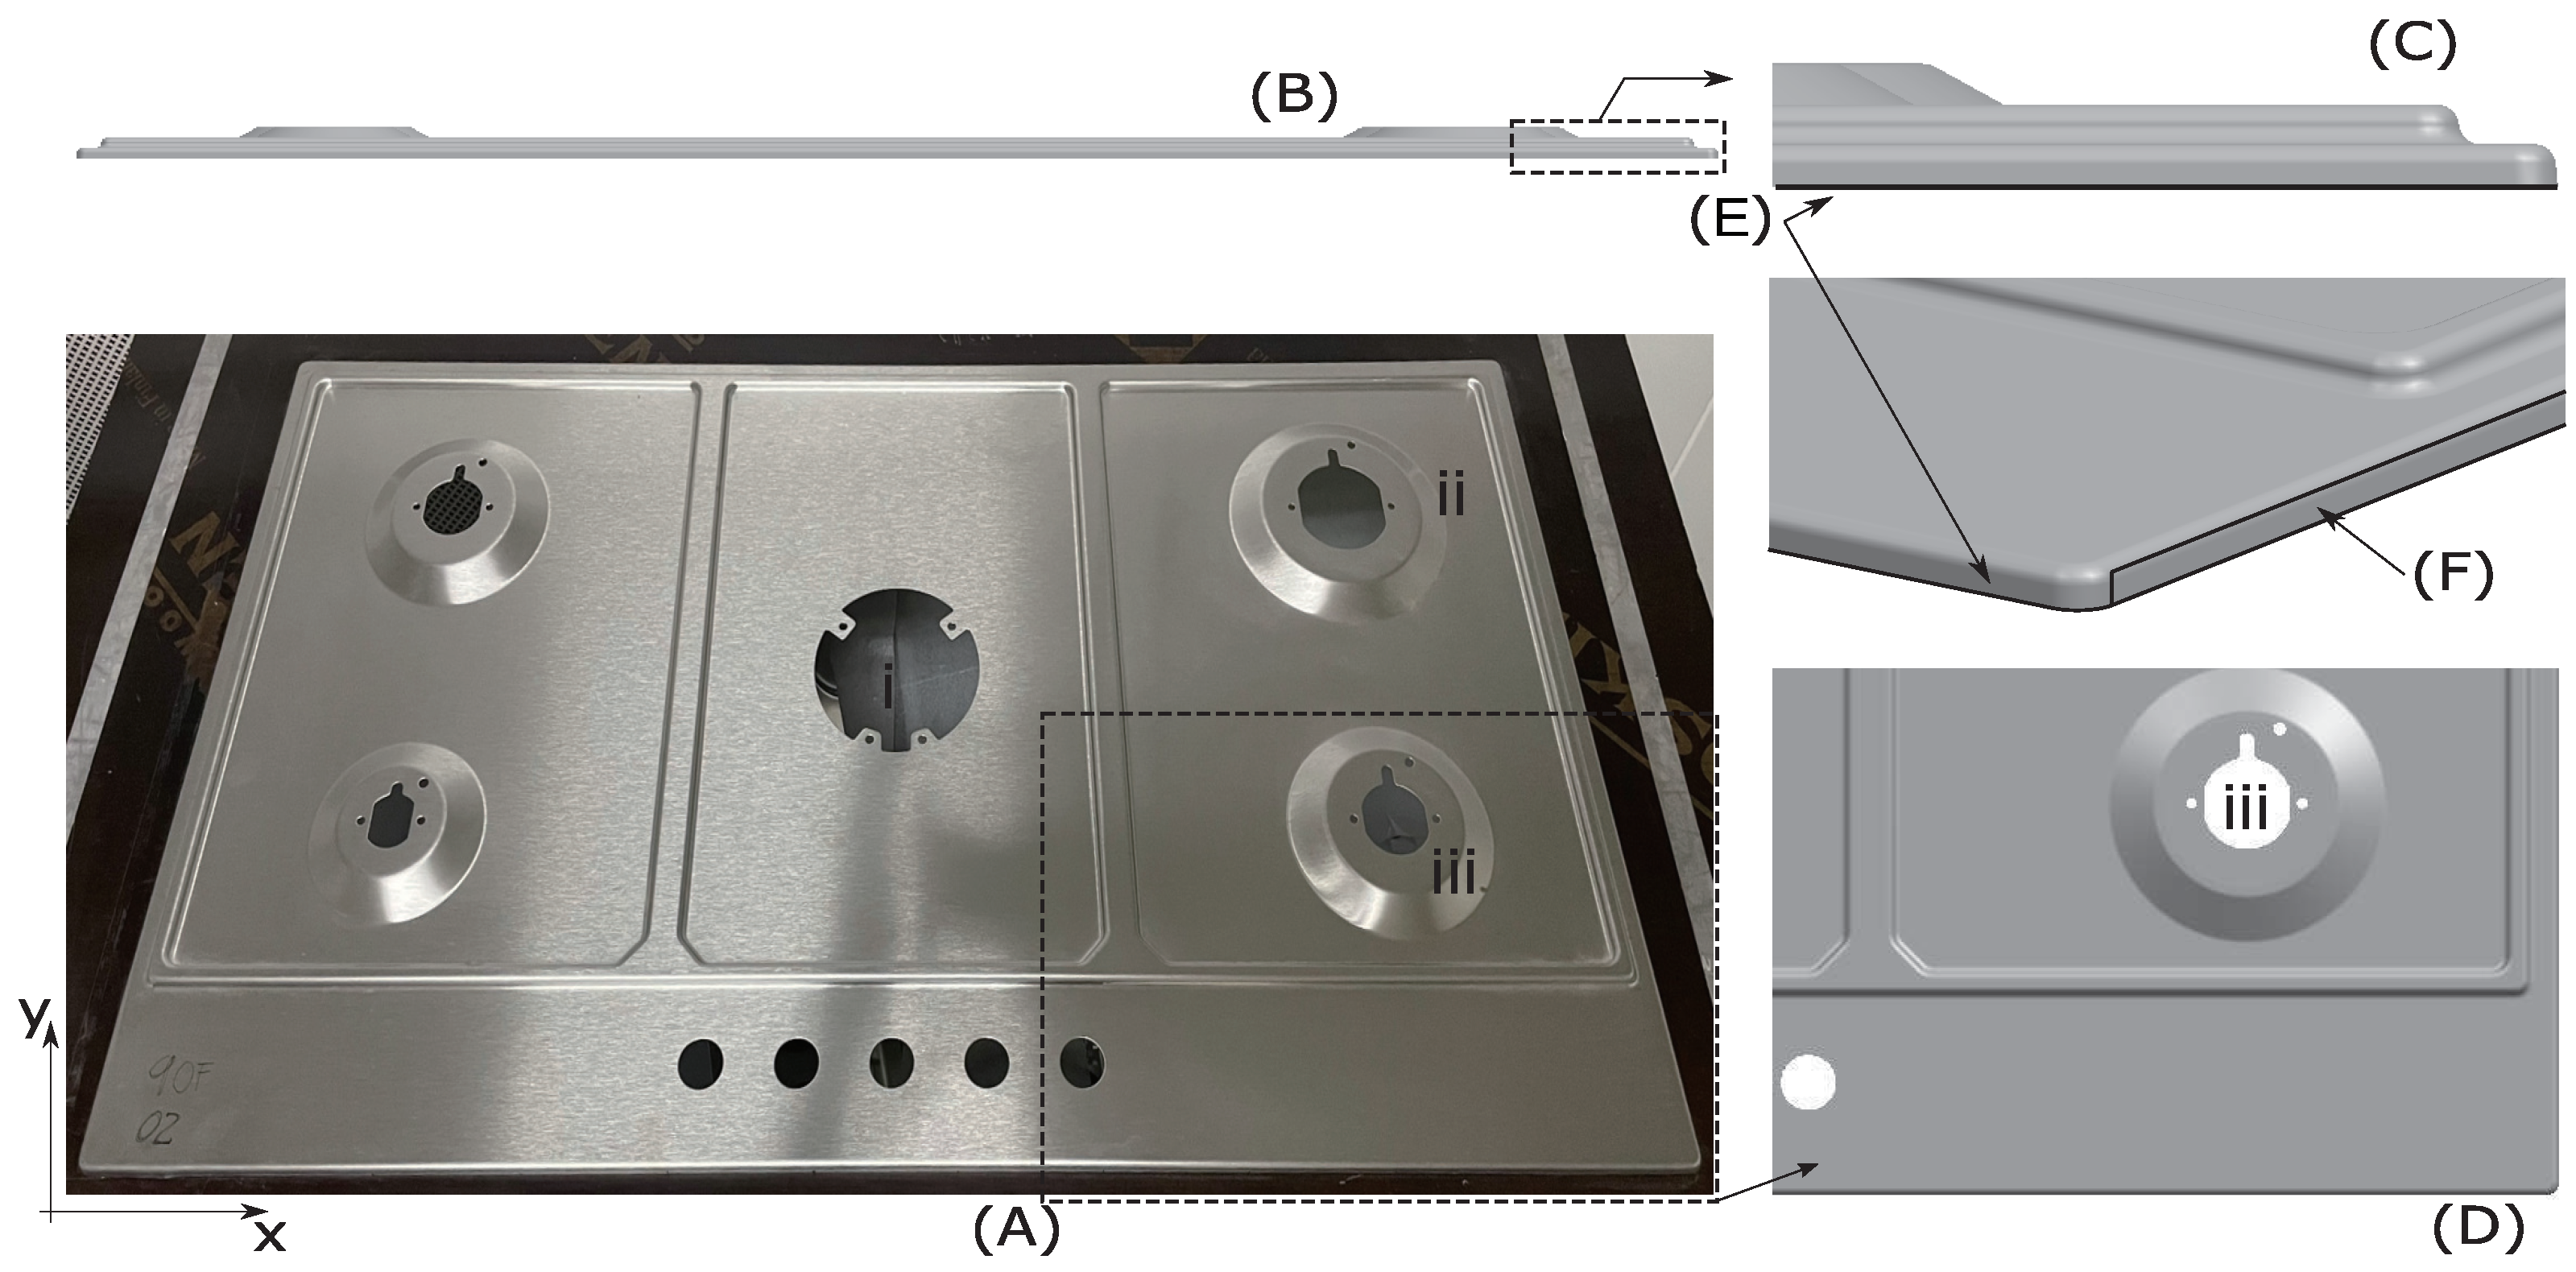
The part subjected to study in this work is a component of a gas cooktop (see
Figure 7). One of the main tasks of this component in the appliance system is to set up a peripheral watertight enclosure within the worktop.
In order to fulfill this task, the contact edge of this component, shown in
Figure 7E, should be coplanar to the reference plane generated by the worktop. Any springback deflection will generate the violation of the co-planarity within the worktop and the contact edge of the top sheet.
The part is manufactured by a drawing process, which is followed by two trimming stages. After these three stages, the part is tested in a jig, where the planarity of the edge that will be in contact with the cooktop is going to be measured.
The blank is pre-cut with a dimension of 990 × 595 × 0.8 mm. The forming process is a one-stage operation. The blank-holder and die include drawbeds, and the punch is fixed. The die comes down, stamping the drawbeds and displacing the blank holder preloaded with the selected BHF, which remains constant during the die motion to the home position.
After this process, the stamped part is taken to the next stage for the horizontal trimming. This trimming consists of a 2D cut in the plane generated by the edge shown in
Figure 7E. The final trimming is a vertical punch to produce the geometries of the burners zones shown in
Figure 7(i,ii,iii) as well as the circular pattern in the front of the part.
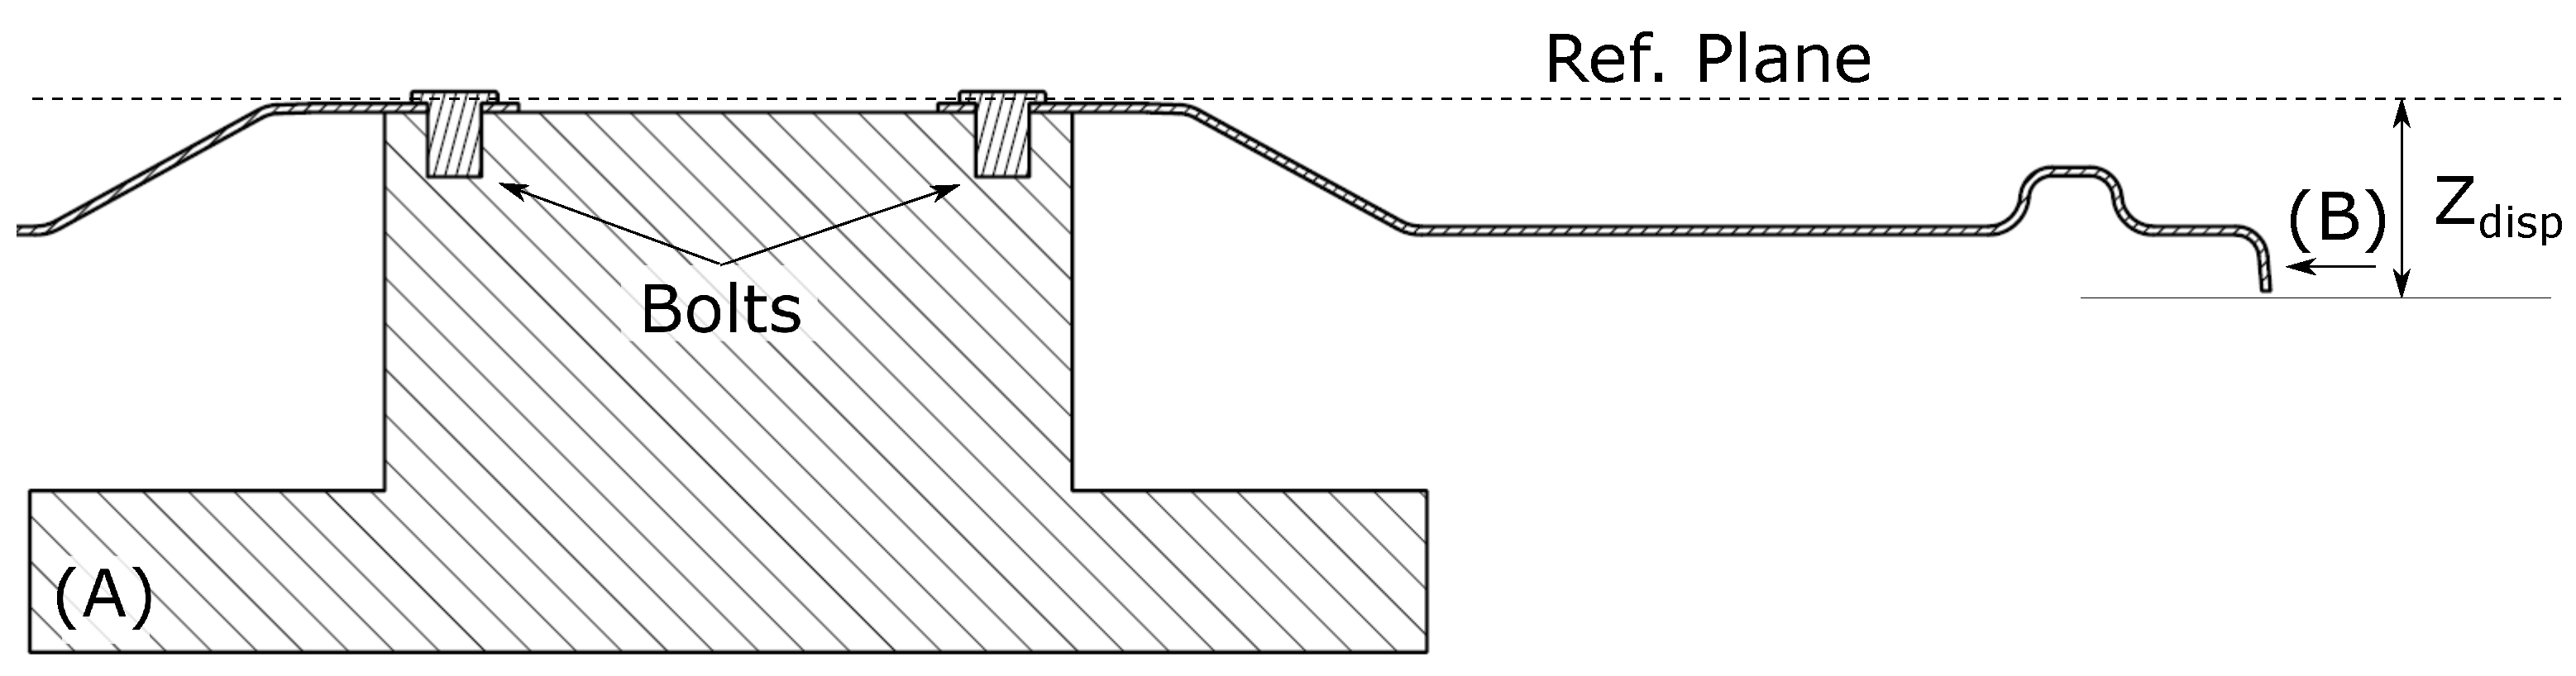
At this stage, the part is definitively manufactured. Since the deformations generated by springback phenomena depend on the equilibrium between external and internal forces, it is possible to have multiple springback deformation cases for a single part just by altering the external conditions. For that reason, a measuring jig (in
Figure 8) is used in order to assure all parts are measured under the same conditions, mimicking the assembly conditions of the part.
The final part is assembled to the jig by bolts around the burner zones (i) to (iii) shown in
Figure 7. This kind of fixation leaves the part absolutely free at the edge ((E), as shown in
Figure 7). Once the part releases the elastic energy, springback is measured. Z displacement from a reference plane (shown in
Figure 8,
) to the edge position against the relative perimeter position of the point measured is plotted as a result.
Figure 8 shows a schematic of the set-up.
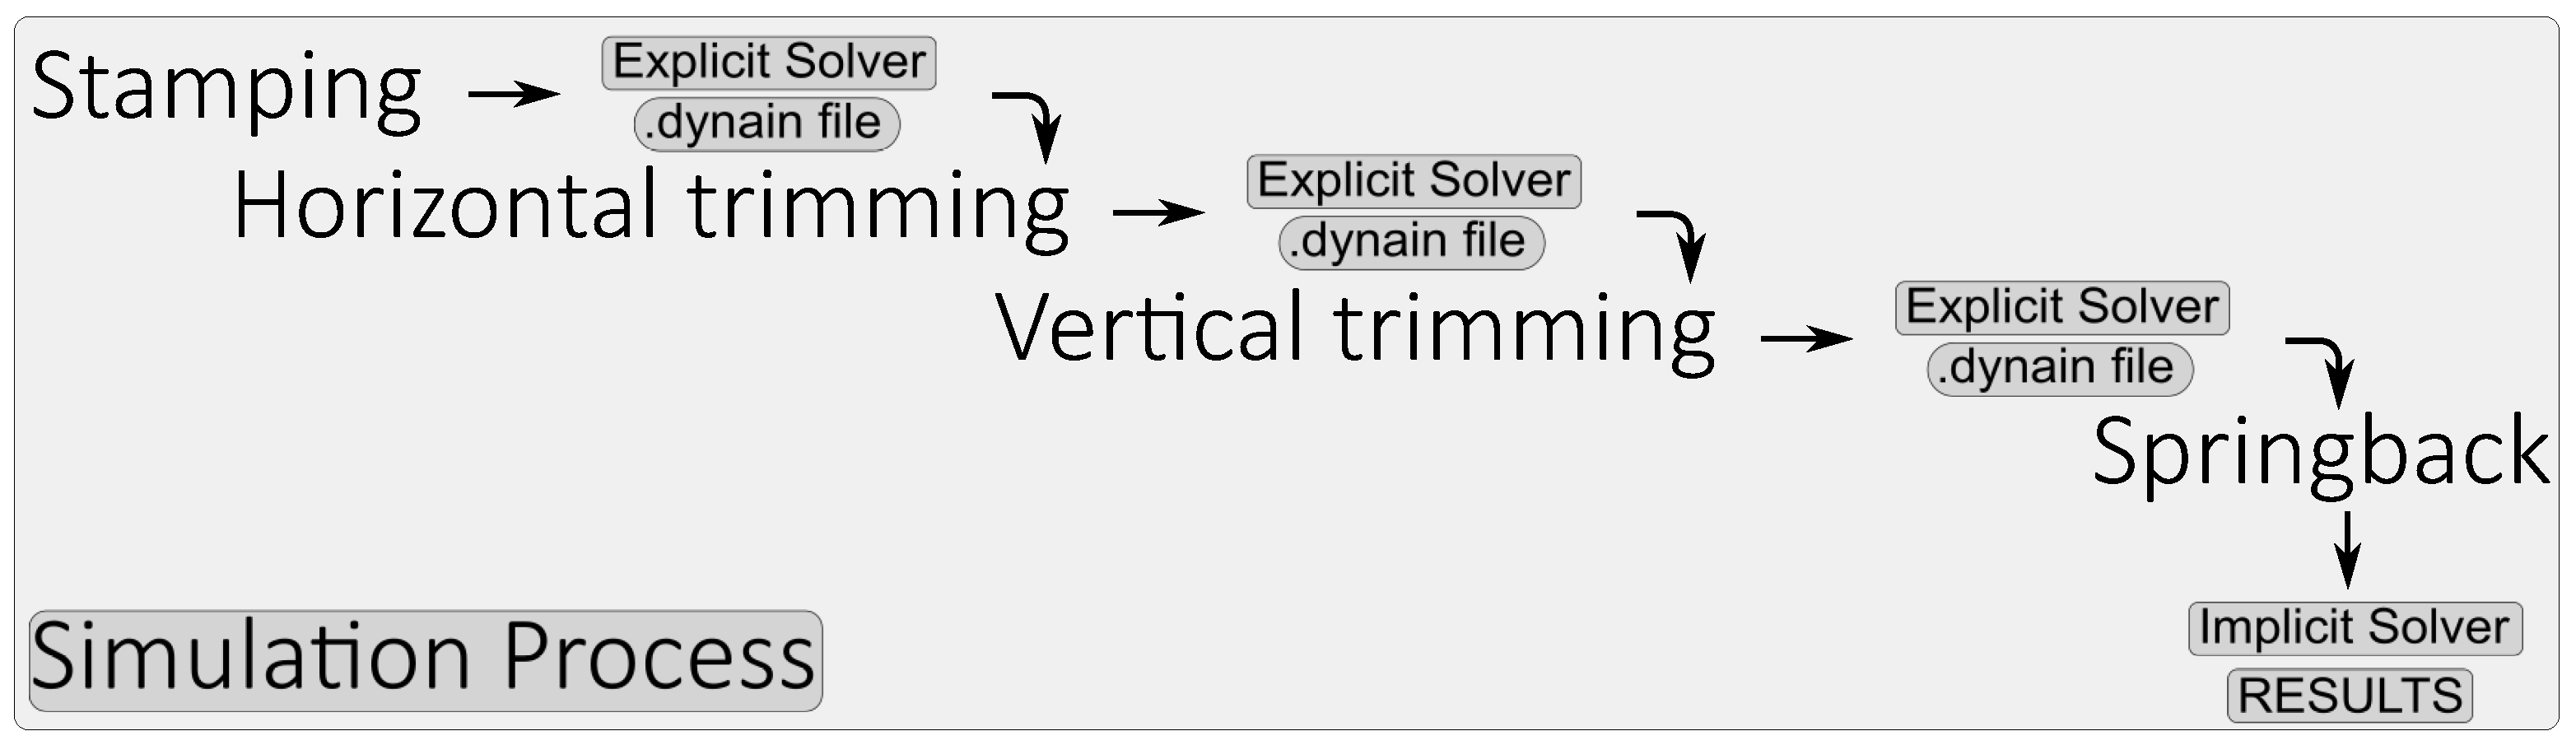
2.3.2. Simulation Process
For both drawing and trimming stages, simulation analyses were performed in LsDyna/Explicit R10.1.0.
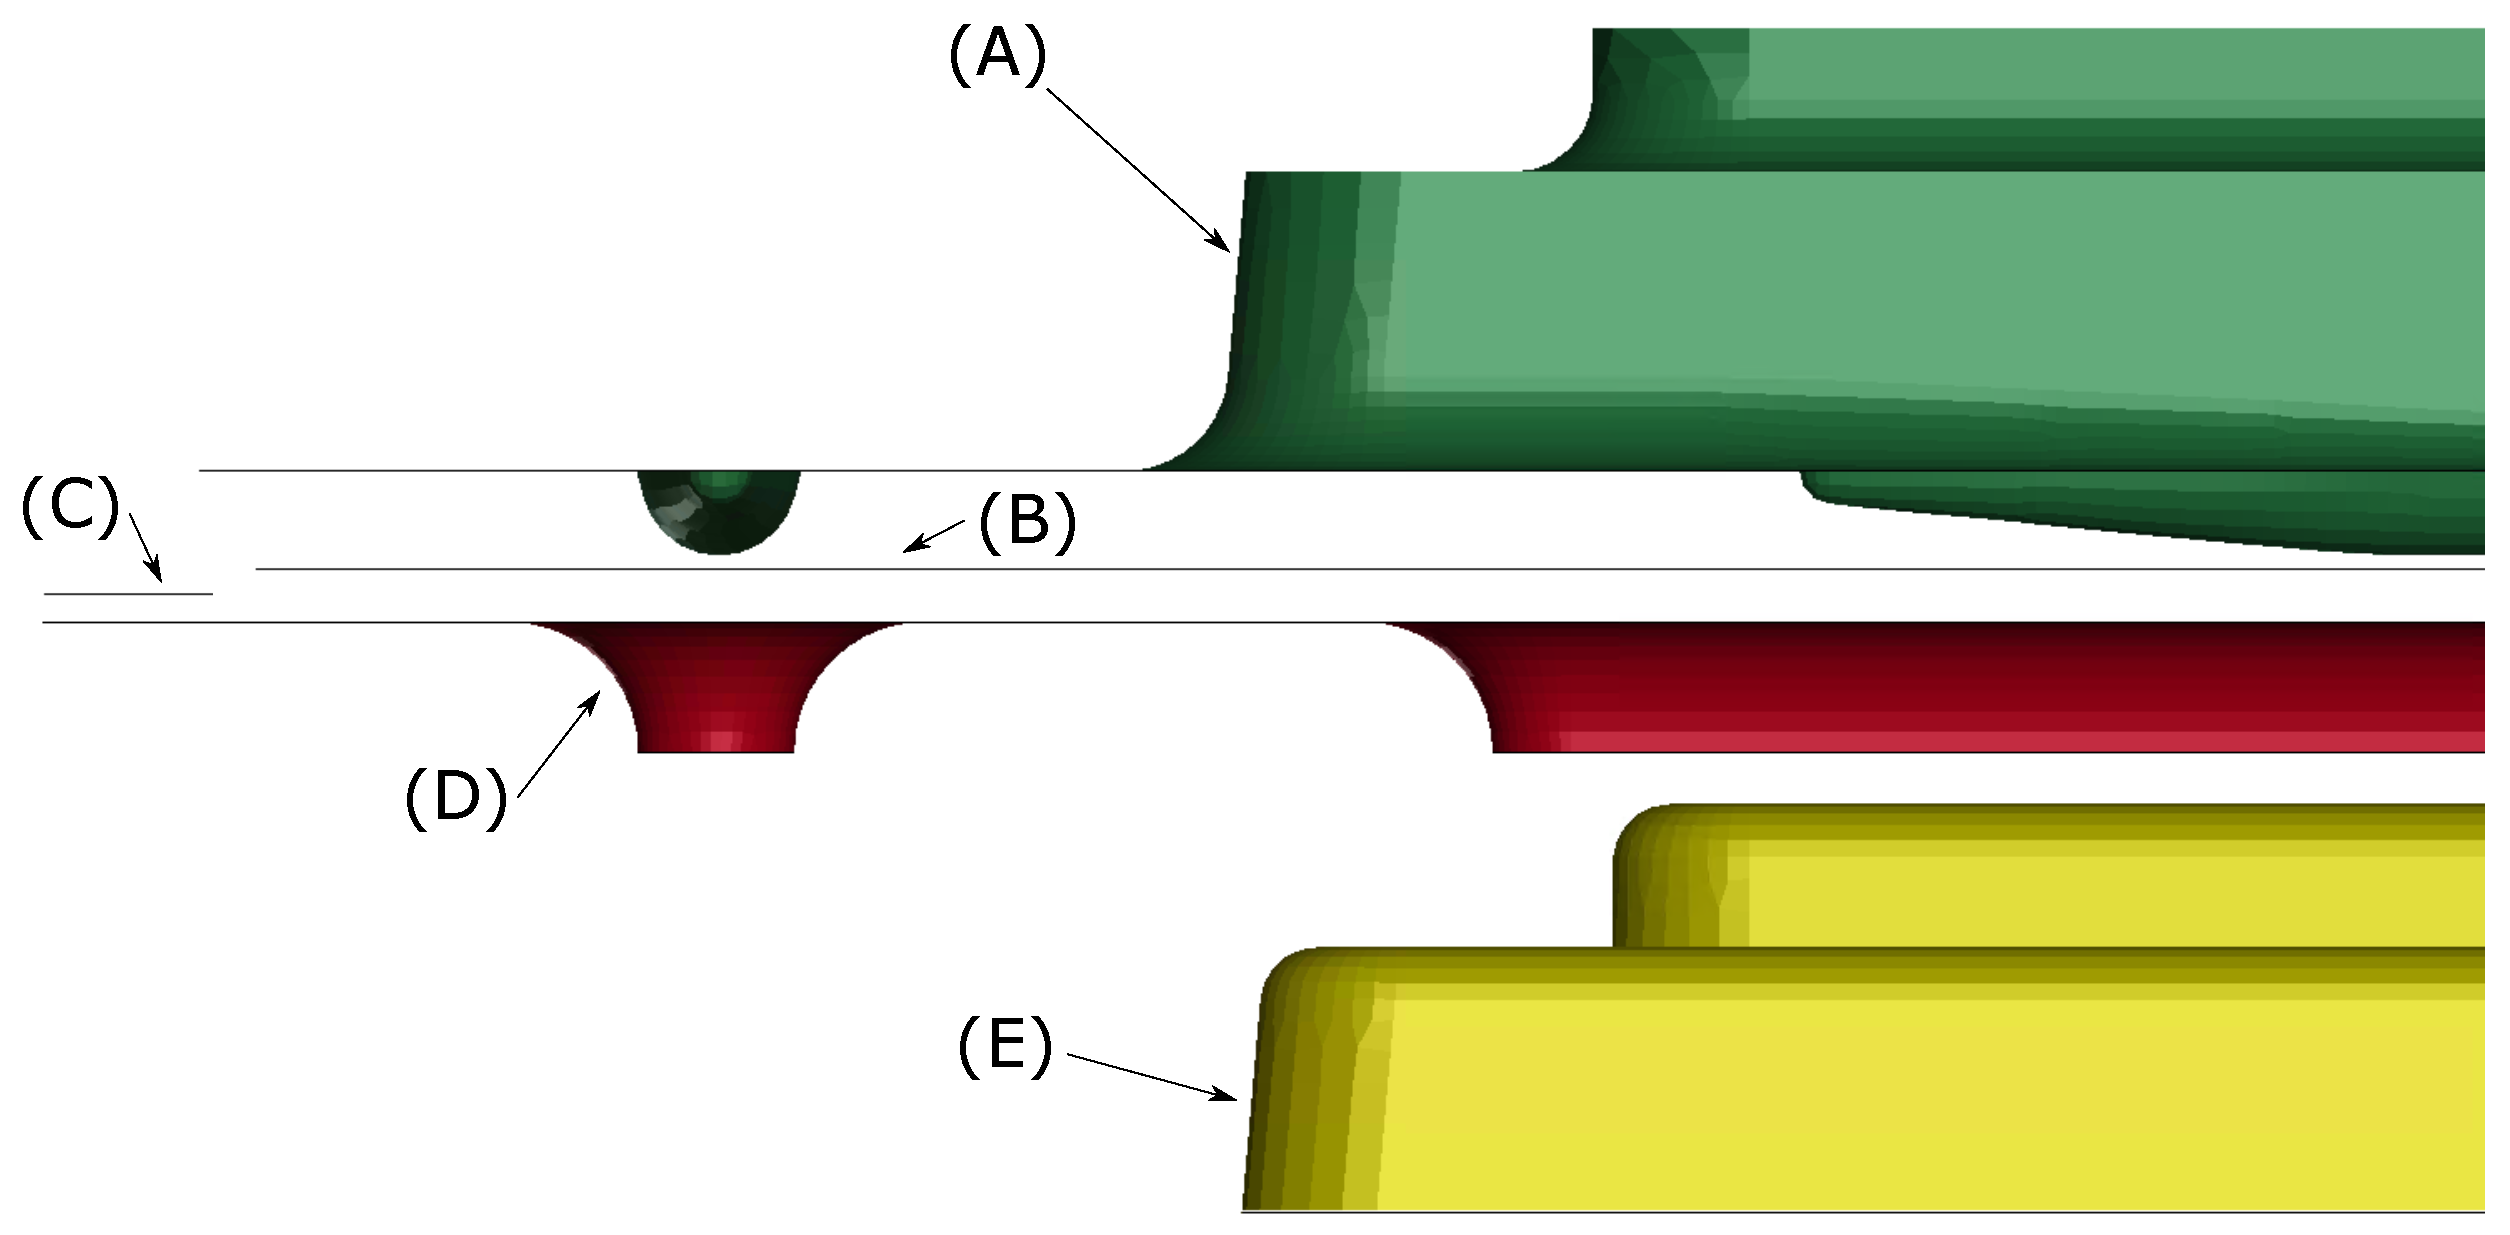
The numerical model presented in
Figure 9 consists of three rigid parts, the die (A), blank-holder (D), and punch (E) and one deformable body, the blank (B). The blank-holder stop (C) is a numerical tool used to model and sensor the variable blank-holder force.
As described in
Section 2.3.1, the simulation workflow adheres to the same manufacturing process employed for part production, as illustrated in
Figure 10.
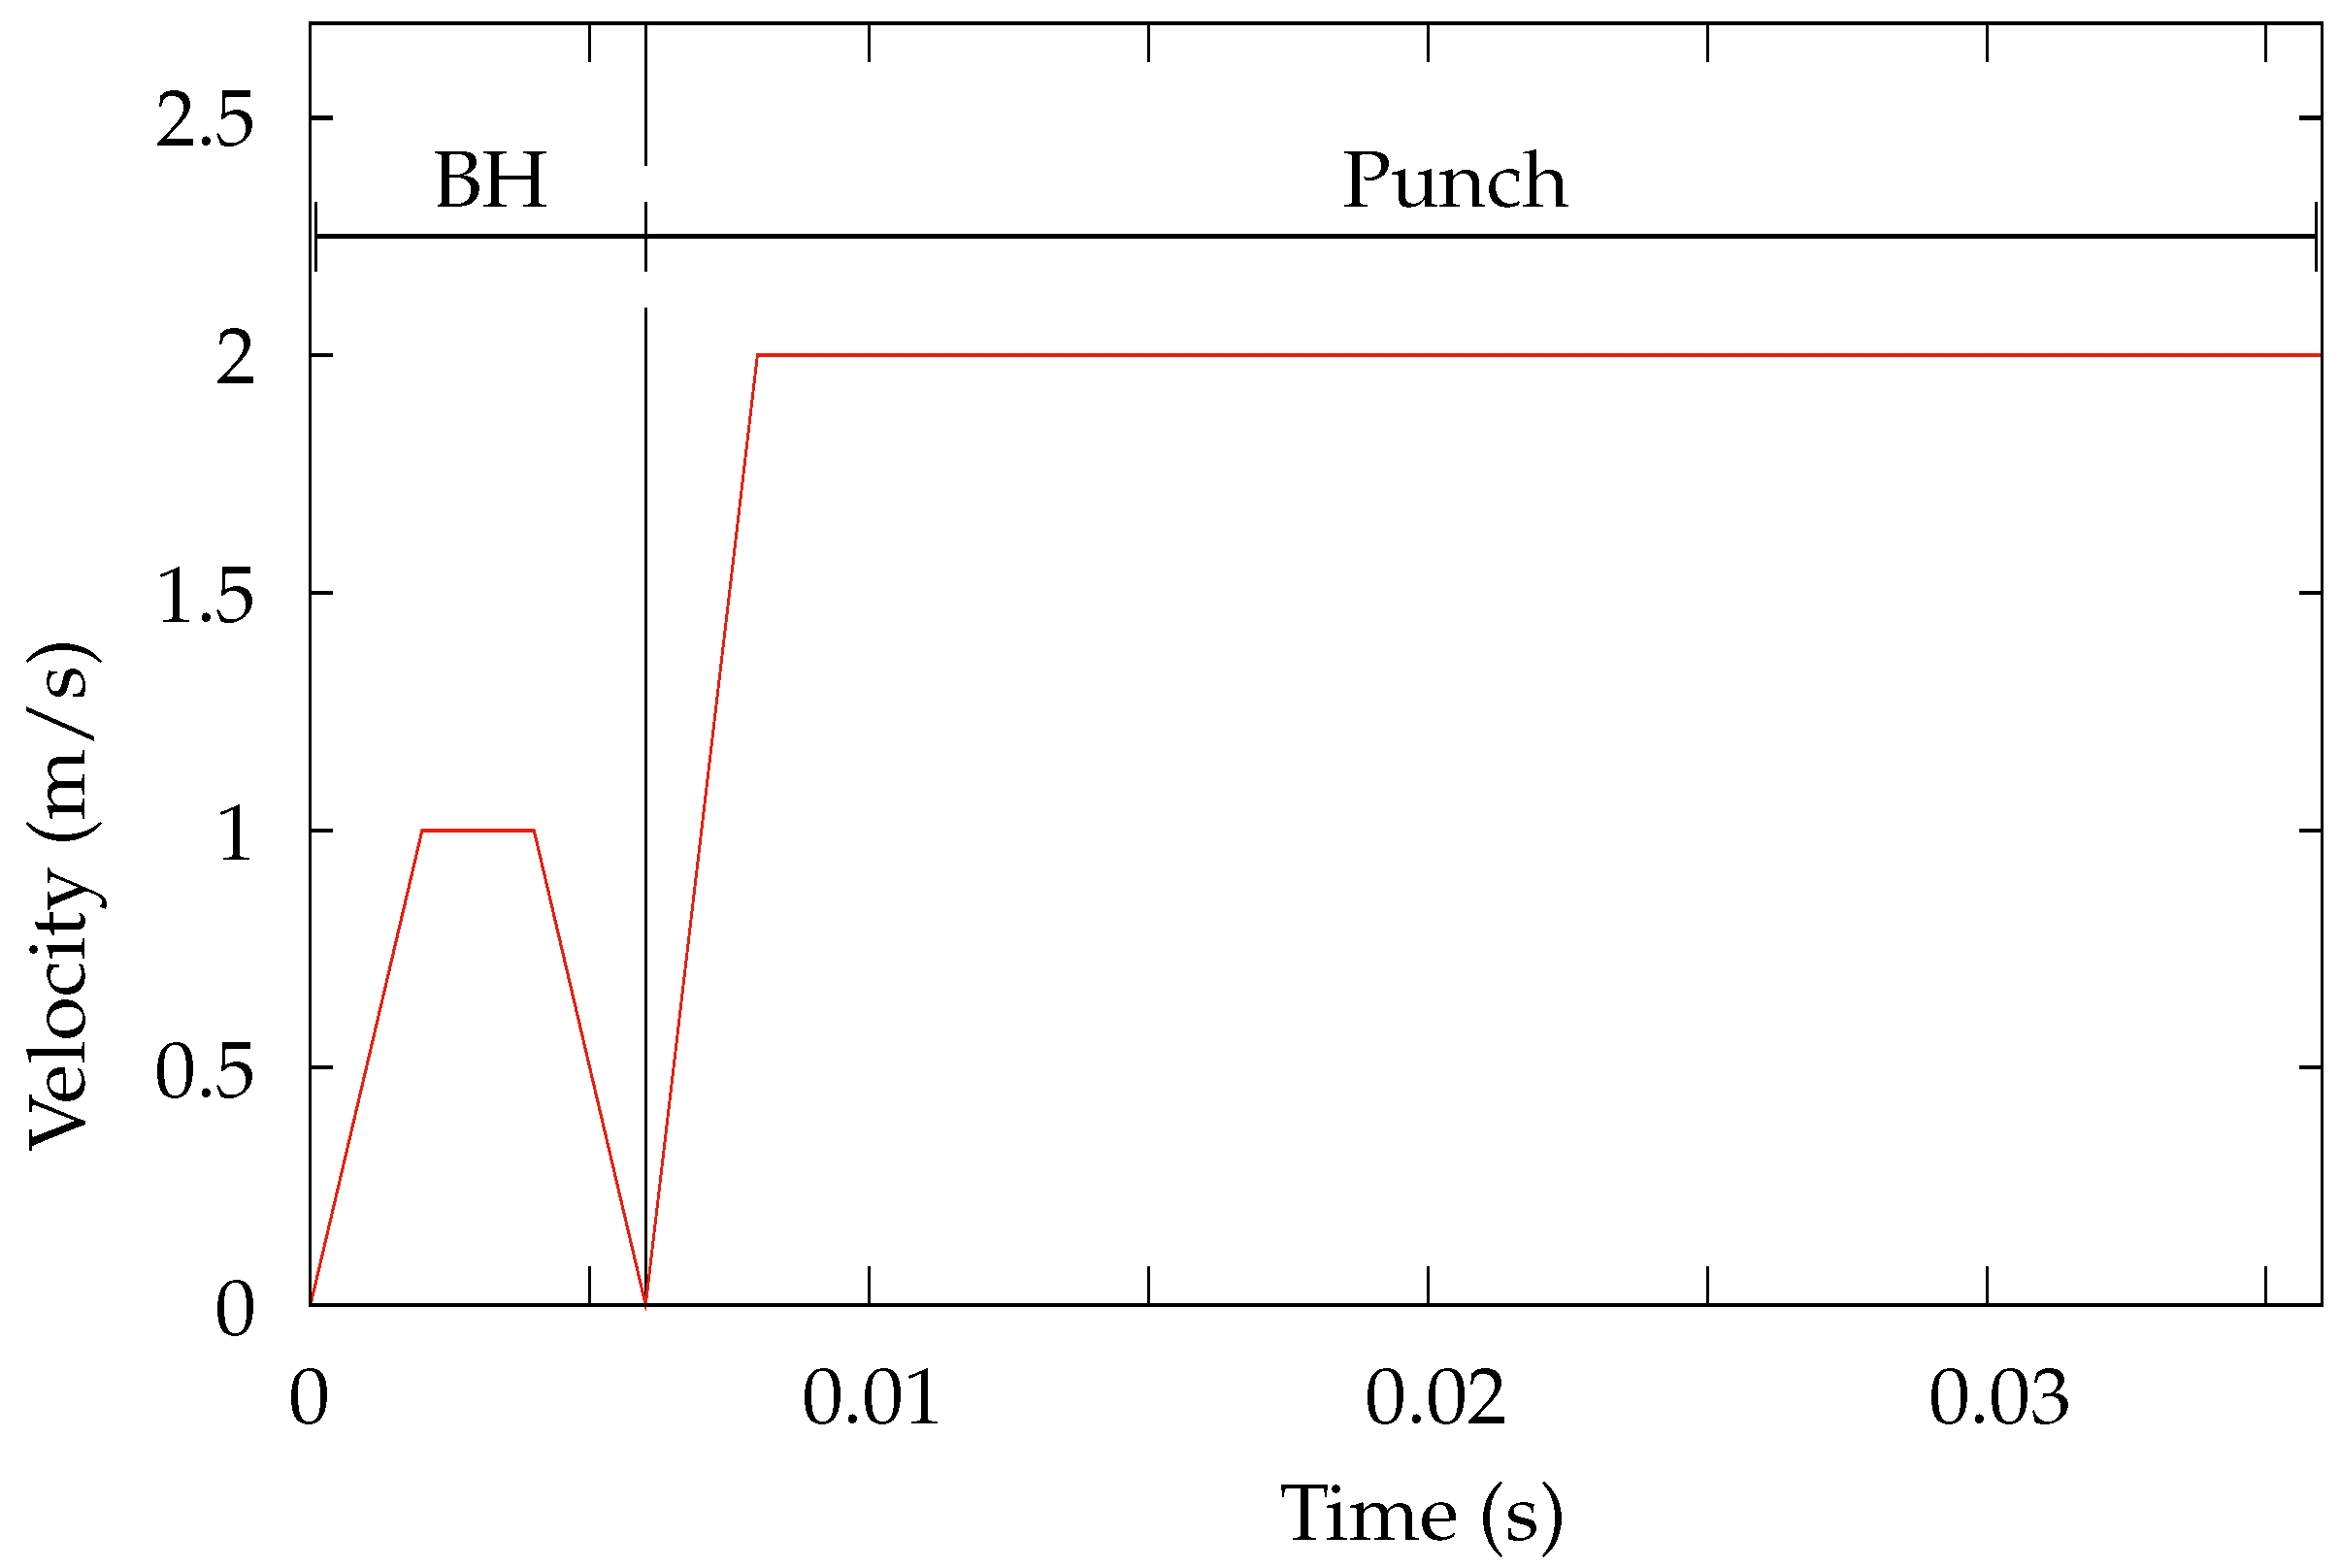
The tool velocity, time step size, and termination time are selected in a coordinated manner. Given the total tool travel, a punch velocity profile is designed for the closing and drawing stage, as shown in
Figure 11. Initially, a trapezoidal-shaped velocity is applied to reach the blank holder. Then, after a small acceleration, the punch operates with constant velocity until the end of the drawing process.
The blank is modeled with fully integrated shell elements with nine integration points through the thickness. Due to the anisotropy of the metal sheet, some orientations have to be defined. In order to present the material properties in the different directions, a material coordinate system has to be set. The material coordinate system in each element is rotated, aligning all local material directions to the global material direction in accordance with the blank-rolling direction. For the contact within the tools and the blank, a penalty-based contact interface is employed.
A friction coefficient of
was employed [
47], reflecting the use of lubricant in conjunction with a plastic film applied to the grated side of the sheet. Under these conditions, it is observed that when
is assumed, the simulation yielded a stamping force that is in very close agreement with the forces measured during both the 50 t and 200 t processes. This match between the simulation and the experimental stamping force data confirms that using a constant friction coefficient is a practical and accurate simplification.
A sensitivity analysis was conducted by varying the friction coefficient by
from the base value of 0.1. The deformation at two investigated corners showed only minor changes, remaining within acceptable tolerance limits. This low sensitivity supports the use of a constant friction coefficient in our simulations, as the key deformation characteristics and stamping force predictions remain consistent across the examined range. These results confirm that under our specific lubricated conditions, the friction coefficient does not critically alter the overall deformation behavior of the stamped part. The results of this sensitivity analysis are shown in
Table 4.
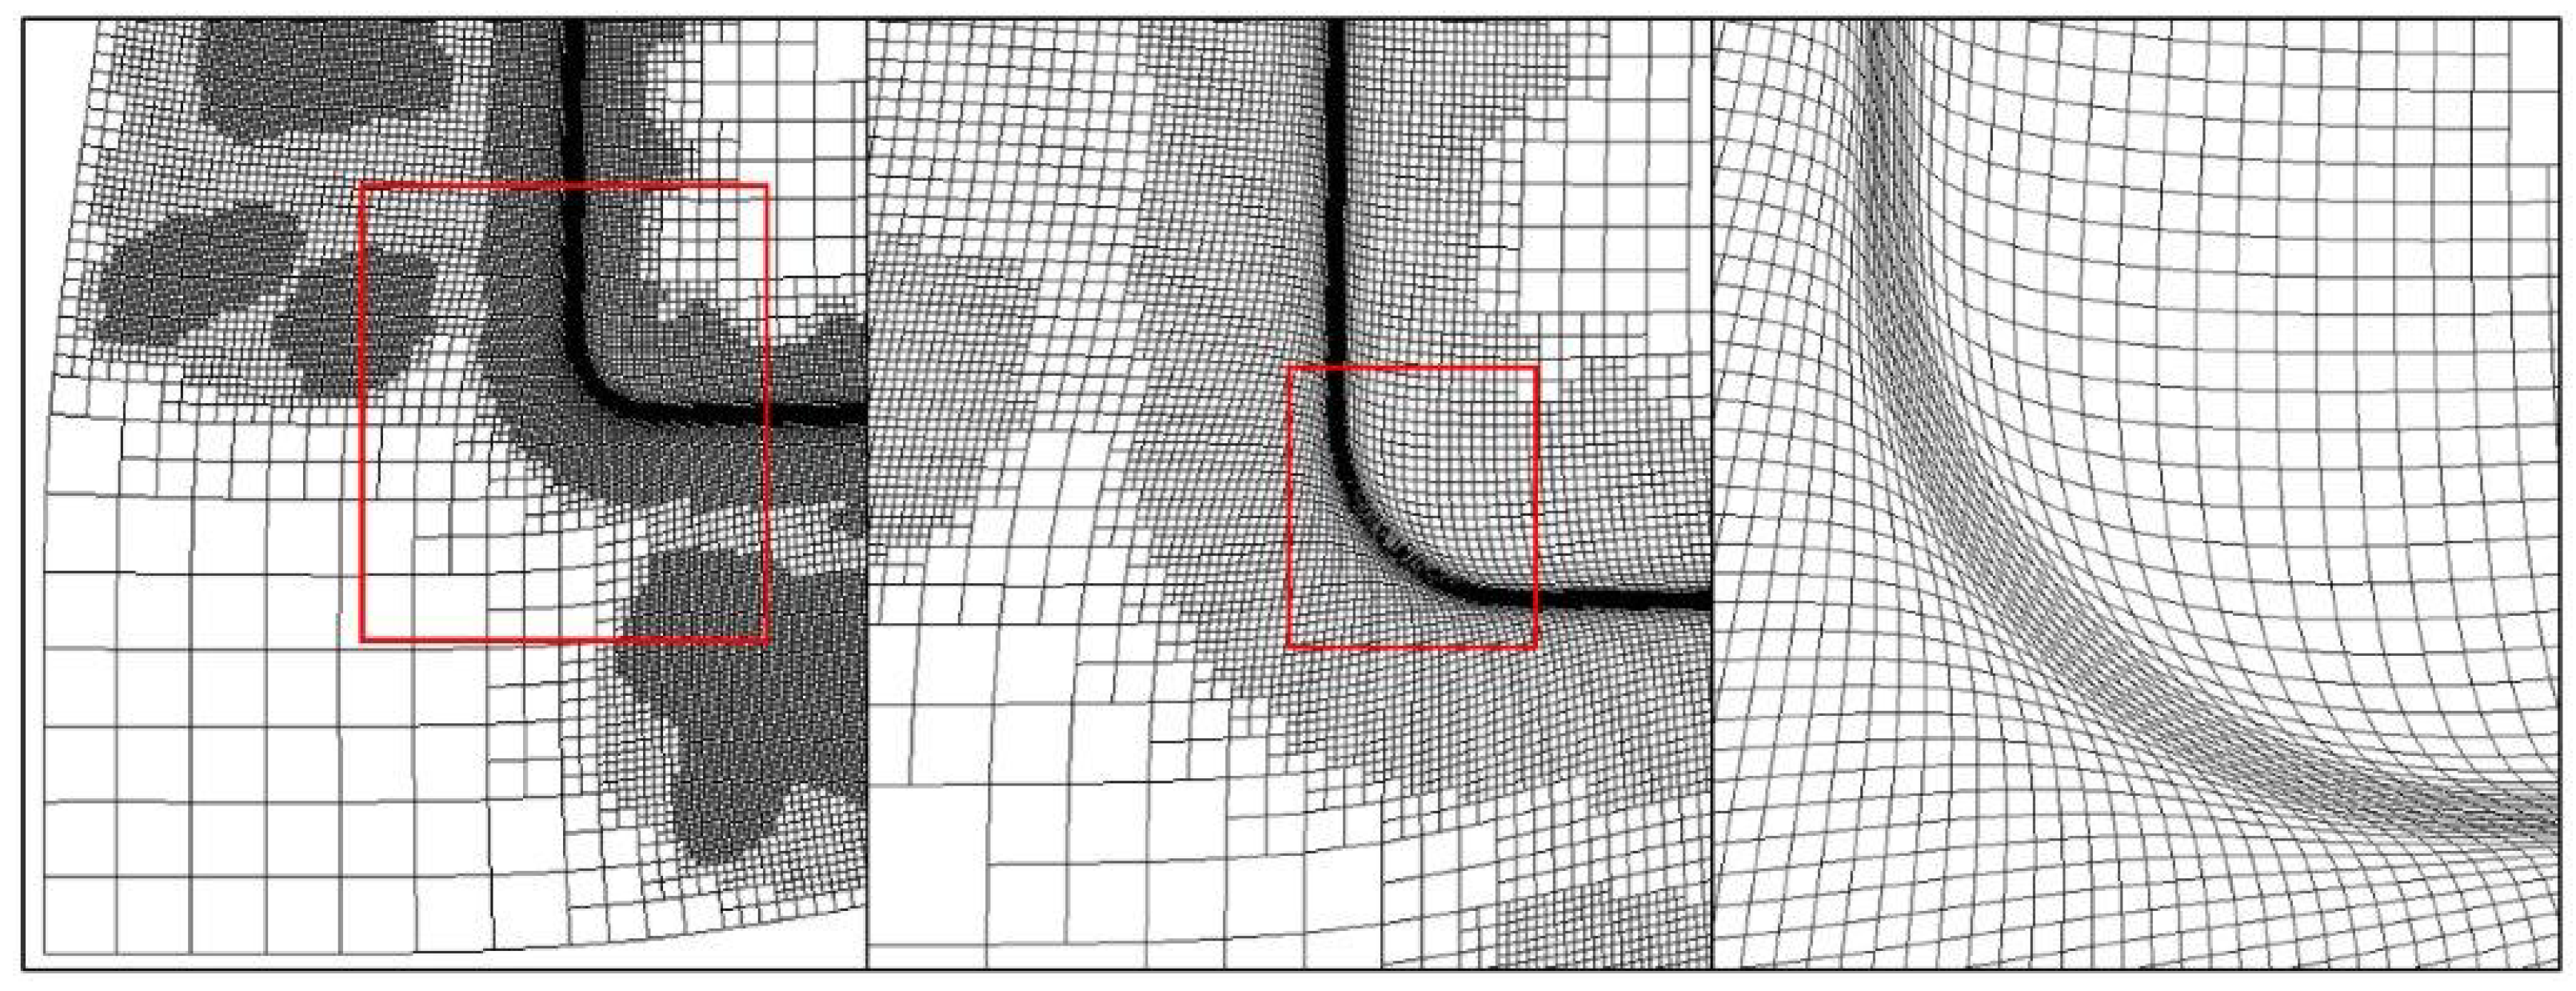
Adaptive mesh is used to automatically subdivide elements and create refined mesh in areas of high curvature. The blank is built with a regular mesh of rectangular elements with aspect ratios as near to one as possible. The initial blank element size was set to 5 mm to accurately resolve part details. At least 3–4 elements are needed around the critical radius; hence, two different adaptive setups were chosen: one for the closing stage with a limited adaptive depth of 5 steps and another for the drawing stage with a maximum of 10 steps. On top of these limits, a minimum shell size was imposed to 0.5 mm.
Figure 12 shows a top view of different mesh refinement levels at full punch displacement. The high density of elements generated around the lock bead and corners due to the high curvature of that geometry is clear.
The forming simulation is interrupted at the adaptive mesh frequency chosen, and the mesh is evaluated for adaptive refinement. Each element is subdivided into one level during each adaptive cycle. The adaptive frequency is chosen to be small enough to prevent large elements from drawing over the radius before being refined. We chose to adapt the mesh every 2 mm of punch motion. Two criteria were used to control element refinement: the angle between two neighboring elements, and the curvature of the approaching tooling. The adaptive tolerance control is set to 4.0 degrees. Smaller values will produce more refined mesh, but we observed that the refinement with this value for this geometry is enough. The refinement method chosen is the one-pass method with look-forward, where a parameter indicates the minimum allowable separation distance before the tooling curvature is evaluated. This distance is also subjected to the proximity limits used in contact detection, so values larger than several sheet thicknesses will have no additional effect. Following the outlined mesh refinement procedure, a mesh convergence study was subsequently performed. Various adaptive parameter values were systematically evaluated until convergence was achieved, as evidenced by the absence of significant differences in the strain distributions across the critical areas.
The measuring jig is modeled with five rigid surfaces. There are frictionless contacts within the part and those five surfaces. The fastening of the part with the jig is obtained with a rigid bolt connection model. There were two bolts each in zones (ii) and (iii) and four bolts in zone (i). The springback virtual measurement is conducted using LsDyna/Implicit R11.0.0.
The need to account for gravitational force in the model arises from the part’s dimensions, the thickness of the steel sheet, and the configuration of the jig support used for measuring springback. These factors collectively result in a relatively low stiffness of the component, making gravity a significant contributor to its final deformation. Ignoring gravity under these conditions would likely lead to an underestimation of the deformation, compromising the model’s predictive accuracy.
3. Results
The BHF rated for the manufacturing process is 200 t, so in this study, this value is going to be taken as the maximum value of a bracketing series. The delicate balance between increasing the BHF to reduce springback and lowering it to prevent necking and undesirable surface defects is critical in the sheet metal-forming process. Increasing the BHF helps to minimize springback, which is essential for ensuring the dimensional accuracy of the stamped parts. However, excessively high BHF values can induce significant necking, leading to material failure and surface imperfections. These imperfections are particularly detrimental for parts that not only serve a structural purpose but also require an impeccable surface finish for aesthetic reasons. Thus, selected values for the BHF are 200 t, 150 t, 100 t and 50 t.
The parts used for the experimental tests were in a production state. Ten parts were manufactured for each specified BHF value in the experiments and then aid in the jig and measured as described in
Section 2.3.1. The maximum BHF value was the highest one that did not result in rejected parts due to either breakage or surface defects caused by significant necking. This characteristic is particularly important because, besides serving a structural function in the appliance, this part also has an aesthetic role and must exhibit a flawless surface finish.
Conversely, reducing the BHF can mitigate the risks of necking and surface defects but at the cost of increased springback. This increased springback can result in parts that do not meet the required dimensional tolerances, leading to assembly difficulties and potential malfunctions. Therefore, finding the optimal BHF value is a complex task that involves balancing these competing factors to achieve a part that is both dimensionally accurate and free of defects.
As in the real process, in the numerical model, the blank-holder tool (D) shown in
Figure 9 is preloaded with 200 t, 150 t, 100 t and 50 t. So, different simulations are performed for each BHF value, resulting in four manufactured part models. Then, the horizontal trimming followed by vertical trimming is simulated. Finally, a springback simulation is performed for each trimmed model result, as described in
Section 2.3.1.
3.1. Simulated Tool Loads
One way to check the performance of the numerical model of a forming process is to inspect the relative positions of every step of the simulation. In this case, the variable to monitor is the force developed by the blank-holder, so the tool force vs. die displacement is plotted for every forming simulation.
Figure 13a–d shows the tool loads vs. die displacement. At the beginning of the process, the die, punch and blank-holder are completely unloaded. Only the blank-holder stop is maintaining the blank-holder preload.
The closing stage begins, and the die starts stamping the drawbeds in the blank. The blank holder is reacting to that, but it is going to maintain the position until that force does not overcome the BHF threshold.
It is revealed how its reaction force increases (the same exerted by the die) up to the limit set, and then it is maintained constant during all the tests.
These trends are critical because they not only illustrate the expected behavior of the system but also serve as a verification of the numerical model.
Figure 13a–d confirm the model’s accuracy in predicting how the blank holder responds to die displacement, showing the process dynamics and the validation of the simulation.
Figure 14 shows that the die load (in black in
Figure 13a–d) increases during the draw process with the increase in the BHF.
3.2. Sources of Springback: Simulated Bending Moments
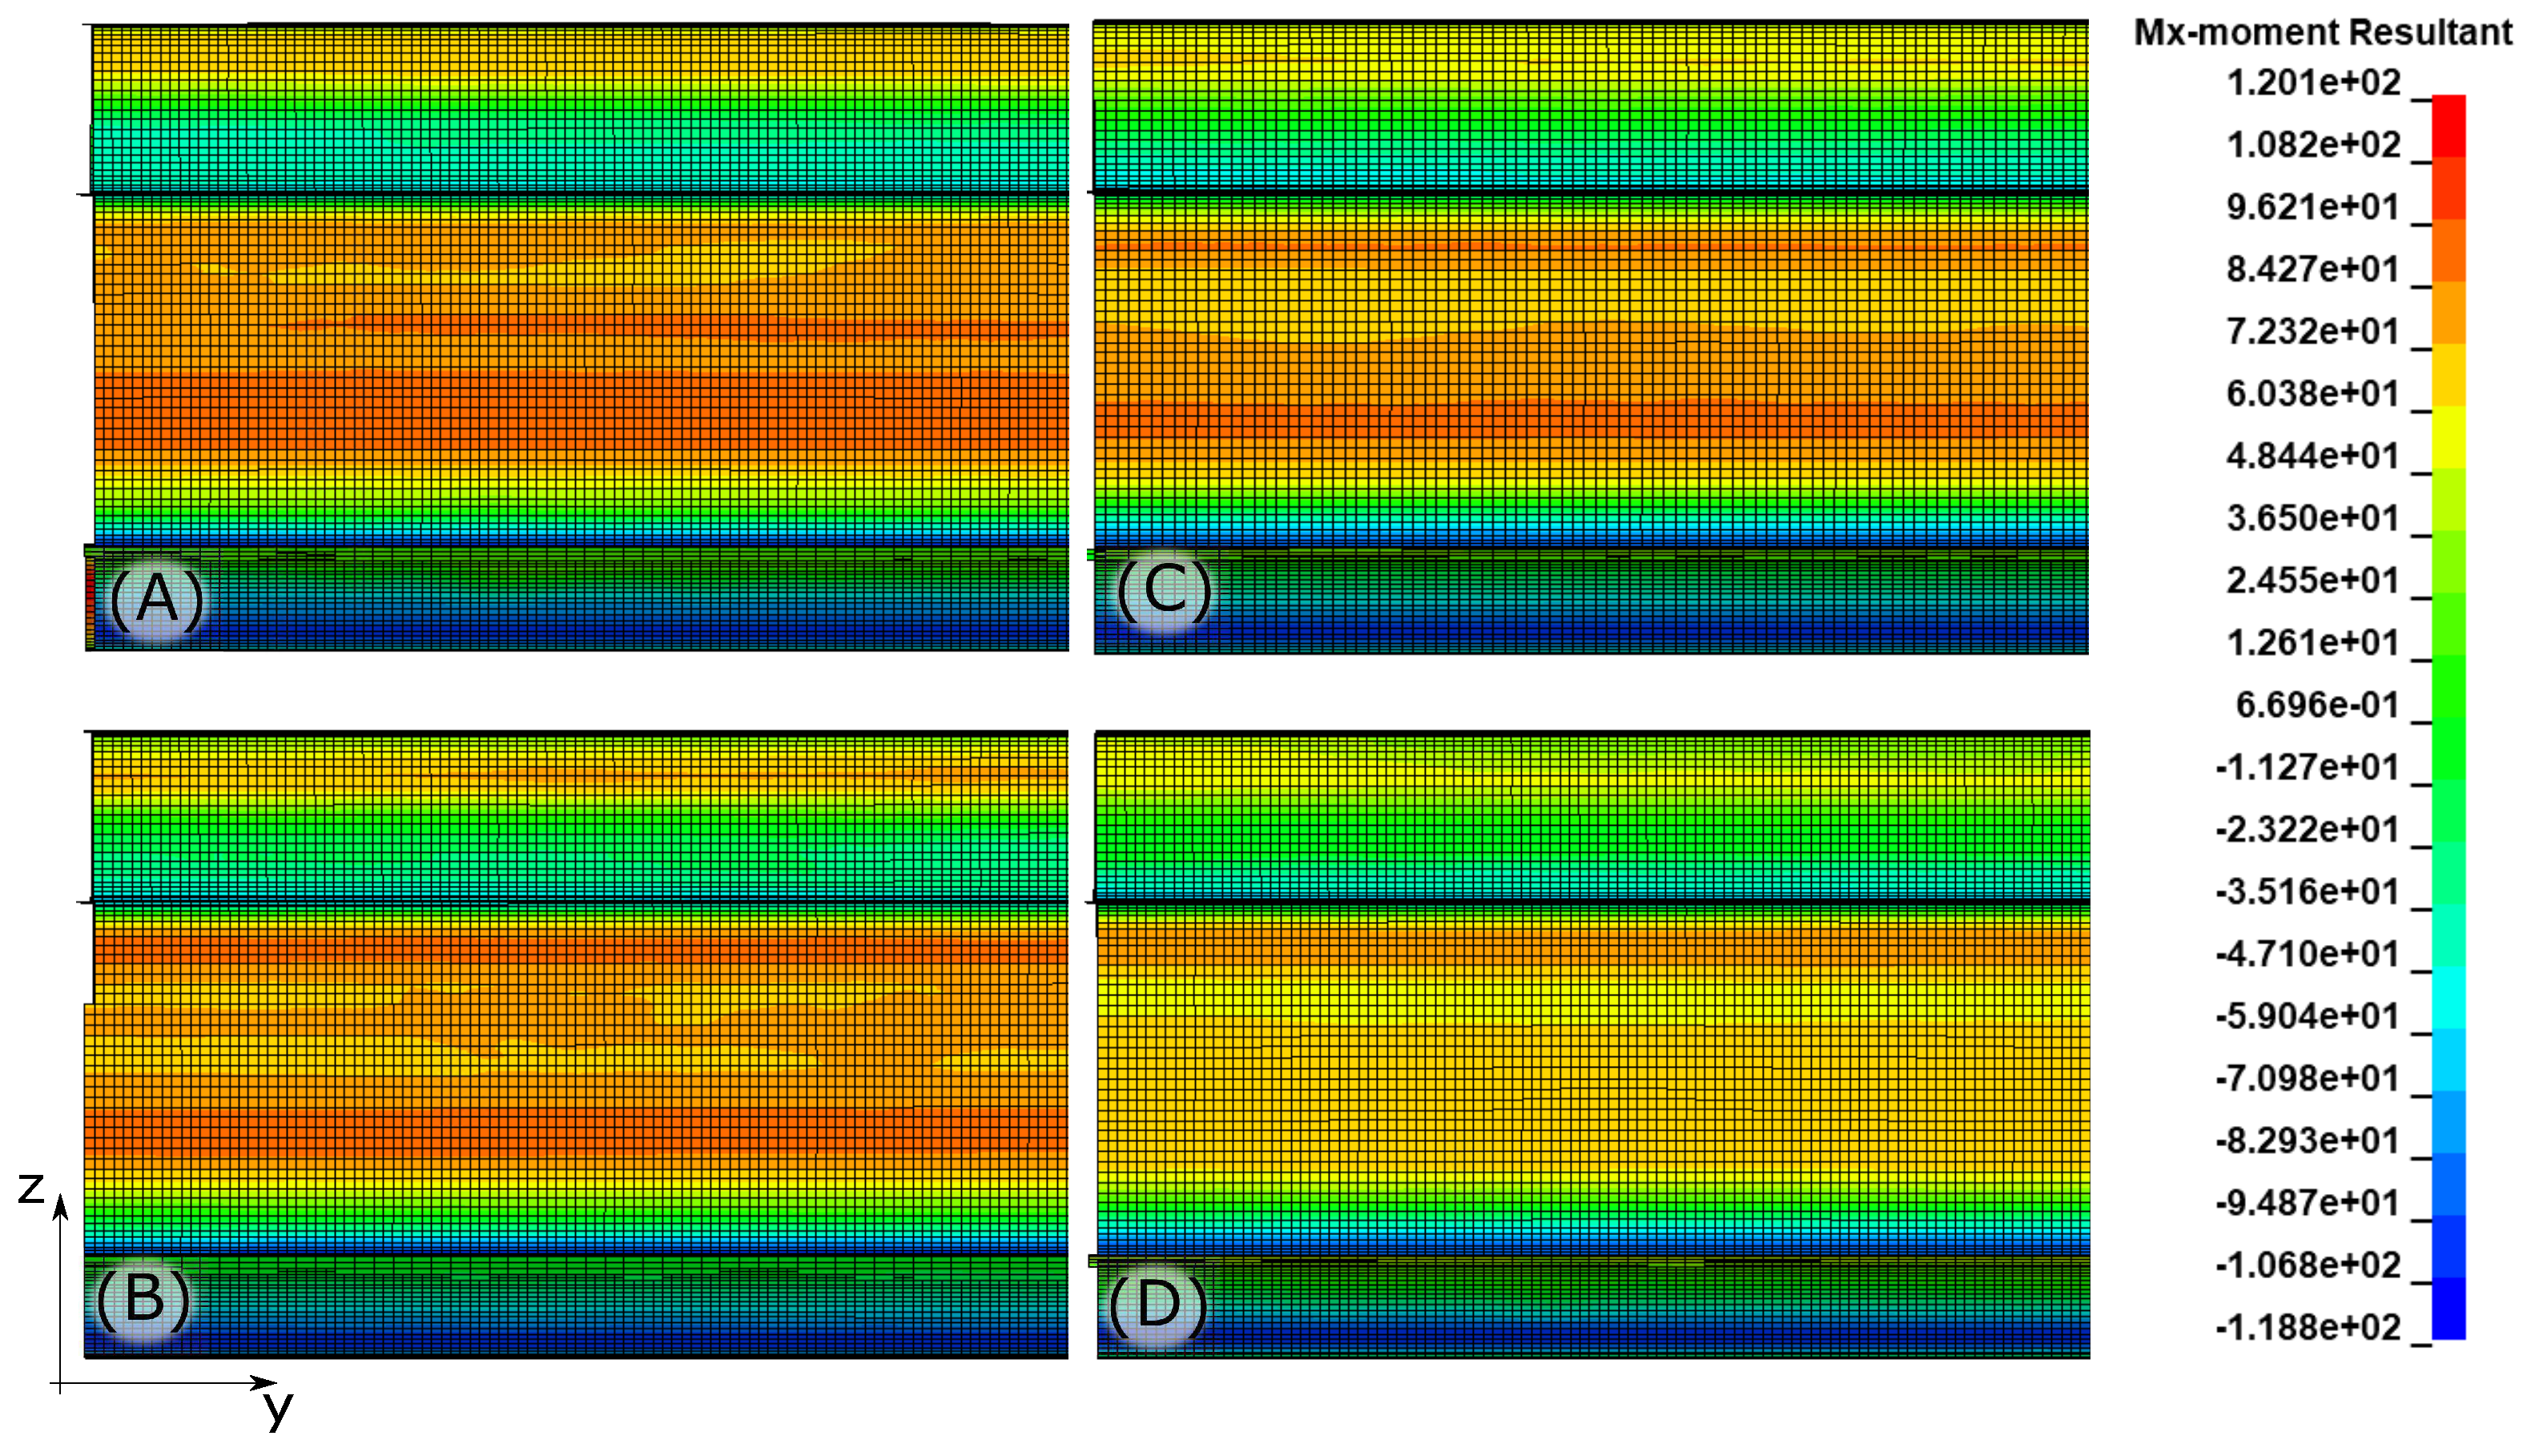
There are two factors interacting and defining the amount of springback when incrementing the BHF: the decrease in the bending moments caused by the additional tensile load, which contributes to diminishing the springback, and the uneven tensile stress rise along the periphery of the part, which contributes to increasing the springback.
Bending moments in a sidewall of a forming blank constitute the most important part of the contribution to the displacement generated by the springback. Thus, it is crucial to include these results in the springback analysis.
Figure 15 shows the bending moments for all the different BHFs after forming and before releasing the tools. Those bending moments correspond to the sidewall zone referenced as (B) in
Figure 8 and (F) in
Figure 7.
The decrease in the bending moments with an increment of the BHF is due to the rise of an additional tensile load in the longitudinal direction with respect to the application section, which reduces the bending moment in that section and therefore causes a reduction in the springback.
To illustrate the mechanism of this decrease, the bending moment distributions before unloading for the different analysis are presented in
Figure 15.
At the same time, the increase in the tensile stress causes an increase in the flow stress of the material by strain hardening, generating more load in the die and in the part. This uneven tensile stress rise could potentially pilot an increase in the springback.
The final influence of the BHF will be the result of the interaction of these two factors: as the effect of the second factor is generally minor compared to the bending moment reduction effect, there will ussually be a reduction of the springback with an increase in the BHF.
3.3. Springback Results
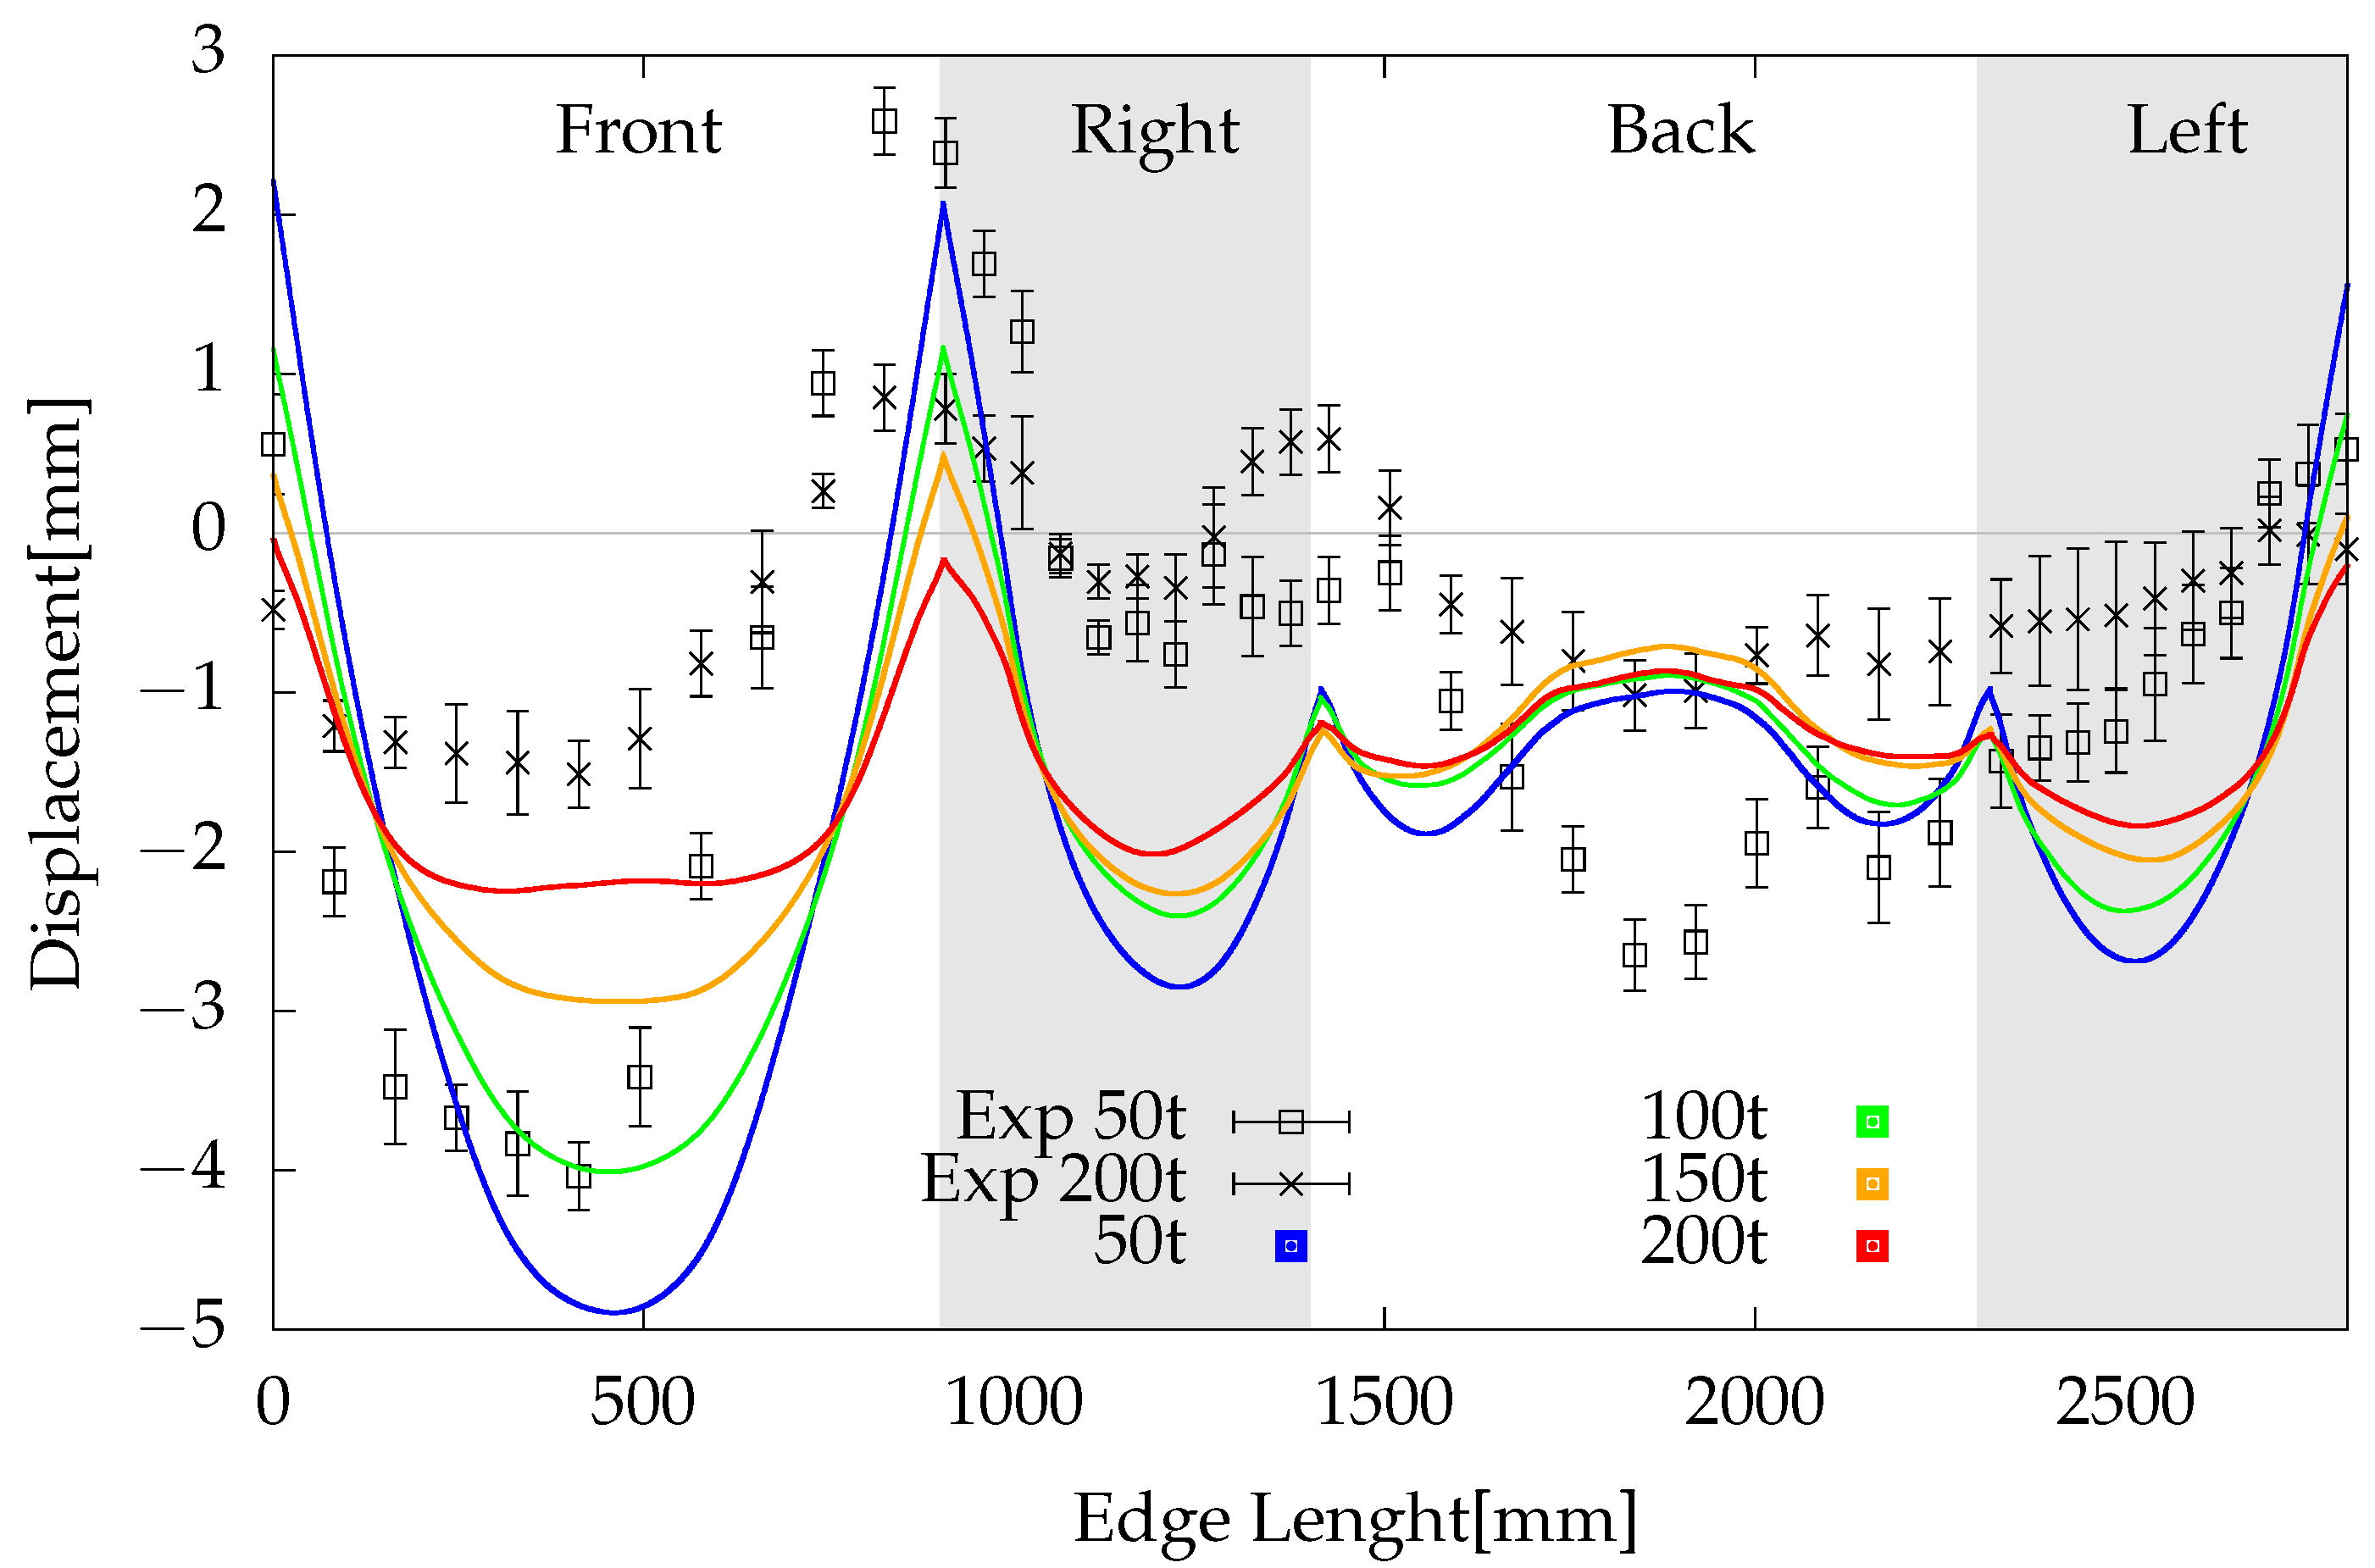
Figure 16 shows the simulationvs. experimental results of the springback studied in this work. As described in
Section 2.3.1, relative springback displacement from a reference plane show in
Figure 8 is plotted vs. the position of the measured point in the perimeter of the part. The abscissa shows the perimeter of the edge. The origin is the left bottom corner of the top view (A) shown in
Figure 7. The plot is divided in four zones delimited by the background color corresponding with the front, right, back and left edges of the part.
Experimental data contain the average displacement value of every measured point and the standard deviation for that point in the bunch of parts for the same experiment. Two experimental datasets are plotted, 50 t BHF and 200 t BHF, for the sake of clarity. The 100 t and 150 t results follows the behavior of 50 t and 200 t but with interpolated results.
The amount of springback was reduced as the BHF is increased, as shown in the experimental results described in
Figure 16. For 50 t BHF, at the front edge, springback develops a displacement of 4 mm, while for 200 t, the displacement is reduced to 1.4 mm. Simulation shows 4.9 mm displacement for 50 t BHF and 2.1 mm for 200 t.
4. Discussion
This study set out to evaluate and to predict the springback behavior in sheet metal forming with a focus on industrially relevant geometries. The primary objective was to bridge the gap between theoretical modeling and real-world application by simulating a complex, commercially manufactured gas cooktop part made of austenitic steel 1.4301 and explore the limitations regarding validation with experimental measurements. The study has successfully demonstrated that despite inherent modeling limitations, the general springback behavior can be captured using the Barlat YLD2000 anisotropic criterion, thus enabling early design iterations in industrial environments.
Unlike much of the existing literature, which typically employs simple geometries with limited industrial value, this work provides a practical case study using a real component. This advances the understanding of springback by illustrating how established modeling approaches perform when applied to geometrically complex parts and real manufacturing conditions. The study confirms that the blank-holder force (BHF) has a measurable impact on springback primarily through its influence on bending moments in the sidewall regions. As demonstrated, increasing BHF reduces the bending moments, which correlates with decreased springback magnitudes. These findings are consistent with theoretical expectations and have been validated through experimental comparison.
However, the results also highlight several modeling limitations. Discrepancies between the simulation and experiment—especially in the 50 t and 200 t cases—are primarily attributed to the inability of the current model to represent work-hardening stagnation in high-strength steels. Incorporating more advanced material models, such as the Yoshida–Uemori model, could improve accuracy by better capturing the Bauschinger effect and transient hardening behavior. Additional uncertainties stem from assumptions regarding boundary conditions, material variability, and simplifications in friction modeling.
Finally, in comparison with prior studies cited in the introduction, our findings support earlier observations regarding BHF effects but uniquely contribute by applying them in a realistic industrial context, studying its limitations. This reinforces the value of this study as a practical reference for simulation-based design in production environments.
5. Conclusions
This paper presents an industrially relevant investigation into the springback behavior of a complex sheet metal component, combining numerical simulations with experimental validation. The use of a real manufacturing part—rather than an idealized geometry—marks a significant step forward in practical springback prediction, revealing the strengths and limitations of widely used constitutive models such as Barlat YLD2000. Key findings include the following:
The overall springback behavior of the part is well captured, validating the use of current simulation tools in early design stages.
Springback magnitude decreases with increasing BHF, which is primarily due to the reduction in bending moments in the sidewall zones.
Discrepancies between experimental and numerical results suggest that standard anisotropic models may fall short in accounting for work-hardening stagnation, particularly in advanced high-strength steels.
These results carry important implications for industry: more accurate early-stage predictions can reduce costly tool modifications and shorten development cycles. The proposed methodology thus supports faster time-to-market and more efficient product development.
For future research, efforts will focus on the following:
Studying large strain ranges to refine material parameter identification.
Instrumenting and monitoring the experimental force vs. time in the press.
Exploring additional forming parameters and extending simulations to a wider range of real-world parts.
Integrating more advanced constitutive models such as the Yoshida–Uemori model to capture complex material behavior. The next step is to integrate models such as the Yoshida–Uemori model, as previous studies have shown that this approach provides more accurate springback predictions compared to using a purely anisotropic yield model like YLD2000. This integration is expected to better capture the transient work-hardening behavior and its stagnation, thereby reducing the discrepancies between numerical predictions and experimental results.
Developing robust, meaningful metrics to evaluate springback prediction quality based on qualitative criteria relevant to product assessment. Standard statistical metrics, such as R2, were considered but ultimately deemed inadequate at the product/industrial quality level. From the product development perspective, it was determined that quantitative metrics fail to capture the nuances involved—evaluating a corner versus a frontal view presents very different challenges, and factors such as visual attributes and subjective quality judgments necessitate a more nuanced, qualitative approach. Future work will focus on studying these qualitative aspects with the goal of developing a meaningful quantitative indicator of modeling quality in accordance with these criteria.
In summary, this study contributes a validated, practical approach to springback prediction in industrial components, offering both theoretical and applied value to the forming community.


