Article

An Adaptive Task Traffic Shaping Method for Highly Concurrent Geographic Information System Services with Limited Resources

Chinese Academy of Surveying and Mapping, Beijing 100036, China
*
Author to whom correspondence should be addressed.
Appl. Sci. 2025, 15(9), 4932; https://doi.org/10.3390/app15094932
Submission received: 24 March 2025 / Revised: 25 April 2025 / Accepted: 28 April 2025 / Published: 29 April 2025

Abstract

:
Under the condition of limited resources, when the GIS service platform is faced with high concurrent service requests, the high concurrent processing capacity of a single server is the main bottleneck affecting the quality of service (QoS) of the GIS service platform. Traditional traffic shaping methods, such as token bucket algorithms, alleviate the pressure in high-concurrency situations to a certain extent, but due to their fixed-rate settings, it is difficult to cope with complex and variable task requests, leading to unstable system performance. This paper proposes an adaptive task traffic shaping method to improve the utilization efficiency of server resources, reduce task processing delay, and improve service stability and response speed by monitoring the system load in real time and dynamically adjusting the processing rate of GIS task traffic. The relationship between the task arrival rate and server load is established based on the queueing theory model, and the token fill rate of the token bucket is adjusted adaptively according to resource load evaluation, so as to optimize the task processing flow. The experimental results show that under different GIS task scenarios, the processing performance of this paper’s method is better than or close to that of the traditional method under the optimal fill rate condition, which can significantly reduce the task latency and improve the concurrent processing capability of the GIS service platform.

1. Introduction

In recent years, GIS platforms based on cloud architecture have been deeply developed and play an important role in supporting off-site users to achieve efficient and reliable spatio-temporal data querying, browsing, analysis, and other tasks [1,2,3]. However, under conditions of limited-service resources, in the process of providing services to users, when there are a large number of task access requests on ports or interfaces in a short period of time, the performance bottleneck of GIS platforms in high-concurrency scenarios will occur. For this reason, how to improve the quality of service [4] and enhance the stability and smoothness of services in such environments has been widely discussed by scholars [5,6]. The study of high-concurrency problems is commonly found in the field of communication network traffic transmission [7]; for this reason, scholars mostly introduce the method of high-concurrency processing of network traffic when solving similar problems existing in cloud platforms in the field of GIS [8]. In general, the related research can be divided into two main categories, one is the multi-server high-concurrency processing method [9] and the other is the single-server high-concurrency processing method [10]. In the former case, due to the large number of available service resources, the key to solving the problem lies in increasing the number of hardware, that is, multiple hardware resources are used to disperse users’ requests, such as the common load balancing algorithm [11]. In the latter case, due to the limited available service resources, the key to solving the problem is to improve the task traffic-shaping algorithms [12], that is, limiting the utilization rate of the entire resource by the task to alleviate the network congestion in the case of network congestion. For example, traffic policing [13] and traffic shaping [14]. The study of this paper belongs to the latter category.
Compared to multi-server high-concurrency processing methods [15,16], there is limited research on single-server high-concurrency processing techniques. For single servers, existing studies still mainly primarily rely on classical traffic-shaping algorithms. Turner [17] introduced a leaky bucket algorithm, which regulates unregulated task requests by limiting their output rate. The leaky bucket algorithm is one of the simplest and most effective methods in the task traffic-shaping technique. However, it is not well-suited for handling bursty traffic, as tasks that do not exceed the rate limit are still processed at a fixed rate, reducing the responsiveness of task responses. To address this issue, Shenker [18] proposed the token bucket algorithm, which operates on the principle that tokens are added to a bucket at a constant rate. If a request needs processing, it must first obtain a token from the bucket. By controlling the tokens, the task processing rate can also be controlled. The token bucket algorithm offers a robust solution for handling sudden or instantaneous tasks, making it a frequently used and highly effective method in task traffic-shaping research. In addition, Rabie et al. [19] proposed enhanced token bucket algorithms, i.e., single-rate three-color marking algorithm and double-rate three-color marking algorithm, and Lee [20] proposed a hierarchical token bucket algorithm based on QoS awareness, providing valuable insights for managing tasks with varying priorities or self-similar characteristics. However, many researchers still continue to use the classical token bucket algorithm for task traffic-shaping in the case of tasks with no priority or similarity [21].
Although high-concurrency processing algorithms originating from communication network traffic transmission offer effective solutions for task traffic shaping in GIS platforms [22], tasks in GIS platforms are more complex and diverse, with varying demands on system resources compared to short-term network traffic transmission issues [23]. For a single server, computing resources are limited. Ideally, to maximize request processing efficiency, the number of concurrently processed tasks should be reduced when computational resource utilization is high and increased when resource utilization is low, thereby achieving optimal processing speeds. In the classical token bucket algorithm, task shaping is achieved by filling the token bucket with tokens at a specific rate, making it challenging to determine the optimal token fill rate. Consequently, under high-concurrency conditions, the average task processing delay increases and the service rate decreases. To address these challenges, this paper proposes an adaptive task traffic-shaping algorithm designed for environments with limited resources.
This study is an improvement of the traditional token bucket method, mainly addressing the limitations of fixed-rate token bucket algorithms in single-server GIS platforms by proposing an adaptive task traffic-shaping framework that dynamically adjusts the token fill rate based on real-time system load. The following are the main contributions of this research: (1) A task request queueing model is put forward to formulate the relationship between the arrival rate of queue-expected tasks and the current system task processing rate. This model serves as a link between theoretical queueing dynamics and practical system behavior, thereby establishing a connection that enables the translation of theoretical concepts into real-world system operations. (2) A hybrid analytical framework, which integrates the M/M/1 queueing theory and Hidden Markov Modeling (HMM), is developed to predict the optimal token rates. The predicted token rates are utilized to dynamically regulate the arrival rate of queue-expected tasks. Subsequently, based on the adjusted arrival rate, the token fill rate is adaptively adjusted, ensuring the system’s adaptability to changing task loads. The proposed approach eliminates manual rate tuning, enhances resource efficiency, and ensures stability under heterogeneous workloads, offering a tailored solution for resource-constrained GIS systems.
The remainder of this paper is organized as follows: Section 2 introduces the principle of token bucket algorithm, which is an important foundation and theoretical basis for the proposed methodology, then reviews the relevant research on traffic-shaping methods and summarizes the shortcomings of the existing methods; Section 3 elaborates the methodology for the adaptive traffic-shaping algorithm based on resource loading; Section 4 reports the results and performance analysis; Section 5 discusses the advantages, application prospects, and limitations of the proposed method; and Section 6 presents the conclusions of the study.

2. Related Work

2.1. The Classical Token Bucket Algorithm

In the process of processing service requests on the single-server GIS platform, tasks are randomly submitted by clients, and there is usually no correlation or priority difference among these tasks. To address the bottleneck problem of task processing in single-server high-concurrency scenarios, existing research primarily relies on the classical token bucket algorithm [24], which regulates the processing rate of tasks by controlling the tokens, thereby reducing task processing latency and preventing sudden high-concurrency situations that could cause severe server blockage or downtime. Figure 1 illustrates the key steps of this method:
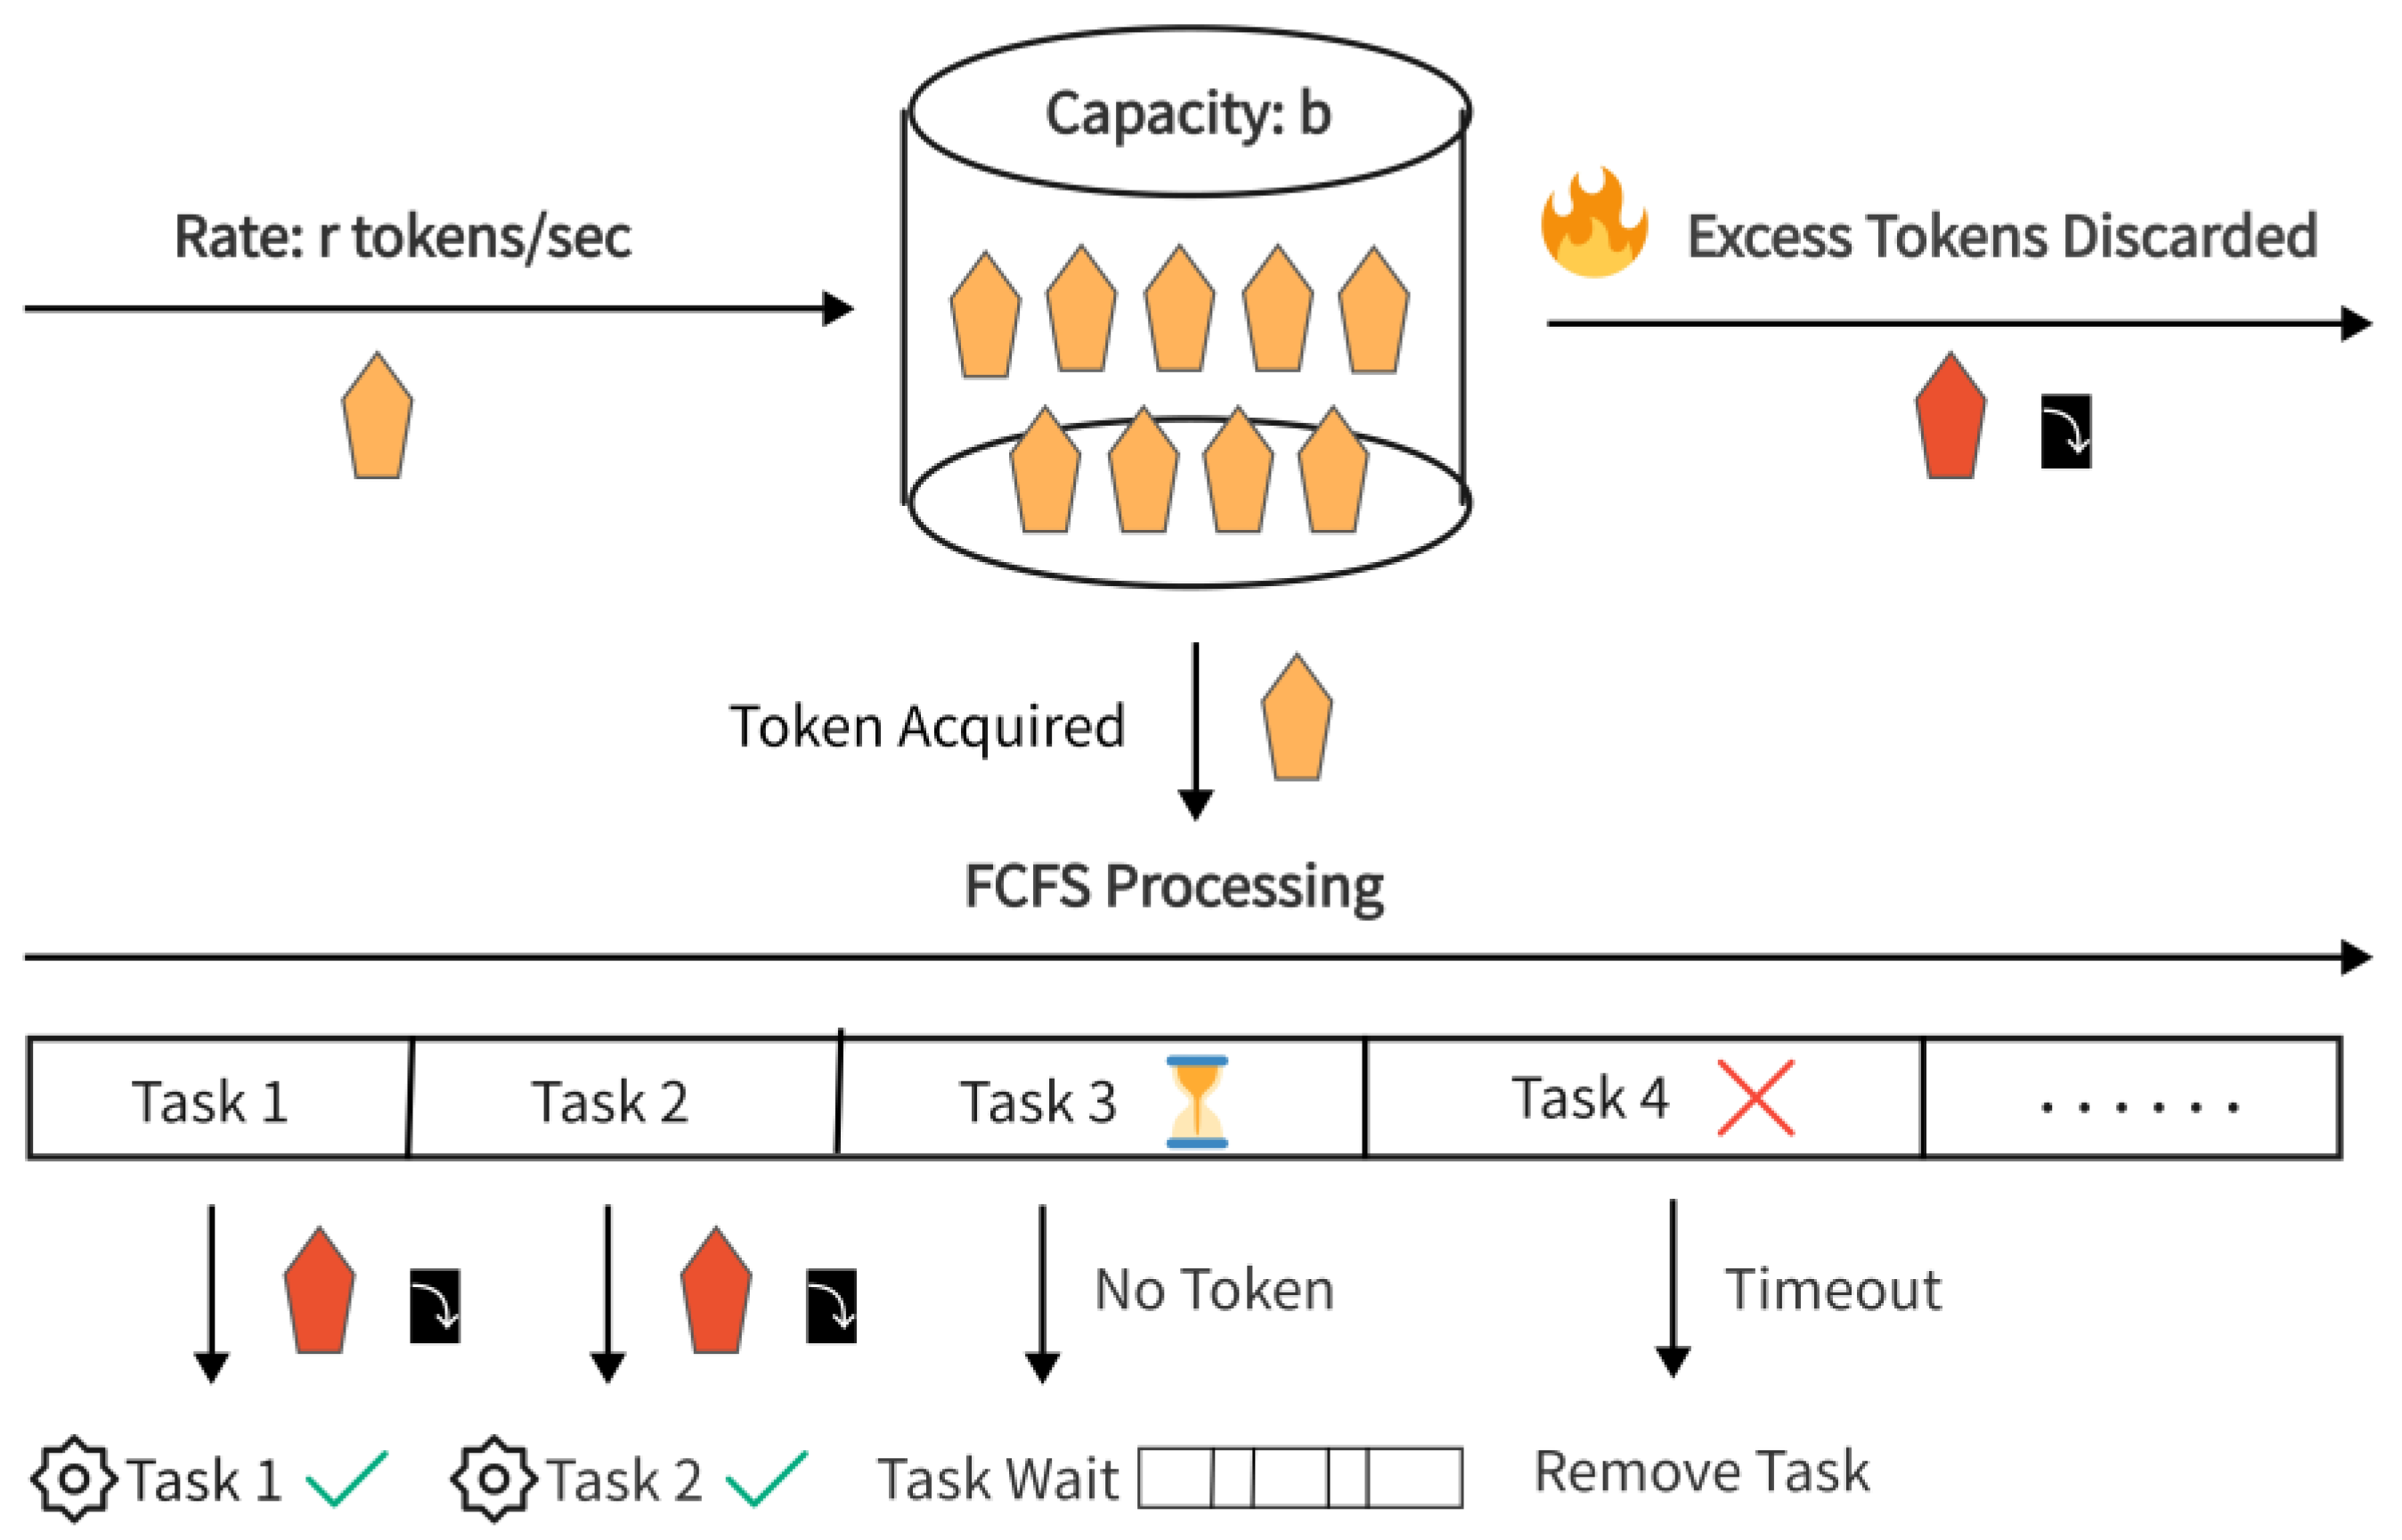
  • The client sends requests, and each request forms a task on the server. All tasks form a queue, and they are processed according to FCFS (First-Come, First-Served) [25].
  • A token bucket with a capacity of b tokens is set up, and tokens are provided at a rate of r tokens per second. If the bucket is full, excess tokens are discarded.
  • Each arriving task must obtain a token from the bucket before it can be sent. After the task is sent, the token is removed from the bucket.
  • The server receives and processes the tasks which obtain tokens. If no token-holding tasks are waiting in the queue or if the waiting time exceeds a predefined timeout, the tasks are dropped.
It can be found that in the token bucket-based traffic-shaping approach for highly concurrent tasks, the rate r at which the system provides tokens is very important, and this value along with the load state of the system determines the speed at which the system can process task requests under high-concurrency conditions.
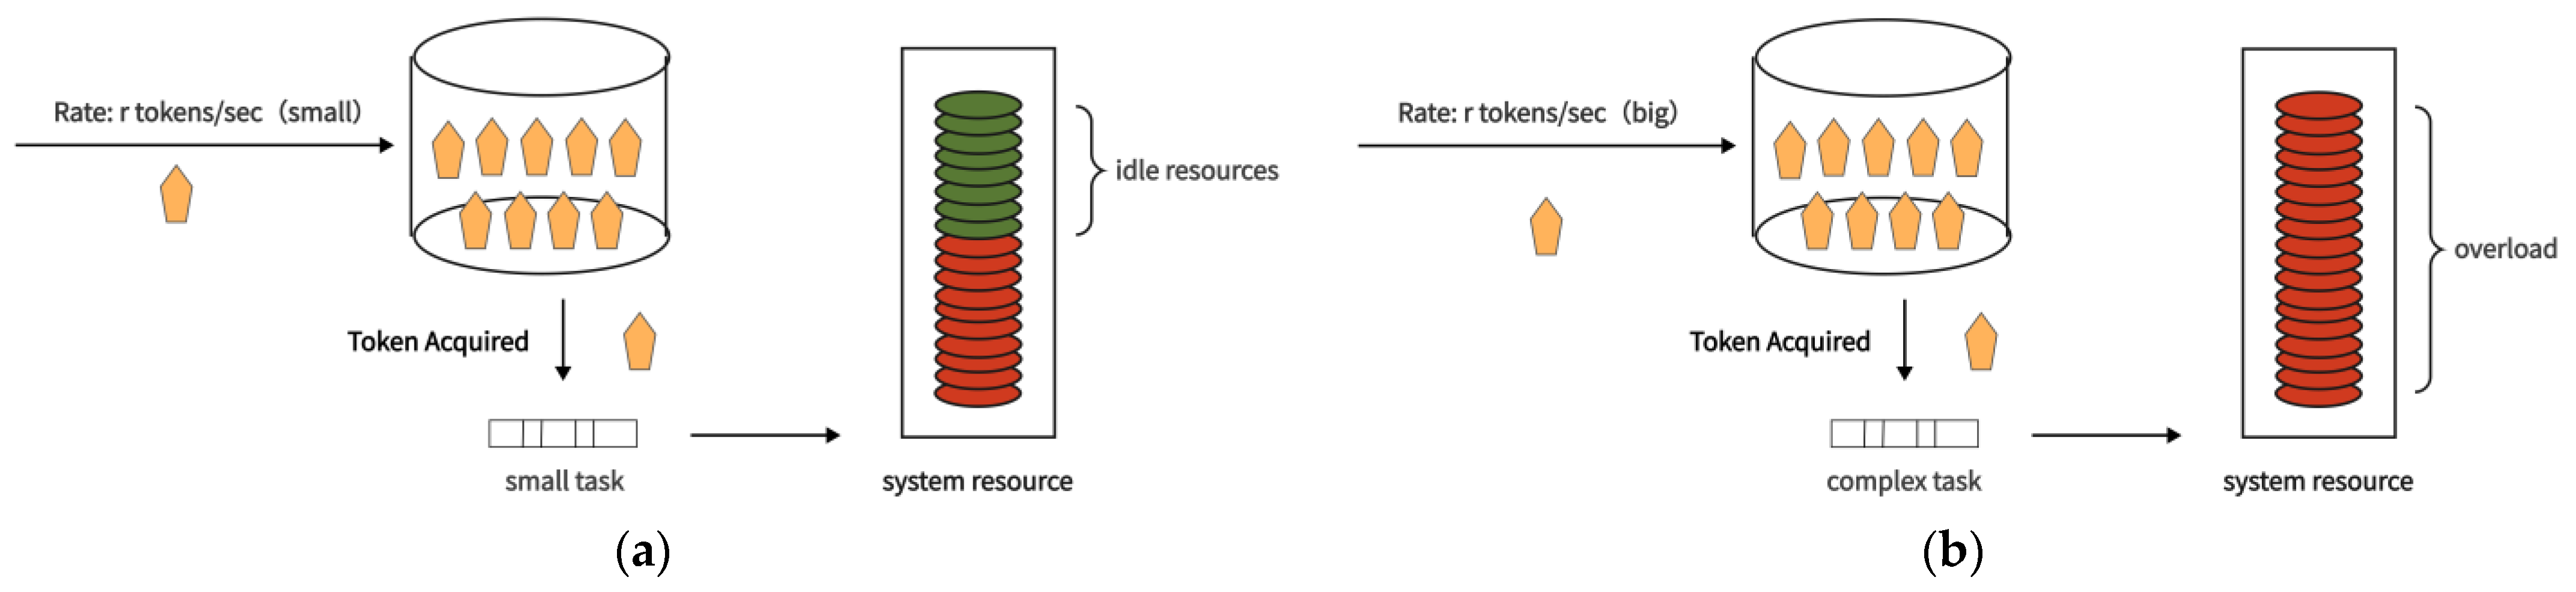
  • When the task is relatively simple, the single task occupies fewer system resources, and it is appropriate to set a larger r value at this time to improve the system resource utilization and the average processing rate of the total task.
  • When the task is more complex, the single task occupies more system resources; at this time, it is appropriate to set a smaller r value to improve the processing rate of the single task and the average processing rate of the total task.

2.2. Existing Single-Server Highly Concurrent Task Traffic-Shaping Methods

Recent advancements in single-server high-concurrency traffic shaping for GIS platforms have focused on optimizing resource allocation under dynamic workloads. A foundational approach is the hierarchical token bucket (HTB) algorithm, which prioritizes traffic classes and dynamically allocates bandwidth. Ardhana and Mulyodiputro [26] applied HTB in university networks to manage bandwidth distribution, reducing packet loss by 90% and improving throughput consistency. However, HTB’s performance depends on static parameter configurations, limiting its adaptability to fluctuating task demands.
To address this, priority-based queueing methods have been proposed. Anitha et al. [27] introduced a Priority Queue Token Bucket Algorithm (PQTBA) for IoT networks, categorizing traffic into preemptive/non-preemptive groups based on real-time requirements. PQTBA achieved a 20% improvement in throughput compared to traditional token bucket approaches, but it requires predefined priority rules, which may not align with the fluid task hierarchies in GIS systems.
To solve traffic collisions in wired networks, MAT NAWI and YUSOF [28] employed OPNET Modeler to determine the optimal token bucket size for traffic shaping, significantly reducing network latency and minimizing response times during high-concurrency application requests. However, this optimization remains fundamentally static, relying on predefined variable adjustments that fail to adapt to dynamically changing traffic demands.
Gao et al. [29] proposed a token bucket-based dynamic batching (TBDB) algorithm to determine workloads while considering data concurrency and frequency. This algorithm dynamically adjusts the maximum batch size (MBS) that triggers the next inference process, aiming to maintain throughput while reducing latency and improving device utilization, especially under high request volumes. However, the algorithm still relies on manually configured parameters such as token generation rate and bucket capacity, limiting its adaptability to diverse hardware platforms and scenarios. Additionally, TBDB solely depends on token bucket thresholds and time limits without a comprehensive consideration of system resource states, which may introduce latency due to waiting for a token generation under high concurrency.

2.3. Shortcomings of Existing Methods

Existing methods effectively solve the problem of task shaping in single-server high-concurrency scenarios and can cope with bursty tasks of a certain scale. However, the existing method is a static parameter setting method [30], i.e., the token bucket fill rate r needs to be preset. The complexity of the task is constantly changing during the actual task request, and the fixed token fill rate makes it possible to have continuous bursts or a large number of discards in the overall service under high-concurrency conditions. Specifically, the existing methodology still suffers from the following two shortcomings, as shown in Figure 2.
  • When the requested task is simpler (i.e., occupies fewer system resources) and the current token bucket rate is less than the actual system processing capacity, the utilization of system resources is lower, increasing the average processing delay of the task volume and the service rate is lower.
  • When the requested task is more complex (i.e., occupies more system resources) and the current token bucket rate is greater than the system’s actual processing capacity, the system responds to more tasks and there is task blocking, which likewise increases the average processing delay and lowers the service rate.
These limitations highlight a fundamental gap in existing approaches: static parameter tuning cannot reconcile the conflicting demands of simple and complex tasks within the same system. Even advanced methods like HTB and PQTBA rely on predefined rules or priorities, which are ill-suited to the fluid task hierarchies of GIS platforms. For example, HTB’s hierarchical queueing fails to dynamically reallocate resources between map rendering (simple) and spatial analysis (complex), while PQTBA’s priority rules cannot adapt to emerging task urgencies in disaster response scenarios.
The classical token bucket algorithm is incapable of adapting to dynamic workloads and exhibits limitations in GIS service task processing. The adaptive task traffic-shaping method proposed in this paper is capable of dynamically adjusting the task processing rate, thereby optimizing resource utilization, reducing processing delays, and accommodating the complex task requirements of GIS platforms in high-concurrency scenarios.
This paper bridges these gaps by introducing a novel adaptive framework that integrates multi-dimensional load metrics, queueing theory, and predictive analytics. The proposed algorithm directly addresses these gaps by introducing the following: (1) a fully dynamic token rate adjustment mechanism driven by real-time multi-dimensional load assessment (CPU, memory, and resource links); (2) a hybrid M/M/1-HMM framework that theoretically links task arrival-process dynamics to adaptive shaping. This approach avoids single-metric bias, eliminates manual rate tuning, and exhibits strong self-adaptability and robustness. Customizing parameters according to the task characteristics of GIS service systems enhances efficiency in specific scenarios.

3. Adaptive Task Traffic-Shaping Algorithm

In this paper, an adaptive task traffic-shaping algorithm in a finite resource environment is proposed, which includes the following two core steps: (1) Task request queueing theory model [31,32]: the queueing theory model is introduced to establish the relationship between the arrival rate of queue expected task and the current system task processing rate. (2) Adaptive task traffic shaping based on system work load [33,34]: the server load is dynamically calculated, and the expected task arrival rate of the queue is adjusted by establishing a functional relationship between the load and the current task processing rate of the system, so as to adaptively adjust the fill rate of the token bucket. The overall flowchart is shown in Figure 3.

3.1. Task Request Queueing Theory Model

In a GIS service system, users send requests through various terminal access devices, the system treats all requests equally and provides services based on the FCFS principle. In order to model each single server (considered to have only one service counter) of the GIS service system as a queue system, referencing the queueing theory model, the following conditions need to be satisfied [35]:
(1) During the operation of the GIS service system, user requests arrive at the service counter one at a time and each request is independent of the others; the interarrival time follows an exponential distribution with the average arrival rate λ, and arriving user requests can be modeled as a Poisson process (very common in this type of phenomenon).
(2) The user requests are processed by the service node (contains a request queue) following an FCFS discipline. The processing time for each task is assumed to follow an exponential distribution with rate μ .
Based on the above assumptions, the M/M/1 queueing model [36,37] can be used to model a single-server cloud service system. Call ρ = λ μ the traffic intensity, and n the mean number of tasks in the queue. If the system reaches a steady state (in other words, if the rate at which tasks arrive is slower than the rate at which they are processed), Ls is used to indicate the steady state and denoted as
L s = n = 1 n 1 ρ ρ n = ρ + 2 ρ 2 + 3 ρ 3 + ρ 2 + 2 ρ 3 + 3 ρ 4 + = ρ 1 ρ = λ μ λ
It can be seen that Equation (1) describes the relationship between λ , μ , and L s , where L s can be obtained by real-time monitoring in the system, and if μ can be calculated dynamically, the system expects the average arrival rate of the task λ . As a result, the token fill rate can be adjusted according to λ , so as to keep the system in a healthy and stable state.

3.2. Adaptive Traffic Shaping Based on Resource Loading

3.2.1. Calculation of Single-Server Resource Load

During the process of a single server providing services, its current task processing rate μ is directly related to the system’s overall load. As the server’s load increases, which indicates that its available processing capacity decreases. Therefore, the value of μ decreases as the server load increases. To address this, this paper first calculates the overall load of the single server.
Based on the existing literature [38], (1) In current load calculations, CPU usage is commonly used as the main factor for measuring load [39]. (2) Memory, as an important component of a computer, serves as a bridge between the CPU and other components. The memory usage has a significant impact on the performance of service nodes when evaluating their performance [40]. (3) Furthermore, for a single server, the number of resource links it contains is fixed. As the number of utilized resource links increases, the computational workload of the server also increases. Therefore, the proportion of used resource links is defined as another factor for evaluating the load.
Based on the above analysis, this paper evaluates the load of a single server from three dimensions: (1) CPU usage rate L(C); (2) memory usage rate L(M); (3) proportion of used resource links L(R).
Using the above load indicators, a weighted summation formula is defined to calculate the overall load:
L o a d = ω 1 L C + ω 2 L M + ω 3 L R = i = 1 3 ( ω i L i )
where ω 1 , ω 2 , and ω 3 are the weights of CPU usage, memory usage, and the share of the number of used resource links, respectively, and ω 1 + ω 2 + ω 3 = 1 .
Due to the inconsistent changes in the three indicators mentioned above, for instance, when the CPU usage reaches 80%, the memory usage might only be 20%, it indicates that directly assigning weights based on the literal values of the three indicators is not reasonable. Instead, the actual impact of these indicators on the system should be considered. Existing research suggests that when the values of the load calculation indicators fall within the range [0.35, 0.75], the system is in a relatively healthy and stable state [41,42,43]. When the measured values of the three load indicators fall into three distinct intervals, [0, 0.35], (0.35, 0.75], and (0.75, 1.0], their respective impacts on system load vary. The weight value ω i should be dynamically adjusted based on the load condition L i . After ranking the current measured values of these indicators, corresponding weight values are assigned according to their relative importance.
Therefore, in this paper, the weights are assigned based on the status of each indicator:
  • When all L i fall within the same interval of [0, 0.35], [0.35, 0.75], or [0.75, 1], it is assumed that the impact of the three indicators on the system load is consistent. In this case, the weights can be assigned by sorting the current actual values of the indicators and giving corresponding weights. Based on extensive experiments, the paper proposes the following set of weight values: {0.5, 0.3, 0.2}.
  • When one indicator falls within the [0.35, 0.75] range and the other two indicators fall within the [0, 0.35] range, it is assumed that the indicator within the [0.35, 0.75] range has a greater impact on the system load, so its weight should be higher. The other two indicators can be sorted according to their actual values and assigned corresponding weights. Based on extensive experiments, the paper proposes the following set of weight values: {0.7, 0.2, 0.1}.
  • When two indicators fall within the [0.35, 0.75] range and one indicator falls within the [0, 0.35] range, it is assumed that the two indicators within the [0.35, 0.75] range have a greater impact on the system load, so their weights should be higher. In this case, the indicators can be sorted according to their actual values and assigned corresponding weights. Based on extensive experiments, the paper proposes the following set of weight values: {0.5, 0.4, 0.1}.
  • When one indicator falls within the [0.75, 1] range and the other two indicators fall within the [0, 0.75] range, it is assumed that this indicator is the current system bottleneck and its weight should be very high. Based on extensive experiments, the paper proposes the following set of weight values: {0.9, 0.07, 0.03}.
  • When two indicators fall within the [0.75, 1] range and one indicator falls within the [0, 0.75] range, it is assumed that these two indicators are the current system bottleneck and their weights should be very high. In this case, the indicators can be sorted according to their actual values and assigned corresponding weights. Based on extensive experiments, the paper proposes the following set of weight values: {0.5, 0.47, 0.03}.

3.2.2. Adaptive Traffic Shaping Based on Resource Load

This study establishes a Hidden Markov Model (HMM) to characterize the relationship between the system’s overall load levels and the expected token fill rate levels, based on the comprehensive load conditions of the system. Both the system’s overall load and the expected token fill rate are categorized into discrete levels. The parameters of the HMM are initialized to predict the state of the expected token fill rate level at the next time step, given the observed sequence of the system’s overall load levels.
Specifically, this study categorizes the system’s overall load into five levels, denoted as LoadRank, which represents the observable states. These levels are defined as follows: L([0, 0.35]): Low load; LM((0.35, 0.5]): Low–Medium load; M((0.5, 0.75]): Medium load; HM((0.75, 0.9]): High–Medium load; H((0.9, 1.0]): High load. Similarly, the expected token fill rate is categorized into three levels, denoted as RateRank, which represents the hidden states. These levels are defined as: Rank1, Rank2, Rank3. A HMM is established to model the relationship between the observable LoadRank and the hidden RateRank. The HMM parameters are initialized as follows: hidden states (Equation (3)); initial probability distribution of hidden states ( P R a n k 1 0 , P R a n k 2 0 , P R a n k 3 0 = 0.4 , 0.3 , 0.3 ); transition probability matrix of hidden states (Equation (4)); emission probability matrix (Equation (5)). Based on the observed sequence of LoadRank (calculated in real-time), the HMM predicts the state of RateRank at the next time step.
Additionally, two rate adjustment parameters, α and β are introduced. Let f R a n k = f ( α ,   β ) :
f R a n k = α = 1 , β = 1   , i f   R a t e R a n k = R a n k 1 α = 0.5 , β = 1 , i f   R a t e R a n k = R a n k 2 α = 0 , β = 0.8 , i f   R a t e R a n k = R a n k 3
The transition probability matrix T r a t e r a n k , r a t e r a n k and the emission probability matrix E l o a d r a n k , r a t e r a n k for RateRank are defined as follows.
T r a t e r a n k , r a t e r a n k = 0.7 0.3 0 0.15 0.7 0.15 0 0.3 0.7
E l o a d r a n k , r a t e r a n k = 0.750 0.050 0.005 0.150 0.200 0.020 0.075 0.500 0.075 0.020 0.200 0.150 0.005 0.050 0.750
Based on the inverse relationship between the comprehensive load of the system and the task processing capability of the system [38], Equation (6) is defined to take the current comprehensive complex computing task processing rate of the system as
μ = ( 1 L o a d M a x L o a d ) × N
In the formula, L o a d is the current comprehensive load of the server, which has been defined previously. M a x L o a d is the load value when the server is fully loaded (ideal state). N indicates the number of tasks that can be executed per second when the server is idle. This value can be obtained by multiple experiments.
From L = λ μ λ , w e c a n g e t :
λ = l × μ 1 + L = L 1 + L × ( M a x L o a d L o a d ) M a x L o a d × N
It can be seen that Equation (7) describes the relationship between the expected task arrival rate λ of the system and the current system Load. If the system load is calculated in real time, the task arrival rate λ can be obtained.
Furthermore, based on the relationship model between the expected task arrival rate and the system’s comprehensive load, in combination with the maximum token fill rate of the GIS system (Equation (8)), the minimum token fill rate (Equation (9)), and the expected token fill rate levels, a relationship model is established between the system’s expected average task arrival rate and the expected token fill rate. The token fill rate of the token bucket is then adjusted according to the obtained expected token fill rate, thereby achieving adaptive task traffic shaping.
This study determines the maximum and minimum token fill rates of the GIS service system as follows:
M a x T o k e n R a t e = M a x T h r e a d × 1000 S i n g l e T a s k C o s t T i m e
M i n T o k e n R a t e = 1000 S i n g l e T a s k C o s t T i m e
In the formula, MaxTokenRate and MinTokenRate represent the maximum and minimum token fill rates of the GIS service system, respectively. MaxThread denotes the maximum number of concurrent threads allowed by the GIS service system, and SingleTaskCostTime represents the average time required to process a single task. In this study, MaxThread is set to 8, while SingleTaskCostTime varies depending on the complexity of the task. Specifically, the time cost is defined as 5 ms for simple tasks, 20 ms for general tasks, and 80 ms for complex tasks.
Based on the predicted expected token fill rate level, the rate adjustment parameters are determined to calculate the expected token fill rate at time t using the rate at time t−1 (Equation (12)). The resulting value is then used to adjust the token fill rate of the token bucket.
Additionally, an exponent a is defined (Equation (10)) to assist in optimizing the token fill rate and to calculate the remaining service capacity of the GIS service system (Equation (11)).
δ = L s 1 + L s ,         L s > 0       1 ,                     L s 0
r r e s = δ × ( 1 L o a d M a x L o a d ) × N =                                                   λ ,                             L s > 0 ( 1 L o a d M a x L o a d ) × N ,         L s 0
r = m a x ( m i n ( α × r t 1 + β × r r e s , M a x T o k e n R a t e ) , M i n T o k e n R a t e )
In the formula, r r e s represents the remaining service capacity of the GIS service system; r denotes the expected token fill rate of the GIS service system at time t; and r t 1 indicates the token fill rate of the GIS service system at time t−1.

4. Experiments and Analysis

To address the performance bottlenecks of GIS platforms under high concurrency, this study proposes an adaptive task traffic-shaping algorithm for resource-constrained environments. To validate the effectiveness, accuracy, and superiority of the proposed method, this paper compares the proposed method with the classic token bucket algorithm proposed by Shenker (hereafter referred to as the classic token bucket algorithm). The experiment is divided into three parts: (1) the optimal token fill rate probing for the classic token bucket algorithm under multiple types of tasks; (2) a comparison of the average processing delay between the classic token bucket algorithm (with optimal token fill rate) and the adaptive task traffic-shaping algorithm under different task scenarios; and (3) a comparison of the average throughput between the two methods under different task scenarios.
The selection of average latency and throughput as performance metrics is critical for evaluating QoS in GIS platforms, where real-time spatio-temporal data processing demands seamless user interactions (e.g., map rendering, query responses) and efficient resource allocation. Latency directly impacts user experience in GIS applications, such as time-sensitive disaster management or location-based services, while throughput reflects the system’s capacity to handle concurrent tasks like bulk data downloads or complex spatial analytics. This paper designed and conducted multiple comparative experiments. Through systematic performance analysis of task processing latency and throughput via comparisons with the classical token bucket algorithm, the proposed method demonstrates its advantages in real-world spatio-temporal big data center environments. These results provide a more efficient solution for handling high-concurrency tasks in GIS platforms.

4.1. Experimental Data and Experimental Environment

The method presented in this paper is embedded into the NewMap Spatio-temporal Big Data Center independently developed by the China Academy of Surveying and Mapping for experimental verification. The experimental data source is spatio-temporal big data from Dongying City, Shandong Province. The user task requests include “spatio-temporal data querying” and “spatio-temporal data download”. Task requests are sent randomly without priority and require various system resources. The experimental environment is a service center set up on a single graphics workstation with the following specifications: Windows 10 operating system, Intel(R) Core(TM) i7-6700HQ CPU with a clock speed of 2.6 GHz, and 64 GB of memory.

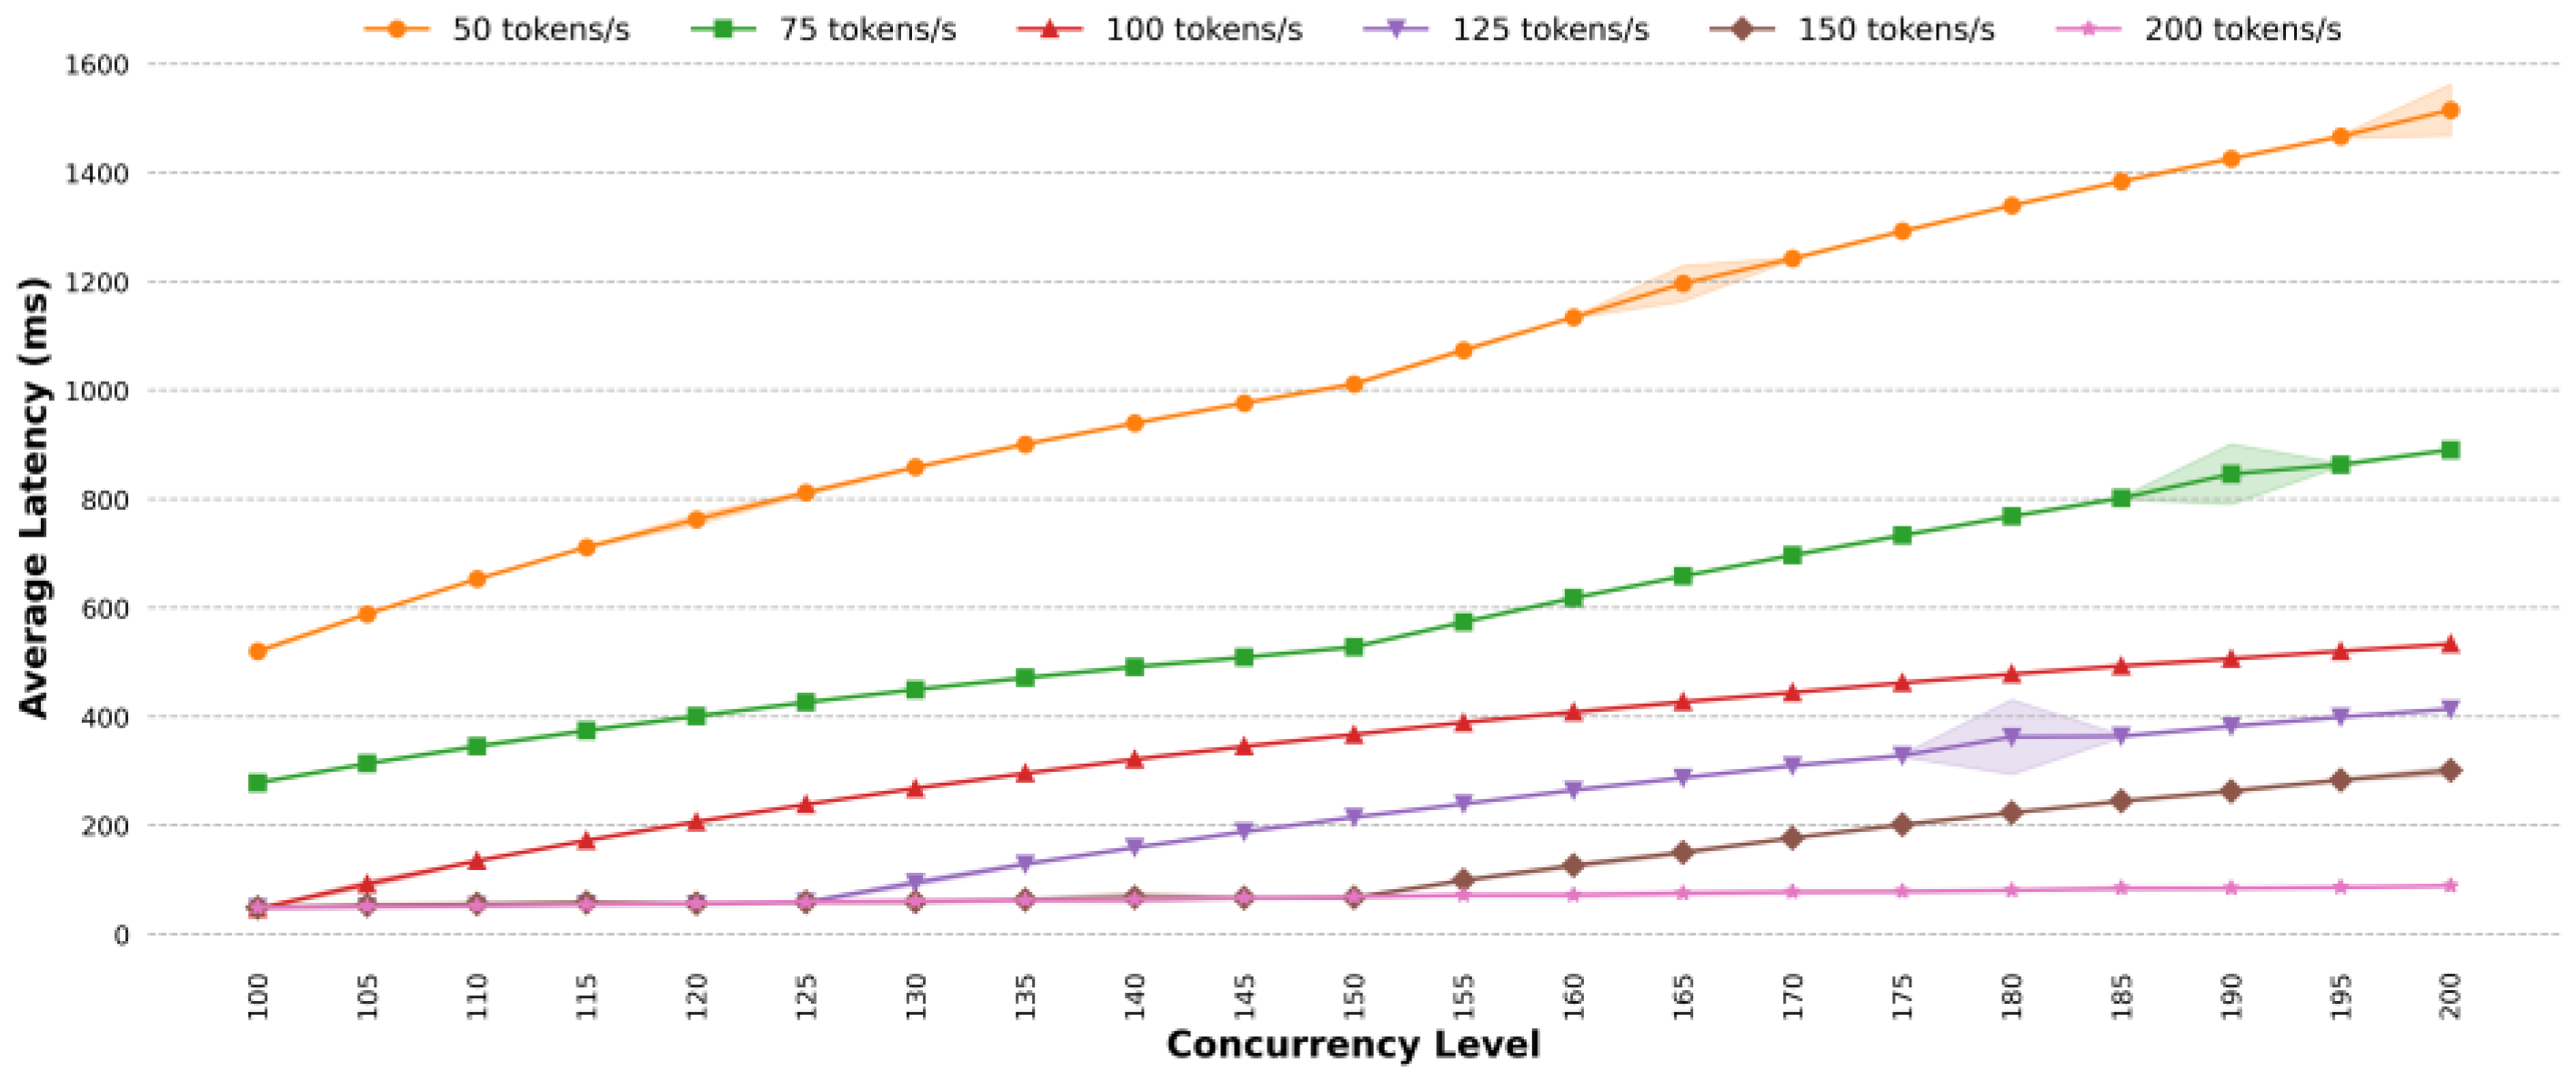
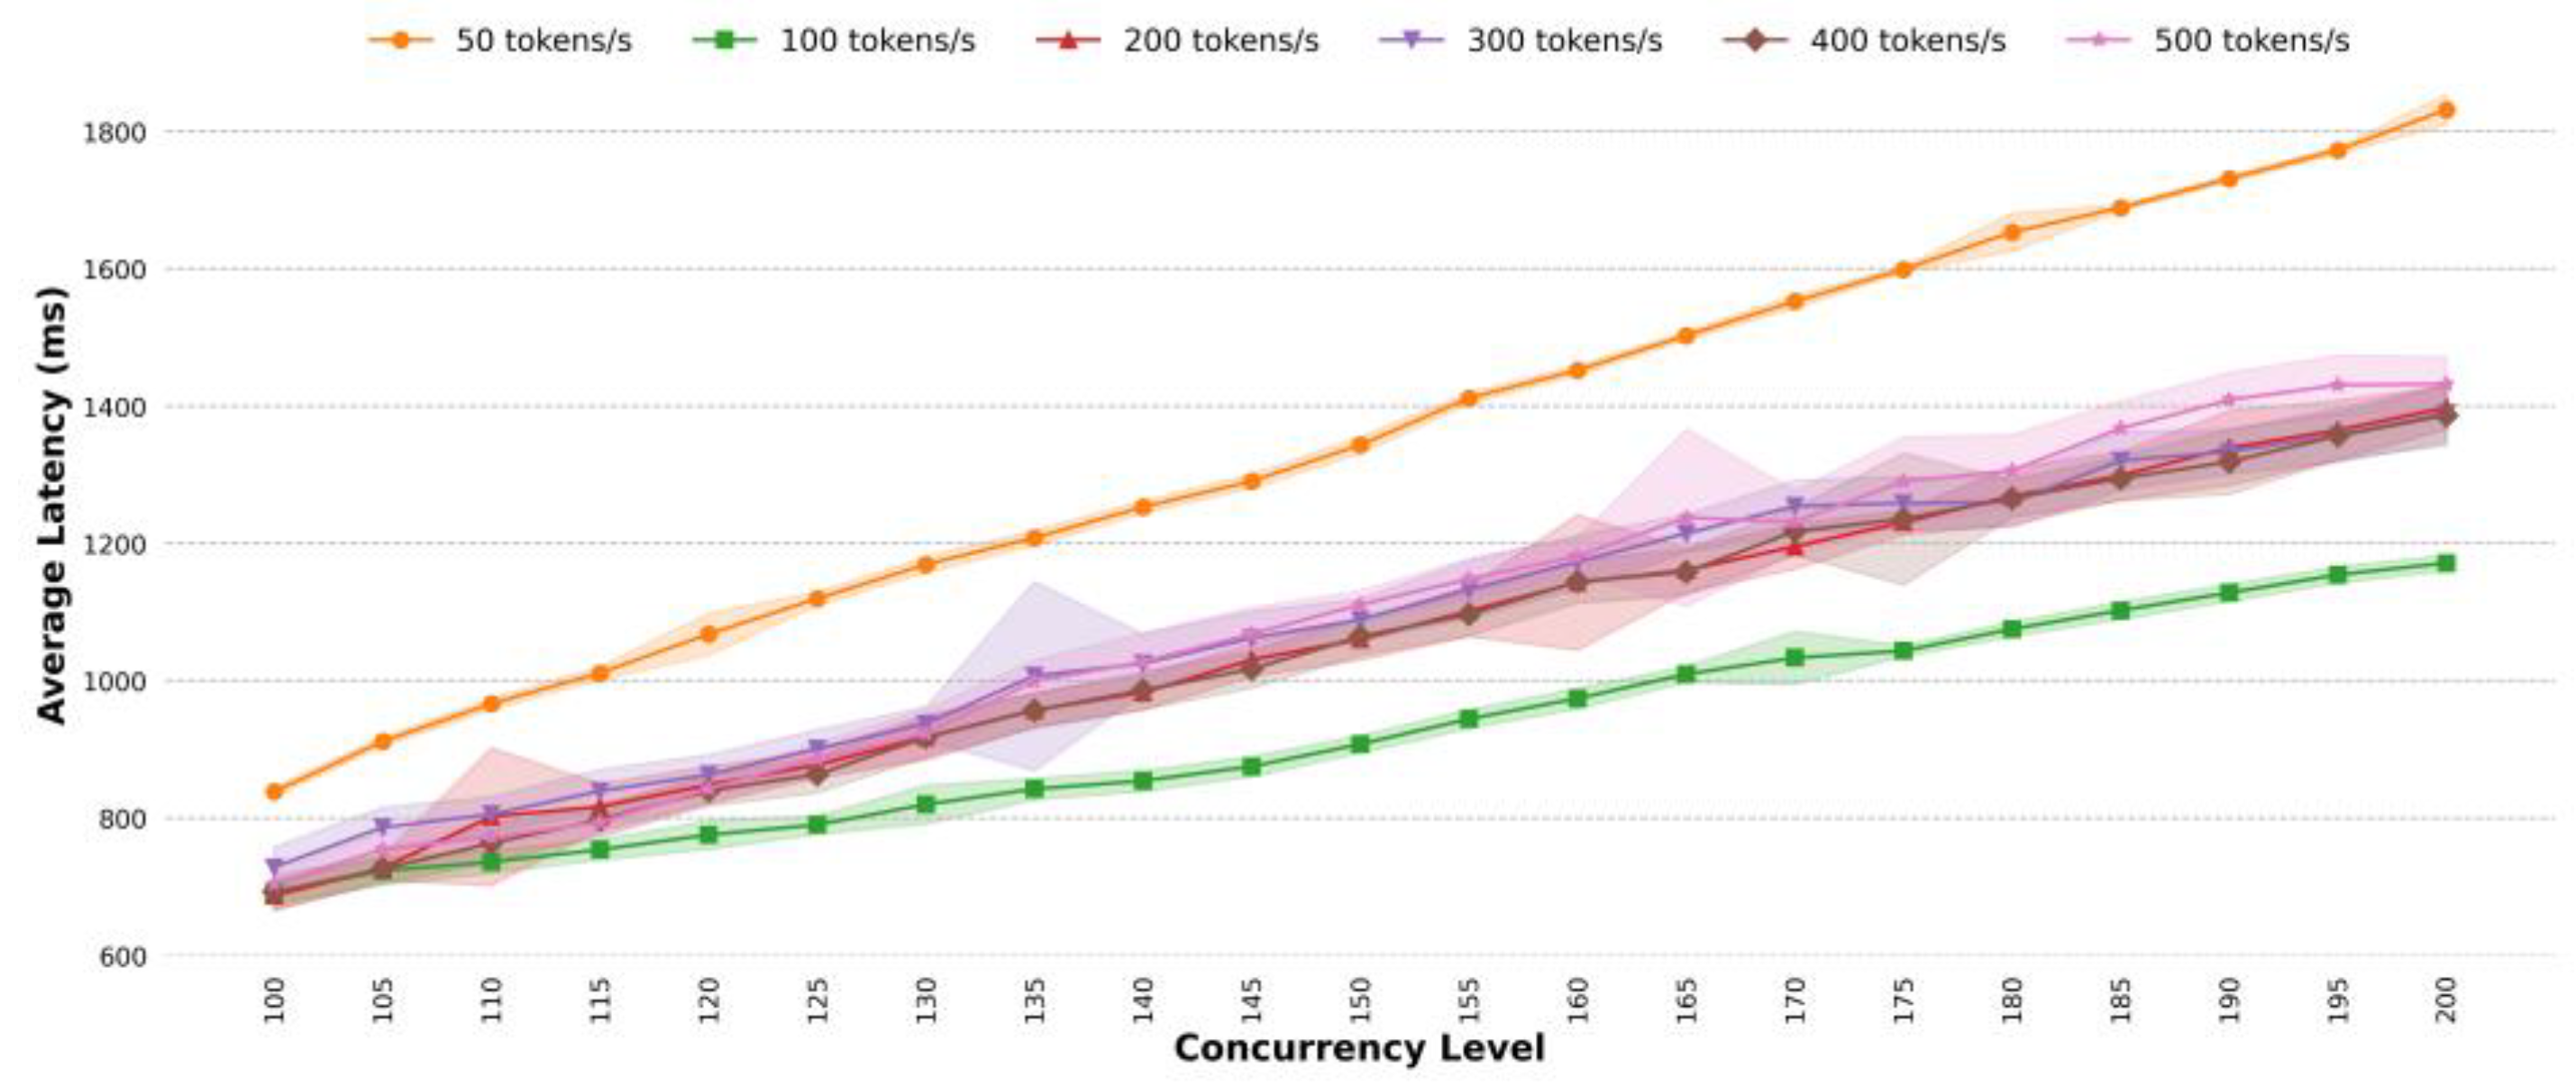
4.2. Optimal Token Fill Rate Detection

The task traffic accepted by the Spatio-Temporal Big Data Center is complex and diverse, while the classic token bucket algorithm performs traffic shaping by setting a fixed token fill rate, which is not well-suited for actual demands. To verify this issue, three types of tasks are defined: simple tasks (single-task single-thread execution time < 10 ms), general tasks (single-task single-thread execution time 10 ms ≤ t < 50 ms), and complex tasks (single-task single-thread execution time ≥ 50 ms). Service scenarios containing only one of these task types are established, and the optimal token fill rate for the classic token bucket algorithm is explored under multi-task conditions.
The experimental set up includes multiple groups of concurrency scenarios, with concurrency levels ranging from 1 to 200, and with each scenario differing by five concurrent tasks. To ensure that the experimental results are statistically significant, 20 experiments will be conducted for each group, and the mean and standard deviation of the experimental results for each group have been tabulated, which are shaded in the figures of the experimental results (by shading the areas around each line). In the scenario of simple tasks, the token fill rate is set to 50 tokens/s, 75 tokens/s, 100 tokens/s, 125 tokens/s, 150 tokens/s, and 200 tokens/s, respectively. In the scenario of general tasks, the token fill rate is set to 50 tokens/s, 100 tokens/s, 200 tokens/s, 300 tokens/s, 400 tokens/s, and 500 tokens/s, respectively. In the scenario of complex tasks, the token fill rate is set to 25 tokens/s, 50 tokens/s, 100 tokens/s, 200 tokens/s, 300 tokens/s, and 400 tokens/s, respectively. The optimal token fill rate is the rate corresponding to the lowest average task completion time (average latency).
From Figure 4, it can be seen that for simple task scenarios, setting the token fill rate to 50 tokens/s (orange solid line) results in the highest average latency across various concurrency levels, with a significant increase in latency as concurrency increases. This indicates that such a low rate severely limits system performance, causing excessive tasks to be queued and blocked. As the token fill rate increases to 75 tokens/s, 100 tokens/s, 125 tokens/s, and 150 tokens/s, the average latency progressively decreases, reflecting improved system efficiency. Notably, at a token fill rate of 200 tokens/s (pink solid line), the system achieves optimal performance, with an average latency of approximately 68 ms within a concurrency range of 100 to 200. This demonstrates that 200 tokens/s is the optimal fill rate for minimizing task completion time and ensuring efficient operation under high-concurrency conditions.
As shown in Figure 5, for general task scenarios, the average latency increases approximately linearly with the increase in concurrent requests. However, a higher token fill rate does not correspond to a lower average duration for total task completion. The token fill rate corresponding to the lowest average latency is 100 tokens/s and the highest average latency is 50 tokens/s. The average latency at other rates is closer and much higher than that at 100 tokens/s. Delving into the reasons, an excessively low token fill rate constrains the system’s processing capability, causing a large number of tasks to be stalled in the queue, whereas an excessively high token fill rate results in an overwhelming system load, pushing the system’s processing capability to its bottleneck. Hence, the token fill rate corresponding to the lowest average time is selected as the optimal rate for general task scenarios, which is determined to be 100 tokens/s. At a concurrency level ranging from 100 to 200, the average latency at this optimal rate is 924 ms.
From Figure 6, for complex task scenarios, the pattern of change in the average latency is similar to that of the general task scenario. When the token fill rate is 400 tokens/s (the highest), the total task average latency is the third highest; when the token fill rate is 25 tokens/s (the lowest), the average latency is the highest. The token fill rate corresponding to the lowest average latency is selected as the optimal rate for complex task scenarios, which is determined to be 50 tokens/s. At a concurrency level ranging from 100 to 200, the average latency at this optimal rate is 1672 ms.
Under the current computing environment, the optimal token bucket rate for simple tasks is set at 200 tokens/s, the optimal token bucket rate for general tasks is set at 100 tokens/s, and the optimal token bucket rate for complex tasks is set at 50 tokens/s. It can be illustrated that it is difficult to adapt to various task requests by setting a fixed token bucket rate.

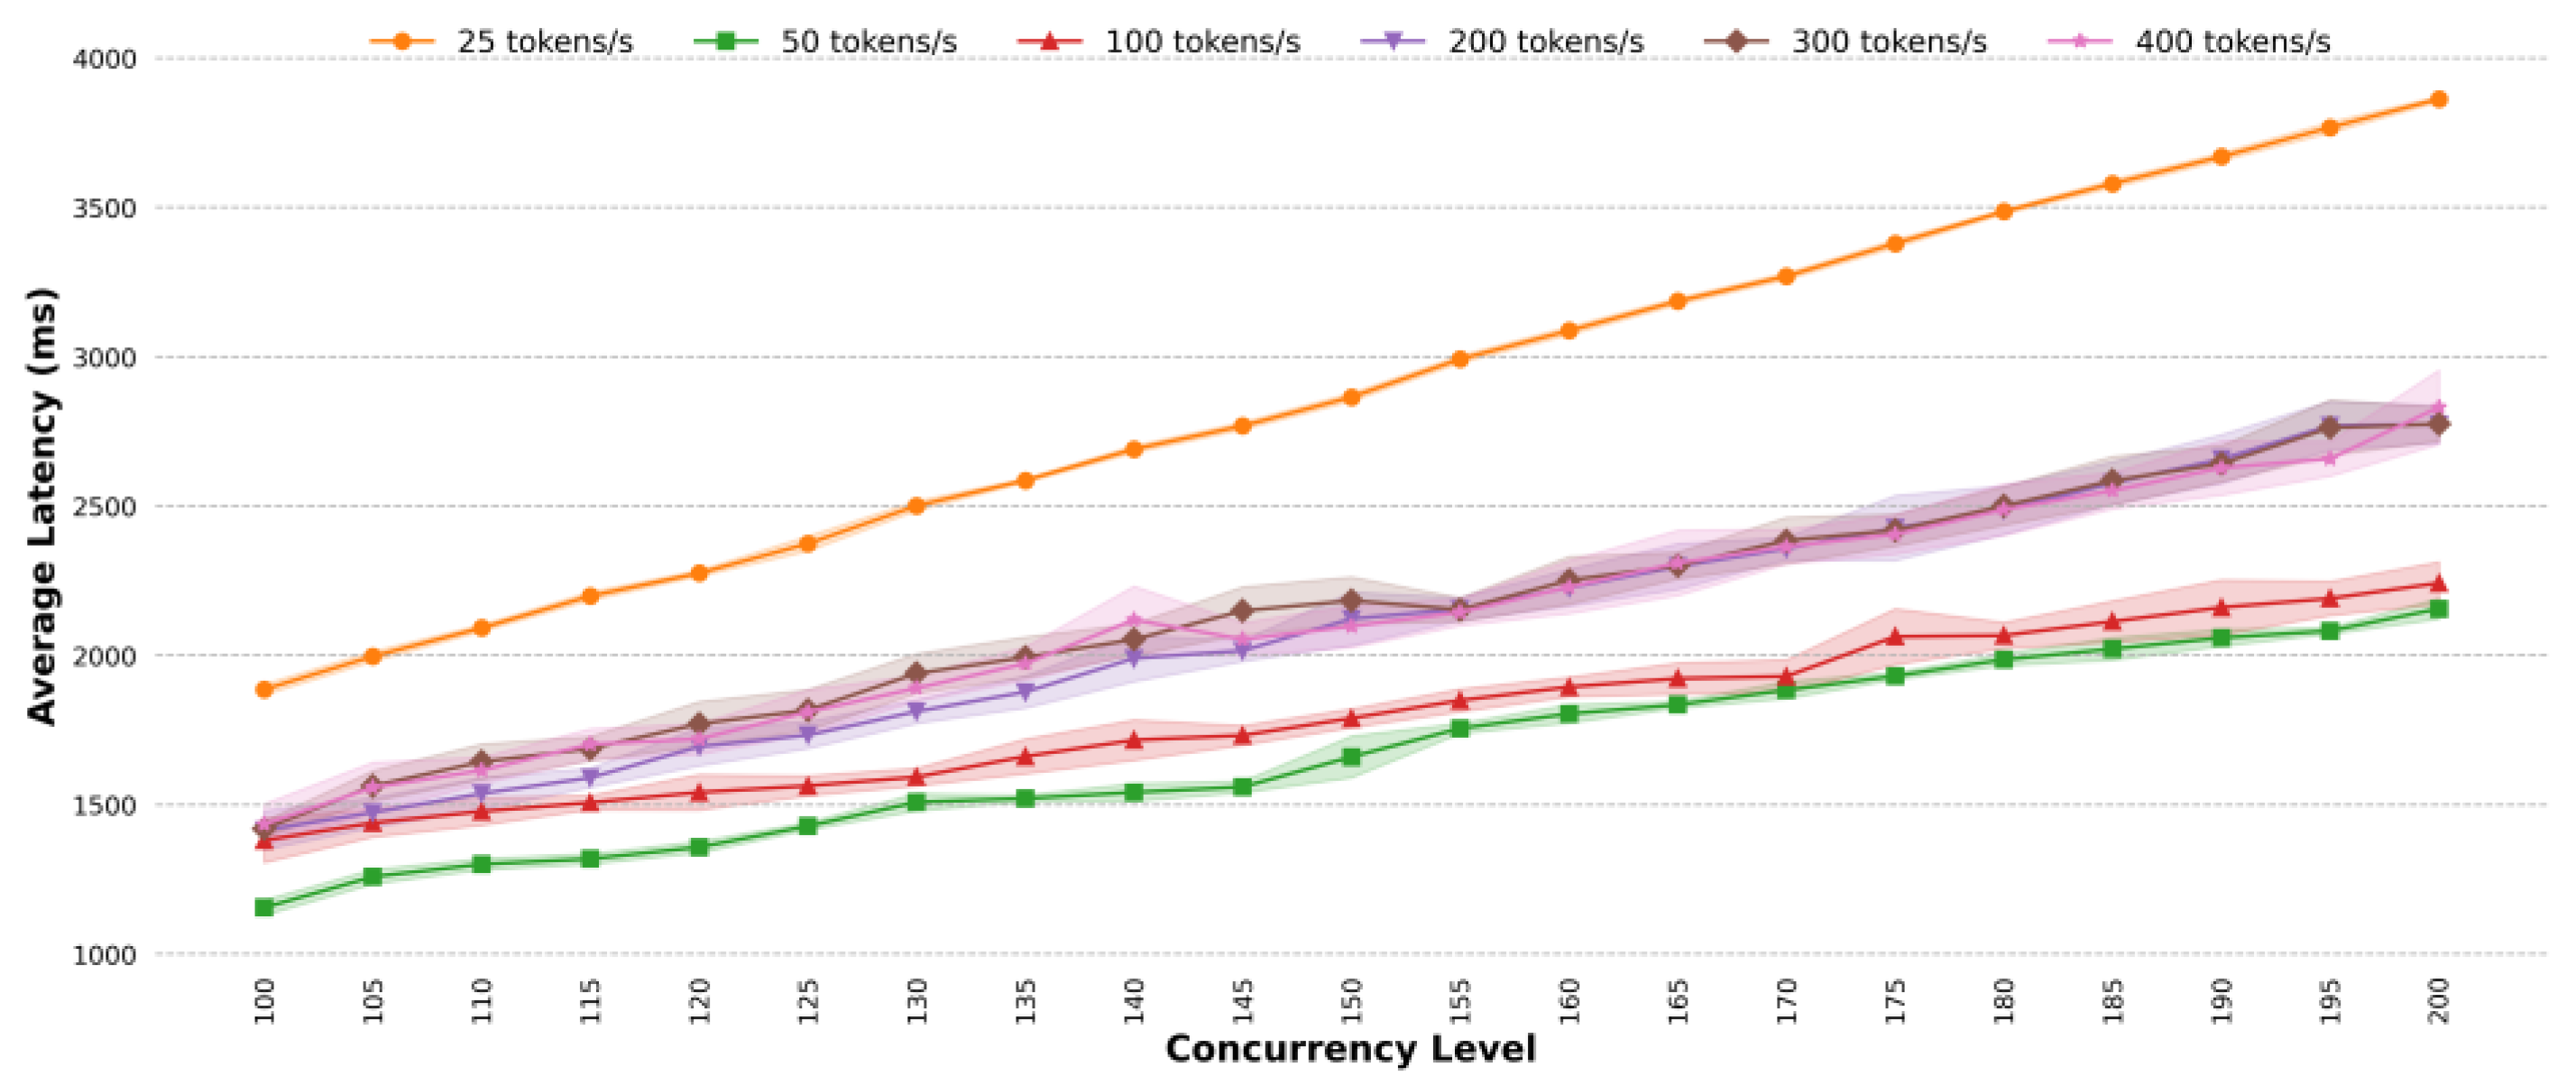
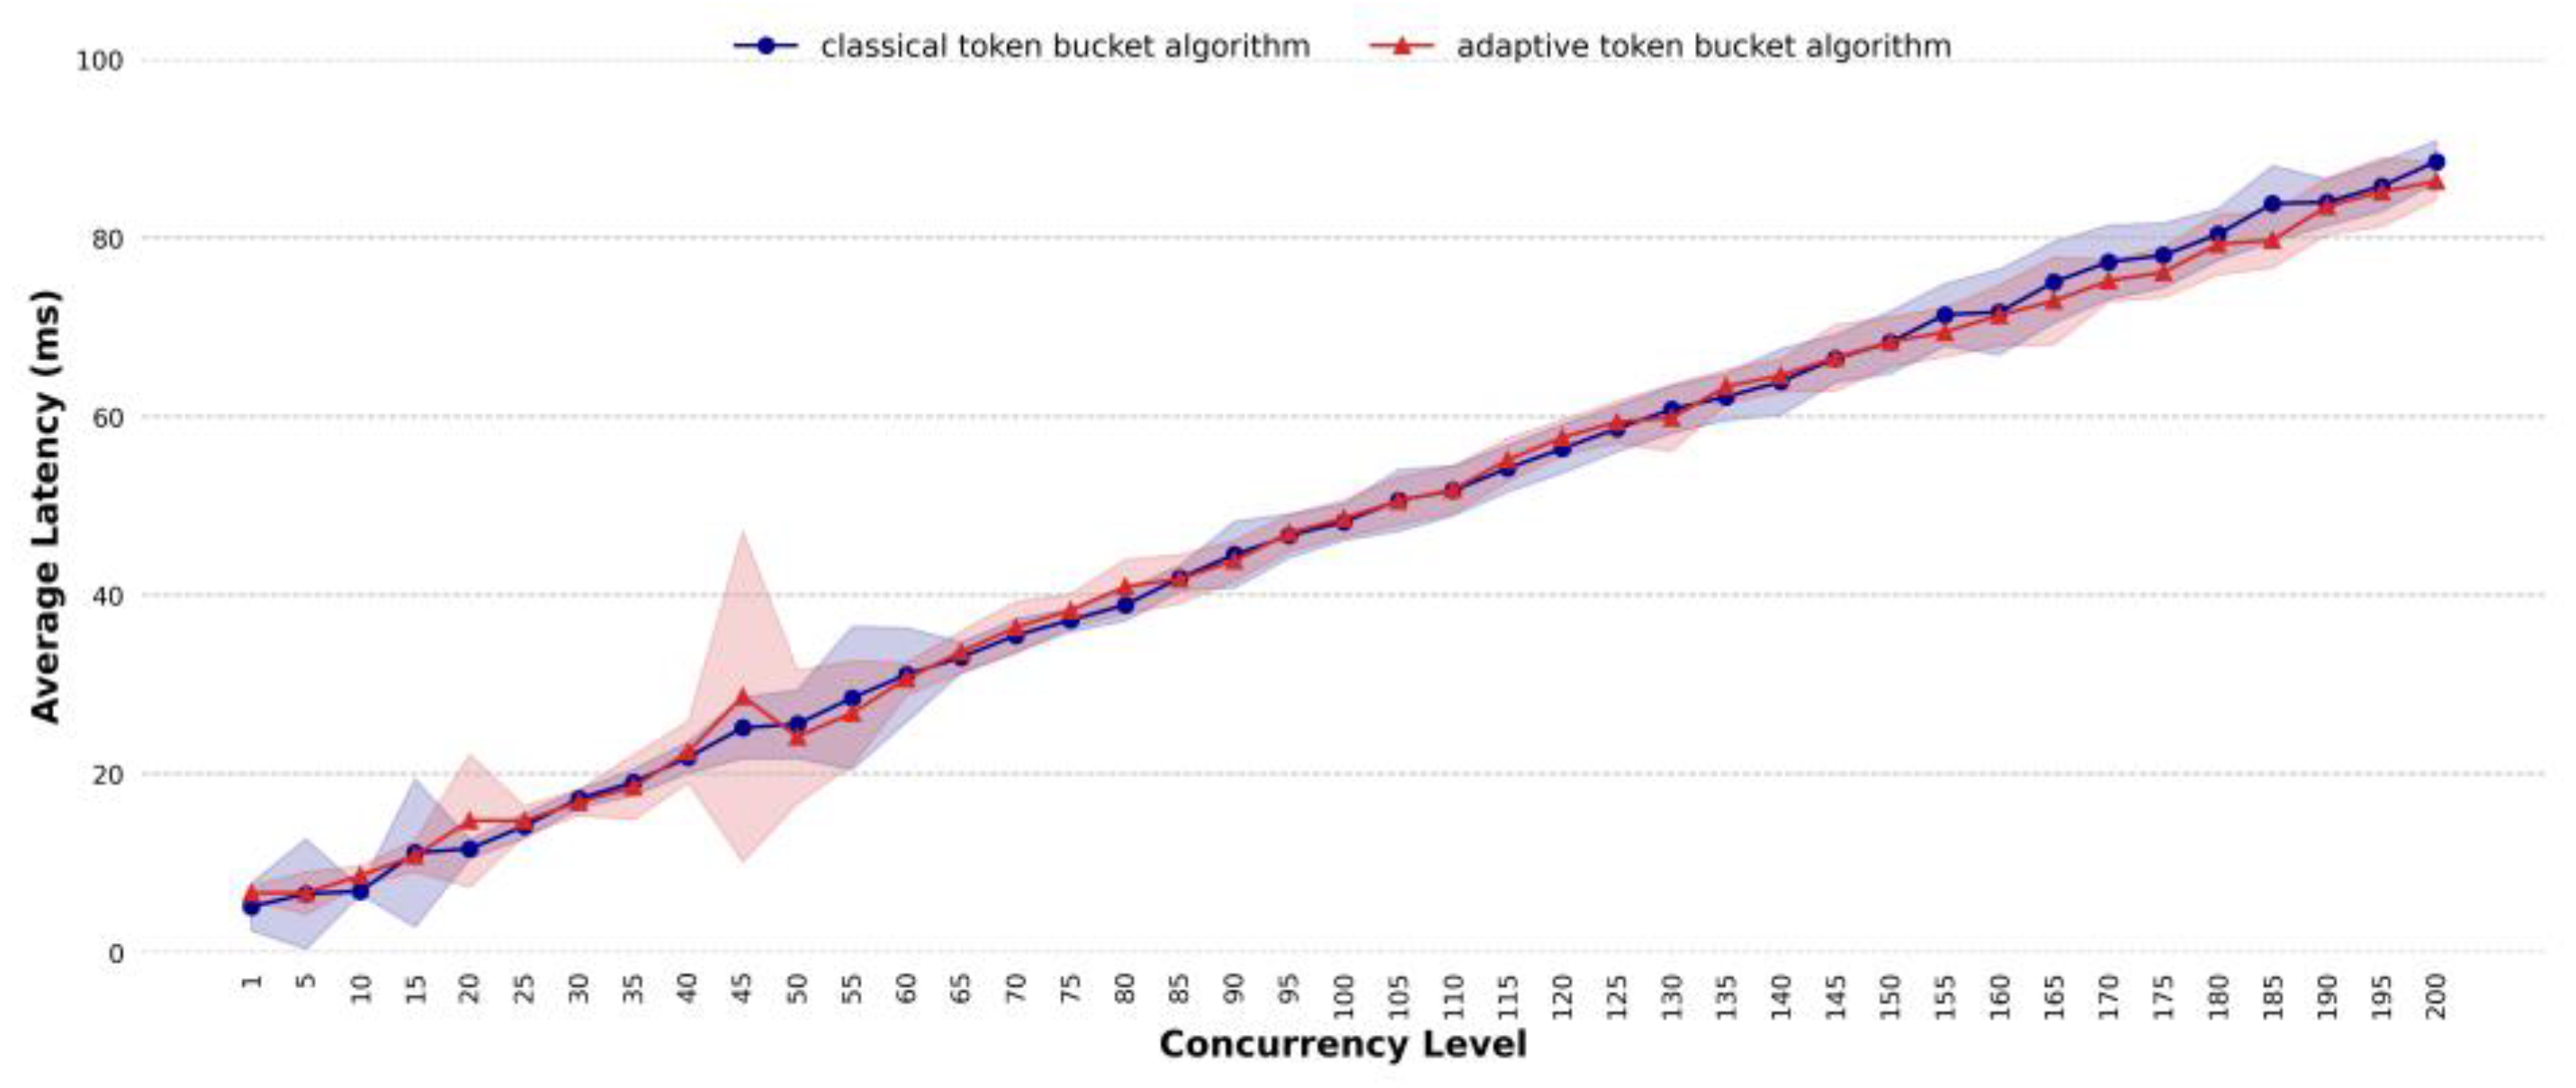
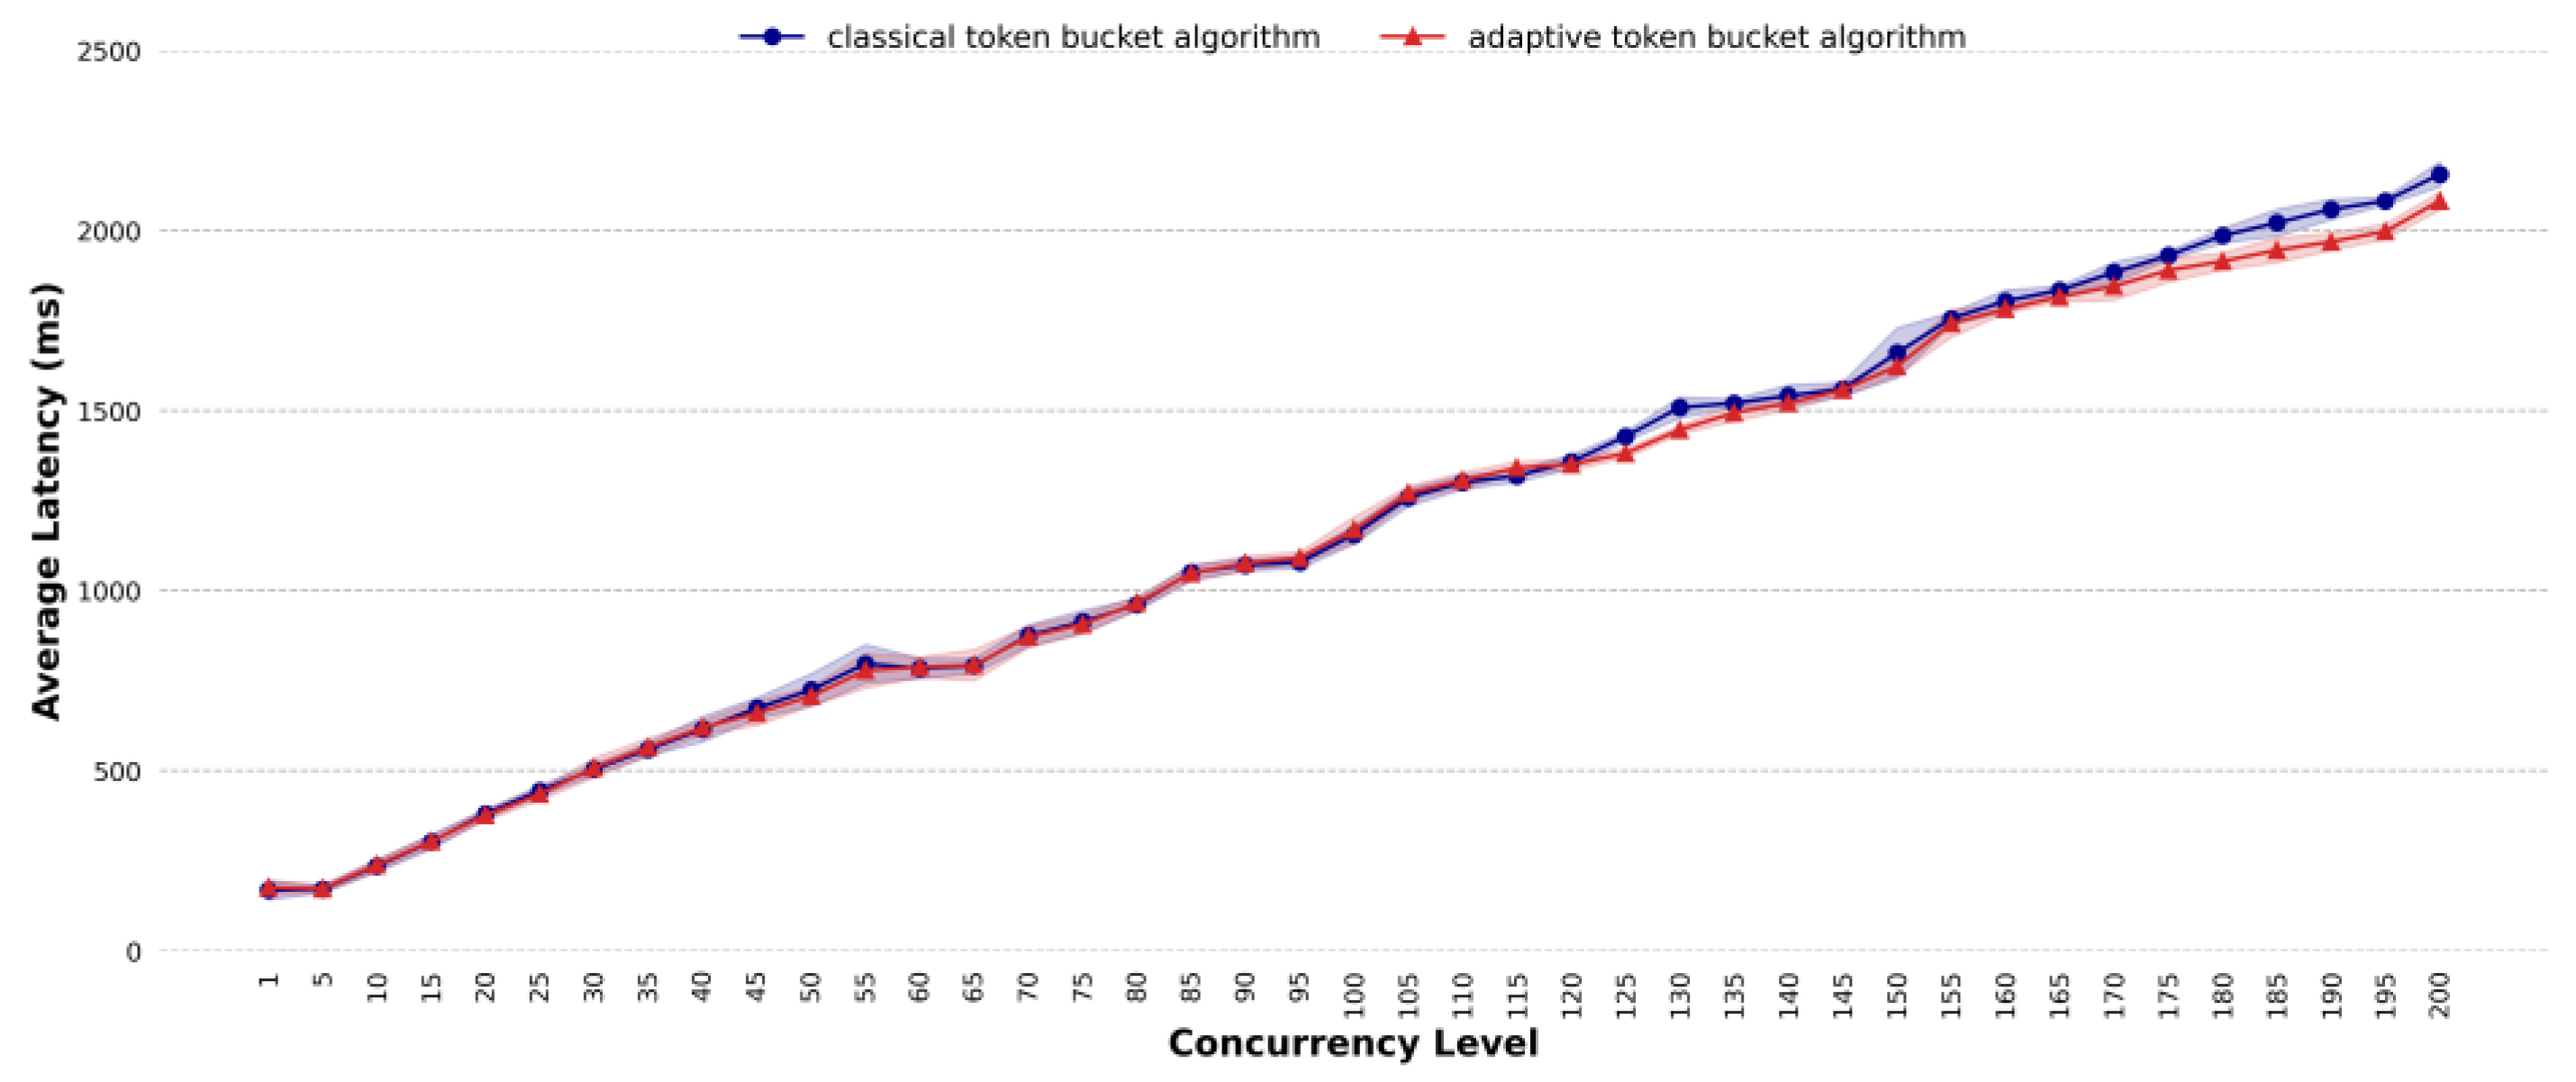
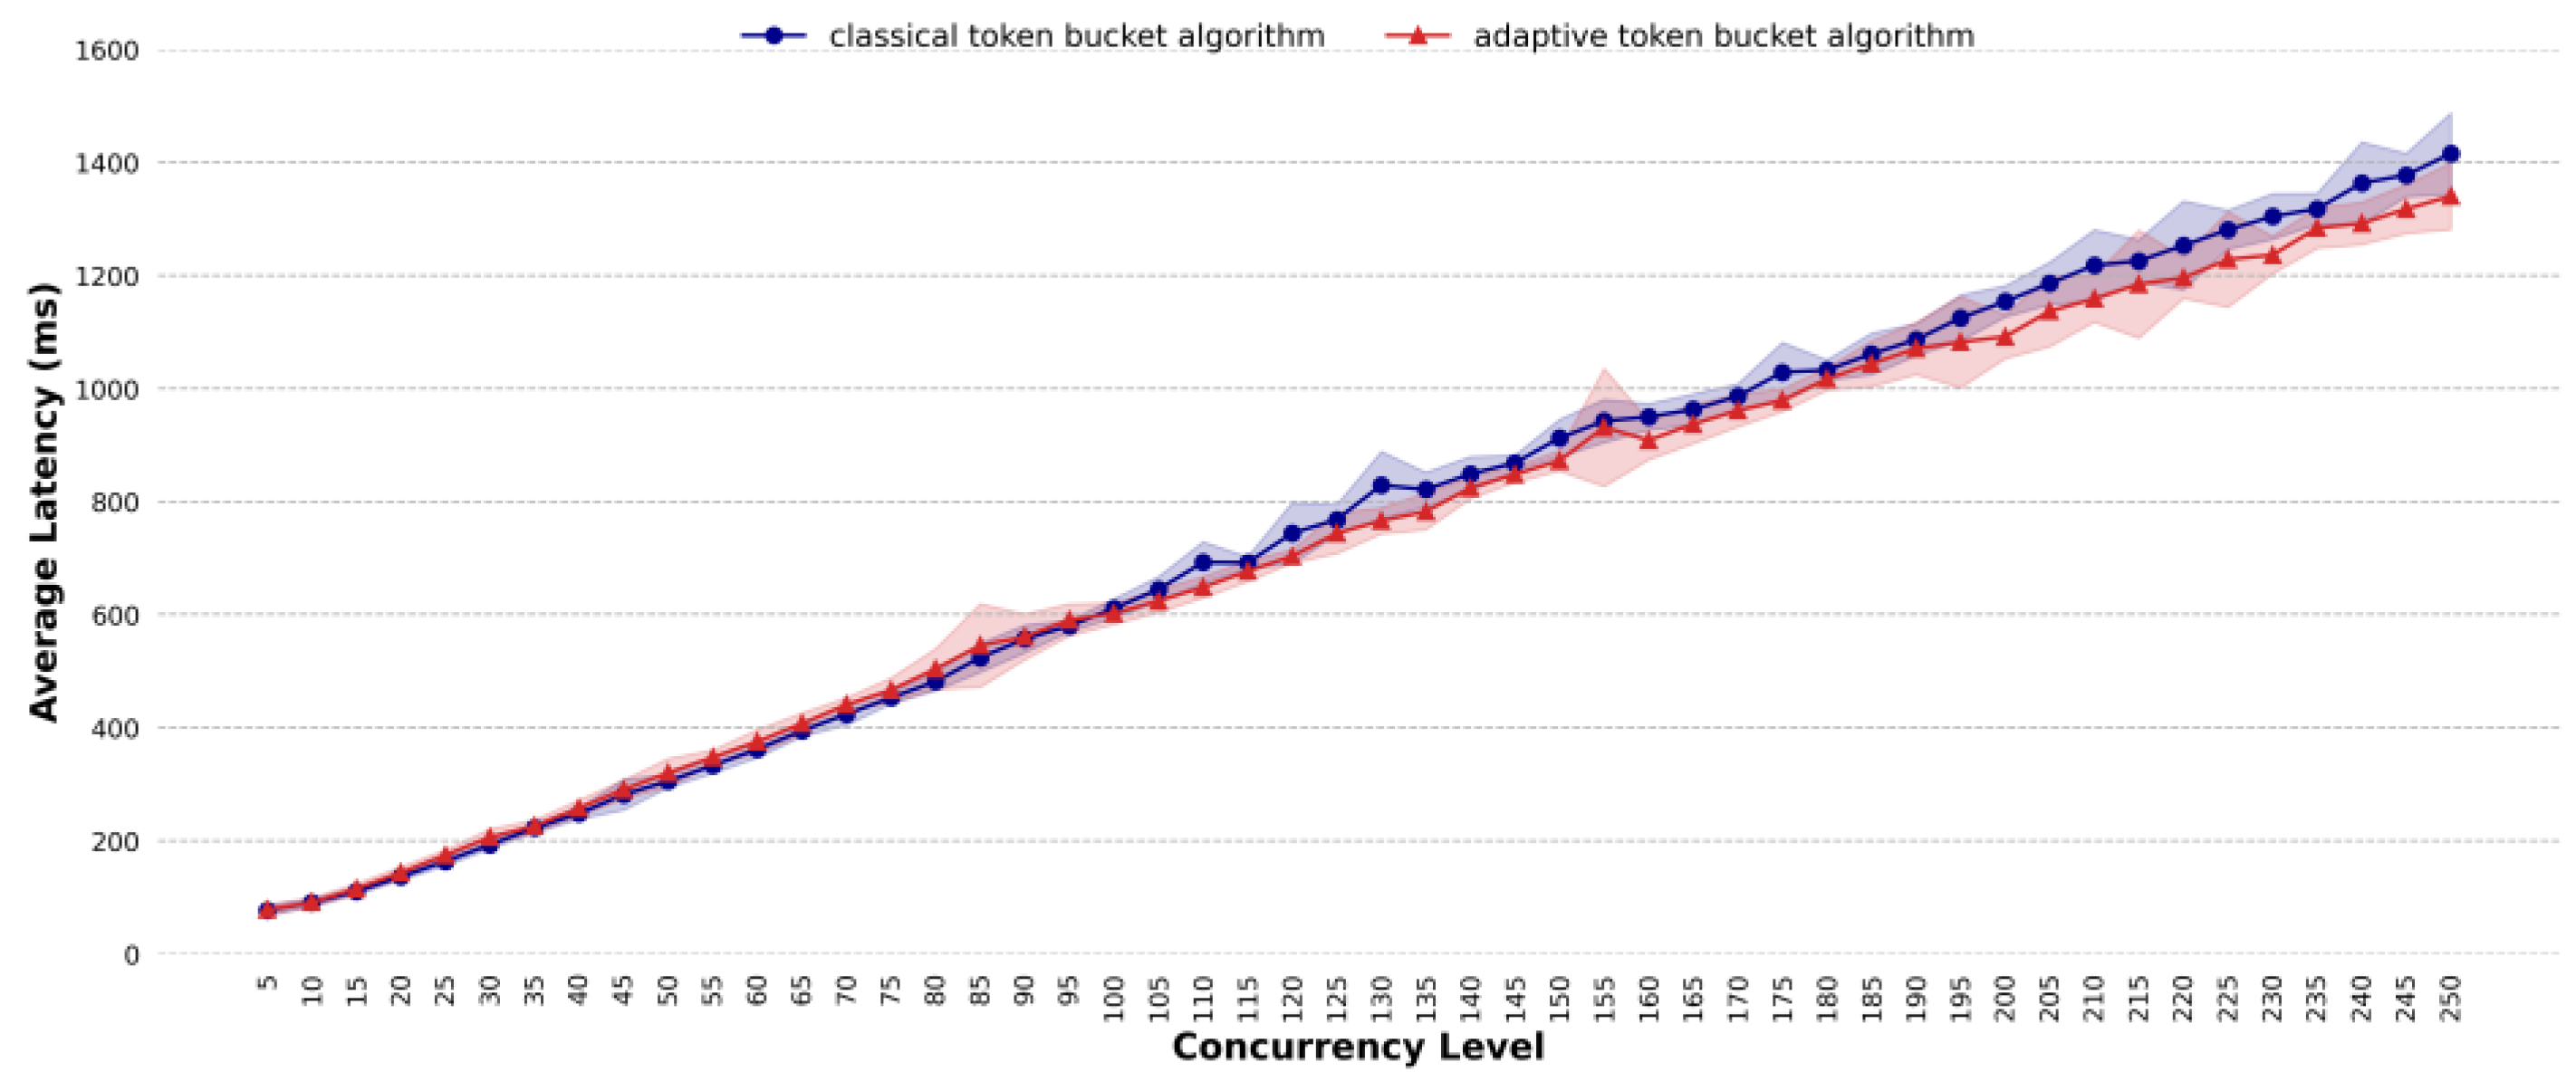
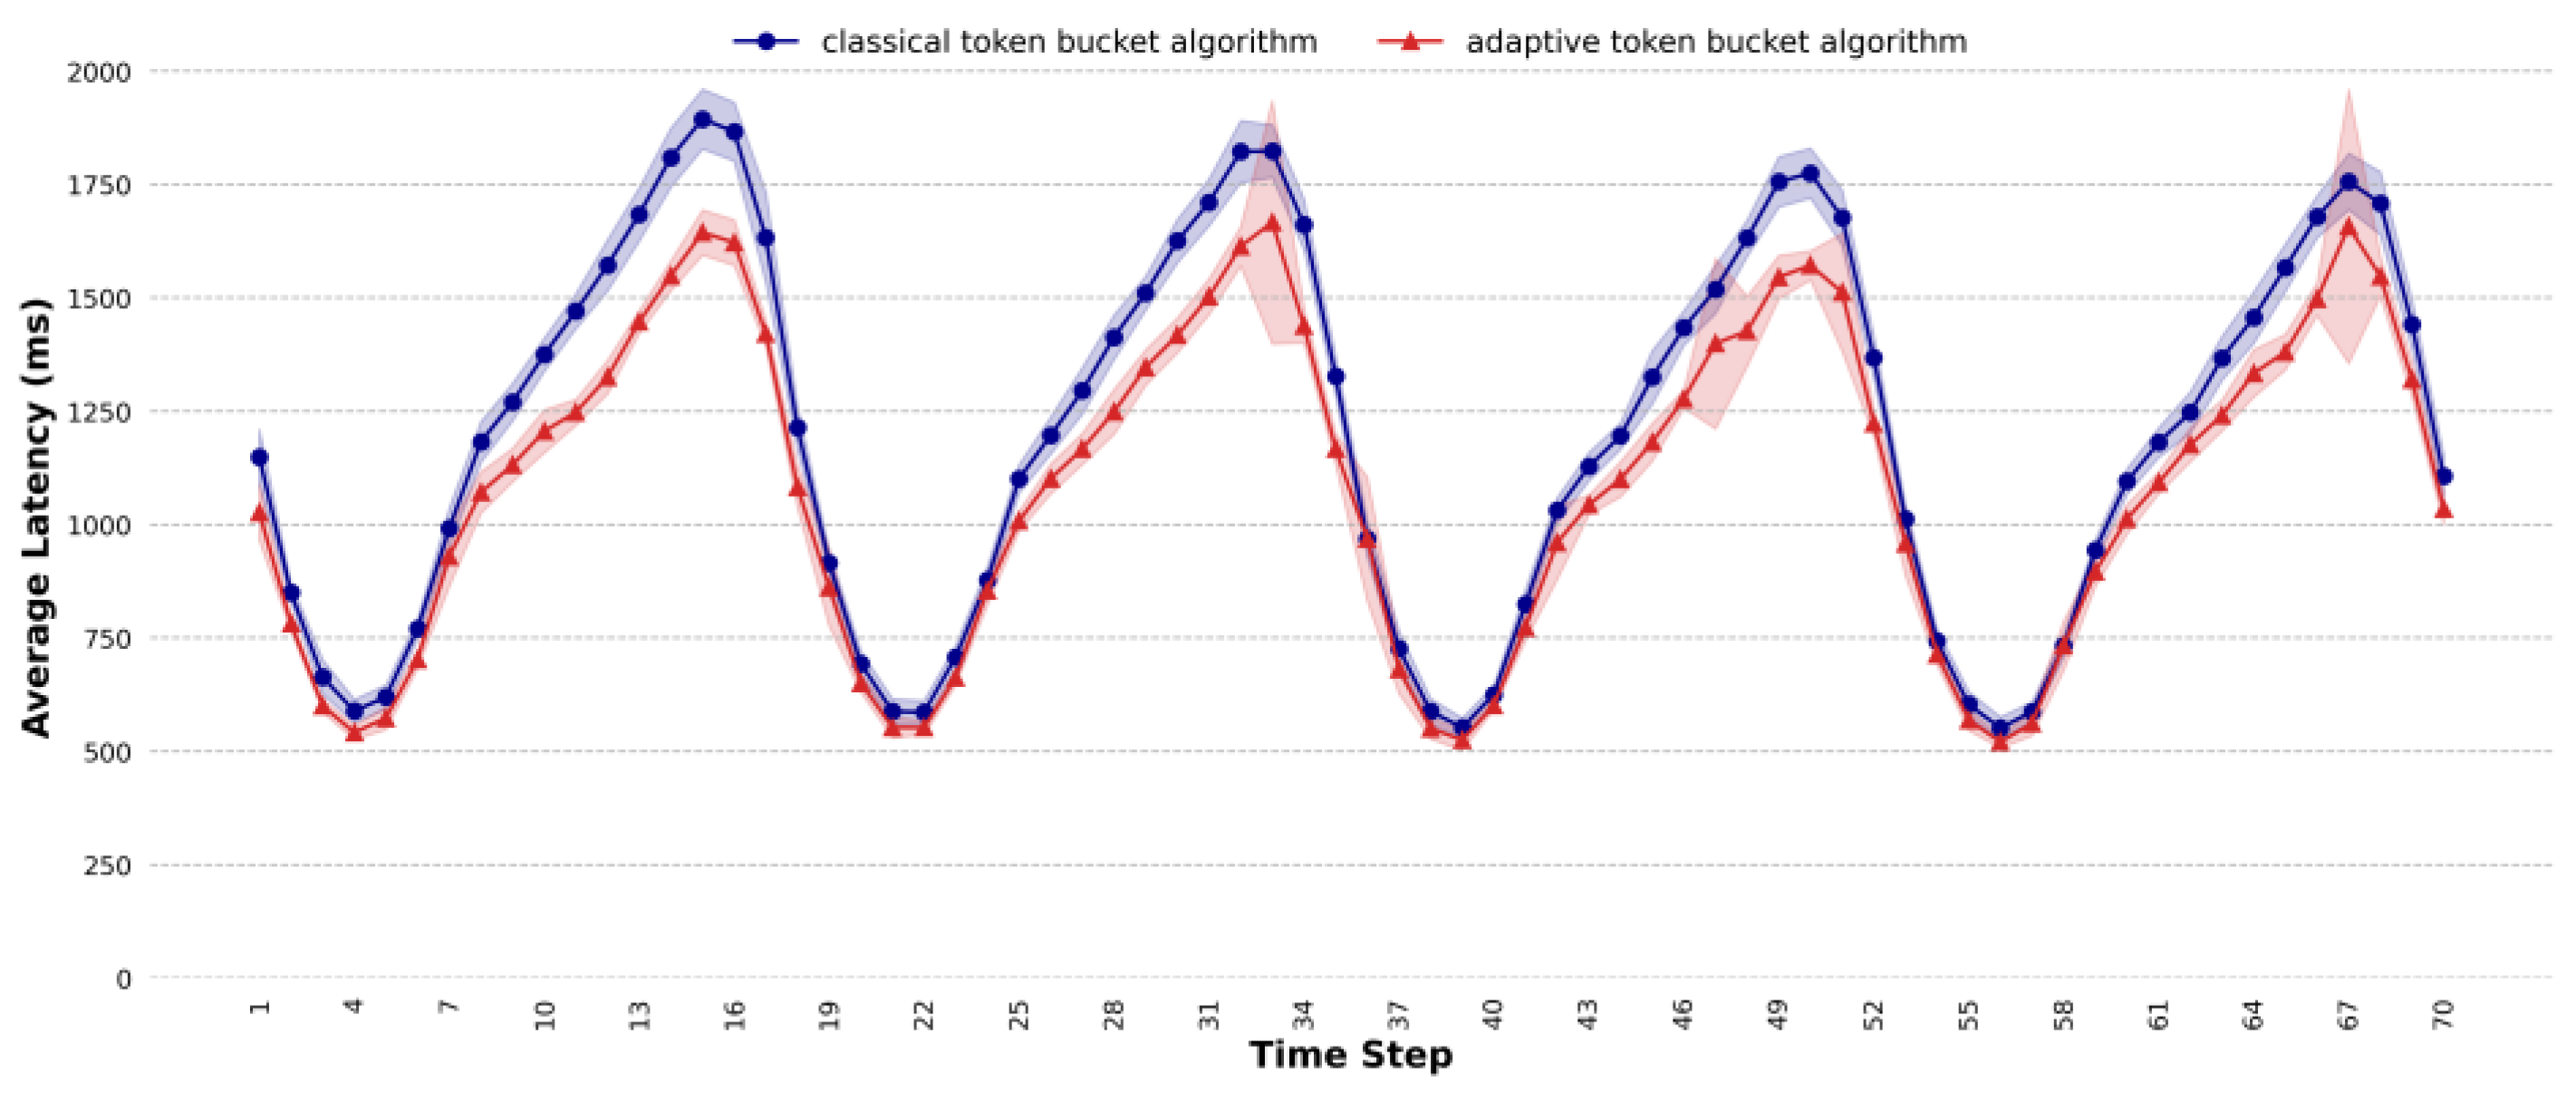
4.3. Comparative Analysis of Average Latency

A comparison of the average latency of the classic token bucket algorithm and the adaptive method is conducted under the simple task scenarios, where the rate of the classic token bucket algorithm is set to the optimal fill rate mentioned above, i.e., 200 tokens/s. From Figure 7, the following can be observed: (1) as the task concurrency increases, the average latency of both methods increases approximately linearly, which aligns with the principle that larger task volumes lead to longer processing times; (2) in most experimental groups, especially under high-concurrency conditions, the proposed method exhibits a lower average latency compared to the classic token bucket algorithm operating at its optimal rate; (3) the discrepancy in average latency between the classic token bucket algorithm and the proposed method becomes more pronounced as task concurrency increases. At the concurrency level of 185, the gap is the largest and the average latency of the classic token bucket algorithm is 1.37 times that of the proposed method, indicating that the proposed method effectively reduces the average latency for simple tasks.
For the general task scenarios, the rate of the classic token bucket algorithm is set to the aforementioned optimal fill rate, i.e., 100 tokens/s. From Figure 8, the following can be observed: (1) as the task concurrency increases, the average latency of both methods increases approximately linearly; (2) in all experimental groups, the average latency of the proposed method is almost identical to that of the classic token bucket algorithm, indicating that the fixed optimal fill rate works well for handling tasks in this scenario. The performance of the proposed algorithm is only 1.7% lower than that of the classic algorithm operating at its optimal fixed rate, demonstrating a very close performance between the two methods. This indicates that the adaptive token bucket algorithm introduced in this paper maintains excellent performance when handling general tasks.
Under the complex task scenarios, the rate of the classic token bucket algorithm is set to the aforementioned optimal fill rate, i.e., 50 tokens/s. From Figure 9, the following can be observed: (1) As the task concurrency increases, the average latency of both methods no longer increases linearly. When the concurrency exceeds 120, the growth curve becomes jittery, indicating that adjusting the token bucket fill rate is more challenging in complex task scenarios. (2) When the concurrency is below 120, the average latency of the proposed method is almost identical to that of the classic token bucket algorithm with the optimal fill rate, suggesting that at this level of concurrency, the system load does not significantly affect the processing time. (3) When the concurrency exceeds 120, the average latency of the classic token bucket algorithm becomes higher than that of the proposed method, with the maximum difference reaching 1.05 times, indicating that the proposed method reduces the average processing latency for complex tasks.
A comparison of the average latency of the two methods is also conducted under the mixed task scenarios, and the rate of the classic token bucket algorithm is set to the fixed fill rate, i.e., 150 tokens/s (between the optimal rate for general scenarios and the optimal rate for simple scenarios). From Figure 10, the following can be observed: (1) as the task concurrency increases, the average latency of both methods increases with a slight fluctuation; (2) when the concurrency is below 100, the average latency of the proposed method remains more or less consistent with that of the classic token bucket algorithm; (3) as the task concurrency increases and exceeds 100, the average latency of the proposed method is consistently lower than that of the classic token bucket algorithm. At a concurrency level of 130, the difference is the largest, with the classic token bucket algorithm’s average latency being 1.08 times that of the proposed method, indicating that the proposed method effectively reduces the average latency for mixed tasks.
To further validate the robustness and adaptability of the proposed algorithm for the real scenarios, a daily traffic envelope model is used to simulate dynamic traffic conditions for the experimental evaluation, which is proposed in Section 4.3 (“System Load”) of Boryło et al.’s work [44]. Specifically, this paper adopted Equation (14) from their study to introduce realistic variability into the traffic generation process. This approach can assess the performance of both the classic token bucket algorithm and the proposed adaptive method under fluctuating traffic loads, simulating real-world usage patterns. The study calculated the average latency for each algorithm under varying levels of system load (low, medium, and high) each corresponding to different resource utilization. By applying the daily traffic envelope model with various speedup parameters, this study simulated different temporal scales of daily traffic patterns, ensuring that the evaluation encompasses both peak and off-peak periods.
From Figure 11, the results indicate that while the classic token bucket algorithm struggles with maintaining consistent performance during high variability scenarios, the adaptive task traffic-shaping algorithm demonstrates superior resilience and efficiency. Specifically, the proposed method reduces the average latency by approximately 9.56% compared to the classic token bucket algorithm, effectively lowering the average latency. These findings underscore the potential of the proposed method to enhance the QoS in GIS platforms, particularly under resource-constrained and high-concurrency environments.
To avoid the misleading effects that outliers or skewed distributions may have on the mean values, this study also adopts percentile-based metrics (e.g., the 90th percentile latency) as a latency indicator to investigate the comparison between the two methods under dynamic traffic conditions. From Figure 12, the proposed method reduces the latency by approximately 10.03% compared to that of the classic token bucket algorithm. The result is largely consistent with that of the average delay indicator, which fully demonstrates the effectiveness of the proposed method in reducing latency.

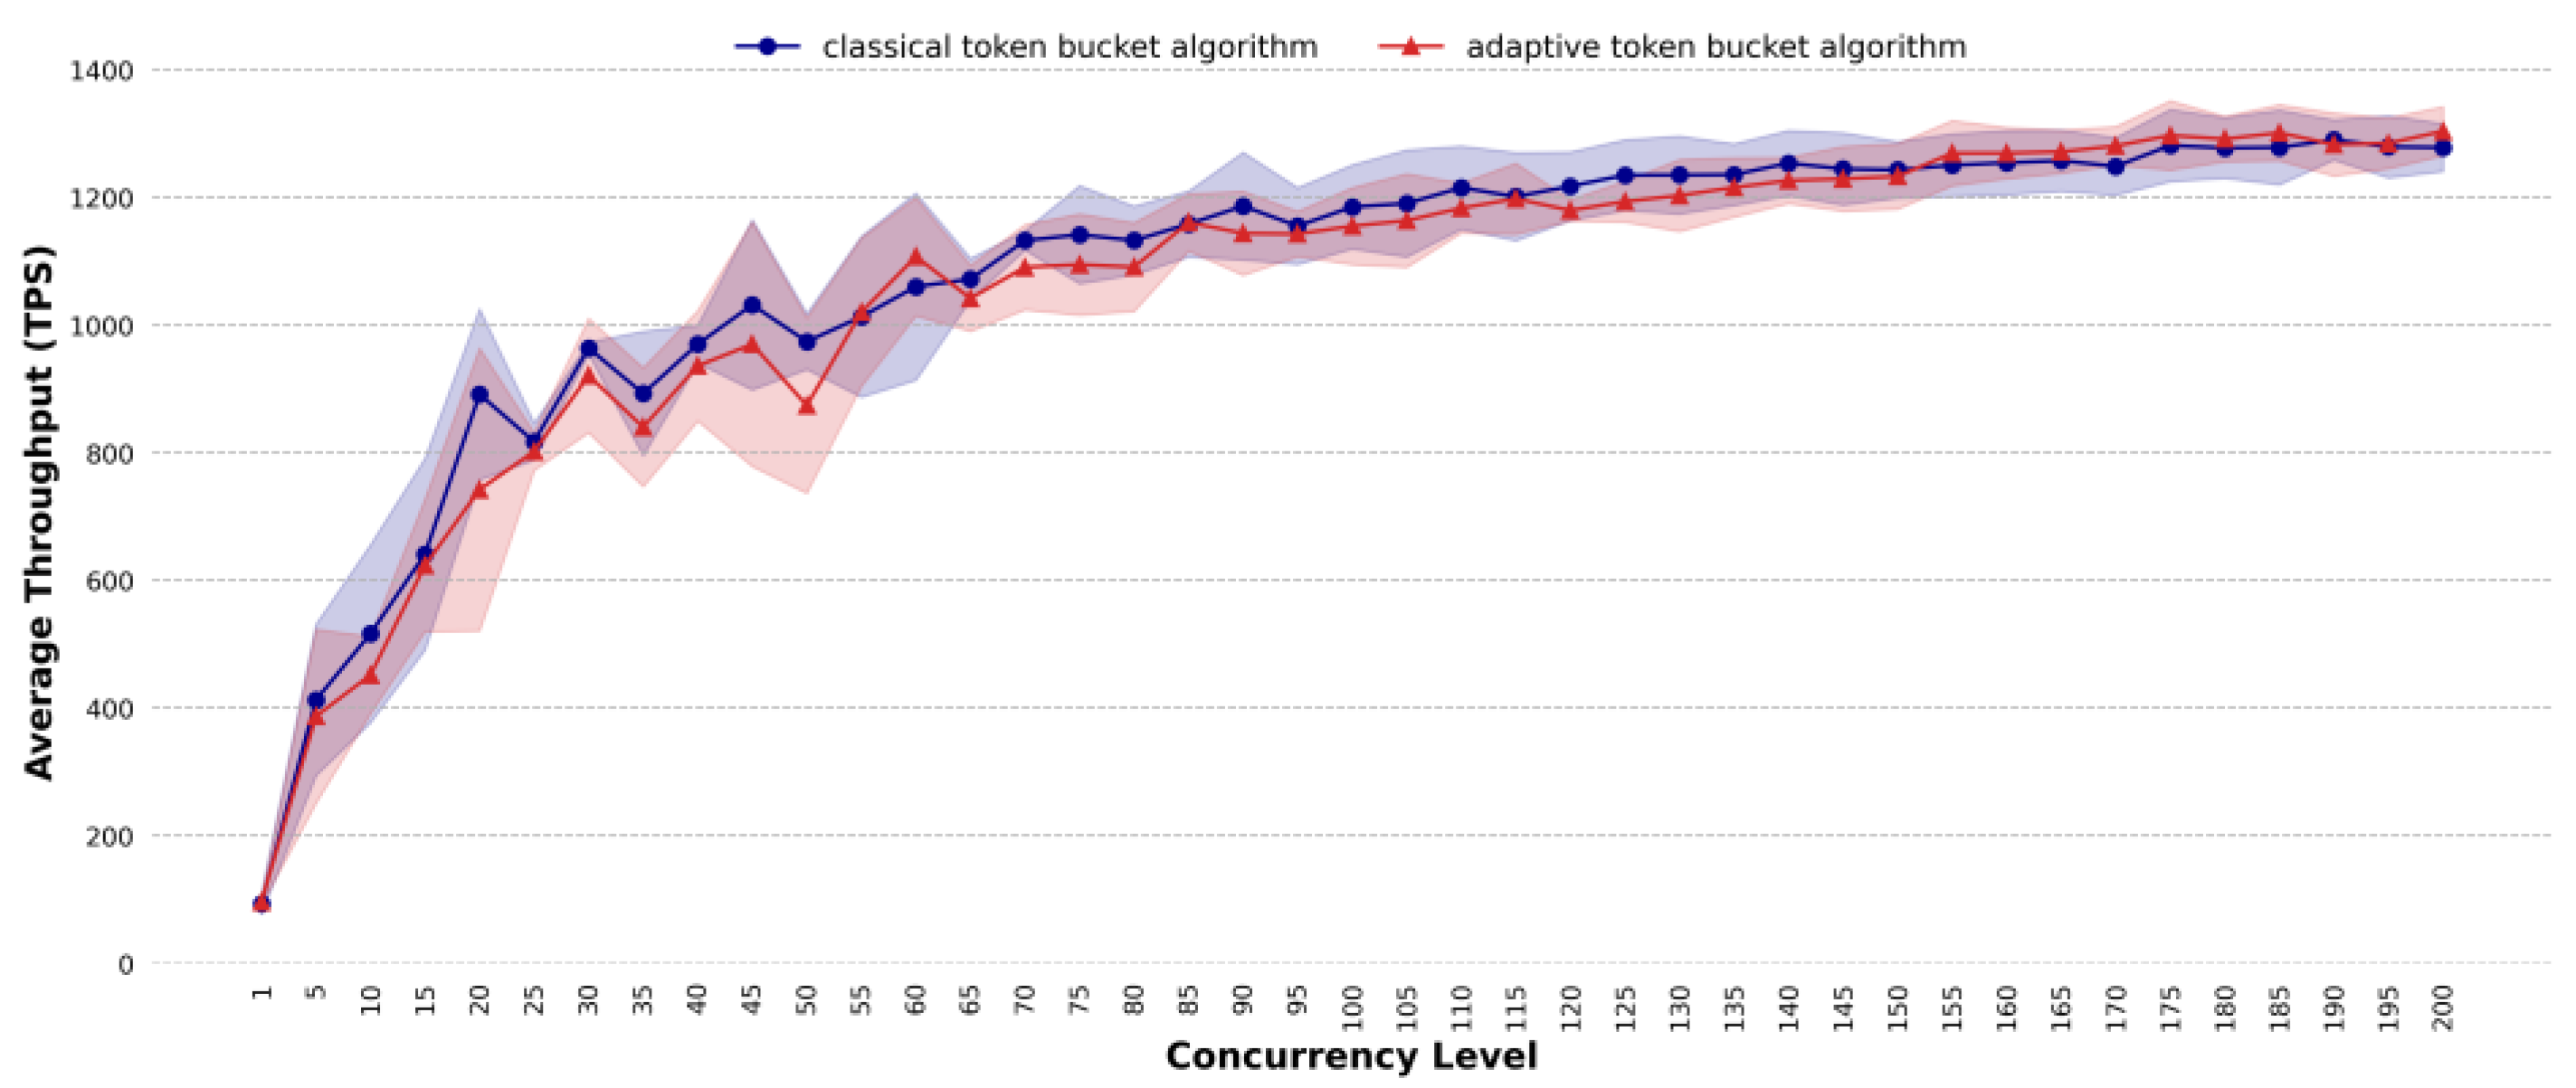
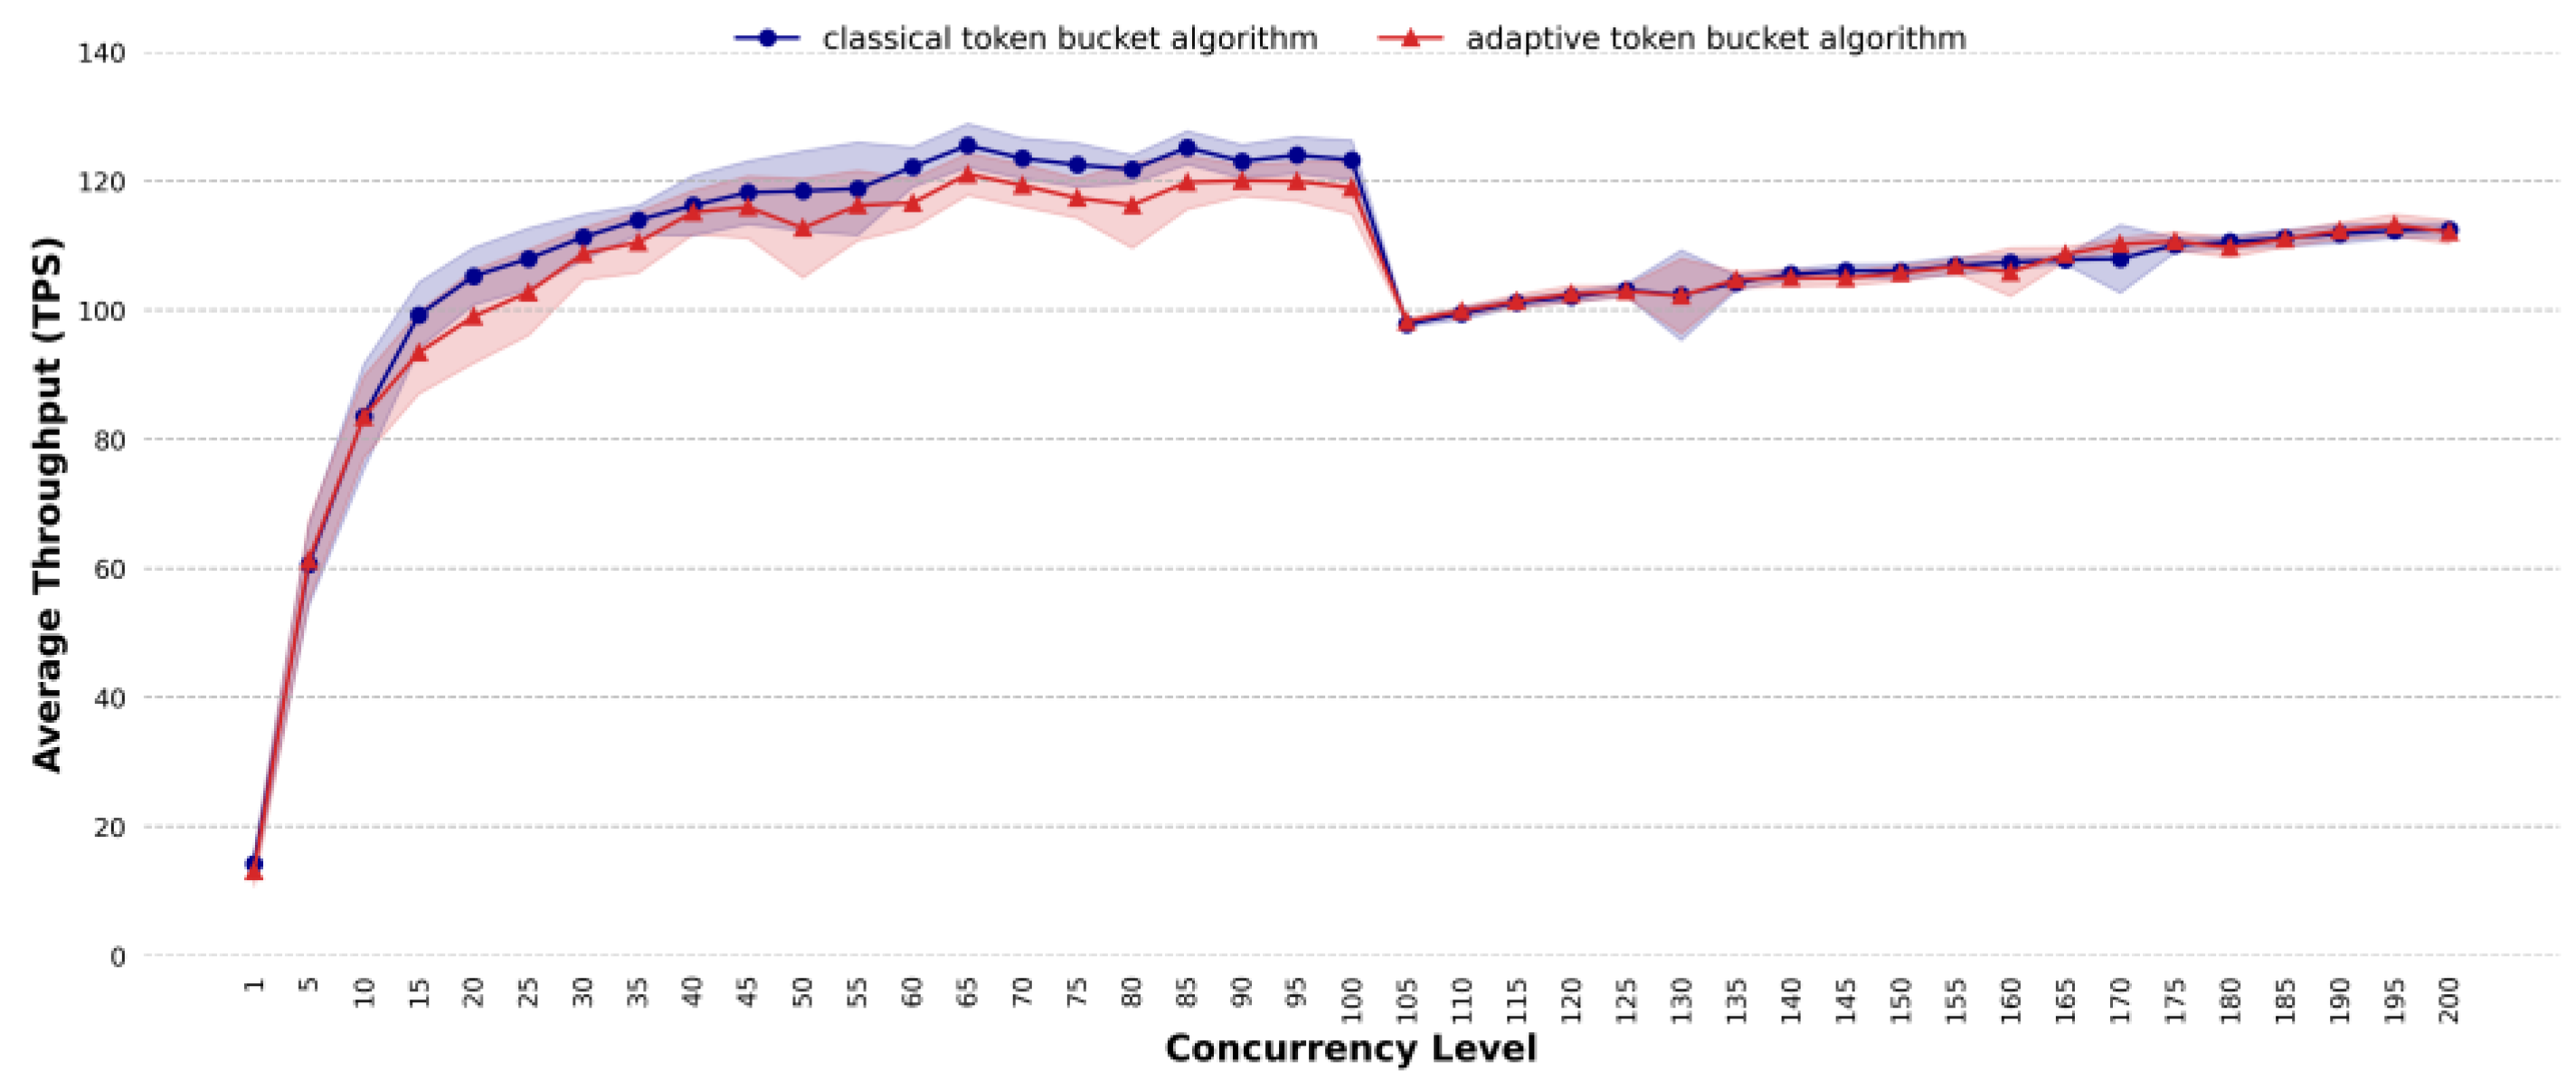
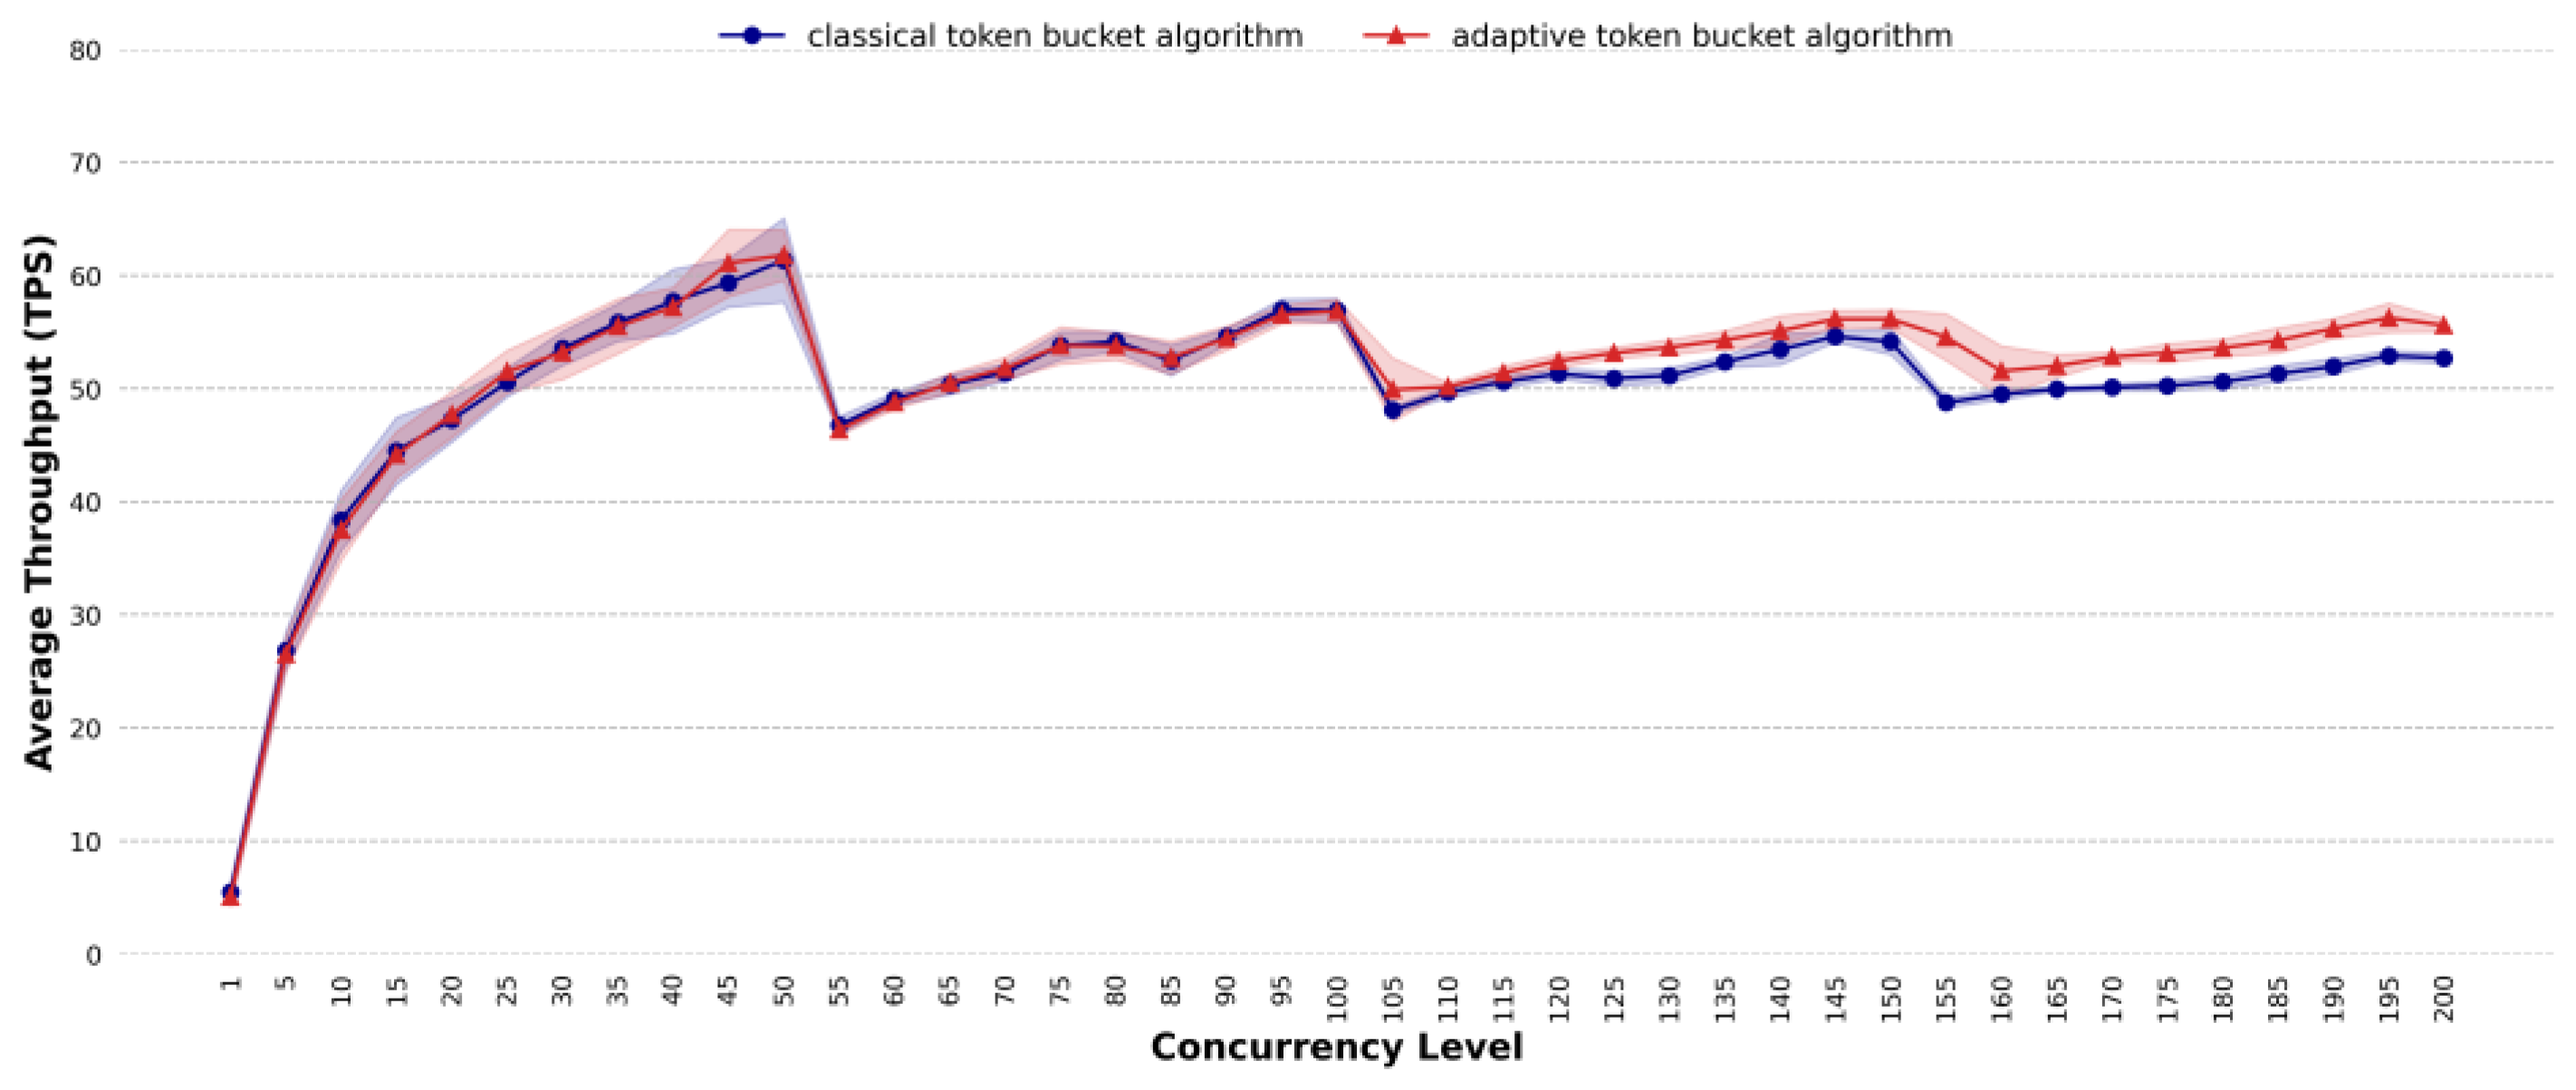
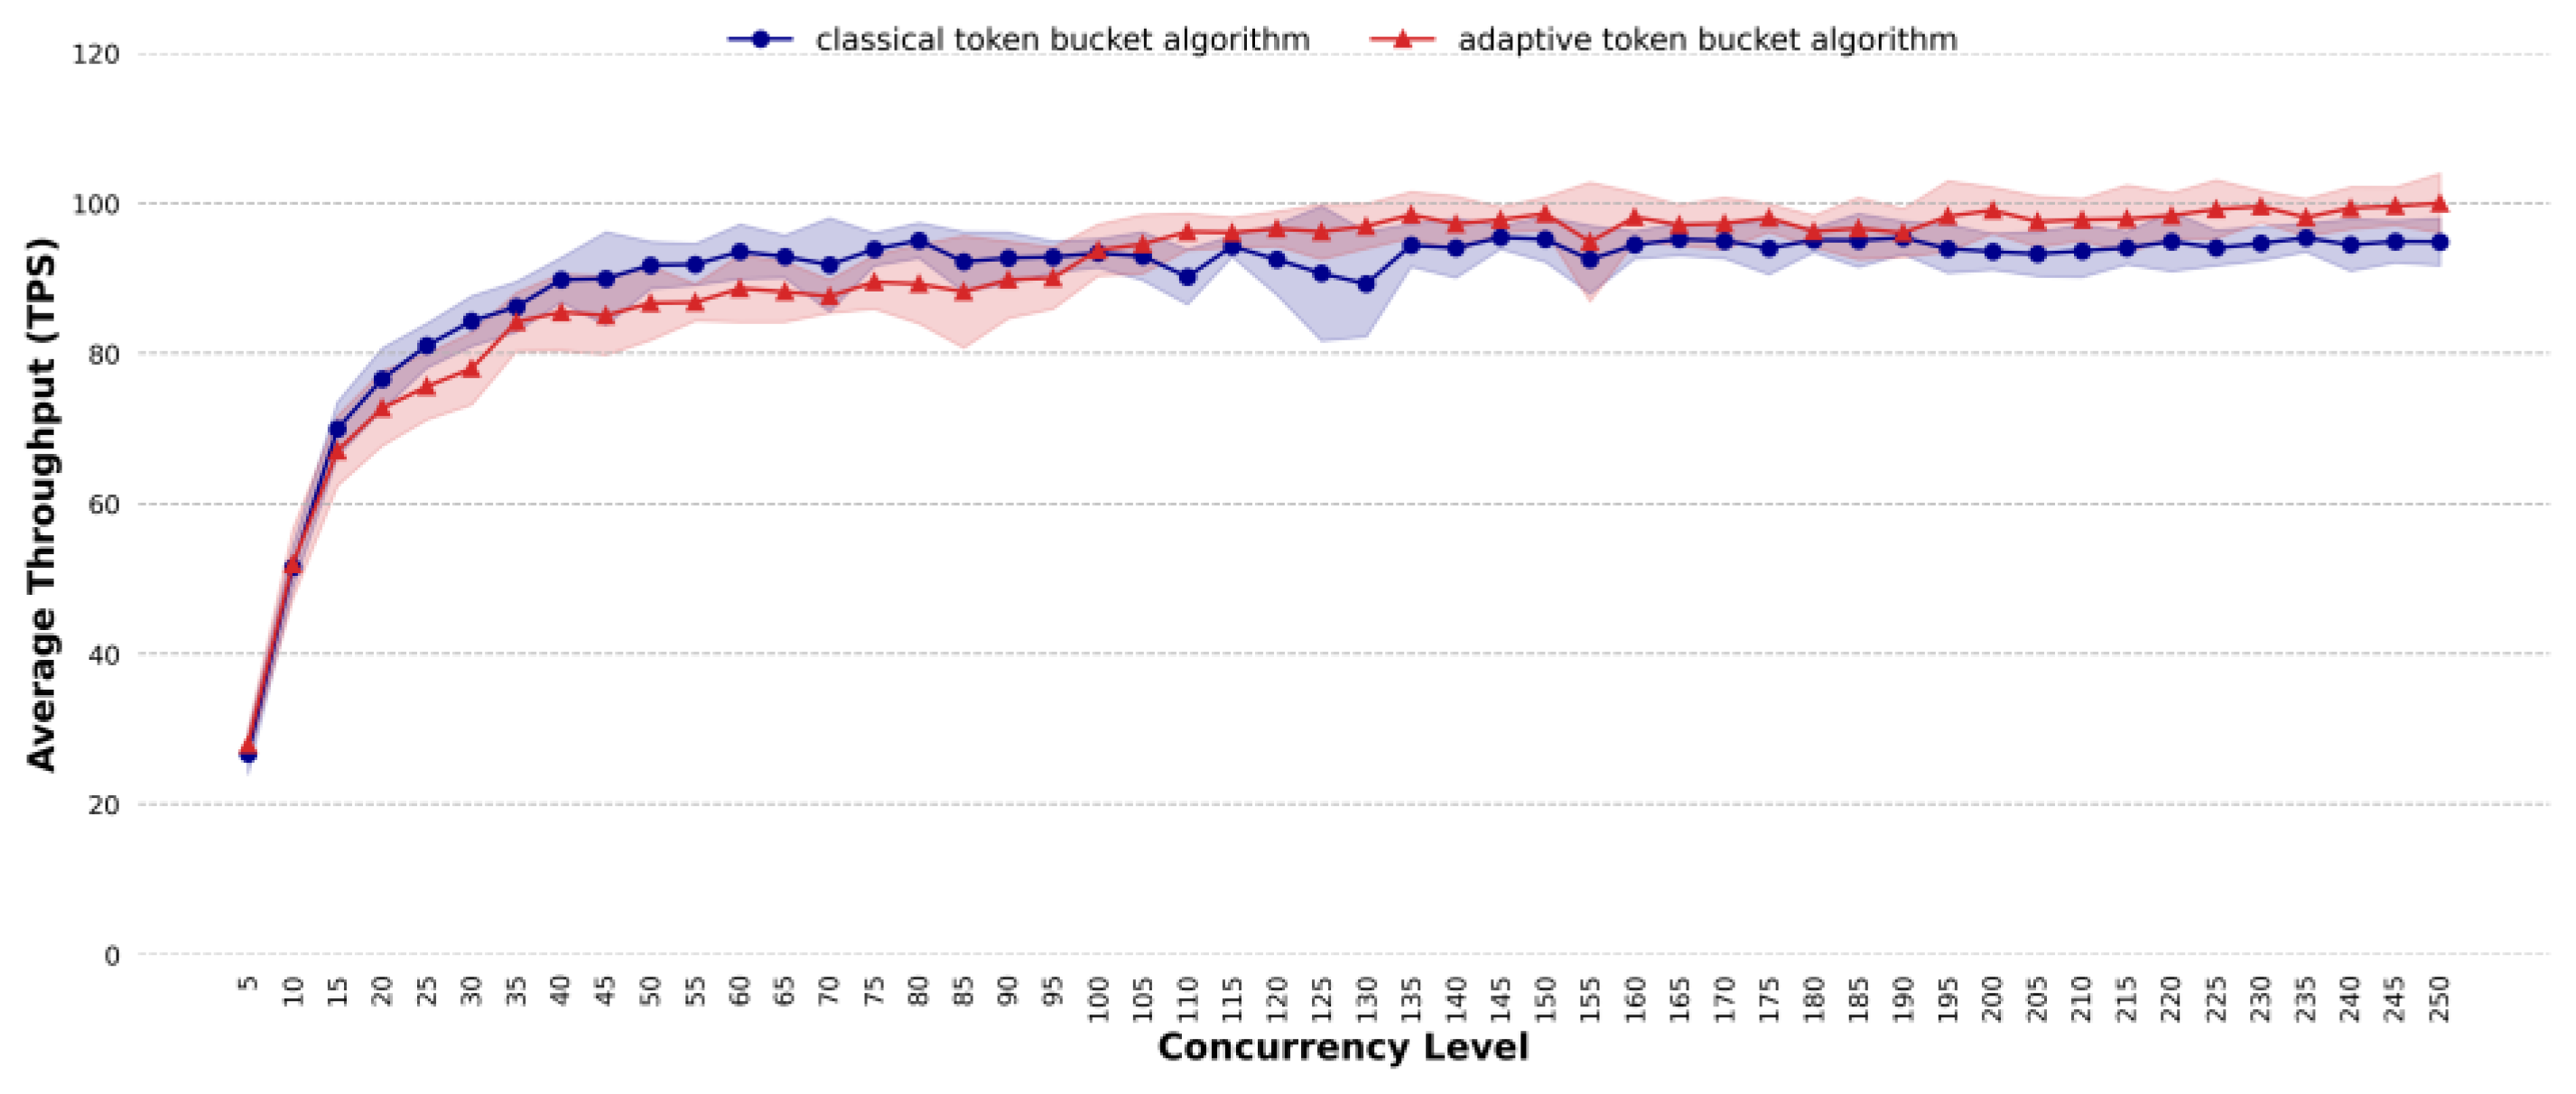
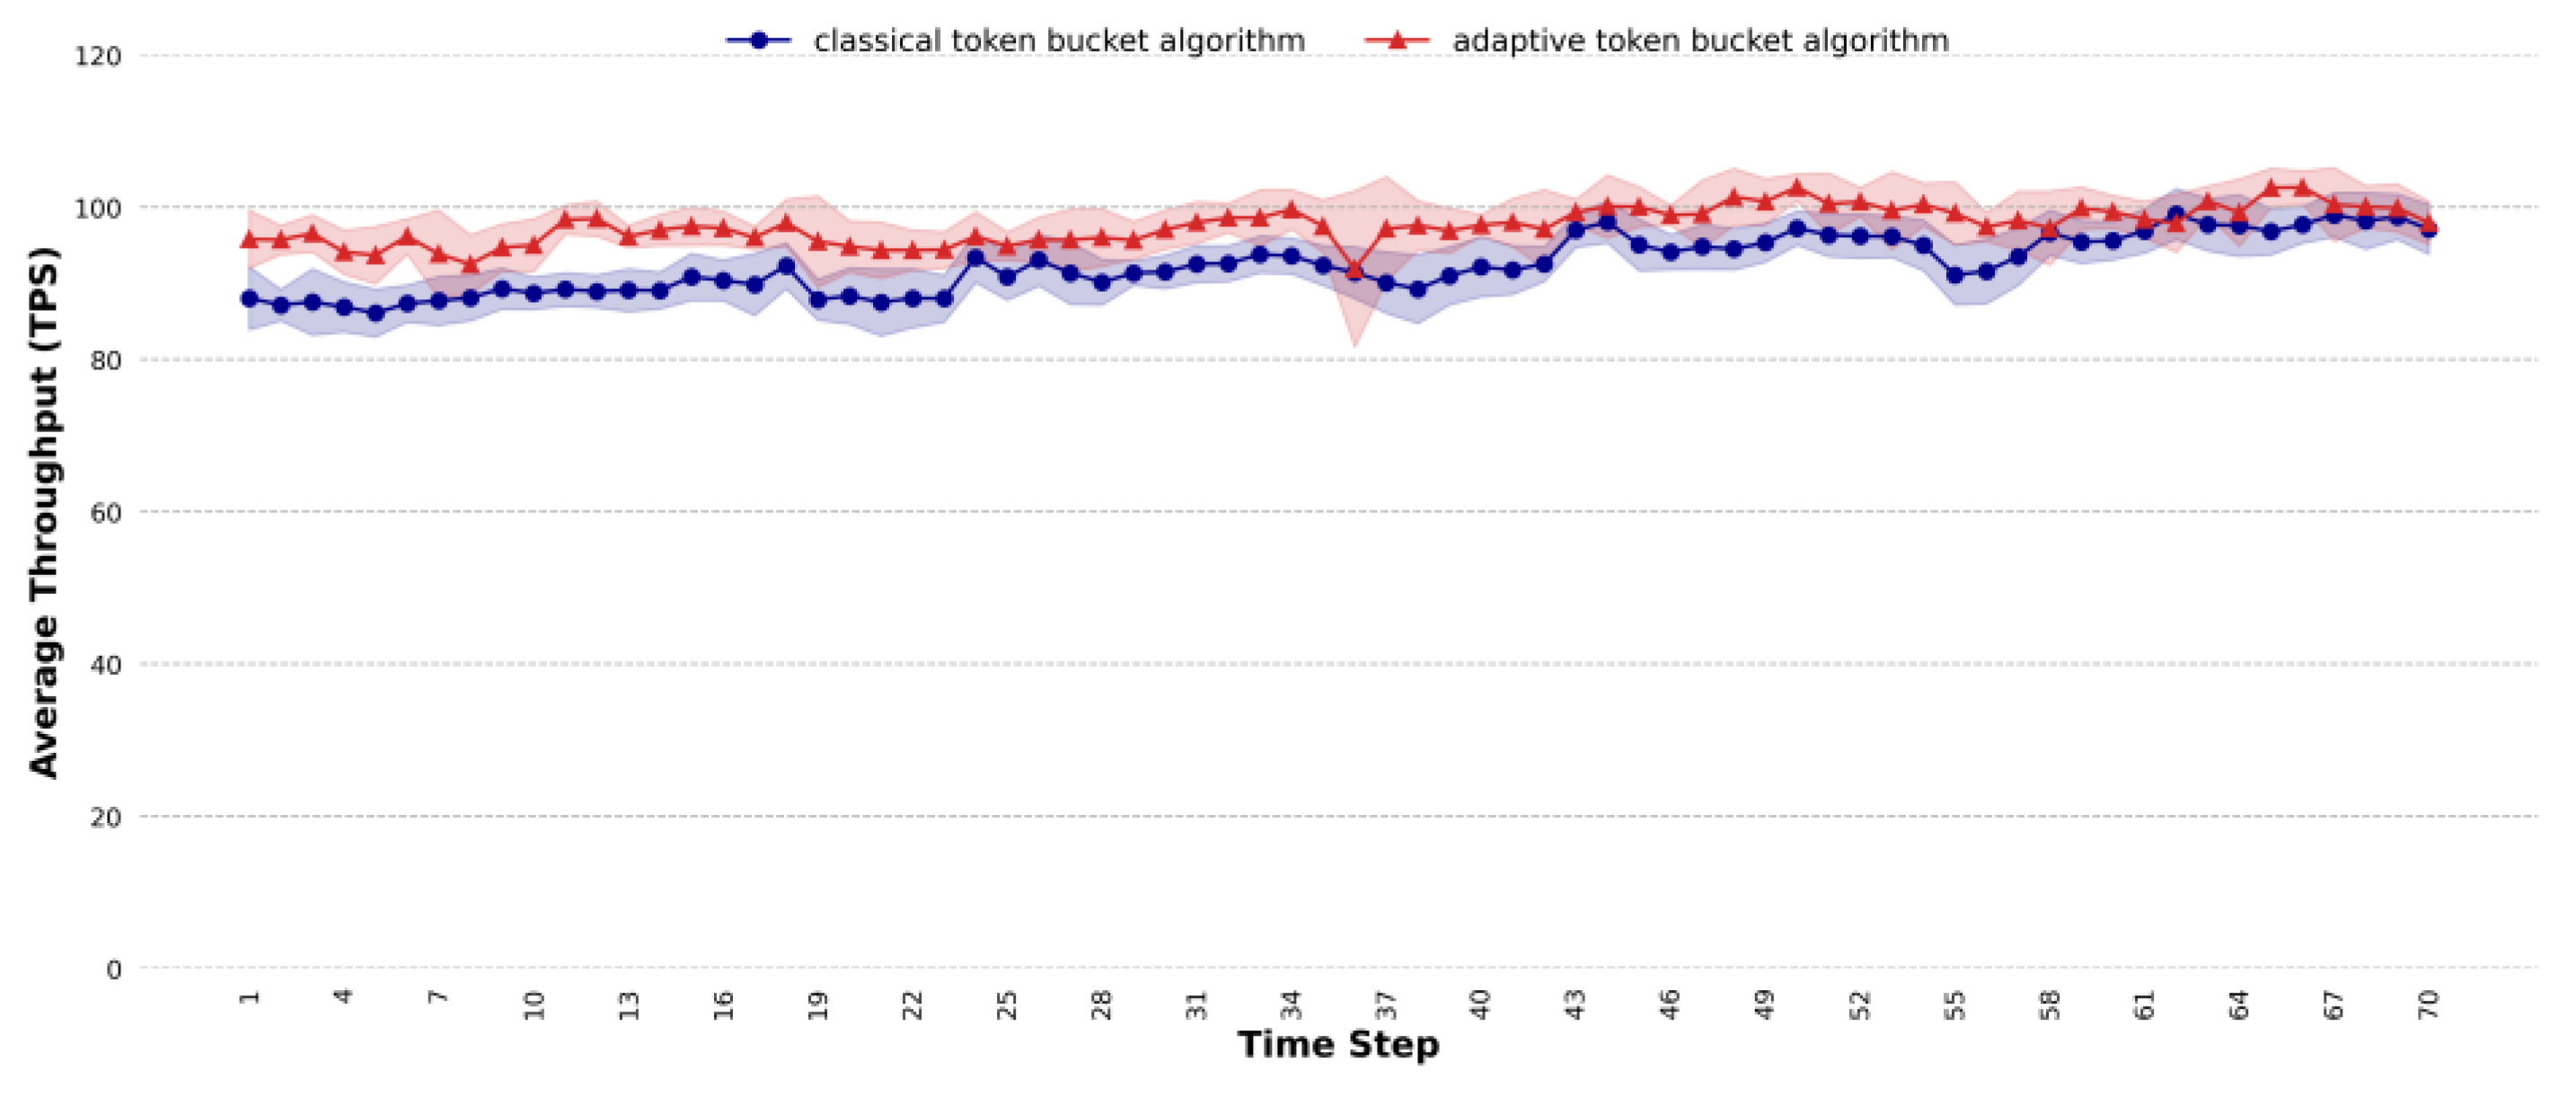
4.4. Comparative Analysis of Throughput

A comparison of throughput (Transactions Per Second, TPS) of the two methods is conducted under the simple task scenarios, where the rate of the classic token bucket algorithm is set to the aforementioned optimal fill rate, i.e., 200 tokens/s. From Figure 13, the following observations can be made: (1) when the concurrency is less than 150, the performance of the proposed method is close to that of the classic token bucket algorithm with the optimal fill rate; (2) when the concurrency exceeds 150, the average throughput of the proposed method is higher than that of the classic token bucket algorithm, and at a concurrency level of 170, the proposed algorithm’s average throughput is 32 TPS higher than that of the classic token bucket algorithm. The proposed method can automatically increase the token fill rate to improve the throughput of the system according to the system load.
Under the general task scenarios, the rate of the classic token bucket algorithm is set to the aforementioned optimal fill rate, i.e., 100 tokens/s. From Figure 14, the result shows the following: (1) The average throughput of the proposed method is almost identical to that of the classic token bucket algorithm with the optimal fill rate, indicating that the proposed method works well in the general task scenario. When the concurrency is less than 105, the average throughput of the proposed method closely matches that of the classic token bucket algorithm. (2) When the concurrency exceeds 105, compared to the optimal fill rate, the proposed method can automatically adjust the token fill rate and even surpass the classic token bucket algorithm. Specifically, at a concurrency level of 170, the average throughput of the adaptive token bucket algorithm is 1.02 times that of the classical token bucket algorithm with the optimal fill rate.
For the complex task scenarios, the rate of the classic token bucket algorithm is set to the aforementioned optimal token fill rate, i.e., 50 tokens/s. From Figure 15, the following observations can be made: (1) as the task concurrency increases, the average throughput of both methods exhibits a fluctuating trend; (2) when the concurrency is less than 100, the performance of the proposed method remains consistent with that of the classic token bucket algorithm at its optimal fill rate. When the concurrency level exceeds 100, the average throughput of the proposed method is higher than that of the classic token bucket algorithm. At a concurrency level of 155, the adaptive token bucket algorithm shows an average throughput that is 6 TPS higher than that of the classic token bucket algorithm. This indicates that, in complex task scenarios, the proposed method can automatically adjust the token fill rate, and its processing efficiency even surpasses that of the classic token bucket algorithm with the optimal rate.
A comparison of the average throughput of the two methods is also conducted under the mixed task scenarios, where the rate of the classic token bucket algorithm is set to 150 tokens/s. From Figure 16, the following observations can be made: (1) as the task concurrency increases, the average throughput of both methods exhibits a fluctuating trend, but after the concurrency exceeds 40, the values become progressively stable; (2) when the concurrency is less than 100, the performance of the proposed method is close to that of the classic token bucket algorithm. When the concurrency exceeds 100, the average throughput of the proposed method is consistently higher than that of the classic token bucket algorithm. At a concurrency level of 130, the adaptive token bucket algorithm shows an average throughput that is 8 TPS higher than that of the classic token bucket algorithm. This indicates that, in mixed task scenarios, the proposed method can automatically adjust the token fill rate, and its processing efficiency outperforms the classic token bucket algorithm under high-concurrency conditions.
Having validated the performance of the proposed adaptive task traffic-shaping algorithm in terms of average latency under different system load levels, this study next explored its performance in terms of throughput using the same methodology. From Figure 17, the following observations can be made: (1) as the time steps increase, both the classic token bucket algorithm and the proposed adaptive token bucket algorithm exhibit a fluctuating trend in average throughput, but the values remain stable; (2) in the vast majority of experiments, the average throughput of the proposed adaptive token bucket algorithm is 5.57% higher than that of the classic token bucket algorithm. This indicates that the proposed algorithm performs exceptionally well under dynamic traffic conditions.

5. Discussion

5.1. Advantages of Adaptive Task Traffic-Shaping Algorithm

GIS services often handle large volumes of spatial data, including vector, raster, and topographic datasets, which are inherently complex and computationally intensive. Tasks such as buffer analysis, overlay analysis, and path-finding involve sophisticated spatial computations and visualizations, while proximity analysis and spatial interpolation require efficient spatial indexing and query mechanisms. Additionally, many GIS applications (such as navigation and real-time monitoring) demand stringent response times, necessitating rapid data processing and result delivery. However, single-server architectures for high-concurrency GIS tasks exhibit critical limitations:
  • Hardware Resource Constraints: Single-server computational capabilities are restricted by the hardware specifications of a single machine (e.g., CPU, memory, storage), leading to performance bottlenecks under high concurrency.
  • Task Queueing and Resource Contention: Under high concurrency, single servers process requests sequentially, causing task queueing. Simultaneously, multiple concurrent tasks compete for limited resources (e.g., CPU cycles, memory bandwidth, disk I/O), significantly increasing response times and failing to meet real-time requirements.
  • Inefficient Resource Utilization: Single-server systems may experience resource under-utilization due to static resource allocation strategies, even during periods of high task demand. This results from the inability to dynamically adjust resource distribution based on real-time workloads, wasting available computational capacity.
The classical token bucket algorithm, despite its simplicity, relies on static parameters that fail to adapt to the dynamic complexity of GIS tasks, leading to suboptimal performance under high concurrency. By contrast, our proposed method addresses this limitation through three key innovations: multi-dimensional load assessment, queueing theory-driven dynamic rate adjustment, and HMM-based predictive traffic shaping.
The increasing demand for real-time spatio-temporal data services in single-server GIS platforms underscores the critical need for adaptive traffic-shaping mechanisms to address resource limitations and workload heterogeneity. Traditional token bucket algorithms, while effective for homogeneous network traffic, struggle to dynamically adjust to GIS tasks’ varying complexity (e.g., simple queries vs. computationally intensive downloads) and resource demands, leading to suboptimal performance under high concurrency. This study bridges this gap by introducing an adaptive framework that integrates multi-dimensional load assessment, queueing theory-driven rate optimization, and HMM-based predictive control, specifically tailored to single-server GIS environments.
In contrast to multi-server load balancing approaches, which rely on hardware scaling, our method optimizes resource utilization within constrained single-server settings. By monitoring CPU, memory, and resource link utilization with adaptive weights, we capture the holistic system state, avoiding the single-metric bias inherent in classical algorithms. The M/M/1 queueing model dynamically computes the expected task arrival rate (λ) based on real-time load, enabling proactive token fill rate adjustments that align with system capacity. This addresses the classical algorithm’s static parameter limitation, as demonstrated by the 9.56% latency reduction and 5.57% throughput improvement in dynamic traffic scenarios.
The HMM-based predictive component further distinguishes our approach by modeling load-state transitions, allowing adaptive rate adjustments to anticipated workloads. This innovation is particularly critical for complex GIS tasks, where the fixed rates fail to mitigate latency fluctuations in mixed task scenarios and dynamic traffic scenarios. Our method outperforms the classical algorithm, which is up to 1.08 times that of our method in mixed task scenarios, showcasing its robustness against bursty or resource-heavy tasks.
These advancements align with the growing emphasis on QoS in resource-constrained GIS systems, offering a self-tuning solution that eliminates manual parameterization and enhances stability under diverse workloads. Future research may explore integrating edge computing resources or hierarchical task prioritization to further extend the framework’s applicability in distributed GIS environments.

5.2. Application Prospects

In the contemporary landscape of increasingly diverse and complex application scenarios for GIS, ranging from real-time monitoring and the regulation of traffic flow in smart city construction to the efficient analysis of massive geographic datasets in natural resource management, GIS service platforms are encountering escalating pressure from concurrent requests. The adaptive task traffic-shaping method proposed in this paper undoubtedly offers a promising solution to address the performance bottleneck issue faced by GIS service platforms in high-concurrency scenarios, thereby providing robust and reliable geographic information support for the development of various industries.
In the realm of smart city traffic management, the adaptive task flow-shaping method can dynamically adjust the data processing rate based on real-time traffic data. For instance, during morning and evening rush hours when system load is high, it can automatically increase the token fill rate, accelerate road condition analysis, optimize signal light timing, alleviate congestion, and enhance the overall efficiency of urban traffic operations. This dynamic adaptive flow-shaping capability is anticipated to become increasingly crucial in urban development and may eventually serve as a standard feature in smart city traffic management systems.
In the context of natural resource management, large volumes of geospatial data are generated during land resource surveys and forest resource monitoring, with data processing tasks often being sudden and intricate. The adaptive task traffic-shaping method can continuously monitor server load and flexibly adjust the task processing rate according to resource load evaluation results. When conducting remote sensing detection tasks such as pest and disease outbreaks, it can automatically expedite processing, thereby enhancing the scientific accuracy and timeliness of decision-making in natural resource management.
In the domain of emergency response, particularly during natural disasters such as earthquakes and floods, the GIS service platform may instantaneously receive a substantial number of geographical information requests from rescue sites and disaster area monitoring equipment. The adaptive task flow-shaping method can promptly detect changes in system load, swiftly adjust the task processing sequence, prioritize critical rescue information, and thereby improve rescue efficiency.

5.3. Limitation

  • The proposed method only considers three indicators, namely, CPU usage, memory occupancy, and the ratio of the number of links to the used resources; in the actual running environment, the calculation of system load is more complicated and it also needs to take into account the use of disks, the number of current processes, and so on. The next step of the research needs to detect a more reasonable calculation method for the system load.
  • In this paper, when calculating single-server highly concurrent task requests, only the token fill rate is adjusted adaptively, but the capacity setting of the token bucket is not discussed. The impact of token bucket capacity on task processing efficiency needs to be discussed systematically in the future.
  • Currently, the method in this paper is designed for non-priority task requests, and for multiple mixed task requests, the method in this paper needs to be further improved according to the priority of the task or QoS.

6. Conclusions

The adaptive token bucket algorithm proposed in this paper optimizes system performance under varying task types and concurrency levels by dynamically adjusting the token fill rate. Compared to the classic token bucket algorithm, the proposed method effectively reduces the average processing delay in different task scenarios, while improving the system’s throughput under high-concurrency conditions. Notably, the proposed method demonstrates superior processing capability when the concurrency is high, further validating the effectiveness and advantages of the adaptive adjustment mechanism. Overall, the proposed method has good adaptability in improving system throughput and reducing latency, providing a more flexible and efficient solution for traffic shaping and system load optimization. The following conclusions are drawn:
  • Existing methods use a fixed token fill rate for traffic shaping, but the optimal rate is difficult to determine. The proposed method adapts the token fill rate based on system load. In terms of average latency, for different task scenarios, under highly concurrent conditions, the average latency of the proposed method is almost lower than that of the classic token bucket algorithm with the optimal rate; the proposed method can effectively reduce the average latency. For simple task scenarios, when the concurrency is 185, the average latency of the classic token bucket algorithm is 1.37 times that of the proposed method. For general task scenarios, when the concurrency exceeds 150, the average latency of the proposed method is roughly the same as that of the classic token bucket algorithm. For complex task scenarios, when the concurrency exceeds 120, the average latency of the classic token bucket algorithm is higher than that of the proposed method, with a maximum difference of 1.05 times. For mixed task scenarios, at a concurrency level of 130, the classic token bucket algorithm’s average latency is 1.08 times that of the proposed method. For dynamic traffic scenarios, the proposed method reduces the average latency by approximately 9.56%.
  • In terms of average throughput, the proposed method can improve the processing efficiency under highly concurrent and dynamic traffic conditions, especially in complex task scenarios, mixed task scenarios and dynamic traffic scenarios. For complex task scenarios, when the concurrency reaches 155, the average throughput of the proposed method exceeds that of the classic token bucket algorithm, with the maximum improvement reaching 6 TPS. For mixed task scenarios, at a concurrency level of 130, the proposed method shows an average throughput that is 8 TPS higher than that of the classic token bucket algorithm. For dynamic traffic scenarios, the average throughput of the proposed method is 5.57% higher than that of the classic token bucket algorithm.

Author Contributions

Conceptualization, Z.W. (Zheng Wu) and P.W.; methodology, Z.W. (Zheng Wu) and H.Z.; software, Z.W. (Zezhao Wang); validation, Z.W. (Zheng Wu), H.Z. and Z.W. (Zezhao Wang); formal analysis, H.Z. and P.W.; investigation, Z.W. (Zezhao Wang); resources, P.W. and Z.M.; data curation, Z.W. (Zezhao Wang); writing—original draft preparation, Z.W. (Zheng Wu); writing—review and editing, Z.W. (Zheng Wu) and H.Z.; visualization, Z.W. (Zezhao Wang) and P.W.; supervision, Z.W. (Zezhao Wang); project administration, Z.M.; funding acquisition, Z.M. All authors have read and agreed to the published version of the manuscript.

Funding

This research was funded by the National Key Research and Development Program of China, grant number 2024YFB2505800, and the Fundamental Research Funds for Central Public Welfare Research Institutes, grant number AR2504.

Institutional Review Board Statement

Not applicable.

Informed Consent Statement

Not applicable.

Data Availability Statement

The data presented in this study are available on request from the corresponding author.

Conflicts of Interest

The authors declare no conflicts of interest.

Abbreviations

The following abbreviations are used in this manuscript:
QoSQuality of Service
FCFS First-Come, First-Served
TPSTransactions Per Second
GISGeographic Information System
HMMHidden Markov Model
PQTBAPriority Queue Token Bucket Algorithm
HTBHierarchical Token Bucket
TBDBToken Bucket-based Dynamic Batching
MBSMaximum Batch Size

References

  1. Wang, S.; Zhong, Y.; Wang, E. An integrated GIS platform architecture for spatiotemporal big data. Future Gener. Comput. Syst. 2019, 94, 160–172. [Google Scholar] [CrossRef]
  2. Hasan, R.; Kapoor, A.; Singh, R.; Yadav, B.K. A state-of-the-art review on the quantitative and qualitative assessment of water resources using google earth engine. Environ. Monit. Assess. 2024, 196, 1266. [Google Scholar] [CrossRef]
  3. Zerouali, B.; Santos, C.A.G.; do Nascimento, T.V.M.; Silva, R.M.D. A cloud-integrated GIS for forest cover loss and land use change monitoring using statistical methods and geospatial technology over northern Algeria. J. Environ. Manag. 2023, 341, 118029. [Google Scholar] [CrossRef]
  4. Dhaini, A.; Ho, P.-H.; Jiang, X. QoS Control for Guaranteed Service Bundles Over Fiber-Wireless (FiWi) Broadband Access Networks. J. Light. Technol. 2011, 29, 1500–1513. [Google Scholar] [CrossRef]
  5. Kokkonis, G.; Psannis, K.; Roumeliotis, M. Network Adaptive Flow Control Algorithm for Haptic Data Over the Internet–NAFCAH; Springer: Berlin/Heidelberg, Germany, 2015; Volume 388. [Google Scholar]
  6. Chen, X.; Leung, K.C.; Lam, A.Y.S. Leaky bucket-inspired power output smoothing with load-adaptive algorithm. In Proceedings of the 2017 IEEE International Conference on Communications (ICC), Paris, France, 21–25 May 2017; pp. 1–6. [Google Scholar]
  7. Chang, Y.; Liu, Q.; Jia, X. A Data Rate and Concurrency Balanced Approach for Broadcast in Wireless Mesh Networks. IEEE Trans. Wirel. Commun. 2014, 13, 3556–3566. [Google Scholar] [CrossRef]
  8. Zhang, J.; Zhu, F.; Yang, Z.; Chen, C.; Tian, X.; Guan, X. Routing and scheduling co-design for holistic software-defined deterministic network. Fundam. Res. 2024, 4, 25–34. [Google Scholar] [CrossRef]
  9. Liu, X.; Xu, C.; Zeng, P.; Yu, H. A deep reinforcement learning algorithm for heterogeneous industrial tasks with high concurrent computing offloading. J. Comput. Sci. China 2021, 44, 2367–2381. [Google Scholar] [CrossRef]
  10. Shenker, S.; Partridge, C.; Guérin, R. Specification of Guaranteed Quality of Service. RFC 1997, 2212, 1–20. [Google Scholar]
  11. Gao, F.; Lu, W.; Gan, L.; Xu, C. A ConvNets-based approach for capturing the heterogeneity of spatial domain in parallel geoprocessing. Int. J. Digit. Earth 2024, 17, 2398066. [Google Scholar] [CrossRef]
  12. Lamti, L.; Afifi, H. The fair shaper: An efficient mechanism for Internet bandwidth share over ATM in a multitasks OS. In Proceedings of the 1998 IEEE ATM Workshop Proceedings. ‘Meeting the Challenges of Deploying the Global Broadband Network Infrastructure’ (Cat. No.98EX164), Fairfax, VA, USA, 26–29 May 1998; pp. 56–64. [Google Scholar]
  13. Koutsakis, P. Dynamic versus Static Traffic Policing: A New Approach for Videoconference Traffic over Wireless Cellular Networks. IEEE Trans. Mob. Comput. 2009, 8, 1153–1166. [Google Scholar] [CrossRef]
  14. Cavalca, U.; Mesquita, C.M.; Pereira, A.M.; Carrano, E.G. A computational intelligence based approach for computer network traffic shaping. In Proceedings of the 2013 IEEE Congress on Evolutionary Computation, Cancun, Mexico, 20–23 June 2013; pp. 2680–2686. [Google Scholar]
  15. Kale, M.R.; Labhane, S.; Manu, S.E.; Mehta, P.; Amudha, A.; Gupta, A. Scalable and Efficient Real-Time Data Processing in Cloud-Based Manufacturing Systems. In Proceedings of the 2024 15th International Conference on Computing Communication and Networking Technologies (ICCCNT), Kamand, India, 24–28 June 2024; pp. 1–5. [Google Scholar]
  16. Sedighi, H.; Gehberger, D.; Ebrahimzadeh, A.; Wuhib, F.; Glitho, R.H. Efficient Dynamic Resource Management for Spatial Multitasking GPUs. IEEE Trans. Cloud Comput. 2024, 13, 99–117. [Google Scholar] [CrossRef]
  17. Turner, J. New directions in communications (or which way to the information age?). IEEE Commun. Mag. 1986, 24, 8–15. [Google Scholar] [CrossRef]
  18. Shenker, S.; Wroclawski, J. General Characterization Parameters for Integrated Service Network Elements. RFC 1997, 2215, 1–16. [Google Scholar]
  19. Rabie, S. A Differentiated Service Two-Rate, Three-Color Marker with Efficient Handling of in-Profile Traffic. 2005. Available online: https://www.rfc-editor.org/rfc/rfc4115 (accessed on 1 July 2005).
  20. Lee, C.H.; Kim, Y.T. QoS-aware hierarchical token bucket (QHTB) queuing disciplines for QoS-guaranteed Diffserv provisioning with optimized bandwidth utilization and priority-based preemption. In Proceedings of the International Conference on Information Networking 2013 (ICOIN), Bangkok, Thailand, 28–30 January 2013; pp. 351–358. [Google Scholar]
  21. Jiang, L.; Lu, K.; Huang, H.; Chen, Y. BCube-based Data Center Network Simulation Using NS3. J. Softw. Guide China 2020, 19, 190–194. [Google Scholar]
  22. Yuan, Y.; Liu, Z.Y.; Xiang, H.K.; Ding, Z.F. Traffic Survey System Based on GPS, GPRS and GIS. Adv. Mater. Res. 2011, 328–330, 989–997. [Google Scholar] [CrossRef]
  23. Ali, A.; Hutchison, D.; Angelov, P.; Smith, P. Towards an autonomous resilience strategy the implementation of a self evolving rate limiter. In Proceedings of the 2013 13th UK Workshop on Computational Intelligence (UKCI), Guildford, UK, 9–11 September 2013; pp. 299–304. [Google Scholar]
  24. Peng, Y.; Liu, Q.; Varman, P. Scalable QoS for Distributed Storage Clusters using Dynamic Token Allocation. In Proceedings of the 2019 35th Symposium on Mass Storage Systems and Technologies (MSST), Santa Clara, CA, USA, 20–24 May 2019; pp. 14–27. [Google Scholar]
  25. Zhao, W.; Stankovic, J.A. Performance analysis of FCFS and improved FCFS scheduling algorithms for dynamic real-time computer systems. In Proceedings of the 1989 Real-Time Systems Symposium, Santa Monica, CA, USA, 5–7 December 1989; pp. 156–165. [Google Scholar]
  26. Ardhana, V.Y.P.; Mulyodiputro, M.D. Analisis Quality of Service (QoS) Jaringan Internet Universitas Menggunakan Metode Hierarchical Token Bucket (HTB). J. Inform. Manag. Inf. Technol. 2023, 3, 70–76. [Google Scholar]
  27. Anitha, P.; Vimala, H.S.; Shreyas, J. PQTBA: Priority Queue based Token Bucket Algorithm for congestion control in IoT network. In Proceedings of the 2023 IEEE 8th International Conference for Convergence in Technology (I2CT), Lonavla, India, 7–9 April 2023; pp. 1–6. [Google Scholar]
  28. Mat Nawi, N.A.; Yusof, R. Simulation of Token Bucket Algorithm for Network Traffic Performance. J. Adv. Comput. Technol. Appl. 2020, 2, 21–28. [Google Scholar]
  29. Gao, H.; Qiu, B.; Wang, Y.; Yu, S.; Xu, Y.; Wang, X. TBDB: Token bucket-based dynamic batching for resource scheduling supporting neural network inference in intelligent consumer electronics. IEEE Trans. Consum. Electron. 2023, 70, 1134–1144. [Google Scholar] [CrossRef]
  30. AlQahtani, S.A. An efficient resource allocation to improve QoS of 5G slicing networks using general processor sharing-based scheduling algorithm. Int. J. Commun. Syst. 2019, 33, e4250. [Google Scholar] [CrossRef]
  31. Bonald, T.; Comte, C. Balanced fair resource sharing in computer clusters. Perform. Eval. 2017, 116, 70–83. [Google Scholar] [CrossRef]
  32. Guan, Q.; Xu, X. Impact of Channel Memory on the Data Freshness. IEEE Commun. Lett. 2023, 27, 80–84. [Google Scholar] [CrossRef]
  33. Wang, D.; Zhang, Q.; Luo, Y.; Liu, X.; Liang, J. An adaptive task scheduling algorithm for 3-D target imaging in radar network. EURASIP J. Adv. Signal Process. 2022, 2022, 34. [Google Scholar] [CrossRef]
  34. Rong, J.; Liu, F.; Miao, Y.; Zhu, H.; Wu, C. Adaptive Task Scheduling Algorithm for Multifunction Integrated System with Joint Radar–Communications Waveform. Electronics 2023, 12, 1560. [Google Scholar] [CrossRef]
  35. Maqbool, A.; Usmani, Z.u.A.; Afzal, F.; Razia, A. Disaster Mitigation in Urban Pakistan Using Agent Based Modeling with GIS. ISPRS Int. J. Geo-Inf. 2020, 9, 203. [Google Scholar] [CrossRef]
  36. Abdelkader, Y.; Ibrahim, S. Measures of Performance in the M/M/1/N Queue via the Methods of Order Statistics. Life Sci. J. 2012, 9, 945–953. [Google Scholar]
  37. Fiorini, P.M. Analyzing the Busy Period of the M/M/1 Queue via Order Statistics and Record Values. In Proceedings of the 2021 11th IEEE International Conference on Intelligent Data Acquisition and Advanced Computing Systems: Technology and Applications (IDAACS), Cracow, Poland, 22–25 September 2021; Volume 1, pp. 217–224. [Google Scholar]
  38. Vijay, R.; Sree, T.R. Resource Scheduling and Load Balancing Algorithms in Cloud Computing. Procedia Comput. Sci. 2023, 230, 326–336. [Google Scholar] [CrossRef]
  39. Daid, R.; Kumar, Y.; Hu, Y.-C.; Chen, W.-L. An effective scheduling in data centres for efficient CPU usage and service level agreement fulfilment using machine learning. Connect. Sci. 2021, 33, 954–974. [Google Scholar] [CrossRef]
  40. Yoon, K.; Jeong, E.; Kang, W.; Ha, S. Memory Usage Estimation for Dataflow-Model-Based Software Development Methodology. IEEE Des. Test 2024, 41, 60–69. [Google Scholar] [CrossRef]
  41. Ma, C.; Chi, Y. Evaluation Test and Improvement of Load Balancing Algorithms of Nginx. IEEE Access 2022, 10, 14311–14324. [Google Scholar] [CrossRef]
  42. Shahid, M.A.; Alam, M.M.; Su’ud, M.M. Performance Evaluation of Load-Balancing Algorithms with Different Service Broker Policies for Cloud Computing. Appl. Sci. 2023, 13, 1586. [Google Scholar] [CrossRef]
  43. Li, C.; Zheng, J.; Okamura, H.; Dohi, T. Performance Evaluation of a Cloud Datacenter Using CPU Utilization Data. Mathematics 2023, 11, 513. [Google Scholar] [CrossRef]
  44. Boryło, P.; Chołda, P.; Domżał, J.; Jaglarz, P.; Jurkiewicz, P.; Rzepka, M.; Rzym, G.; Wójcik, R. SDNRoute: Proactive routing optimization in Software Defined Networks. Comput. Commun. 2024, 225, 250–278. [Google Scholar] [CrossRef]
Figure 1. Principle of token bucket algorithm.
Applsci 15 04932 g001
Figure 2. Shortcomings of existing methods: (a) description of idle resources; (b) description of overloading of resources.
Applsci 15 04932 g002
Figure 3. Overall flowchart.
Applsci 15 04932 g003
Figure 4. Detection of optimal token fill rate for simple task scenarios.
Applsci 15 04932 g004
Figure 5. Detection of optimal token fill rate for general task scenarios.
Applsci 15 04932 g005
Figure 6. Detection of optimal token fill rate for complex task scenarios.
Applsci 15 04932 g006
Figure 7. Average latency for simple task scenarios.
Applsci 15 04932 g007
Figure 8. Average latency for general task scenarios.
Applsci 15 04932 g008
Figure 9. Average latency for complex task scenarios.
Applsci 15 04932 g009
Figure 10. Average latency for mixed task scenarios.
Applsci 15 04932 g010
Figure 11. Average latency for dynamic traffic scenarios.
Applsci 15 04932 g011
Figure 12. The 90th percentile latency for dynamic traffic scenarios.
Applsci 15 04932 g012
Figure 13. Average throughput for simple task scenarios.
Applsci 15 04932 g013
Figure 14. Average throughput for general task scenarios.
Applsci 15 04932 g014
Figure 15. Average throughput for complex task scenarios.
Applsci 15 04932 g015
Figure 16. Average throughput for mixed task scenarios.
Applsci 15 04932 g016
Figure 17. Average throughput for dynamic traffic scenarios.
Applsci 15 04932 g017
Disclaimer/Publisher’s Note: The statements, opinions and data contained in all publications are solely those of the individual author(s) and contributor(s) and not of MDPI and/or the editor(s). MDPI and/or the editor(s) disclaim responsibility for any injury to people or property resulting from any ideas, methods, instructions or products referred to in the content.

