Abstract
Spray dust removal is currently the primary method of dust control technology, while it exhibits low efficacy in dust removal capability. A Phase Doppler Particle Analyzer (PDPA) experimental system was constructed to study the influence of dust suppressants on the coupling behavior of dust–mist particles using comparative methods. According to the experimental results of the atomization effect of the spray, the Sauter Mean Diameter (D32) of the mist size of the dust suppressants showed an increasing trend compared to water. This trend became less obvious with an increase in spray pressure, and a reduction in the surface tension of the dust suppressants promoted an increase in the particle size distribution of water mist. According to the test results of the dust–mist coupling behavior experiment, compared with water, the coupling efficiency of Dodecyl Alcohol (DA), Alkylphenol Polyoxyethylene (OP-10), and Sodium Dodecyl Sulfate (SDS) increased by 27.0%, 20.3%, and 15.0%, respectively. This indicates a proportional relationship between the wetting performance of the dust suppressants and the dust–mist coupling rate and an inverse relationship between the surface tension of the dust suppressant solutions and the dust removal efficiency. The research findings hold major possibilities for enhancing the dust removal efficiency.
1. Introduction
Dust pollution, primarily composed of fine particulate matter (PM), arises from various anthropogenic and natural sources, including industrial operations, mining, construction, and environmental events, such as dust storms. Particularly concerning are particles with diameters smaller than 10 μm (PM10), which pose substantial health risks, primarily respiratory complications, and contribute significantly to environmental degradation, such as reduced visibility and ecosystem imbalances [1,2,3]. The severity of these issues has led to the development of advanced dust suppression technologies, with spray and chemical surfactants emerging as key methods to mitigate airborne particulate matter. The mechanism behind water mist technology is primarily physical: the droplets generated by the mist couple with and subsequently settle dust particles. The effectiveness of this process is highly contingent on the interactions between dust and mist particles, which are influenced by various factors such as spray pressure, spray angle, atomization parameters, and, notably, the surface tension and viscosity of the liquid solution [4,5,6]. A theoretical exploration of these parameters reveals that water mist disperses droplets that must possess adequate kinetic energy and surface properties to interact effectively with dust particles. Understanding the balance between droplet dynamics (size, velocity, and interaction) and dust particle characteristics is critical to optimizing the suppression process. Spray pressure plays a dual role in system efficiency. While higher pressures produce finer droplets, promoting more extensive mist coverage, they also have a counteracting effect on dust settling, which warrants further scrutiny [7]. The interaction between mist droplets and dust particles is significantly altered by the introduction of dust suppressants, which reduce the surface tension of water, thereby modifying the wettability of hydrophobic dust particles. This change in surface properties not only enhances dust adhesion to the droplets but also impacts the overall distribution of particles within the mist field [8]. The viscosity of the solution adds another layer of complexity, as higher-viscosity solutions tend to reduce the ability of droplets to coalesce, which may enhance dust capture but hinder droplet dispersal [9,10]. Theoretically, the interplay between surface tension and viscosity becomes crucial in understanding particle coupling. When both parameters are finely tuned, they promote more efficient attachment of dust particles, thereby improving mist capture efficiency. Previous research has primarily focused on understanding the empirical relationships between spray parameters and suppression effectiveness [11,12], which is especially important in spray dust control. The coupling behavior of dust and mist particles significantly impacts suppression efficiency; adjusting parameters like spray pressure and surface tension can optimize droplet distribution and enhance dust capture. A balanced approach to controlling both physical and chemical parameters in water mist solutions aims to make spray dust suppression more effective against dust pollution [12,13,14]. Numerous studies have investigated the effectiveness of water mist and suppressants in reducing dust [15,16,17]. Moreover, limited research has investigated the influencing parameters spray pressure, surface tension, and solution viscosity—that are essential for understanding the mechanism of spray dust control and enhancing efficacy. Additionally, different instruments and devices are employed to investigate the coupling behavior of dust–mist particles, including holographic particle velocity measurement techniques and methods for image comparison [16,18]. However, the Phase Doppler Particle Analyzer (PDPA) system has emerged as a reliable and precise tool, enhancing testing accuracy alongside advancements in scientific research. Previous studies, such as those by Li Ming [16] and Nuyttens [19], demonstrated the precision and reliability of the PDPA system in capturing key parameters influencing dust suppression mechanisms. These developments have provided a theoretical foundation for exploring the finer details of particle interaction and settling behavior within mist systems.
This study aims to investigate the impact of dust suppressants on the coupling behavior of dust–mist particles in spray dust removal technology, and this research seeks to establish correlations between the properties of spray solutions and the coupling efficiency of dust–mist particles. By investigating the effects of surface tension, solution viscosity, and the wettability of spray solutions, we aim to enhance the understanding of how these solution parameters influence the dust removal efficiency of spray technology.
2. Experimental Materials and Basic Parameters
2.1. Experimental Materials
A mineral dust was selected in this research, the main composition of which is hematite Fe2O3, and the size distribution of the test dust is shown in Figure 1.
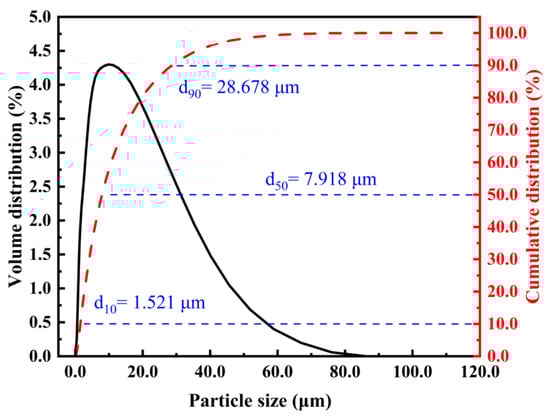
Figure 1.
Dust sample size distribution results.
The test dust has a particle size range of 0.1 μm to 85.0 μm, and the maximum value of the volume distribution is 12.059 μm. The characteristic value of the cumulative particle size distribution is d10 = 1.521 μm, d50 = 7.918 μm, and d90 = 28.678 μm.
Several different types of dust suppressants were selected: Dodecyl Alcohol (DA), Alkylphenol Polyoxyethylene (OP-10), and Sodium Dodecyl Sulfate (SDS). These suppressants were chosen based on their wide application, dust suppression effectiveness, and chemical properties, as detailed in Table 1. Water was used as the reference material for comparison.

Table 1.
Three selected dust suppressants.
Based on the pre-test results, when the mass concentration of the dust suppressant solutions exceeds 1.0%, there is no significant change in surface tension. This is because the suppressants have already reached their Critical Micelle Concentration (CMC) state, beyond which the surfactant molecules aggregate into micelles rather than adsorbing at the liquid–air interface. Additionally, when the surface tension drops below 1.0 × 10⁻⁵%, it becomes similar to that of water, making such solutions unsuitable for comparative experiments with water. Furthermore, excessively high viscosity values hinder dust reduction through the spray and render the optimization of atomization effects ineffective.
The mass concentrations of the dust suppressant solutions were set at 1.0 × 10⁻⁵%, 1.0 × 10⁻³%, 1.0 × 10⁻²%, 1.0 × 10⁻¹%, and 1.0%. These ranges ensure stable spraying and allow for meaningful comparisons with water, facilitating a systematic exploration of the relationship between changes in surface tension, viscosity, and atomization effects.
2.2. Basic Parameters of Suppressant Materials
2.2.1. Surface Tension and Viscosity of Dust Suppressant Solutions
The surface tension and viscosity of these suppressants were measured using an automatic interfacial tension meter and a Shanghai viscosimeter, with the test conditions maintained at a temperature of 25 °C and a humidity of 43% RH. The results are shown in Figure 2.
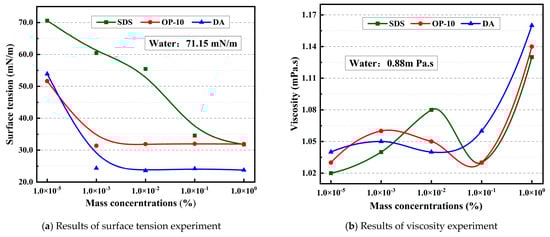
Figure 2.
Surface tension and viscosity of dust suppressant solutions at different concentrations.
Figure 2a shows the surface tension values of the three dust suppressants—DA, OP-10, and SDS—at varying mass concentrations. At a concentration of 1.0 × 10⁻³%, DA had the lowest surface tension (24.6 mN/m), followed by OP-10 (31.9 mN/m) and SDS (55.45 mN/m). The results indicate that DA exhibited the most substantial interfacial activity, significantly reducing surface tension in comparison to OP-10 and SDS. As the mass concentration increased to 1.0%, all suppressants showed reduced surface tension: DA (23.75 mN/m), OP-10 (31.92 mN/m), and SDS (31.8 mN/m). The convergence of these values at higher concentrations indicates that each suppressant reached CMC, where surfactant molecules aggregate into micelles, limiting further reduction in surface tension [20]. DA’s ability to significantly reduce surface tension at both low and high concentrations reflects its strong interfacial activity [21]. In contrast, OP-10’s moderate reduction in surface tension is likely due to the stabilizing effect of its hydrophilic Polyoxyethylene chain [22], while SDS showed a gradual reduction due to slower adsorption dynamics at low concentrations and a more significant reduction at higher concentrations as micelles formed [23].
Figure 2b illustrates the viscosity of the three dust suppressants at varying mass concentrations. Viscosity reflects a fluid’s internal resistance to flow, playing a key role in dust–mist particle interactions. The experimental results indicate that the viscosity of the suppressants exhibited a variable, increasing trend with increasing mass concentrations for all suppressants. The results also indicate that the suppressants’ effect on bulk viscosity is minimal at low concentrations, at higher concentrations, as micelles formed in the dust suppressant solutions, the viscosity increased due to the interactions between micelles [24]. The trend of the increase in viscosity is as follows: DA > OP-10 > SDS > water. Overall, the experimental results highlight the primary role of surface tension and viscosity in dust suppression efficiency. These findings align with theoretical predictions that focus on dust suppressants at the solid–liquid interface and its effects on spray dynamics and dust–mist interactions [25].
2.2.2. Wettability of Dust Suppressant Solutions
The sedimentation time experiment is a robust method for assessing the wettability of dust suppressants on dust. The wettability of dust suppressants is directly proportional to the sedimentation rate at which the solution wets dust [26,27]. A schematic design of the sedimentation time experiment is shown in Figure 3a. Specifically, the test solution (20.0 mL) was poured into a 25.0 mL test tube, dried test dust (1.0 g) was cautiously added into the test tube, and the duration it took for all the dust particles to settle to the bottom of the solution was measured, as shown in Figure 3b.
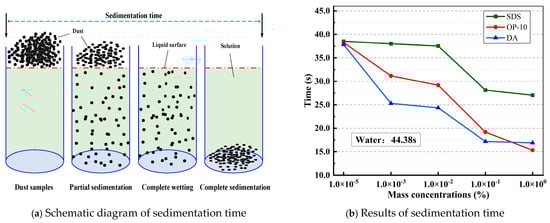
Figure 3.
Sedimentation time experiment of dust suppressants.
The sedimentation time in water, measured as 44.38 s, served as the benchmark for the maximum settling time expected. The average sedimentation time of SDS is 33.84 s, OP-10 is 26.63 s, and DA is 24.31 s. The results show that variations in mass concentration and surface tension significantly influence sedimentation behavior, as shown in Figure 2a and Figure 3b. Each suppressant exhibits distinct sedimentation dynamics due to differences in surface tension and solid–liquid interface interactions. The average sedimentation time of the three suppressant solutions at lower concentrations (1.0 × 10⁻⁵%) is 38.21 s; this can be attributed to higher surface tension, which slows the settling rate. Conversely, the average sedimentation time of the three suppressant solutions at high concentrations (1.0%) is 19.75 s. This is due to the reduced surface tension, which facilitates faster sedimentation [28]. These findings suggest that concentration-dependent modifications in sedimentation behavior can be used to optimize suppressant performance for dust–mist coupling behavior.
3. Experimental Apparatus and Testing Methods
A PDPA experimental system was established to measure particle parameters and coupling behavior and evaluate the dust removal performance of water mist. It includes an adjustable high-pressure spray system, an adjustable dust generator, a testing box, and a PDPA device, as shown in Figure 4.
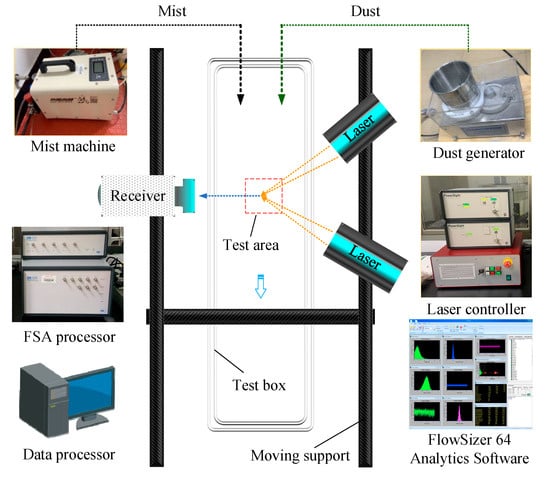
Figure 4.
The fundamental elements of the PDPA system.
3.1. PDPA Experimental System
A PDPA device employs the optical theory of Lorenz–Mie scattering, typically comprising a laser, an incident optical unit, a receiving optical unit, a signal processor, and a data processing system. It obtains velocity information by measuring the frequency difference between the scattered light and the incident light from moving particles [29]. The particle size is determined by analyzing the phase shift caused by the reflection or refraction of the scattered light from spherical particles passing through the laser measurement volume [30]. Three lasers with different wavelengths (532 nm, 553 nm, and 561 nm) are used to irradiate particles in the flow field, and the feedback signal is then transmitted to the receiving sensor and uploaded to the data processing system, enabling non-contact measurement of the three-dimensional velocity and size of the particles [16,31].
The experiment explores the phenomenon of dust–mist coupling to evaluate its effectiveness in suppressing airborne dust under controlled experimental conditions. To study the coupling effect, dust particles of a specific size and quality were introduced into an aerosol generator, forming a controlled coupling field within the test box. We measured the particle size of individual suppressant mist droplets within a defined test area inside the test box and analyzed their behavior under varying conditions, including different spray pressures, suppressant solutions, and mass concentrations. The effectiveness of dust capture was assessed by analyzing the data from the PDPA system at various measurement points [11].
3.2. Measuring Parameters of PDPA Experimental System
The coordinate origin was established at the nozzle outlet, and the test area was designated between 5.0 cm and 15.0 cm along the Z-axis, as shown in Figure 5. This layout enabled the collection of detailed spatial and temporal data that are critical for analyzing dust–mist coupling behavior. The nozzle pressure was adjusted to control the mist’s velocity and size distribution, while the suppressant materials and mass concentrations were varied to study dust and mist particle interaction laws.
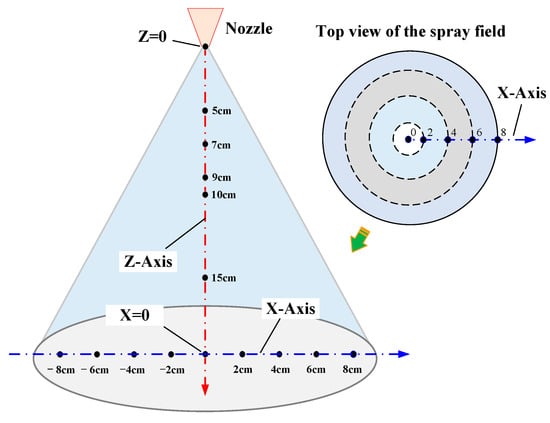
Figure 5.
Layout of specific measuring points.
A control variable methodology was applied during the experiments, wherein a single parameter was modified while others remained constant to isolate its impact [16]. The selected measuring parameters are shown in Table 2.
Table 2.
Measuring parameters selected.
This approach provided a rigorous framework for examining the influence of factors such as spray pressure, suppressant material, and mass concentration on the dust–mist coupling process. At each measuring site or point, at least 10,000 data points were gathered to provide a consistent amount of data and guarantee the accuracy of subsequent data processing [16,31].
3.3. Method for Processing Experimental Data
The size and velocity of particles were investigated in a dust–mist field utilizing different dust suppressant materials. The original experimental data were collected using an accompanying data software system, which included real-time particle size and velocity. The data collected through the PDPA system were subjected to matrix transformation to align it with the established spatial coordinate system, ensuring accurate representation and facilitating further analysis [16]. The matrix transformation is shown in Formula (1):
where x, y, and z represent the coordinate system components; v is the orthogonal velocity, m/s; and E is the final transformation matrix that is used to convert non-orthogonal velocity components to orthogonal velocity.
To undertake scientific examination and comparison of the huge volume of data acquired, the Sauter Mean Diameter (D32) method was used to examine the original data [16,32]. The D32 calculation formula (2) is expressed as follows:
where N represents the volumetric frequency of droplets, m3·s, and D denotes the droplet diameter, μm.
This method offers a precise and dependable approach to examining the experimental data and facilitates the examination of the relationship between influencing variables [16]. Figure 6 displays the data acquisition system of the PDPA device, which provides measurements for Diameter, Time, and Vx, Vy, and Vz.
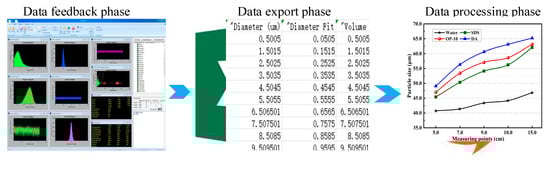
Figure 6.
Data acquisition system for the PDPA device in experimental settings.
Diameter represents the droplet size; Time refers to the instantaneous moment when the system collects droplet data; Vx, Vy, and Vz are the velocity components in the X-, Y-, and Z-axis directions, respectively [16,33]. Over the course of the experiment, the PDPA sampling points were realigned to the origin based on the previously described configuration of the dust–mist flow field for measurement purposes. The parameters for each measurement point within the dust–mist flow field were tested in sequence, adhering to the specified step size.
3.4. Judgment Basis for Dust–Mist Coupling Effect
It is well known that the coupling between dust particles and mist particles will lead to an increase in the particle size of the coupling body [34], as shown in Figure 7. The coupling mechanism involving mist droplets and dust particles encompasses inertia collision, interception, diffusion effects, and electrostatic interactions among the high concentrations of mist particle droplets [35,36].
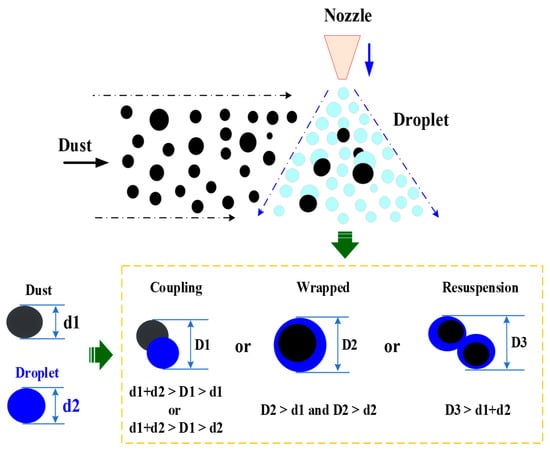
Figure 7.
Schematic diagram of the form of dust–mist coupling behavior.
Figure 7 shows that the coupling of the particle size (D1) is larger than the size of the dust particle (d1) and the droplet particle (d2) after the dust–mist particles coupled, the wrapped particle size (D2) is larger than the size of d1 and d2, and the resuspension particle size (D3) is much greater than the size of d1 and d2. Based on the above analysis, any coupling results between dust and mist particles will lead to an increase in particle size of the coupling body. It can be inferred that a larger coupling ratio between dust–mist particles results in a greater amount of coupling entities generated between dust and mist particles. That is to say, the higher the increase rate of the coupling body size, the higher the coupling proportion of dust and mist particles, and consequently, the higher the dust removal efficiency of water mist.
4. Results and Discussion
According to the experimental methods and testing parameters, two sets of test data were obtained using the PDPA experimental system: One set compared the effects of the suppressant solutions on spray atomization, while the other compared their effects on the coupling efficiency between dust and mist particles.
4.1. Influence of Suppressant Materials on Atomization Parameters of Spray
4.1.1. Size Distribution of Mist Droplet
The results of the particle size distribution of mist droplets for different suppressant materials, as shown in Figure 8, include water, DA, OP-10, and SDS. For water, the particle size distribution initially remains lower than that of the other dust suppressants; this is attributed to the fact that water has a high surface tension and low viscosity as compared to the other dust suppressants, which makes water particles easy to break [37]. As a result, the mist droplet from water alone is less uniform and consists predominantly of larger droplets [38], limiting its effectiveness in applications requiring fine mist droplet dispersion during spraying.
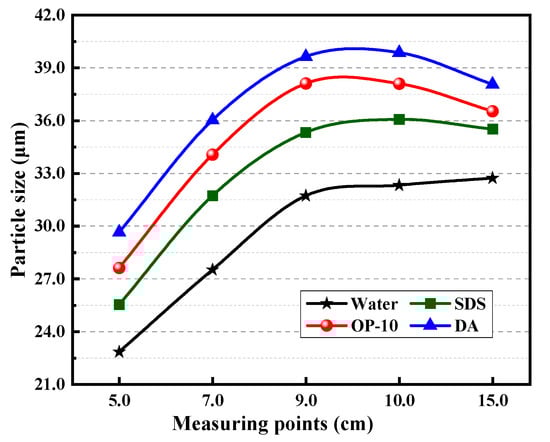
Figure 8.
Particle size distribution at different measuring points.
Figure 8 also reveals that the particle size distribution of the dust suppressants DA, OP-10, and SDS, due to the reduced surface tension (Figure 2b) and increased viscosity (Figure 2a), remained higher than that of water. A lower surface tension results in larger particle sizes, and a higher surface tension results in smaller particle sizes. The DA suppressant has a higher particle size distribution due to its efficient surface tension reduction and increased viscosity. This results in enhanced mist uniformity and dispersion. Op-10 and SDS also showed a similar trend to DA, which was still better than water.
4.1.2. Velocity Distribution of Mist Droplet
This experiment and the work of Huaizhen Yang [16] and Pascuzzi Simone [39] reveal that dust suppressants with a lower surface tension exhibit higher initial velocities compared to water. We observed a gradual decrease in velocity for the dust suppressants, aligning with their findings. These similarities indicate that surface tension significantly influences initial mist particle velocity, while the rate of velocity decrease is influenced by the specific properties of each suppressant [16]. Figure 9 shows the change in velocity of the different dust suppressants. It can be observed that the mist particle velocity decreases from 5.0 cm to 10.0 cm along the measuring points. At 5.0 cm, the mist particle velocity of DA, which has the smallest surface tension, reaches a velocity higher than that of water. Compared to DA, the mist particle velocity of OP-10 and SDS decreases more gradually.
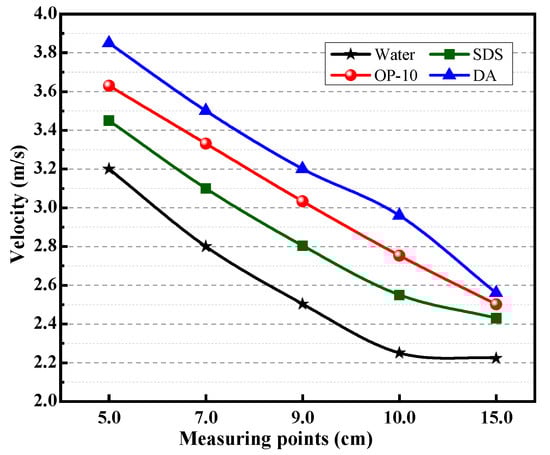
Figure 9.
Velocity distribution of particles.
Figure 9 shows that between 10.0 cm and 15.0 cm, the mist velocity of the three suppressants DA, OP-10, and SDS did not show a significant difference and remained in a reducing state. Because the 15.0 cm point is at the edge of the measuring field, the spray effect is significantly weakened, resulting in minimal speed change [40]. Based on the above discussion and comparing the results to surface tension and viscosity in Figure 2, it can be seen that changes in surface tension and viscosity within the core atomization region (5.0 cm to 10.0 cm) can significantly affect particle velocity, which is directly attributed to particle size [16,41]. Near the nozzle (5.0 cm), viscosity has a more significant effect on mist particle size and velocity than surface tension [42].
4.1.3. Influence of Suppressants on Atomization Effect of Spray
According to Bernoulli’s principle and Newton’s second law, an increase in pressure results in a corresponding increase in the force exerted on the particles [43,44]. As a whole, the trends indicate an inverse relationship between spray pressure and D32 size values. As spray pressure increases from 2.0 to 6.0 MPa, D32 values systematically decrease. The most prominent effects are observed at higher pressures (6.0 MPa), as shown in Figure 10. Change rate refers to the variations in particle size of the tested suppressants compared to water.
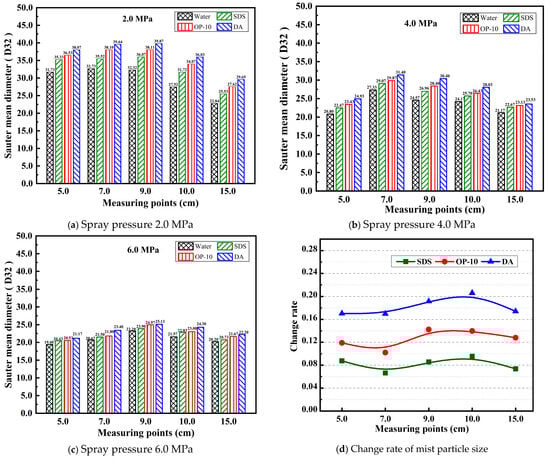
Figure 10.
Influence of dust suppressants on atomization.
The change trend of the D32 size value increases with the dust suppressants in the order DA > OP-10 > SDS > water. As the pressure increased, the mean D32 value of DA decreased from 36.65 μm at 2.0 MPa to 23.24 μm at 6.0 MPa. Similarly, the OP-10 D32 value decreased from 34.89 μm at 2.0 MPa to 22.39 μm at 6.0 MPa, the SDS D32 value decreased from 32.84 μm at 2.0 MPa to 21.88 μm at 6.0 MPa, and the water D32 value decreased from 29.65 μm at 2.0 MPa to 21.01 μm at 6.0 MPa. For the 5.0 cm measurement position, the average D32 value of the dust suppressants decreased from 35.42 μm at 2.0 MPa to 20.38 μm at 6.0 MPa. For the 7.0 cm measurement position, the average D32 value decreased from 37.75 μm to 22.23 μm, and for the 9.0 cm measurement position, the D32 values decreased from 38.02 μm to 24.66 μm. For the 10.0 cm measurement position, the D32 values decreased from 33.94 μm to 23.37 μm, and for the 15.0 cm measurement position, the D32 values decreased from 26.41 μm to 21.20 μm. The average D32 value of the dust suppressants was 33.45 μm at 2.0 MPa, 25.72 μm at 4.0 MPa, and 22.13 μm at 6.0 MPa. The average D32 value of the dust suppressants across the different spray pressures was 26.24 μm at 5.0 cm, 29.25 μm at 7.0 cm, 29.49 μm at 9.0 cm, 27.11 μm at 10.0 cm, and 21.50 μm at 15.0 cm.
The relationship between the change rate and the measuring points for three dust suppressants DA, OP-10, and SDS is shown in Figure 10d. The water value was used as the reference baseline in this study. The change rate of the average size of the D32 across the different measuring points was calculated using the averaged data of water and each suppressant. As a whole, the change rate of the dust suppressant fluctuates up and down; the change rate of DA is the largest, with an average value of 18.2%, followed by OP-10, with an average value of 12.6%, and SDS, with an average value of 8.2%. The mean change rate of DA is 2.25 times greater than that of the SDS value and 1.38 times greater than that of the OP-10 value. According to the results in Figure 2a, the greater the reduction in surface tension DA > OP-10 > SDS, the larger the change rate. It is observed that when the surface tension of solutions is lower, the particle sizes of droplets tend to be larger. Consequently, the dust suppressant is less effective in promoting the atomization of smaller particles.
4.2. Influence of Suppressant Materials on Dust–Mist Coupling Effect
The results of the dust–mist coupling behavior are shown in Figure 11. Overall, the D32 size increased when dust was added to the mist field for the dust suppressant solutions, compared to the results in Figure 10. The overall trend observed is that as the pressure increases, the increased D32 value decreases. The change trend was maintained in the order of DA > OP-10 > SDS > water.
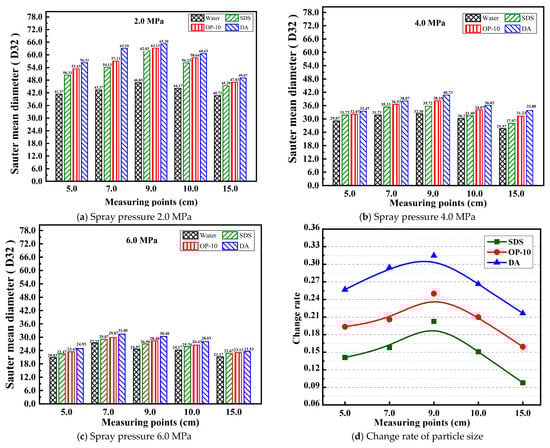
Figure 11.
Influence of suppressants on dust–mist effect after coupling.
As the pressure increased, the mean D32 value of DA decreased from 58.86 μm at 2.0 MPa to 27.65 μm at 6.0 MPa. Similarly, the D32 value of OP-10 decreased from 55.86 μm to 26.25 μm, the D32 value of SDS decreased from 53.62 μm to 25.37 μm, and the mean D32 value of water decreased from 43.29 μm at 2.0 MPa to 23.61 μm at 6.0 MPa. For the measurement position at 5.0 cm, the average D32 value of the dust suppressant changed from 50.36 μm at 2.0 MPa to 22.92 μm at 6.0 MPa. For the measuring point at 7.0 cm, the average D32 value changed from 54.43 μm at 2.0 MPa to 29.42 μm at 6.0 MPa. For the 9.0 cm measurement position, the average D32 value changed from 59.30 μm at 2.0 MPa to 27.58 μm at 6.0 MPa. For the 10.0 cm measurement position, the average D32 value changed from 54.92 μm at 2.0 MPa to 26.08 μm at 6.0 MPa. For the 15.0 cm measurement position, the average D32 value of the dust suppressants changed from 45.55 μm at 2.0 MPa to 22.63 μm at 6.0 MPa, respectively.
As depicted in Figure 11d, the change rate of the three dust suppressants exhibited a more pronounced increase compared to that of water. The change rate peaked at the 9.0 cm measurement point and subsequently decreased at the 10.0 cm point for all dust suppressants. Among these, DA demonstrated the highest change rate, with an average value of 27.0%, followed by OP-10 at 20.3%, and SDS at 15.0%. The mean change rate of DA was 1.80 times that of SDS and 1.35 times that of OP-10. The results demonstrate that a higher D32 value corresponds to greater coupling ability of the suppressants. The dust suppressants enhanced the wetting performance on dust particles, thereby significantly improving the coupling behavior between dust and mist and leading to a markedly shorter sedimentation time compared to water, as illustrated in Figure 3. This suggests that better wetting performance is directly proportional to the increased coupling particle size, thereby establishing a proportional relationship between wetting performance and the dust–mist coupling effeciency. In comparison with Figure 2, the experimental data further reveal an inverse relationship between the surface tension and viscosity of the dust suppressant and dust–mist coupling efficiency.
5. Research Conclusions
An experimental test system for analyzing dust–mist coupling behavior based on a PDPA tester is constructed, which can be used to study dust–mist coupling behavior under different spray pressures and different dust suppression solutions. The particle sizes and velocity distribution parameters of particles in the dust–mist flow field can be obtained in real time continuously.
1. Experiments on the influence of dust suppressants on mist field parameters under different spray conditions were carried out, and it was found that the Sauter Mean Diameter (D32) of the mist size of the dust suppressants showed an increasing trend compared to water. This trend became less obvious with an increase in spray pressure. From the perspective of surface tension, a reduction in surface tension of the dust suppressants promotes an increase in the particle size distribution of water mist.
2. According to the test results of the dust–mist coupling behavior experiment, compared with water, the coupling efficiency of Dodecyl Alcohol (DA), Alkylphenol Polyoxyethylene (OP-10), and Sodium Dodecyl Sulfate (SDS) increased by 27.0%, 20.3%, and 15.0%, respectively. This indicates a proportional relationship between the wetting performance of the dust suppressants and the dust–mist coupling rate, and an inverse relationship between the surface tension of the dust suppressant solutions and dust removal efficiency. These research findings hold major possibilities for enhancing dust–removal efficiency.
This study was limited to a single type of dust sample. In order to get the comprehensive rules of dust-mist interactions, more dust suppressants, such as polymer and bio-based materials, should be researched on coupling performance with various types of dust in the future.
Author Contributions
D.L.: writing—original draft, visualization, methodology, investigation, formal analysis, conceptualization. M.L.: supervision, visualization, investigation, suggestions, project administration. U.M.T.: writing—review, suggestions, editing, formal analysis, conceptualization. W.L.: visualization, formal analysis. H.L.: visualization, formal analysis, methodology. M.M.: investigation, visualization, formal analysis. All authors have read and agreed to the published version of the manuscript.
Funding
We acknowledge funding from the National Key Research and Development Plan of China (No. 2022YFC2903901) and the National Natural Science Foundation of China (No. 51674289).
Institutional Review Board Statement
Not applicable.
Informed Consent Statement
Not applicable.
Data Availability Statement
All correspondence and requests for materials should be addressed to Lusambo Donald.
Acknowledgments
The authors express their gratitude to Yuantao Zhang, Xiaobin Lai, Luo Zhijian, Xu Yuanqi, Pauline Ngosa, Maria Lusambo, Elizabeth Ngosa, Mayani Musonda, Mapalo Mwape, and Chisanga Musonda for their assistance with the experiments and their valuable discussions.
Conflicts of Interest
The authors declare no conflicts of interest.
References
- Beck, T.; Seaman, C.; Shahan, M.; Mischler, S. Open-air sprays for capturing and controlling airborne float coal dust on longwall faces. Min. Eng. 2018, 70, 42. [Google Scholar] [CrossRef] [PubMed]
- Wang, P.; Han, H.; Tian, C.; Liu, R.; Jiang, Y. Experimental study on dust reduction via spraying using surfactant solution. Atmos. Pollut. Res. 2020, 11, 32–42. [Google Scholar] [CrossRef]
- Zhao, X.; Zhao, X.; Han, F.; Song, Z.; Wang, D.; Fan, J.; Jia, Z.; Jiang, G. A research on dust suppression mechanism and application technology in mining and loading process of burnt rock open pit coal mines. J. Air Waste Manag. Assoc. 2021, 71, 1568–1584. [Google Scholar] [CrossRef] [PubMed]
- Soni, S.K.; Kolhe, P.S. Liquid jet breakup and spray formation with annular swirl air. Int. J. Multiph. Flow 2021, 134, 103474. [Google Scholar] [CrossRef]
- Wang, P.; Tan, X.; Zhang, L.; Li, Y.; Liu, R. Influence of particle diameter on the wettability of coal dust and the dust suppression efficiency via spraying. Process Saf. Environ. Prot. 2019, 132, 189–199. [Google Scholar] [CrossRef]
- Ma, Q.; Nie, W.; Yang, S.; Xu, C.; Peng, H.; Liu, Z.; Guo, C.; Cai, X. Effect of spraying on coal dust diffusion in a coal mine based on a numerical simulation. Environ. Pollut. 2020, 264, 114717. [Google Scholar] [CrossRef]
- Bernal-Alvarez, L.R.; Ramirez-Gutierrez, C.F.; Gomez-Vazquez, O.M.; Correa-Piña, B.A.; Zubieta-Otero, L.F.; Millán-Malo, B.M.; Rodriguez-Garcia, M.E. Enhancing surface chemistry and wetting behavior of laser-modified Ti–6Al–4V surgical titanium alloy surfaces through wet deposition of biogenic hydroxyapatite. Surf. Coat. Technol. 2024, 489, 131065. [Google Scholar] [CrossRef]
- Li, Z.; Wen, S.; Guan, X.; Xu, Y.; Xie, W. Investigating the efficacy of foam-based dust particle capture for dust elimination in ore pass unloading: A similar experimental study. Powder Technol. 2024, 446, 120191. [Google Scholar] [CrossRef]
- Zhao, B.; Li, S.; Lin, H.; Cheng, Y.; Kong, X.; Ding, Y. Experimental study on the influence of surfactants in compound solution on the wetting-agglomeration properties of bituminous coal dust. Powder Technol. 2022, 395, 766–775. [Google Scholar] [CrossRef]
- Sun, D.; Cai, W.; Li, C.; Lu, J. Experimental study on atomization characteristics of high-energy-density fuels using a fuel slinger. Energy 2021, 234, 121222. [Google Scholar] [CrossRef]
- Wang, J.; Xu, C.; Zhou, G.; Zhang, Y. Spray structure and characteristics of a pressure-swirl dust suppression nozzle using a phase doppler particle analyze. Processes 2020, 8, 1127. [Google Scholar] [CrossRef]
- Wang, C.; Lu, S.; Li, M.; Zhang, Y.; Sa, Z.; Liu, J.; Wang, H.; Wang, S. Study on the dust removal and temperature reduction coupling performances of magnetized water spray. Environ. Sci. Pollut. Res. 2022, 29, 6151–6165. [Google Scholar] [CrossRef] [PubMed]
- Chaulya, S.; Chowdhury, A.; Kumar, S.; Singh, R.; Singh, S.; Singh, R.; Prasad, G.; Mandal, S.; Banerjee, G. Fugitive dust emission control study for a developed smart dry fog system. J. Environ. Manag. 2021, 285, 112116. [Google Scholar] [CrossRef] [PubMed]
- Zhang, C.; Yuan, S.; Zhang, N.; Li, C.; Li, H.; Yang, W. Dust-suppression and cooling effects of spray system installed between hydraulic supports in fully mechanized coal-mining face. Build. Environ. 2021, 204, 108106. [Google Scholar] [CrossRef]
- McDermott, K.; Oakley, J.G. Droplet size and distribution of nebulized 3% sodium chloride, albuterol, and epoprostenol by phase Doppler particle analyzer. Curr. Ther. Res. 2021, 94, 100623. [Google Scholar] [CrossRef]
- Li, M.; Yang, H.; Wang, J.; Li, G.; Tang, J. An experimental investigation of the impact of surface tension and viscosity on the atomization effect of a solid cone nozzle. Appl. Sci. 2023, 13, 4522. [Google Scholar] [CrossRef]
- Husted, B.P.; Petersson, P.; Lund, I.; Holmstedt, G. Comparison of PIV and PDA droplet velocity measurement techniques on two high-pressure water mist nozzles. Fire Saf. J. 2009, 44, 1030–1045. [Google Scholar] [CrossRef]
- Gong, Z. Single Particle Studies Using Optical Trapping and Manipulation; Mississippi State University: Starkville, MS, USA, 2019. [Google Scholar]
- Nuyttens, D.; Baetens, K.; De Schampheleire, M.; Sonck, B. Effect of nozzle type, size and pressure on spray droplet characteristics. Biosyst. Eng. 2007, 97, 333–345. [Google Scholar] [CrossRef]
- Perinelli, D.R.; Cespi, M.; Lorusso, N.; Palmieri, G.F.; Bonacucina, G.; Blasi, P. Surfactant self-assembling and critical micelle concentration: One approach fits all? Langmuir 2020, 36, 5745–5753. [Google Scholar] [CrossRef]
- Wojciechowski, K. Surface tension of native and modified plant seed proteins. Adv. Colloid Interface Sci. 2022, 302, 102641. [Google Scholar] [CrossRef]
- Zhou, L.; Wang, C.; Li, H.; Shi, W.; Cheng, X.; Tian, Y.; Zhu, J.; Ma, Q.; Zhang, K. Design and evaluation of a novel dispersant with “surface-to-surface” adsorption function for preparing low-rank coal water slurry. Colloids Surf. A Physicochem. Eng. Asp. 2023, 677, 132357. [Google Scholar] [CrossRef]
- Khodaparast, S.; Marcos, J.; Sharratt, W.N.; Tyagi, G.; Cabral, J.T. Surface-induced crystallization of sodium dodecyl sulfate (SDS) micellar solutions in confinement. Langmuir 2020, 37, 230–239. [Google Scholar] [CrossRef] [PubMed]
- Ivanova, A.A.; Phan, C.; Barifcani, A.; Iglauer, S.; Cheremisin, A.N. Effect of nanoparticles on viscosity and interfacial tension of aqueous surfactant solutions at high salinity and high temperature. J. Surfactants Deterg. 2020, 23, 327–338. [Google Scholar] [CrossRef]
- Ji, X.; Wang, X.; Zhang, Y.; Zang, D. Interfacial viscoelasticity and jamming of colloidal particles at fluid–fluid interfaces: A review. Rep. Prog. Phys. 2020, 83, 126601. [Google Scholar] [CrossRef]
- Tang, H.; Zhao, L.; Sun, W.; Hu, Y.; Han, H. Surface characteristics and wettability enhancement of respirable sintering dust by nonionic surfactant. Colloids Surf. A Physicochem. Eng. Asp. 2016, 509, 323–333. [Google Scholar] [CrossRef]
- Han, F.; Peng, Y.; Zhao, Y.; Yang, P.; Hu, F. Comparative investigation of methods for evaluating the wettability of dust suppression reagents on coal dust. J. Mol. Liq. 2024, 399, 124380. [Google Scholar] [CrossRef]
- Delahaije, R.J.; Sagis, L.M.; Yang, J. Impact of particle sedimentation in pendant drop tensiometry. Langmuir 2022, 38, 10183–10191. [Google Scholar] [CrossRef]
- Privitera, S.; Cerruto, E.; Manetto, G.; Lupica, S.; Nuyttens, D.; Dekeyser, D.; Zwertvaegher, I.; Júnior, M.R.F.; Vargas, B.C. Comparison between Liquid Immersion, Laser Diffraction, PDPA, and Shadowgraphy in Assessing Droplet Size from Agricultural Nozzles. Agriculture 2024, 14, 1191. [Google Scholar] [CrossRef]
- Sijs, R.; Kooij, S.; Holterman, H.; Van De Zande, J.; Bonn, D. Drop size measurement techniques for sprays: Comparison of image analysis, phase Doppler particle analysis, and laser diffraction. AIP Adv. 2021, 11, 015315. [Google Scholar] [CrossRef]
- Masci, F.J.; Laher, R.R.; Rusholme, B.; Shupe, D.L.; Groom, S.; Surace, J.; Jackson, E.; Monkewitz, S.; Beck, R.; Flynn, D. The zwicky transient facility: Data processing, products, and archive. Publ. Astron. Soc. Pac. 2018, 131, 018003. [Google Scholar] [CrossRef]
- Martinez, G.L.; Poursadegh, F.; Magnotti, G.M.; Matusik, K.E.; Duke, D.J.; Knox, B.W.; Kastengren, A.L.; Powell, C.F.; Genzale, C.L. Measurement of Sauter mean diameter in diesel sprays using a scattering–absorption measurement ratio technique. Int. J. Engine Res. 2019, 20, 6–17. [Google Scholar] [CrossRef]
- Zhang, W.; Xue, S.; Tu, Q.; Shi, G.; Zhu, Y. Study on the distribution characteristics of dust with different particle sizes under forced ventilation in a heading face. Powder Technol. 2022, 406, 117504. [Google Scholar] [CrossRef]
- Szalay, J.; Poppe, A.; Agarwal, J.; Britt, D.; Belskaya, I.; Horányi, M.; Nakamura, T.; Sachse, M.; Spahn, F. Dust phenomena relating to airless bodies. Space Sci. Rev. 2018, 214, 98. [Google Scholar] [CrossRef]
- Leitner, P. Influences on the Efficiency of Water-Based Dust Binding and the Effects of Dust. Master’s Thesis, Montanuniversitaet Leoben, Leoben, Austria, 2022. [Google Scholar]
- Picotti, G.; Borghesani, P.; Cholette, M.; Manzolini, G. Soiling of solar collectors–Modelling approaches for airborne dust and its interactions with surfaces. Renew. Sustain. Energy Rev. 2018, 81, 2343–2357. [Google Scholar] [CrossRef]
- Wang, H.; Wei, X.; Du, Y.; Wang, D. Effect of water-soluble polymers on the performance of dust-suppression foams: Wettability, surface viscosity and stability. Colloids Surf. A Physicochem. Eng. Asp. 2019, 568, 92–98. [Google Scholar] [CrossRef]
- Naidu, H.; Kahraman, O.; Feng, H. Novel applications of ultrasonic atomization in the manufacturing of fine chemicals, pharmaceuticals, and medical devices. Ultrason. Sonochemistry 2022, 86, 105984. [Google Scholar] [CrossRef]
- Pascuzzi, S.; Manetto, G.; Santoro, F.; Cerruto, E. A brief review of nozzle spray drop size measurement techniques. In Proceedings of the 2021 IEEE International Workshop on Metrology for Agriculture and Forestry (MetroAgriFor), Munich, Germany, 3–5 November 2021; pp. 351–355. [Google Scholar]
- Sharma, N.; Bachalo, W.D.; Agarwal, A.K. Spray droplet size distribution and droplet velocity measurements in a firing optical engine. Phys. Fluids 2020, 32, 023304. [Google Scholar] [CrossRef]
- Camacho-Lie, M.; Antonio-Gutiérrez, O.; López-Díaz, A.S.; López-Malo, A.; Ramírez-Corona, N. Factors influencing droplet size in pneumatic and ultrasonic atomization and its application in food processing. Discov. Food 2023, 3, 23. [Google Scholar] [CrossRef]
- Milanowski, M.; Subr, A.; Combrzyński, M.; Różańska-Boczula, M.; Parafiniuk, S. Effect of adjuvant, concentration and water type on the droplet size characteristics in agricultural nozzles. Appl. Sci. 2022, 12, 5821. [Google Scholar] [CrossRef]
- Kakarlapudi, V.V.S.S.N. Loads Identification, Design Optimization and Metal Additive Manufacturing of a Sailboat Propeller’s Blade. 2019. Available online: https://www.politesi.polimi.it/handle/10589/164602 (accessed on 1 April 2025).
- Raiola, L. Mesh Analysis and Topological Optimization of a Drone Propeller Using CFD Software. Ph.D. Thesis, Politecnico di Torino, Turin, Italy, 2020. [Google Scholar]
Disclaimer/Publisher’s Note: The statements, opinions and data contained in all publications are solely those of the individual author(s) and contributor(s) and not of MDPI and/or the editor(s). MDPI and/or the editor(s) disclaim responsibility for any injury to people or property resulting from any ideas, methods, instructions or products referred to in the content. |
© 2025 by the authors. Licensee MDPI, Basel, Switzerland. This article is an open access article distributed under the terms and conditions of the Creative Commons Attribution (CC BY) license (https://creativecommons.org/licenses/by/4.0/).