Article

Experimental Study on Mechanical Properties of Mask-Improved Calcareous Sand

1
College of Water Resources & Civil Engineering, Hunan Agricultural University, Changsha 410128, China
2
School of Civil Engineering, Hunan University of Science and Technology, Xiangtan 411100, China
*
Authors to whom correspondence should be addressed.
Appl. Sci. 2025, 15(9), 4888; https://doi.org/10.3390/app15094888
Submission received: 31 December 2024 / Revised: 7 April 2025 / Accepted: 22 April 2025 / Published: 28 April 2025

Abstract

:
Due to the widespread prevalence of respiratory diseases such as COVID-19 and H1N1, the use of disposable masks has increased significantly. Consequently, the environmental issues arising from their accumulation have become increasingly severe. This study, therefore, aims to investigate the potential of using masks as soil reinforcement materials. This study conducted triaxial and seepage tests on mask–calcareous sand mixtures with varying ratios to examine the effects of mask content on the strength, modulus, particle fragmentation, and permeability coefficient of calcareous sand, as well as the influence of different mask sizes on shear strength and shear dilation. The results demonstrate that with an increase in mask content, the peak stress ratio of the mask–calcareous sand mixture increases by 4% per level, and the internal friction angle rises by approximately 1.6% per level. Conversely, water permeability and shear swelling are reduced, and particle loss decreases by over 70%. The reinforcing effect of the mask is attributed to the high friction between the mask and the calcareous sand at the contact interface, which restricts the movement of soil particles during deformation, thereby enhancing the overall strength of the mixture. Among the three mask sizes, the smallest mask–calcareous sand mixture exhibited the greatest improvement in shear strength, and the shear shrinkage effect was more pronounced. This indicates that particle size also significantly influences the mechanical properties of the mixtures. The reinforcing effect of the mask on the soil results from the high friction at the interface between the mask and the calcareous sand. When the soil deforms, the mask enhances the overall strength of the mixture by restricting the movement of soil particles. Considering the impact of masks on the performance of calcareous sand, it can be concluded that the optimal mass content of masks is 0.3%. This study offers a new perspective on the reuse of discarded masks in civil engineering applications.

1. Introduction

Amid the ongoing COVID-19 pandemic and the heightened public awareness of epidemic prevention, the consumption of disposable medical masks has risen substantially [1]. The Mask Market—Global Outlook and Forecast 2021–2026 indicates that an increasing number of individuals will use masks as a preventive measure, and this trend is expected to persist over the long term. The primary material of disposable medical masks is polypropylene fiber [2]. Common disposal methods include chemical degradation, landfilling, and incineration, each of which has its own limitations. Chemical degradation treatments are costly, require long reaction times, and necessitate high temperatures or pressures as reaction conditions [3]. Landfilling of discarded masks causes them to migrate randomly under the influence of rainwater, occupying land [4]. Incineration releases large amounts of toxins and carbon dioxide [5]. These suboptimal waste disposal methods have resulted in a significant accumulation of discarded masks [6]. Disposable medical masks take hundreds of years to fully degrade in nature [2], This will impose a significant environmental burden [7,8]. Therefore, identifying an effective large-scale disposal method for discarded masks has become an urgent global issue.
Masks can be considered as special flexible fiber materials, similar to those often used to enhance the engineering properties of soils. Work on this area started in the 1980s, when Ohashi [9] proposed that fiber reinforcement technology can improve the mechanical properties of soil. Subsequently, scholars found that the incorporation of fibers can improve the shear strength and internal friction angle of soil [10], reduce the swelling of granular soil during shearing [11], and enhance the ductility of the specimen [12]. Therefore, masks should also possess the potential to enhance the mechanical properties of soil. Sun’s [13] research demonstrates that even simple heat treatment can fulfill the requirements for engineering environmental safety.
Calcareous sand represents a potential material source for the construction of offshore structures, including wind turbines, oil platforms, terminals, land reclamation, and artificial islands. However, calcareous sand exhibits distinct characteristics, such as susceptibility to breakdown, significant dilatancy, and high permeability [14,15], which can adversely affect the stability of marine structures, and the performance of calcareous sand improved by fiber reinforcement technology has attracted much attention. Wei [16] demonstrated that flexible fibers could enhance the shear strength of calcareous sand, while Zhou [17] showed that they could inhibit shear deformation. Hakimelahi [18] found that geotextiles could effectively prevent calcareous sand from breaking. Additionally, Tang [19] observed that flexible fibers could enhance the ductility and toughness of calcareous sand. These studies suggest that masks could serve as an ideal reinforcement material to improve the mechanical properties of calcareous sand, but relevant research remains limited.
Building on this, the present study aimed to investigate the feasibility of using masks as reinforcement materials for calcareous sand. Varying amounts of mask fragments were mixed with calcareous sand, and triaxial tests were subsequently conducted on the mixtures under different confining pressures. The effects of mask content on the strength and deformation of calcareous sand were then analyzed. Subsequently, following the completion of triaxial tests, sample particles were collected, dried, and sieved to investigate particle breakage in the mask–calcareous sand mixture. Finally, the permeability coefficient and particle loss of the mask–calcareous sand mixture were examined through a one-dimensional soil column penetration test. This study offers a new perspective on the reuse of discarded masks in civil construction.

2. Laboratory Testing Program

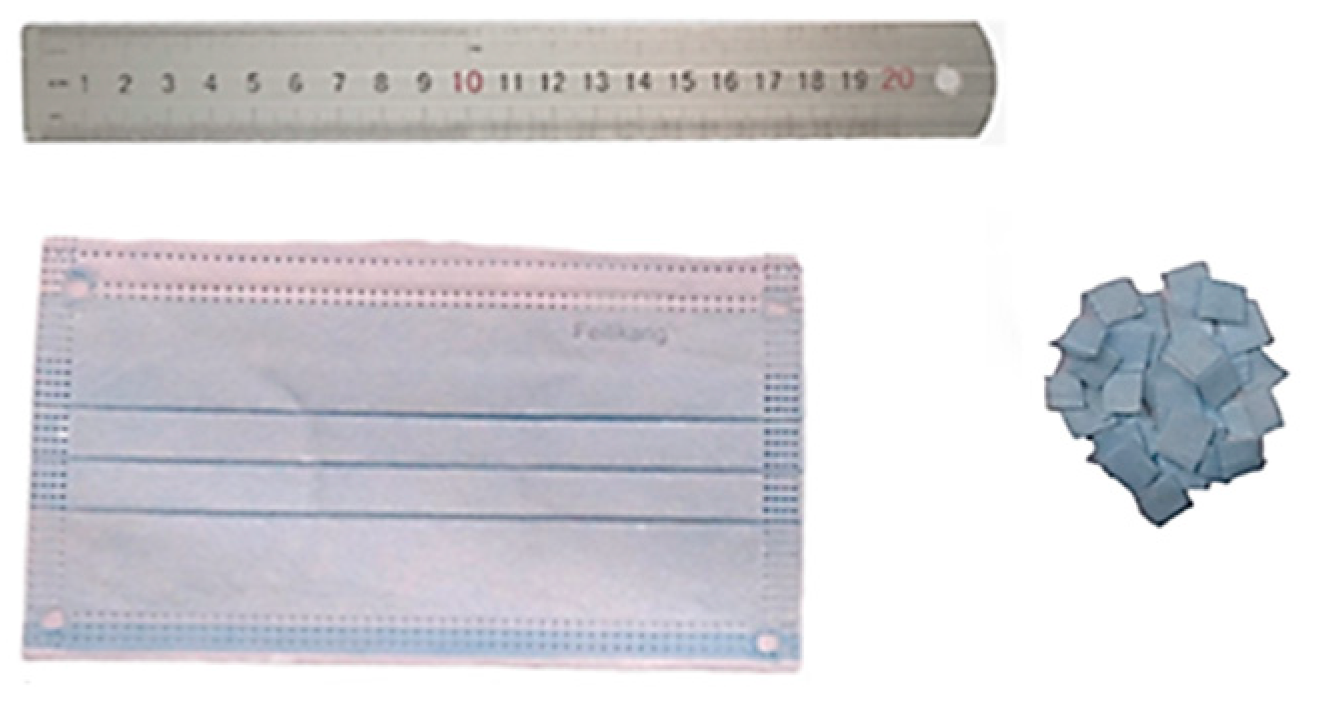
2.1. Tested Materials

In this experiment, medical masks manufactured by Anhui Subolun Garment Co., Ltd. (Tongcheng, China) were used, as shown in Figure 1. The mask consisted of 71% non-woven fabric, and 29% melt-blown fabric. Given that the mask’s dimensions exceeded the capacity of conventional testing methods, it was divided into uniform sections measuring 10 mm × 10 mm. To evaluate the influence of mask size on the mask–calcareous sand specimens, a comparative test was conducted using mask sizes of 5 mm × 5 mm and 10 mm × 20 mm.
The calcareous sand used in the experiment was sourced from an island and a reef in the South China Sea. The content of CaCO3 in the calcareous sand was 96%. The material had a relative particle density of 2.80 g/cm3, and its gradation curve is shown in Figure 2. The median particle size (d₅₀) is 0.73 mm. The coefficient of uniformity (Cu) is 2.618, and the coefficient of curvature (Cc) is 0.973. Here, d₁₀, d₃₀, and d₆₀ represent the particle diameters at 10%, 30%, and 60% passing by weight, respectively. The coefficients are calculated as follows: Cu = d₆₀/d₁₀ and Cc = (d₃₀)2/(d₁₀ × d₆₀).
Numerous studies have demonstrated that the optimal fiber volume content in fiber-reinforced soil is approximately 1.0% (equivalent to 0.6% by mass) [20,21]. Accordingly, this study investigates the mass content of four fiber contents, namely 0%, 0.3%, 0.6%, and 0.9%.
The density of the mixture was determined in accordance with the ASTM D4254 [22] and is presented in Table 1. Due to the challenges in controlling the water absorption properties of the mask material, the mixture used in the test was maintained in a completely dry state. From the table, it can be observed that both the maximum and minimum dry density of the mixture decrease with increasing mask content. Furthermore, when the mask content is low, the mixture’s density is lower than when all masks are considered as pores. This suggests that the mask can absorb compaction energy, thereby hindering the compaction of the surrounding particles.

2.2. Triaxial Test

Mask–calcareous sand mixtures, known for their excellent drainage properties, were tested using a consolidation drainage triaxial test. The testing procedure strictly followed ASTM D7181 [23] and was divided into four stages: sample preparation, saturation, consolidation, and shear. During the sample preparation stage, the specimen was compacted in three layers to achieve a relative compactness of 0.7 to obtain an equivalent initial state [24]. In the saturation stage, the pore pressure coefficient was monitored, and saturation was considered complete once it reached 0.9. In the consolidation drainage triaxial test, it is essential to maintain a uniform shear rate to facilitate uniform water discharge. The shear rate is set at 1.5 mm/min, based on the material characteristics, until an axial strain of 20% is reached [18]. Additionally, the crushing of calcareous sand increases significantly when the confining pressure exceeds 200 kPa [25]. Therefore, the confining pressures chosen for this test were 80 kPa, 200 kPa, and 500 kPa. Mixtures of mask–calcareous sand with particle sizes of 5 mm × 5 mm and 10 mm × 20 mm were subjected to testing under a confining pressure of 200 kPa. After the test, the particles were collected, dried, and sieved to determine the breaking rate. Additionally, to account for the variability inherent in a single test, the mask–calcareous sand mixtures with different mask contents were tested under three confining pressures, with each test conducted three times [26]. This experimental design allowed for a quantitative assessment of measurement uncertainty and verification of result reproducibility.
All specimens were assigned unique identifiers, as summarized in Table 2. The specimen names include “C”, “P”, and “S”, which denote mask mass content, applied pressure, and mask size, respectively. For instance, “C03P80” refers to a specimen with a mask content of 0.3% and an applied pressure of 80 kPa and “C03S55” refers to a specimen with a mask content of 0.3% and a mask size of 5 mm × 5 mm. Additionally, the rubber film thickness was 0.3 mm, which introduced an acceptable deviation in the confining pressure, as determined by the calculation method outlined in ASTM D7181 [23]. Consequently, no correction was applied to the stress–strain curve. The pre-shear pore ratio increases as the mask content rises. This is because the flexible mask can absorb compaction efforts, thereby reducing overall density and leading to a higher pre-shear pore ratio.

2.3. Penetration Test

This test was conducted following the procedures outlined in ASTM D2434 [27], using a permeameter for the constant head permeability test. The pressure hole spacing of the permeameter is 10 cm, the diameter of the seepage bucket is 100 mm, and the depth of the bucket is 345 mm. To facilitate lateral comparison with the results from triaxial tests, this test ensures that all specimens have the same relative densities as those of the triaxial samples. The test procedure is divided into the following steps: assembling the apparatus, saturating the samples, stabilizing the pressure tube, measuring the seepage volume, and timing.
Prior to testing, the pressure-measuring orifices were inspected and cleared of any obstructions to prevent erroneous readings due to clogging. To ensure homogeneity and full saturation, the specimen was compacted in successive layers (2–3 cm per layer). After each layer was placed, the water-stopping clamp was slightly opened to allow for saturation before proceeding with the next layer. Upon completing the final layer, a 2 cm gravel buffer layer (4–6 mm grain size) was placed atop the specimen to minimize internal structural disturbance caused by direct water flow. After the samples were loaded, water injection was conducted at a constant head. It is important to note that, in order to eliminate the effect of temperature on the viscosity coefficient of the water, a sufficient volume of water was prepared and stabilized in a temperature-controlled environment before each set of tests. A thermometer was used to continuously monitor the water temperature until it stabilized across all tests (with an error tolerance of ±1 °C), ensuring that the test environment remained at a constant 20 °C [28]. Once steady flow was established, as indicated by a stable reading on the gauge tube, seepage measurements were recorded. After initial data collection, the regulating tube outlet was repositioned to the middle and lower third of the specimen to alter the hydraulic gradient, with parallel tests conducted following the same protocol. Fine particles transported by the seepage flow were collected and analyzed to assess the erosion resistance of the mask fibers within the mixture.

3. Test Results and Analysis

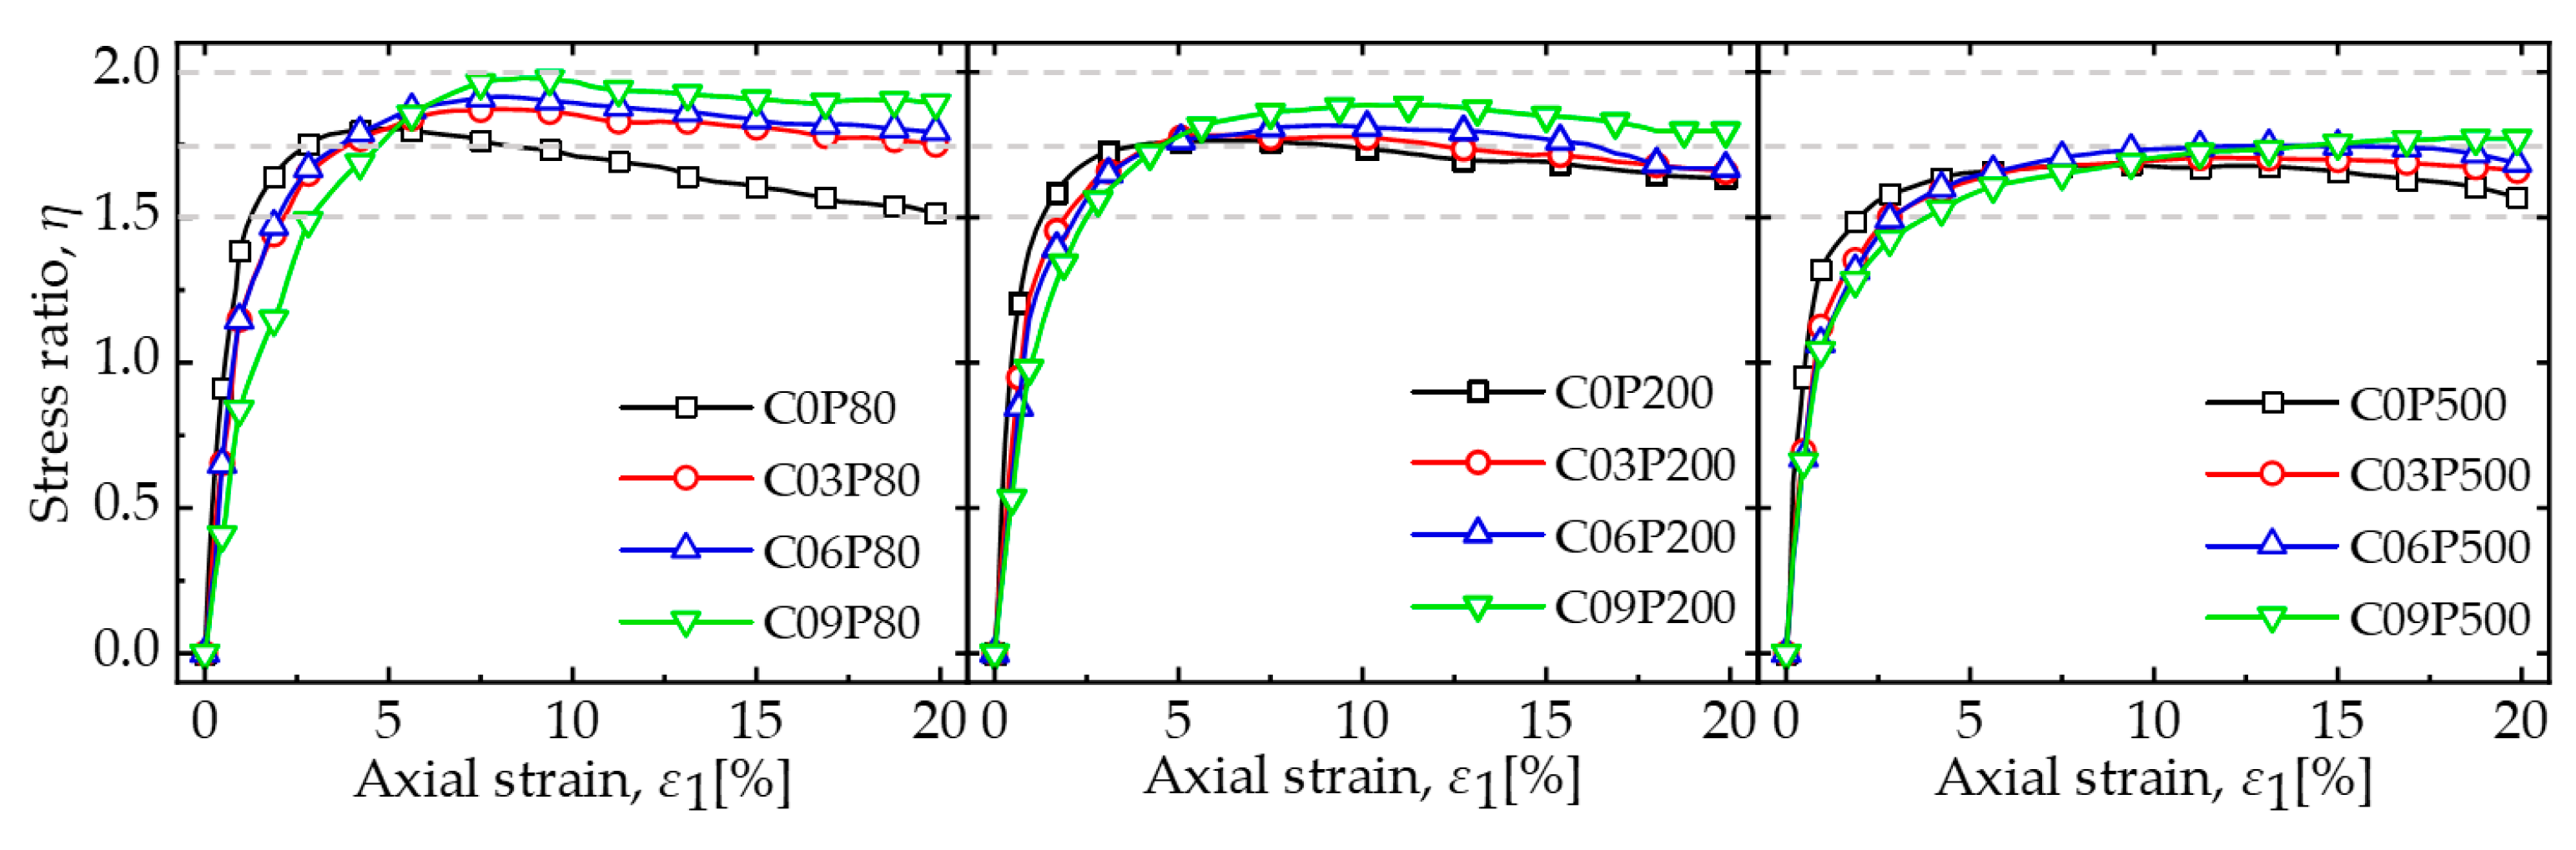
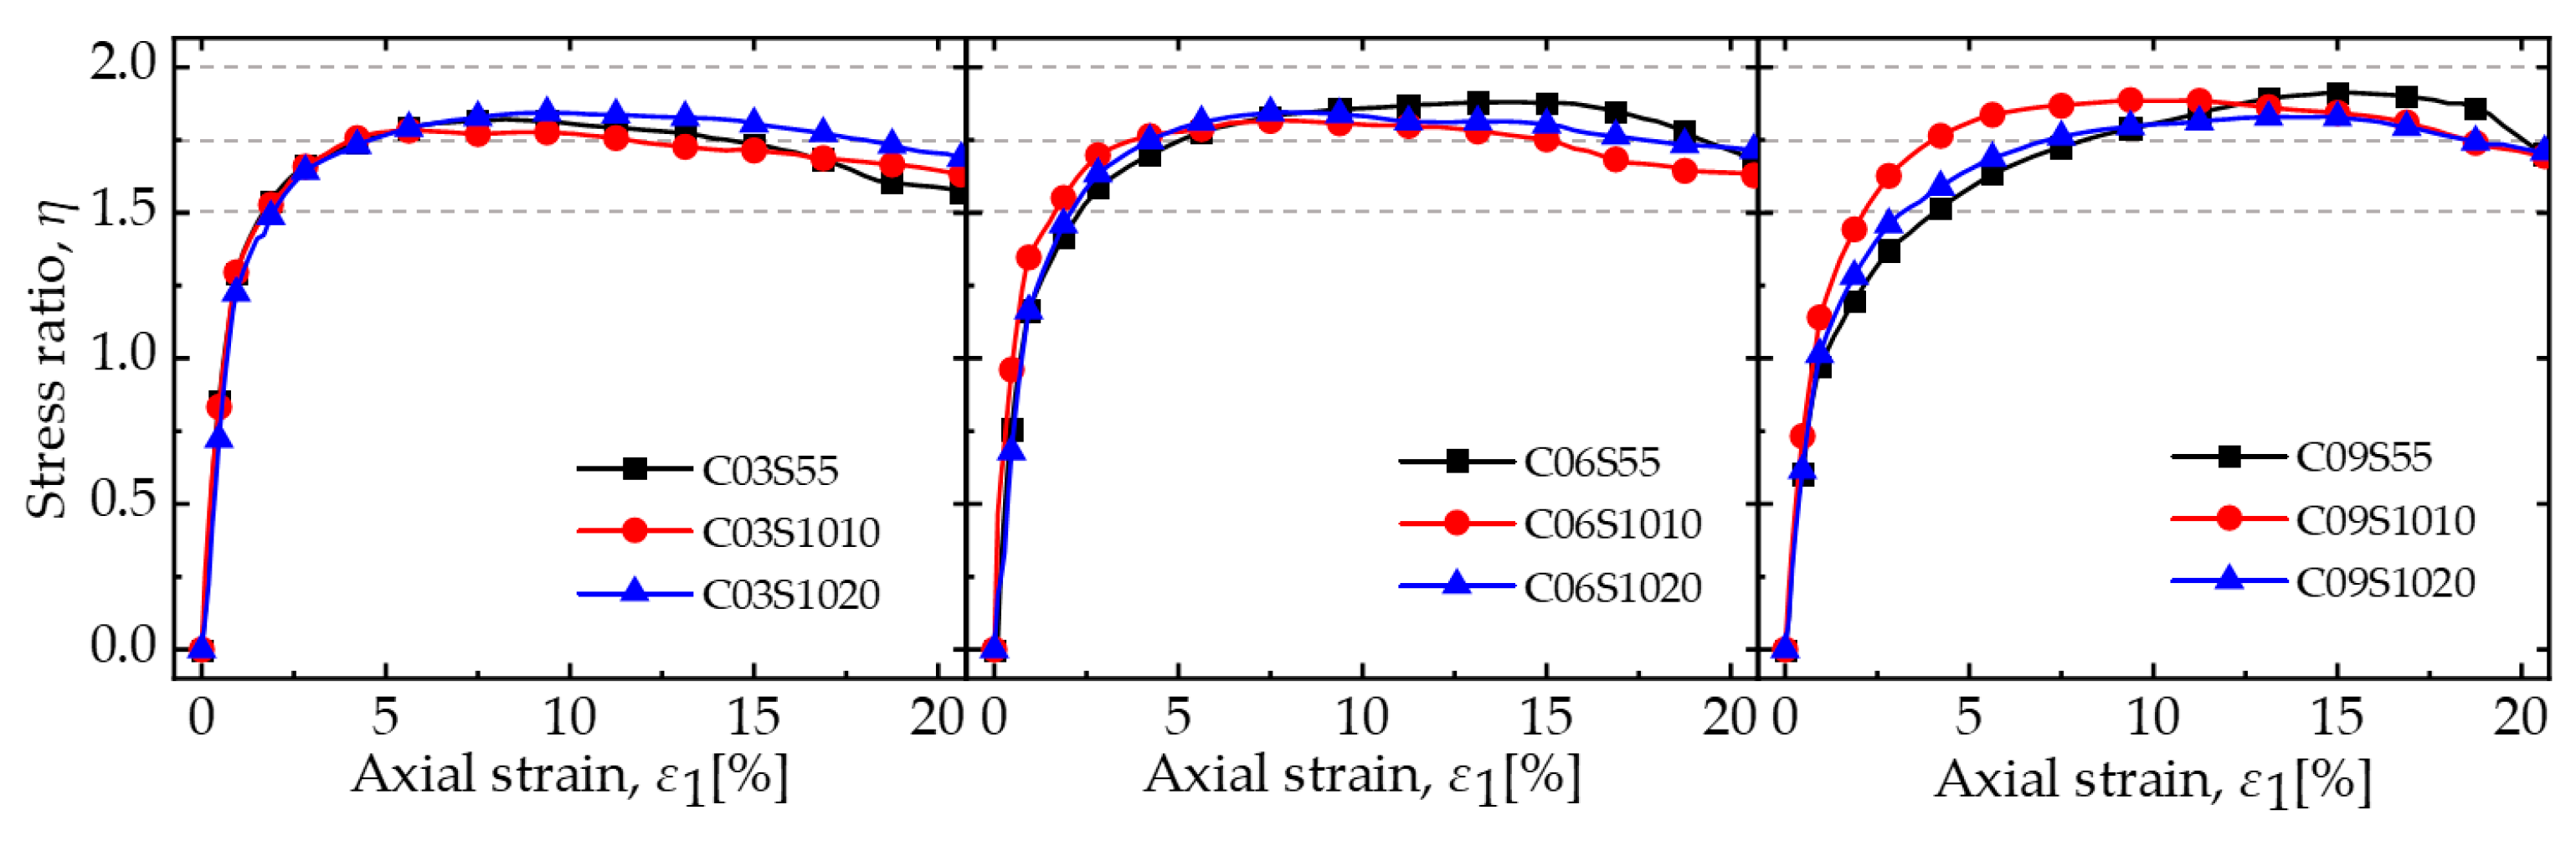
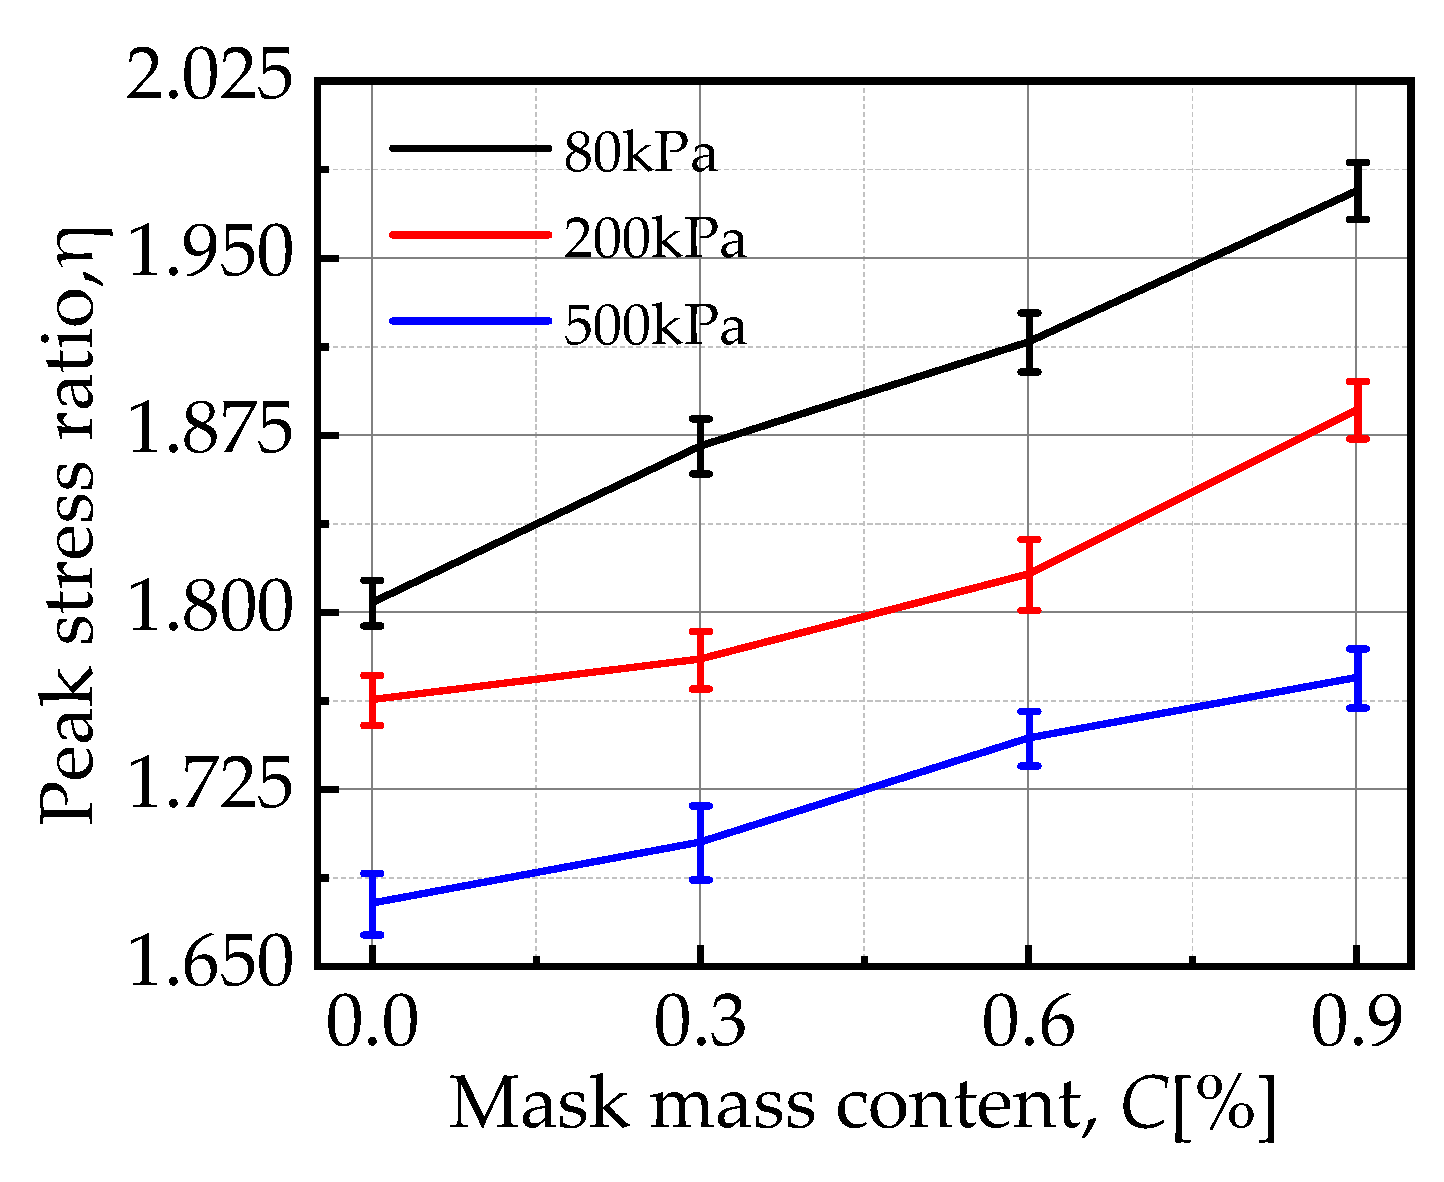
3.1. Stress–Strain Characteristics

Quantification of soil strength under triaxial stress conditions using stress ratios [26,29]:
q = σ 1 σ 3
p = ( σ 1 + 2 σ 3 ) / 3
η = q / p
where σ 1 is axial stress, σ 3 is confining pressure, q is deviatoric stress, p is effective mean stress, and η is stress ratio.
Figure 3 presents the stress–strain curves of the specimens. The stress ratio initially increases sharply to the peak value, before gradually decreasing and leveling off. As the mask content increases, the peak of the curve is delayed and becomes less pronounced, while the stress–strain relationship transitions from a softening to a hardening behavior. This suggests that the ductility of the mixture improves with increasing mask content. Furthermore, increasing the mask content results in enhanced strength of the specimens, as the mask restricts the rotation of surrounding particles due to its high coefficient of friction, thereby inhibiting their movement [30]. As the confining pressure rises, the stress peak is delayed and eventually vanishes, a phenomenon that is more pronounced in mask–calcareous sand mixtures than in conventional geotechnical materials [31,32]. The observed phenomenon can be attributed to the significant increase in pore instability around the mask, which is exacerbated by higher particle contact stress [33]. Furthermore, under high-stress conditions, the angularity of the calcareous sand surface undergoes localized fragmentation, resulting in a reduction in the coefficient of friction [26,34]. Under high confining pressure, the stress–strain curves of samples with varying mask contents exhibit greater similarity, This phenomenon reflects the weakening of the reinforcement effect of masks under high confining pressure, indicating that the mask–calcareous sand mixtures are more suitable for high-confining-pressure conditions [34].
Figure 4 presents the stress–strain curves for various mask sizes with identical mask content at an enclosure pressure of 200 kPa. For the 5 mm × 5 mm mask size, the mask–calcareous sand hybrid demonstrates superior shear strength compared to the other mask sizes. This suggests that mask size also influences the mechanical behavior of the mask–calcareous sand mixture.
Figure 5 presents the variation in peak stress ratio with mask content, as obtained from triaxial tests of each mask–calcareous sand mixture. Figure 5 illustrates the mean and standard deviation of the peak stress ratios at varying mask contents, providing a clearer correlation between peak stress ratios and mask contents. The stress ratio for each specimen exhibits minimal dispersion. As the mask content increases, the peak stress ratio increases by approximately 4.1% per stage, exhibiting a nearly linear relationship. Conversely, as the confining pressure increases, the stress ratio decreases by approximately 4.7%.
The initial modulus (defined as the tangent modulus at 1% strain) was used to assess the effect of mask content on the elastic modulus of the mixture. To minimize the influence of confining pressure, the initial modulus was calculated based on the stress ratio [35].
As shown in Figure 6, an increase in mask mass content leads to a decrease in the initial modulus. The initial modulus decreased by over 25% as the mask content increased from 0% to 0.3%. Beyond this point, the modulus stabilized before further decreasing to 10% with continued increases in mask content. Meanwhile, an increase in confining pressure leads to an increase in the initial modulus and the standard deviation exhibits greater uniformity. The increase in confining pressure led to a 25% increase in initial stiffness. Furthermore, the decrease in initial modulus due to the increase in mask content is highly correlated with the structural properties of the mask. The reduced stiffness of the specimen can be attributed to the tendency of soft materials to deform under stress, thereby creating more space for rigid particles to move. This movement helps to prevent the formation of a strong force chain that would directly resist the applied external loads [30].
Based on Mohr–Coulomb theory, the shear strength of soil is related to its normal stress, and the strength can be divided into two components: cohesion force and the internal friction angle [36]. The shear strength can be expressed as:
τ = c + σ × t a n φ
where τ is the shear strength; c is cohesion; σ is the normal stress; and φ is the internal friction angle.
Figure 7 illustrates the effect of mask content on the internal friction angle φ and cohesion force c of the specimens. As mask content increases, φ increases while c remains nearly constant. This phenomenon aligns with the behavior of traditional flexible reinforced materials [25], suggesting that flexible sheet materials can activate their internal tensile forces to restrict the movement of surrounding particles. This restriction is transmitted through the frictional forces at the contact interface.

3.2. Volume Change Characteristics

In granular materials, particles slide and rotate under shear, leading to a change in sample volume. The volumetric strain, denoted as ε V , is calculated using the following equation:
ε V = ( V 0 V ) / V 0
where V 0 and V are the pre-shear (post-consolidation) and present sample volumes, respectively.
Figure 8 illustrates the volumetric strain of each specimen under varying pressures. Positive values correspond to shear contraction, while negative values indicate dilatancy. Initially, all specimens undergo volumetric shrinkage, followed by a rapid dilatancy, and ultimately stabilize gradually [37]. The shear shrinkage tendency of calcium sand mixed with mask is more pronounced than that of plain calcium sand. Furthermore, an increase in mask content leads to greater shear shrinkage of the specimens. This suggests that the mask effectively inhibits the dilatancy of calcium sand, thereby improving the material’s service performance. The confining pressure also has a significant effect on the mixture. At confining pressure of 80 kPa and 200 kPa, the specimens initially exhibit shear shrinkage followed by dilatancy [38,39]. Specifically, while the shear expansion phenomenon remains unclear at an enclosure pressure of 500 kPa, the increase in both enclosure pressure and mask content leads to a corresponding increase in axial strain at the phase transition point (the state where the specimen reaches zero dilatancy rate). When the confining pressure reaches 500 kPa, the phase transition is substantially delayed, and the specimen exhibits shear contraction within a 20% axial strain range [39].
Figure 9 illustrates the shear deformation of mask–calcareous sand mixtures with different mask sizes, all at the same content and under identical confining pressure. The specimen with a 5 mm × 5 mm mask size appears to exhibit greater shear shrinkage during shearing, which aligns with the observed stress–strain curve.
The accuracy of the traditional constitutive model in describing the mechanical behavior of soft–rigid mixtures largely depends on the stress dilatancy relationship [40]. This relationship can be characterized by the dilatancy coefficient d ; dilatancy coefficient d can be quantified as d ε v p / d ε q p ; d ε v p and d ε q p denote incremental plastic volumetric strain and incremental plastic distortional strain, respectively [41]. From the characteristics of the stress–strain curves, the elastic strain of the mask–calcareous sand mixture is small; therefore, it is assumed that the d ε v p and d ε q p is equal to the incremental volumetric strain and the incremental distortional strain [42,43,44]. Figure 10a illustrates the relationship between stress ratio and dilatancy for the specimens at 200 kPa. With the increase in stress ratio, the curve first decreases, and then turns back and decreases after the peak stress. This phenomenon suggests that the stress ratio at the peak state is greater than that at the critical state, likely due to the specimens being prepared in a relatively dense state. The dilatancy rate serves as a critical parameter for evaluating shear strength. As the mask content increases, the dilatancy curve exhibits an upward trend. This observation suggests that the enhanced interaction between particles within the sample leads to an increase in shear strength. To quantify the impact of mask addition on the dilatancy of calcareous sand, Figure 10b shows the variation in the maximum dilatancy angle with respect to mask content under different confining pressures. It is evident that the maximum dilatancy angle decreases as both mask content and confining pressure increase, indicating that the addition of masks reduces the dilatancy degree of the samples. The standard deviation also exhibits reduced dispersion as the confining pressure increases.
The critical state represents the stable shear condition of the soil and forms the core of the cohesionless soil structural model. However, the addition of mask chips results in a delay in the critical state of calcareous sand, with most specimens failing to reach the critical state during triaxial testing. As a result, the phase transition state line, which is strongly correlated with the critical state, is employed to characterize the mechanical behavior of the material. As shown in Figure 11, the phase transition state lines for all specimens exhibit good linearity. Furthermore, increasing mask content causes an upward shift in the phase transition state line, while the slope of the curve remains unchanged. This phenomenon confirms the shear properties of the mask–calcareous sand mixture. However, a key challenge remains in accurately determining the critical state parameters of the material.

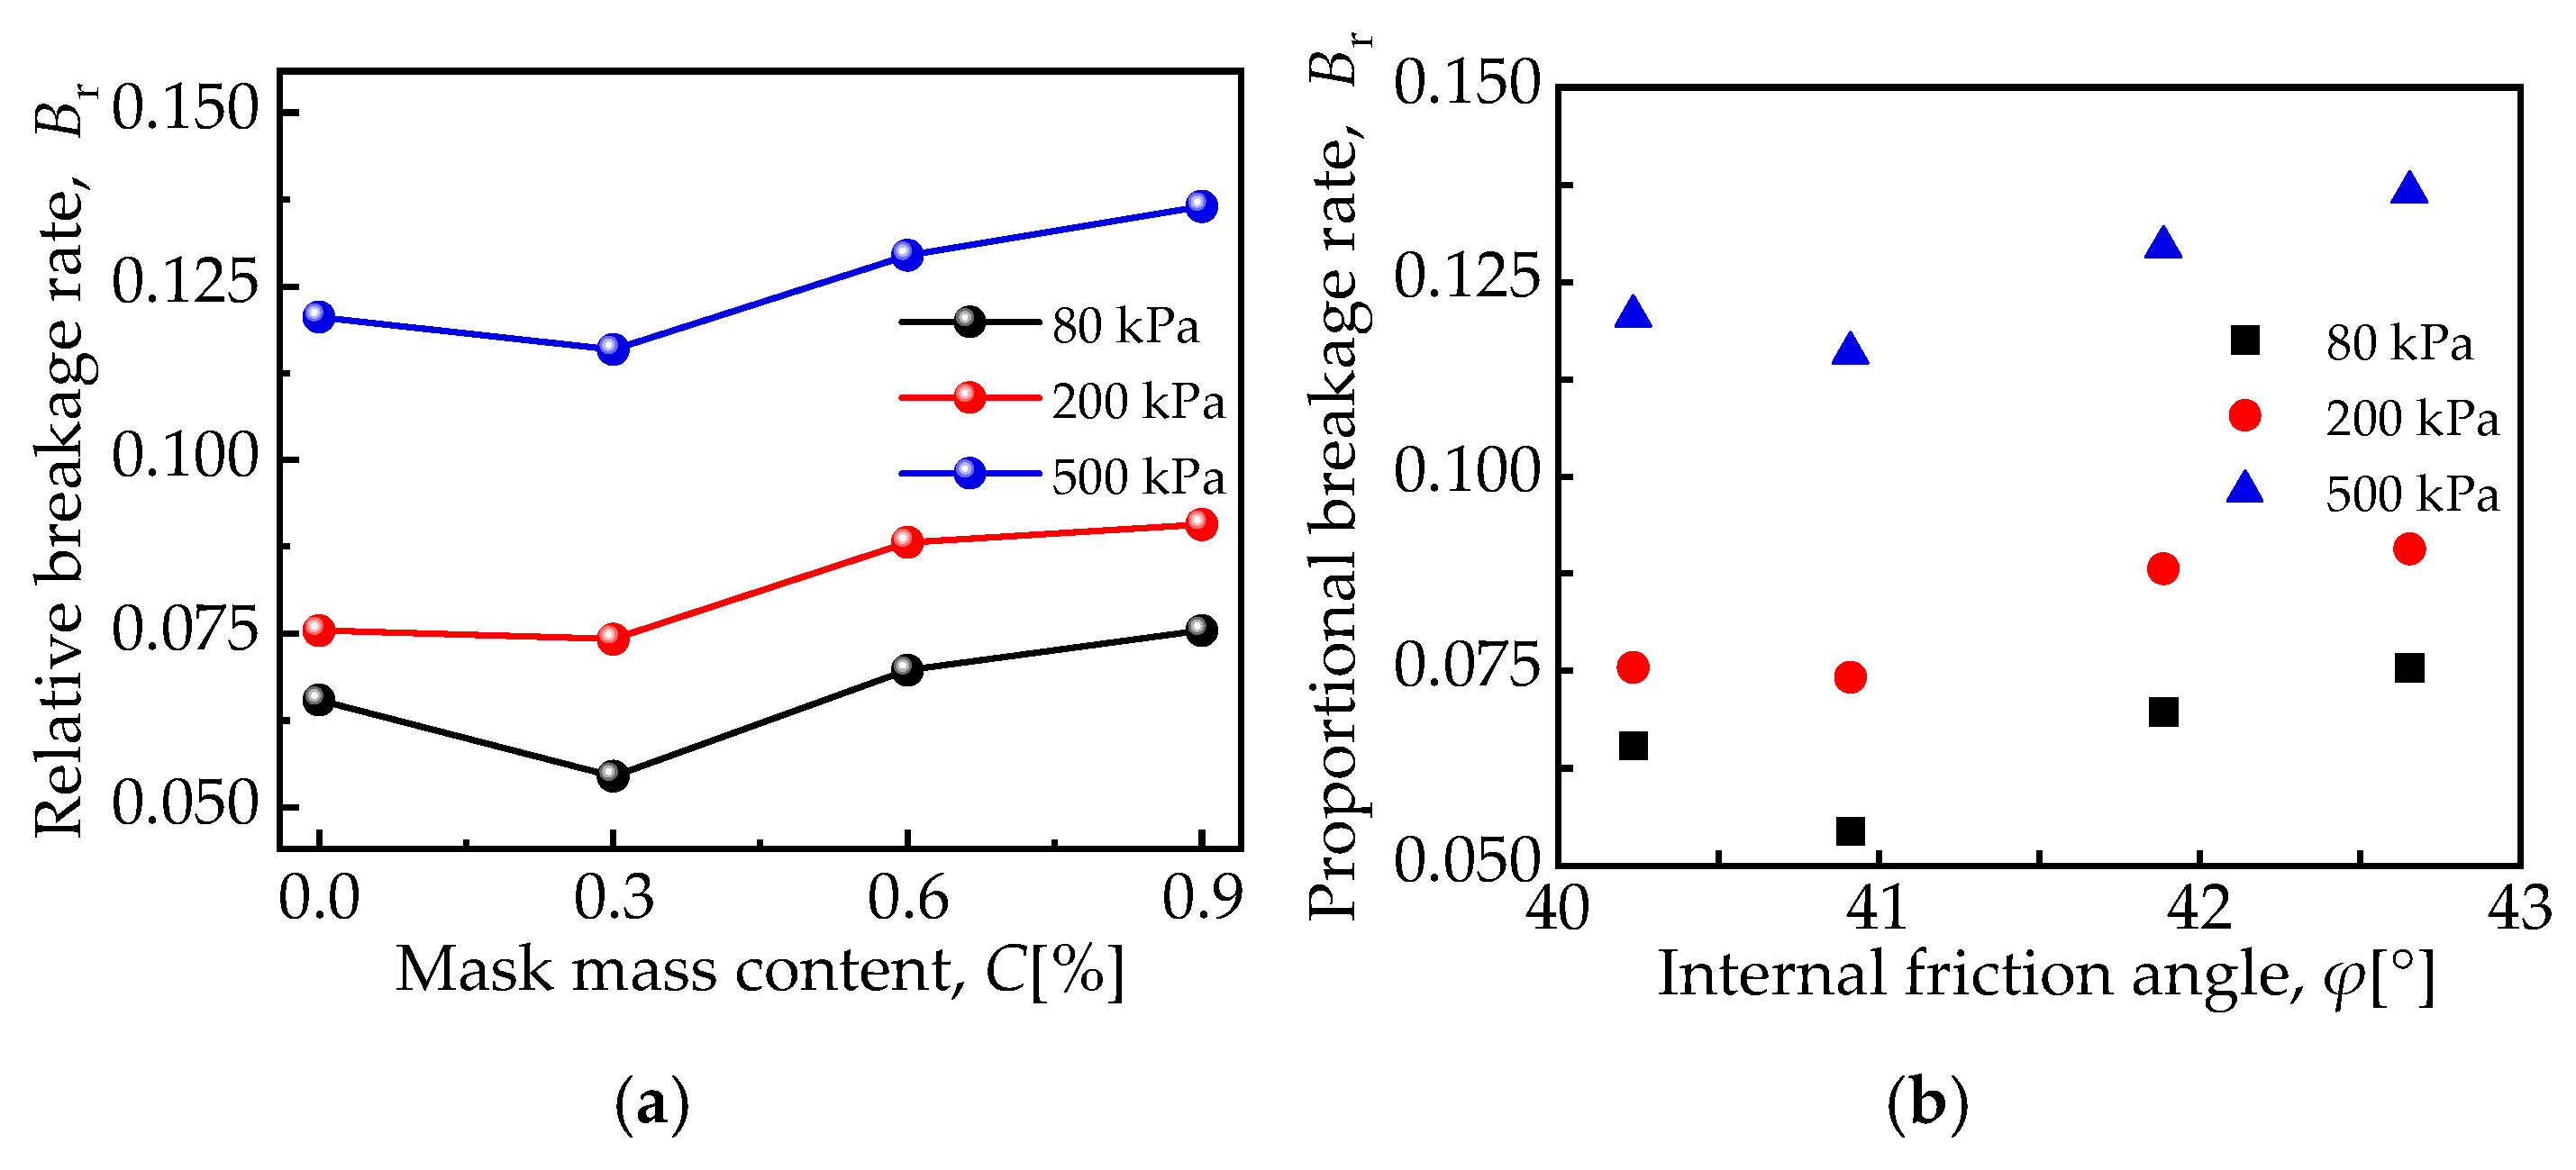
3.3. Particle Breakage Characteristics

Calcareous sand is prone to fragmentation, making it essential to investigate the effect of mask particles on sand particle breaking. The concept of particle breaking rate, introduced by Hardin, was employed to quantify particle fragmentation. It is assumed that particles smaller than 0.074 mm no longer undergo crushing [45]. The area bounded by the initial particle gradation curve and the vertical line at particle size S = 0.074 mm is termed the initial crushing potential B p o . The area enclosed by the gradation curve of the sheared specimen, the initial gradation curve, and the vertical line at S = 0.074 mm are defined as the total crushing potential B t . The relative breaking rate at this point, denoted as B r is:
B r = B t / B p o
Figure 12 illustrates the relative breakage rate B r of particles under varying confining pressures for mixtures with different mask contents. As depicted in Figure 12a, the values of B r generally increase both with higher mask content and increased confining pressure. Specifically, the average increase in B r is approximately 21% as the confining pressure rises from 80 kPa to 200 kPa, whereas the increase is around 36% when the confining pressure increases from 200 kPa to 500 kPa. This suggests a significant rise in the breaking rate of calcareous sand when the confining pressure exceeds 200 kPa, which is consistent with the observations researched by Zhang J [44,46].
At varying stress levels, the inflection point of B r was observed at 0.3% mask content, beyond which B r exhibited a positive correlation with mask content. Figure 12b illustrates the relationship between the relative fragmentation rate Br and the peak internal friction angle φ. A linear and positive correlation was found between φ and mask content. Notably, the relative fragmentation rate of particles was minimized at 0.3% mask content, indicating that the mask exerts a protective effect on the calcareous sand particles.
At different stress levels, the inflection point of Br occurred at 0.3% of mask content, after which B r was positively correlated with mask content. Figure 12b shows the relationship curve between the relative fragmentation rate B r and the peak internal friction angle φ. φ and the mask content are linearly and positively correlated, but the relative fragmentation rate of the particles is the smallest when the mask content is 0.3%, which suggests that the mask has a protective effect on the calcareous sand particles [46].
When the mask content exceeds 0.3%, Br increases with increasing φ, suggesting that while mask blending can reduce the fragmentation of calcareous sand particles, there is limited benefit in using a high mask content to further mitigate particle fragmentation.

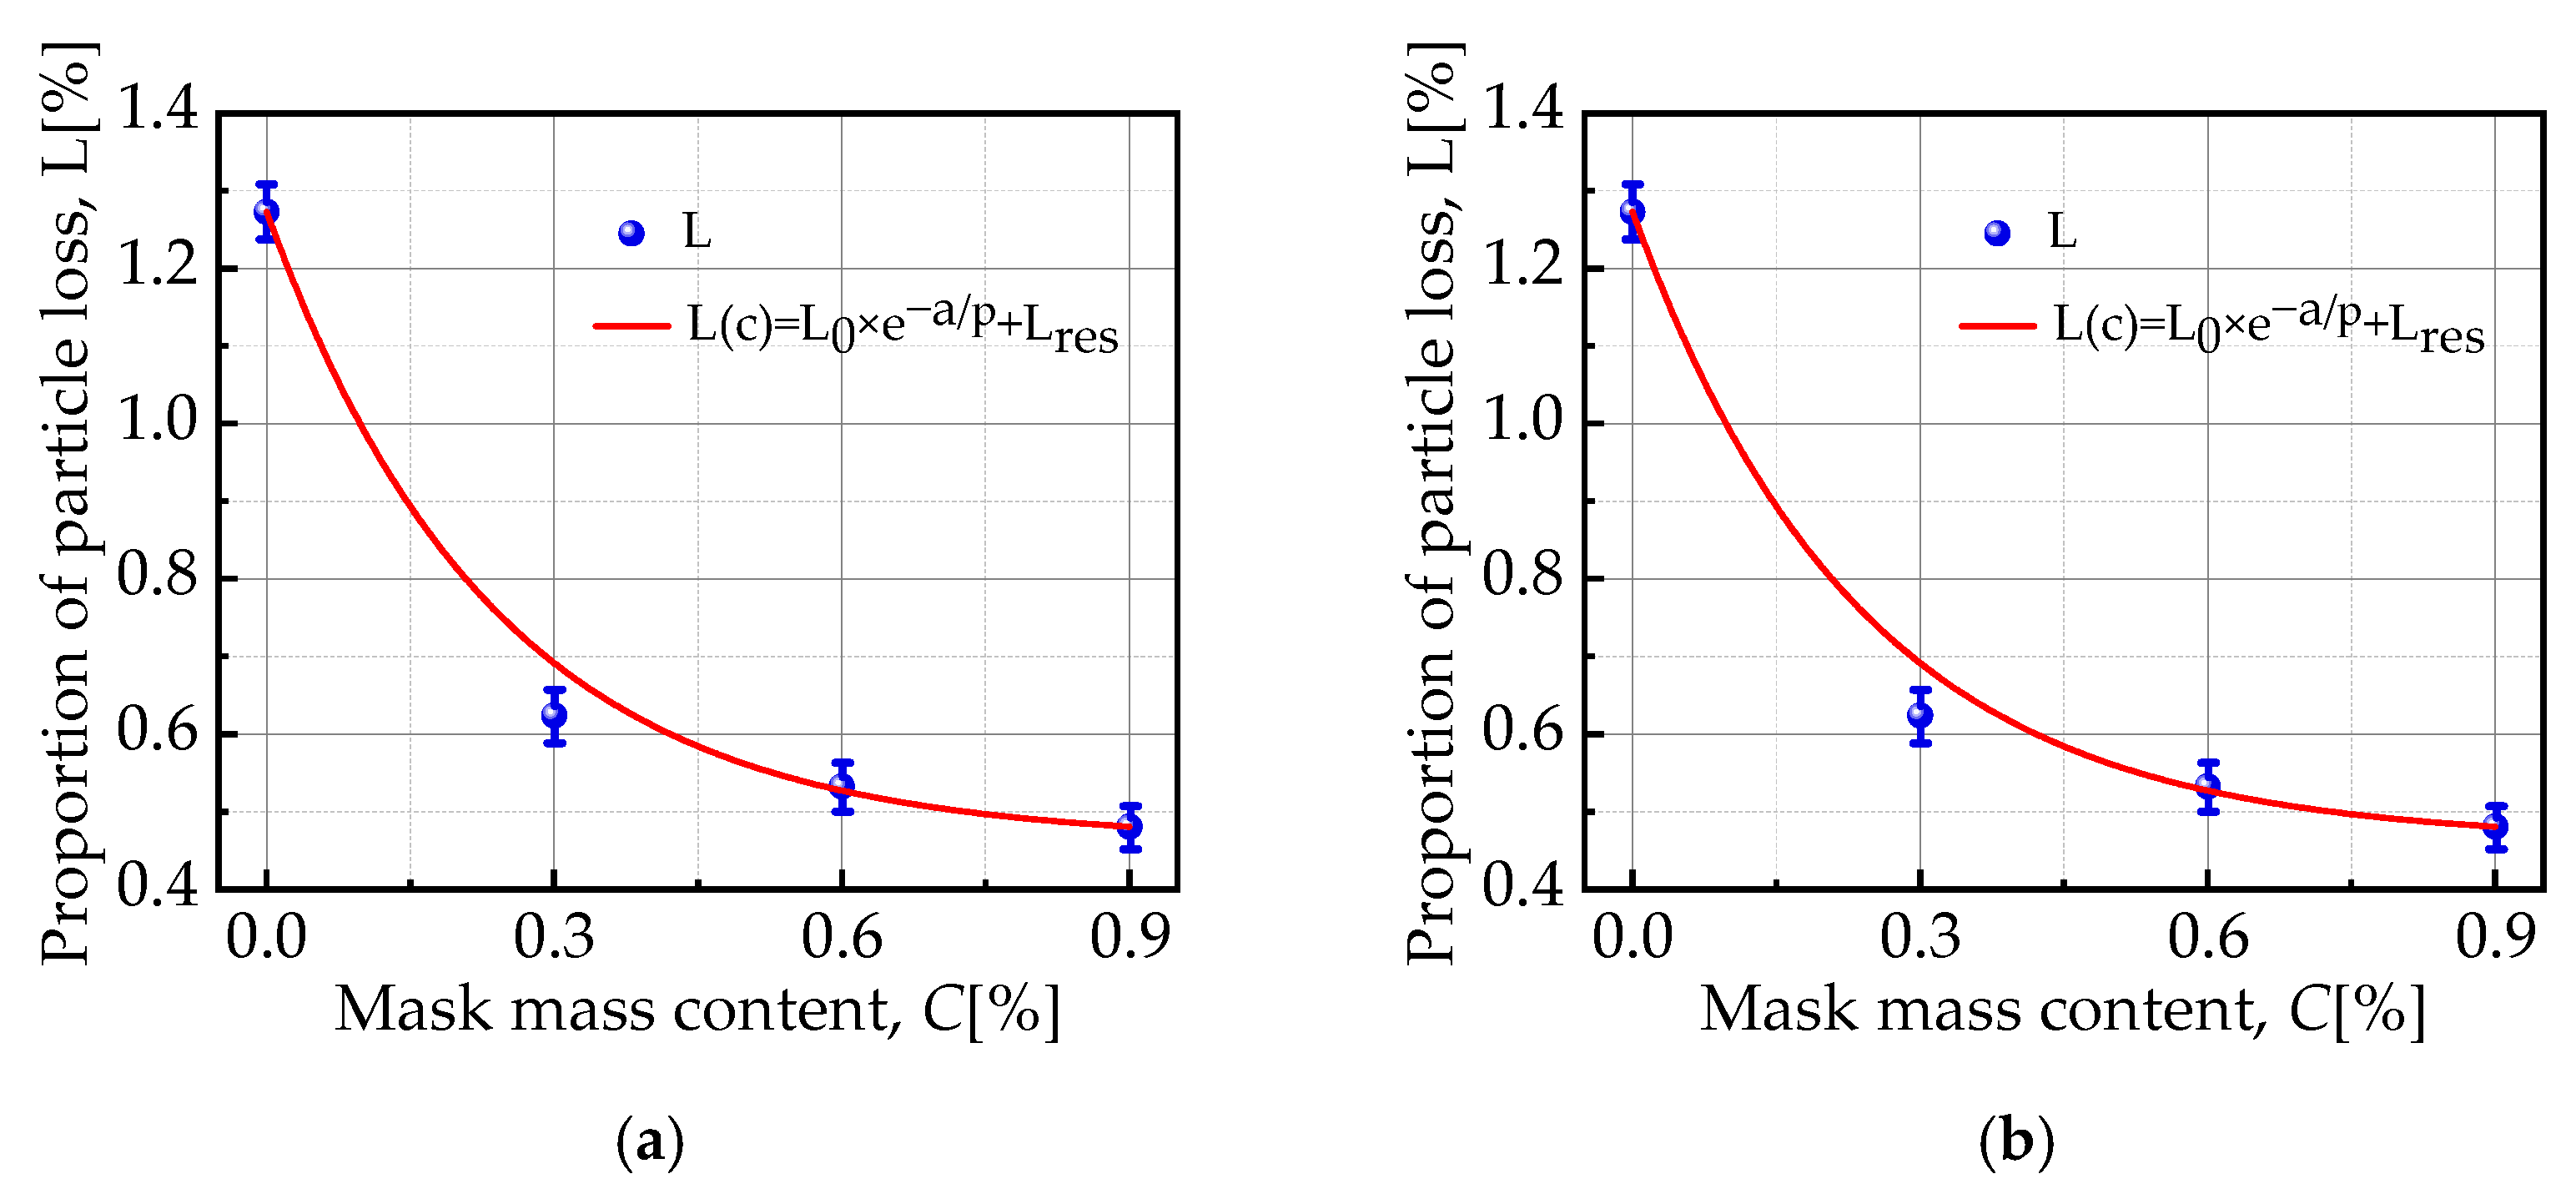
3.4. Seepage Characteristics

The permeability coefficient “ K ” is commonly used to characterize the permeability of granular materials. Its value can be calculated based on the seepage volume, the cross-sectional area of the inner ring, and the infiltration time.
K = ( Q × L ) / ( A × t × h )
where Q is the quantity of water discharged, A is the cross-sectional area of specimen, h is difference in head on manometers, L is distance between manometers, and t is total time of discharge. Additionally, during the particle infiltration performance test, fine particles washed by the water flow were collected. Due to variations in the absolute number of particles in the specimens, the particle loss ratio was used to quantify the effectiveness of the masks in resisting erosion by water flow.
The seepage test data were fitted, yielding the following expression:
L c = L 0 × e a / p + L r e s
K c = k r e s × e a / p + k 0
where L 0 is the initial attrition rate (when the mask content is 0), L r e s is the residual attrition rate (asymptotic value of the smooth segment), k 0 is the initial permeability (when the mask content is 0), k r e s is the minimum permeability (predicts permeability at maximum mask content), a is the decay rate constant (to control the rate of the descending segment), and p is the non-linear correction factor (to control the inflection point of the curve).
Figure 13 illustrates the effect of mask content on both the permeability coefficient and particle loss ratio of the samples. As the mask content increased, the permeability coefficients of the samples decreased monotonically, a trend also observed during triaxial specimen preparation, where sample saturation was slower with higher mask content [47]. Similarly, a higher mask content resulted in a lower particle loss ratio. This can be attributed to the sheet-like mask, which tightly adheres to the particles and forms a water-blocking layer within the specimen [48]. This layer disrupts the smoothness of the water flow channel [49], thereby effectively reducing particle loss. Notably, at a mask content of 0.3%, particle loss was significantly inhibited, while the water permeability of the samples was only marginally reduced.

4. Conclusions

The study investigated the effect of the mask on the mechanical behavior of calcareous sand through triaxial tests and also examined the enhancement of permeability and resistance to water erosion in calcareous sand via percolation tests. The significant application potential of this material was demonstrated, and the main findings can be summarized as follows:
(1)
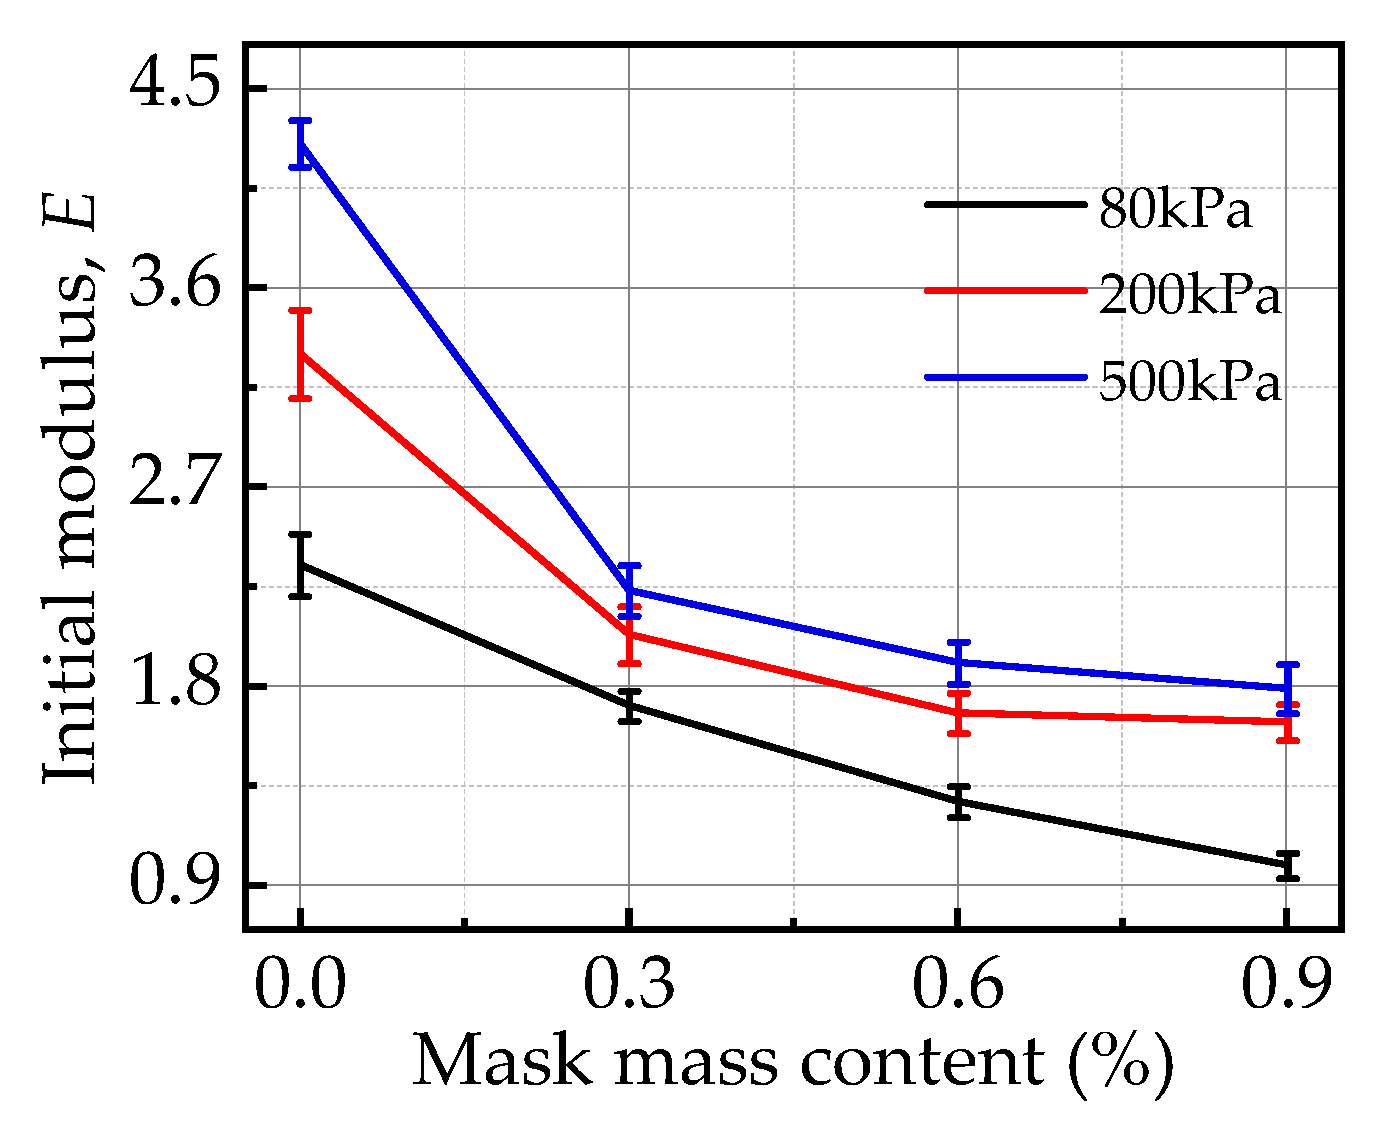
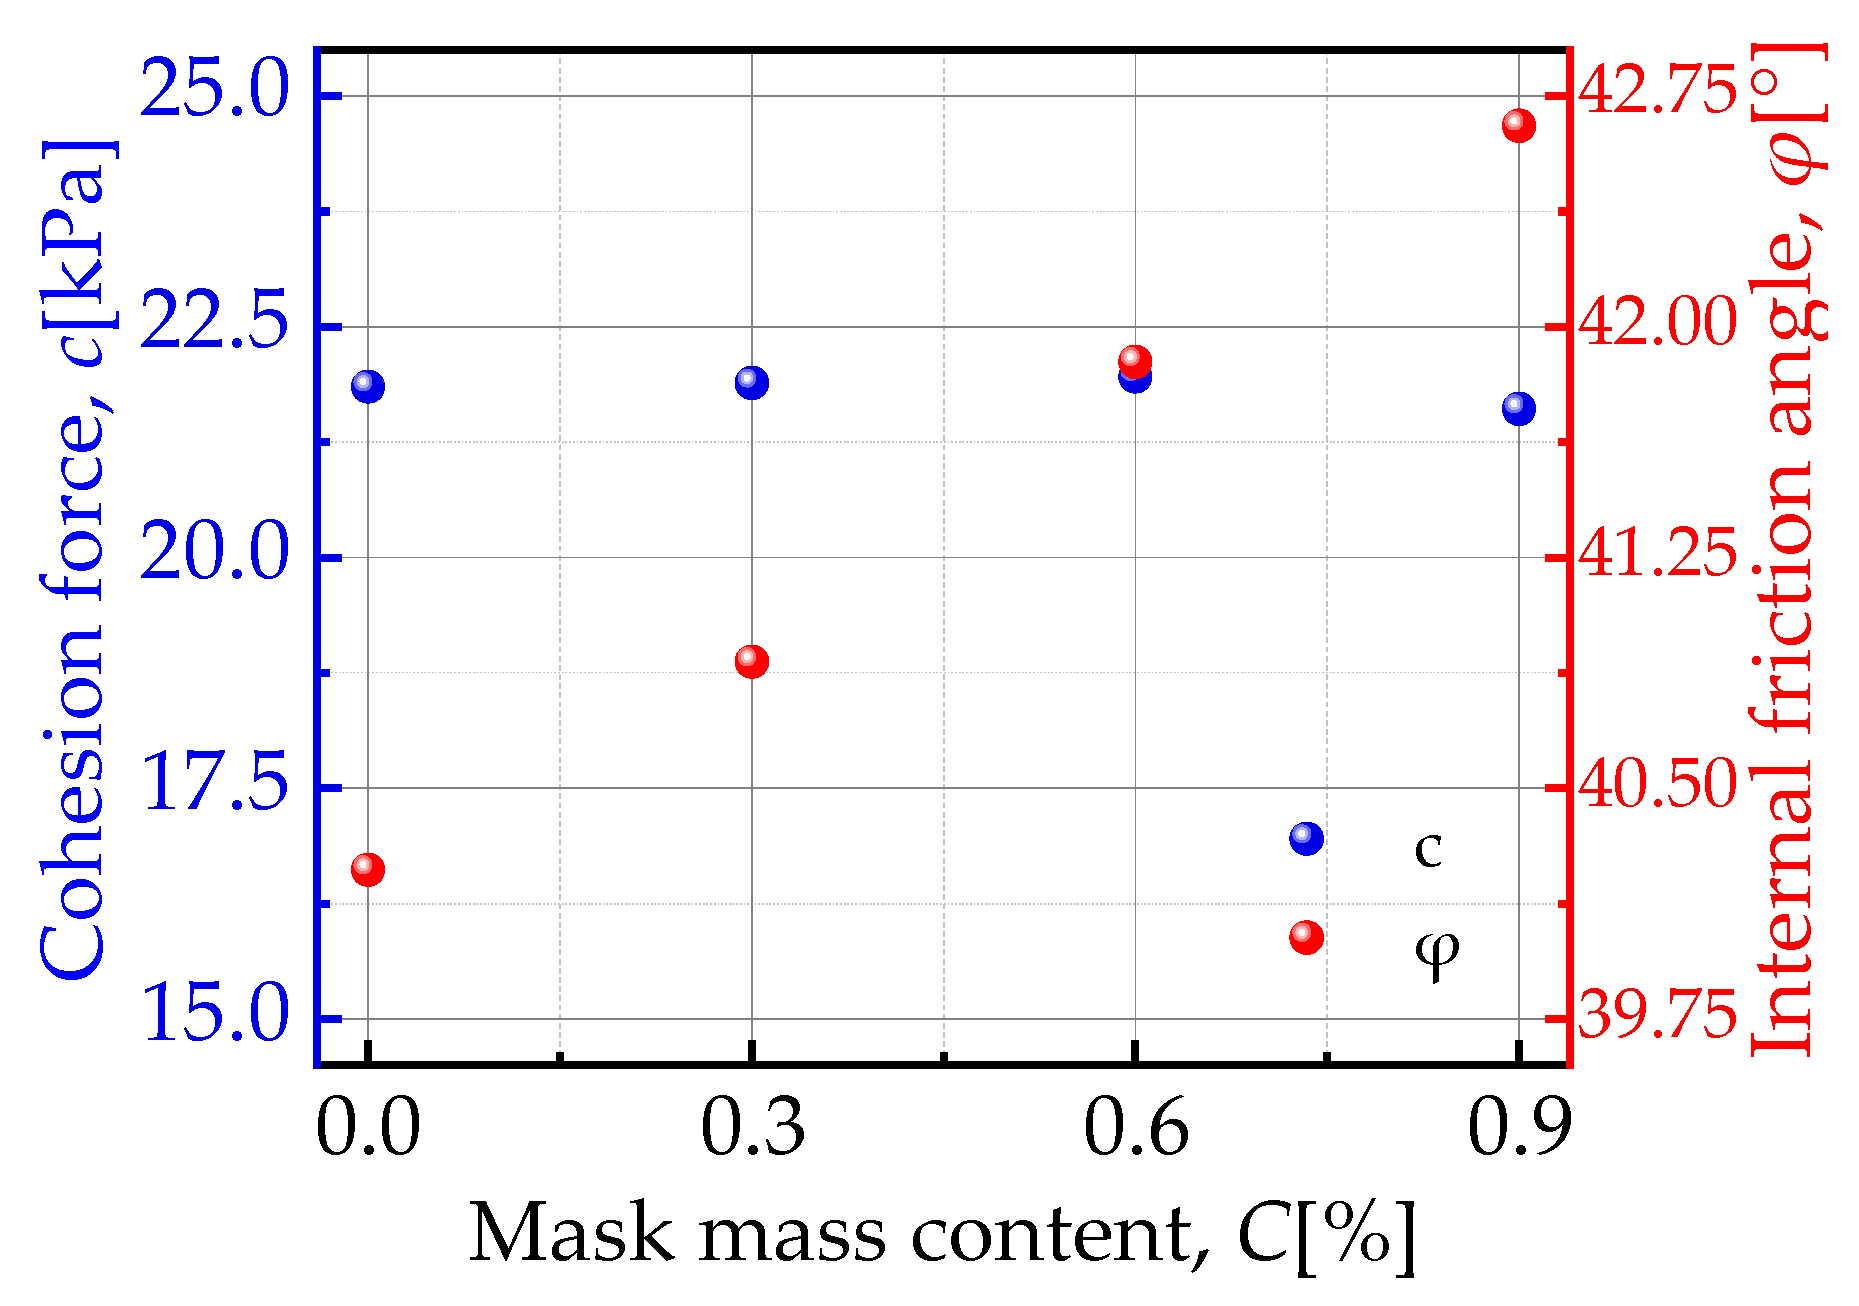
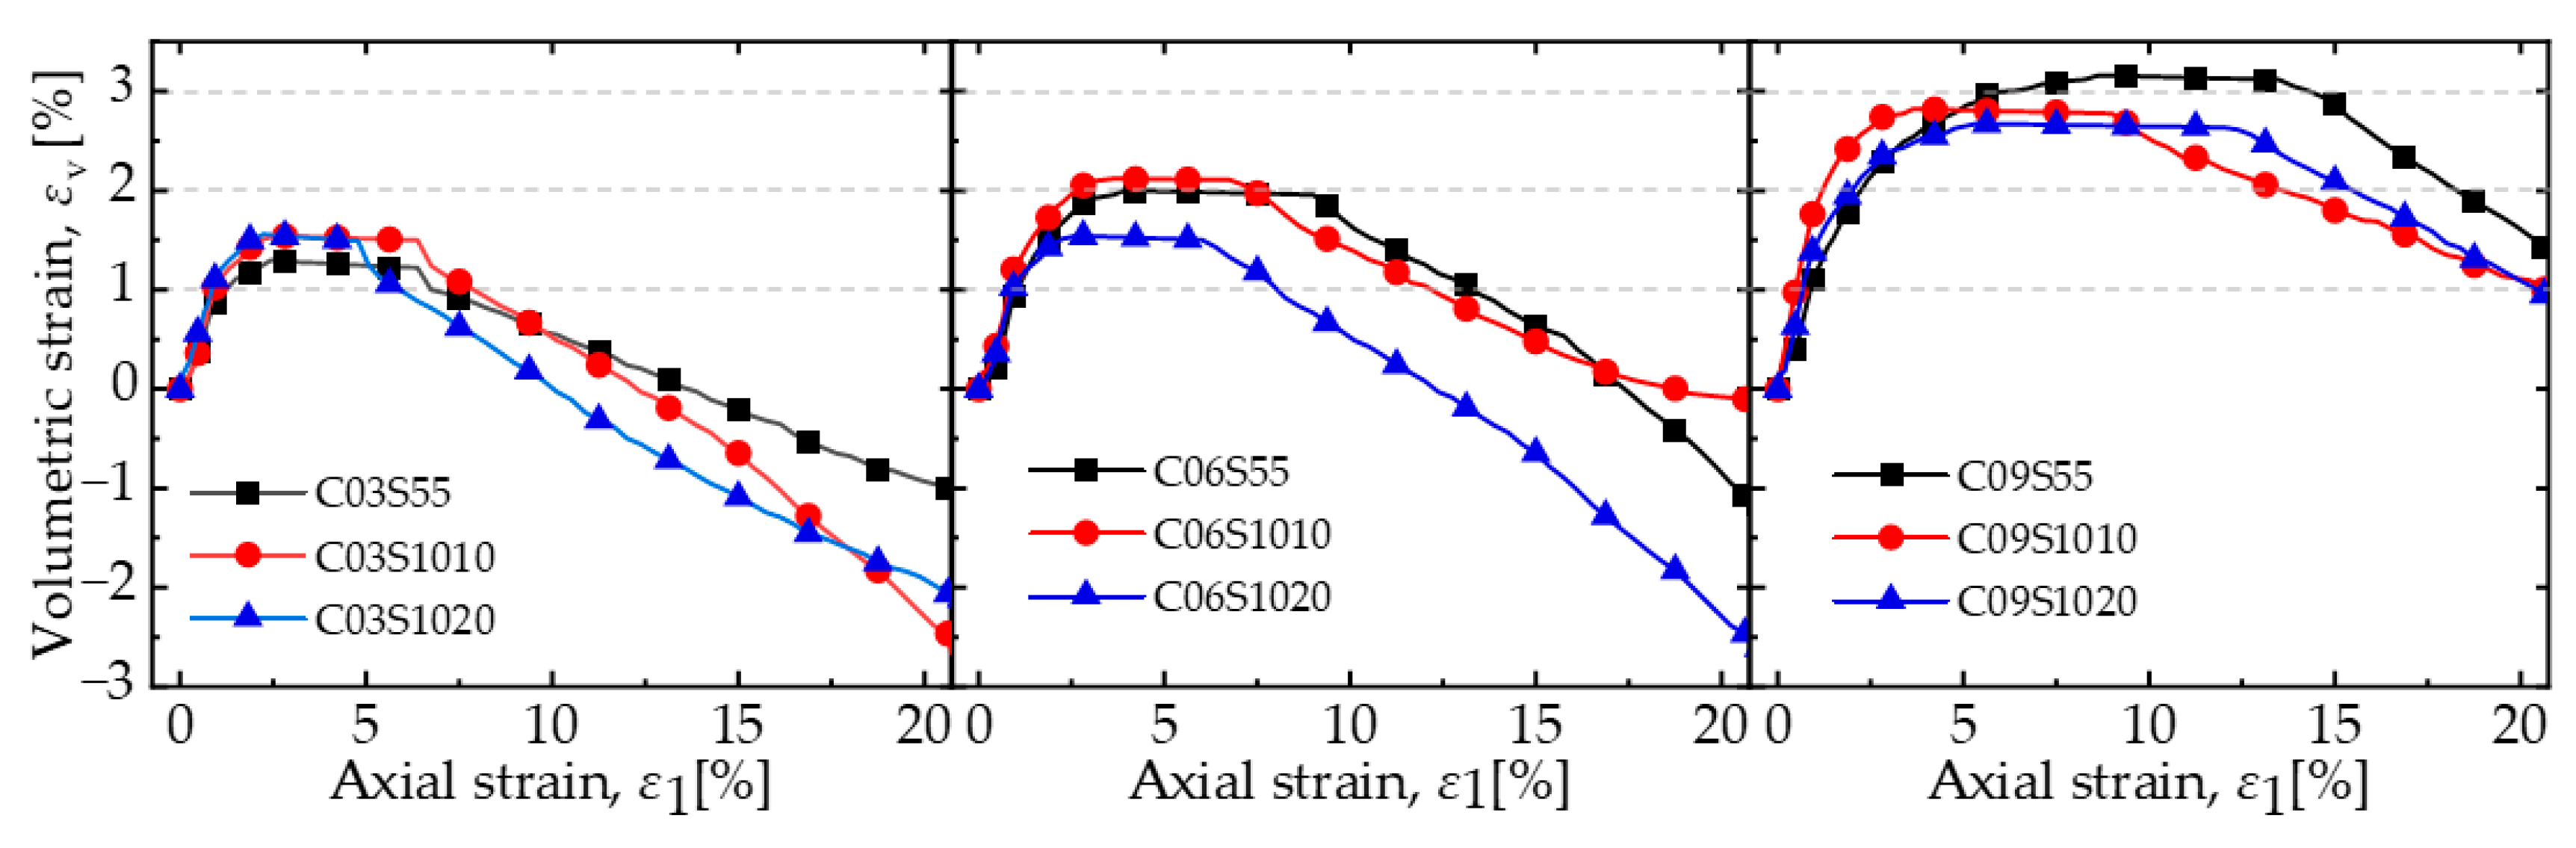
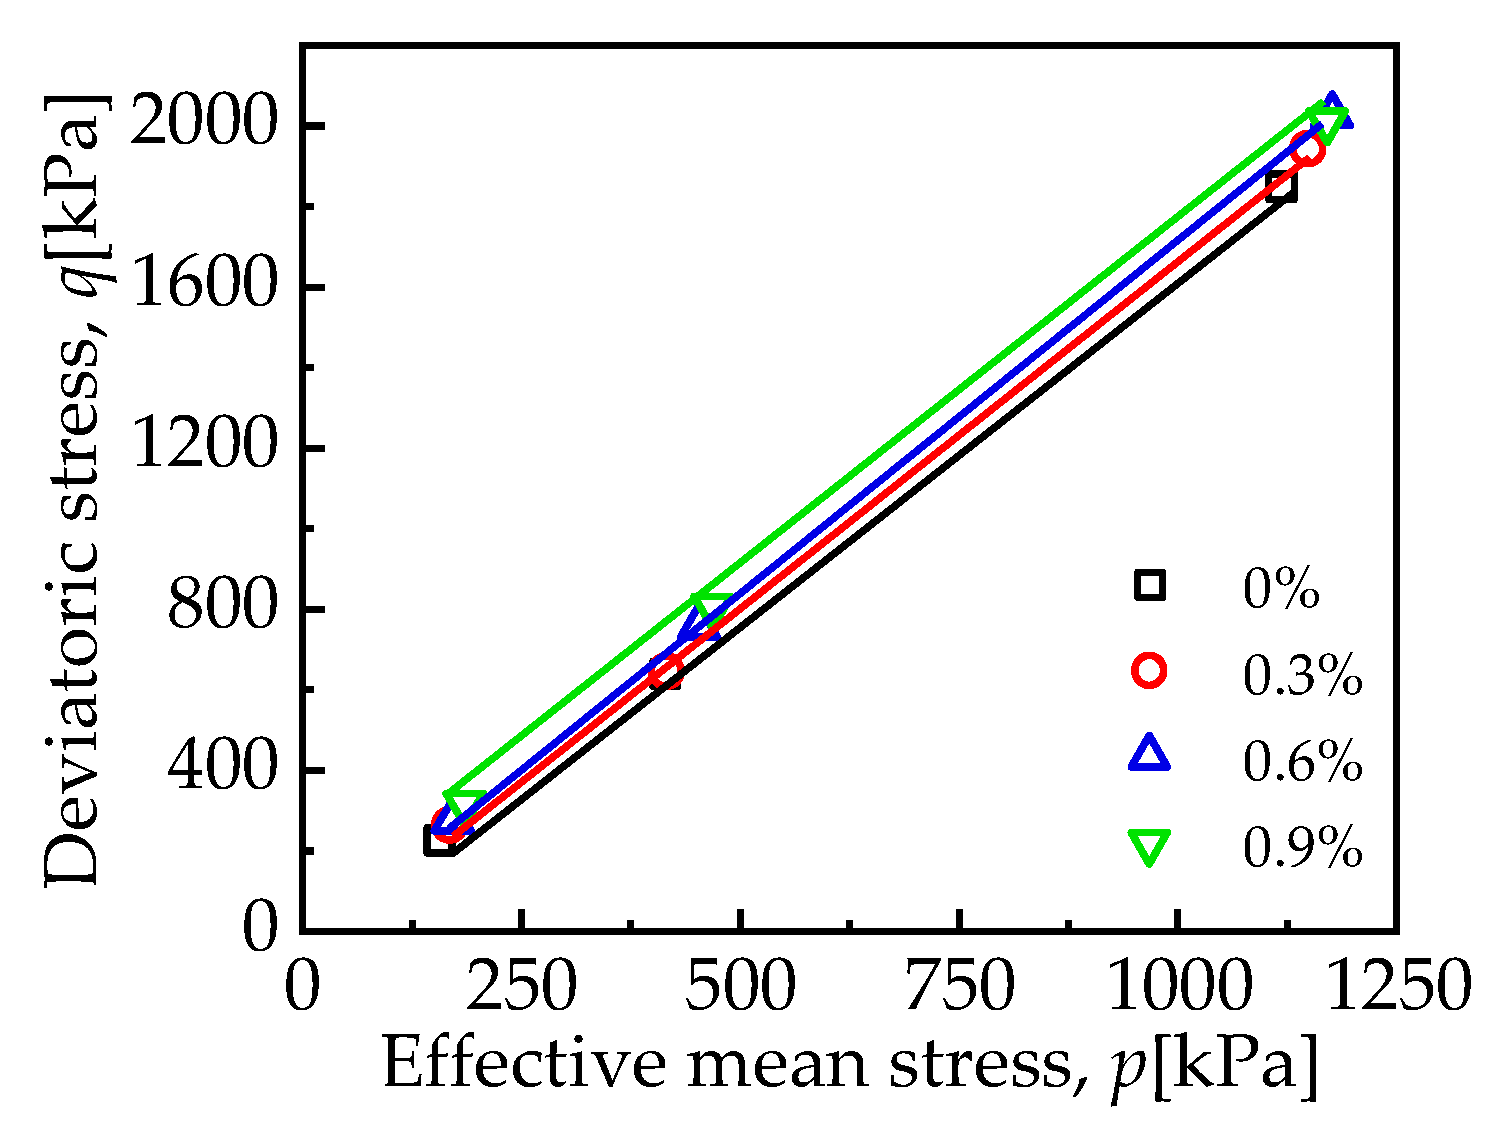
At a low content (0.9% by mass), an increase in mask content resulted in higher peak strength, internal friction angle, and ductility of the mixture, a reduction in the initial modulus, and suppression of dilatancy. This suggests that the mask has significant potential in enhancing the bearing capacity of calcareous sand roadbeds to resist shear deformation under dynamic vehicle loading.
(2)
The reinforcing effect of the mask on the soil matrix arises from the high friction at the mask–calcareous sand interface, which enhances the overall strength of the mixture by restricting the movement of soil particles during deformation. However, due to the mask’s deformability, the surrounding calcareous sand undergoes rearrangement at the onset of shear, which leads to a reduction in the initial modulus of the mixture.
(3)
The incorporation of the mask can effectively inhibit the fragmentation of calcareous sand particles, with the optimal effect observed at a 0.3% incorporation rate. This suggests that the mask has promising potential for enhancing the long-term stability of steep-slope calcareous sand soil bodies.
(4)
The incorporation of the mask reduces the coefficient of permeability of calcareous sand, prevents particle loss, and, at a mask content of 0.3%, particle loss is substantially inhibited while the permeability of the specimen is only slightly reduced. In scenarios where both permeability and particle loss are critical (e.g., shallow foundations in areas with fluctuating water tables), calcareous sand particle loss is significantly reduced, thereby extending the structural lifespan.

Author Contributions

Conceptualization, L.Z. and J.Z.; methodology, J.Z.; validation, Z.Z. and J.Z.; formal analysis, Z.S.; investigation, Z.S.; resources, J.Z.; data curation, Z.S.; writing—original draft preparation, Z.S.; writing—review and editing, L.Z. and J.Z.; supervision, Z.Z. and B.L.; project administration, B.L.; funding acquisition, J.Z. and B.L. All authors have read and agreed to the published version of the manuscript.

Funding

This research was funded by Water Resources Science and Technology Program of Hunan Province, China (XSKJ2023059-45); the Natural Science Foundation project of Hunan Province, China (2023JJ40332); the National Natural Science Foundation Project of China (NSFC) (52208341); and the 2023 Central Agricultural Machinery Research and Development, Manufacturing, Promotion, and Integrated Application Pilot Fund, China Project (Hunan Finance Department’s Pre-(2023) No. 204 Document); the Key Scientific Research Project of Hunan Provincial Department of Education (23A0176).

Institutional Review Board Statement

Not applicable.

Informed Consent Statement

Not applicable.

Data Availability Statement

The original contributions presented in the study are included in the article; further inquiries can be directed to the corresponding authors.

Conflicts of Interest

The authors declare no conflicts of interest.

References

  1. Karaivanov, A.; Lu, S.E.; Shigeoka, H.; Chen, C.; Pamplona, S. Face masks, public policies and slowing the spread of COVID-19: Evidence from Canada. J. Health Econ. 2021, 78, 102475. [Google Scholar] [CrossRef] [PubMed]
  2. Liang, S.H.; Zeng, W.H.; Feng, D.L.; Lin, J.P.; Gong, X. Influence of Polypropylene Fiber on Properties of Biocemented Calcareous Sand. Soil Mech. Found. Eng. 2022, 59, 193–201. [Google Scholar] [CrossRef]
  3. Lee, A.; Liew, M.S. Tertiary recycling of plastics waste: An analysis of feedstock, chemical and biological degradation methods. J. Mater. Cycles Waste Manag. 2021, 23, 32–43. [Google Scholar] [CrossRef]
  4. Fadare, O.O.; Okoffo, E.D. COVID-19 face masks: A potential source of microplastic fibers in the environment. Sci. Total Environ. 2020, 737, 140279. [Google Scholar] [CrossRef]
  5. Khoo, K.S.; Ho, L.Y.; Lim, H.R.; Leong, H.Y.; Chew, K.W. Plastic waste associated with the COVID-19 pandemic: Crisis or oppor-tunity? J. Hazard. Mater. 2021, 417, 126108. [Google Scholar] [CrossRef]
  6. Oliveira, A.M.; Silva, A.L.P.; Soares, A.M.V.M.; Barcelo, D.; Duarte, A.C.; Rocha-Santos, T. Current knowledge on the presence, bio-degradation, and toxicity of discarded face masks in the environment. J. Environ. Chem. Eng. 2023, 11, 109308. [Google Scholar] [CrossRef]
  7. Dharmaraj, S.; Ashokkumar, V.; Hariharan, S.; Manibharathi, A.; Show, P.L.; Chong, C.T.; Ngamcharussrivichai, C. The COVID-19 pandemic face mask waste: A blooming threat to the marine environment. Chemosphere 2021, 272, 129601. [Google Scholar] [CrossRef]
  8. Wang, L.M.; Li, S.X.; Ahmad, I.M.; Zhang, G.Y.; Sun, Y.F.; Wang, Y.; Sun, C.N.; Jiang, C.; Cui, P.; Li, D.M. Global face mask pollution: Threats to the environment and wildlife, and potential solutions. Sci. Total Environ. 2023, 887, 164055. [Google Scholar] [CrossRef]
  9. Ohashi, D.H.G. Mechanics of fiber reinforcement in sand. J. Geotech. Geoenviron. Eng. 1983, 109, 335–353. [Google Scholar] [CrossRef]
  10. Fang, X.; Yang, Y.; Chen, Z.; Liu, H.; Xiao, Y.; Shen, C. Influence of Fiber Content and Length on Engineering Properties of MICP-Treated Coral Sand. Geomicrobiol. J. 2020, 37, 582–594. [Google Scholar] [CrossRef]
  11. Conceição, M.P.d.S.; Pinto, C.M.T.; Carvalho, M.d.F.; Machado, S.L. Fiber reinforcement effectiveness in two different sand speci-mens. Soils Rocks 2023, 46, e2023012422. [Google Scholar] [CrossRef]
  12. Lei, X.; Lin, S.; Meng, Q.; Liao, X.; Xu, J. Influence of different fiber types on properties of biocemented calcareous sand. Arab. J. Geosci. 2020, 13, 317. [Google Scholar] [CrossRef]
  13. Sun, X.P.; Jiang, Z.Y.; Xu, A.; Fu, X.L.; Che, C.; Tian, Z.J.; Bi, Y.Z. Recycle of discarded masks in civil Engineering: Current status and future opportunities with silane coupling agent modified discarded masks. Constr. Build. Mater. 2023, 405, 133266. [Google Scholar] [CrossRef]
  14. Wei, H.Z.; Liu, H.; Li, X.X.; Tao, Z.; Wu, Y.J.; Shen, J.H.; Yin, M. Effect of stress path on the mechanical properties of calcareous sand. Undergr. Space 2023, 9, 20–30. [Google Scholar] [CrossRef]
  15. Fan, Z.H.; Hu, C.; Zhu, Q.L.; Jia, Y.G.; Zuo, D.J.; Duan, Z.B. Three-dimensional pore characteristics and permeability properties of calcareous sand with different particle sizes. Bull. Eng. Geol. Environ. 2021, 80, 2659–2670. [Google Scholar] [CrossRef]
  16. Wei, H.; Zhao, T.; Meng, Q.; Wang, X.; He, J. Experimental Evaluation of the Shear Behavior of Fiber-Reinforced Calcareous Sands. Int. J. Geomech. 2018, 18, 12. [Google Scholar] [CrossRef]
  17. Zhou, L.; Chen, J.-F.; Peng, M.; Zhu, Y. Liquefaction behavior of fiber-reinforced calcareous sands in unidirectional and multi-directional simple shear tests. Geotext. Geomembr. 2022, 50, 794–806. [Google Scholar] [CrossRef]
  18. Hakimelahi, N.; Bayat, M.; Ajalloeian, R.; Nadi, B. Effect of woven geotextile reinforcement on mechanical behavior of calcareous sands. Case Stud. Constr. Mater. 2023, 18, e02014. [Google Scholar] [CrossRef]
  19. Tang, C.S.; Li, H.; Pan, X.H.; Yin, L.Y.; Cheng, L.; Cheng, Q.; Liu, B.; Shi, B. Coupling effect of biocementation-fiber reinforcement on mechanical behavior of calcareous sand for ocean engineering. Bull. Eng. Geol. Environ. 2022, 81, 163. [Google Scholar] [CrossRef]
  20. Chen, M.; Shen, S.-L.; Arulrajah, A.; Wu, H.-N.; Hou, D.-W.; Xu, Y.-S. Laboratory evaluation on the effectiveness of polypropylene fibers on the strength of fiber-reinforced and cement-stabilized Shanghai soft clay. Geotext. Geomembr. 2015, 43, 515–523. [Google Scholar] [CrossRef]
  21. Sadek, S.; Najjar, S.S.; Freiha, F. Shear Strength of Fiber-Reinforced Sands. J. Geotech. Geoenviron. En-Gineering 2010, 136, 490–499. [Google Scholar] [CrossRef]
  22. ASTM D4254; Standard Test Method for Minimum Index Density and Unit Weight of Soils and Calculation of Relative Density. ASTM International: West Conshohocken, PA, USA, 2006.
  23. ASTM D7181; Standard Test Method for Determining the (In-plane) Flow Rate per Unit Width and Hydraulic Transmissivity of a Geosynthetic Using a Constant Head. ASTM International: West Conshohocken, PA, USA, 2020.
  24. Zeng, Y.W.; Shi, X.S.; Zhao, J.D.; Bian, X.; Liu, J.Y. Estimation of compression behavior of granular soils considering initial density effect based on equivalent concept. Acta Geotech. 2025, 20, 1035–1048. [Google Scholar] [CrossRef]
  25. Lyu, H.; Gu, J.X.; Zhou, J.R.; Li, B. Mechanical behavior and particle breakage of calcareous sand in triaxial test. Mar. Geo-Phys. Res. 2023, 44, 18. [Google Scholar] [CrossRef]
  26. Zhang, J.Q.; Xiao, Y.J.; Chen, X.B.; Liu, B.H.; Yin, Z.Y. Investigating the effects of non-uniformity of mixing on the shear behavior of soft-rigid mixtures with DEM. Comput. Geotech. 2024, 176, 106794. [Google Scholar] [CrossRef]
  27. ASTM D2434; Standard Test Method for Permeability of Granular Soils (Constant Head). ASTM International: West Conshohocken, PA, USA, 2019.
  28. Romero, C.M.; Páez, M.S.; Puchana, M.J. Effect of temperature on the volumetric and viscometric properties of polyols in aqueous solutions. J. Mol. Liq. 2016, 223, 1192–1196. [Google Scholar] [CrossRef]
  29. Xie, K.; Li, T.F.; Zhao, Y.M.; Chen, X.B.; Zhang, Q.L. Microstructure evolution of coarse-grained soil fillers during subgrade com-paction-operation period based on CT technology. Transp. Geotech. 2024, 47, 101279. [Google Scholar] [CrossRef]
  30. Zhang, J.; Chen, X.; Zhang, J.; Jitsangiam, P.; Wang, X. DEM investigation of macro- and micro-mechanical properties of rigid-grain and soft-chip mixtures. Particuology 2021, 55, 128–139. [Google Scholar] [CrossRef]
  31. Zhang, Z.T.; Zhou, G.M. Investigating the compaction and the mechanical behaviors of coal gangue as subgrade filler and constructing highway subgrade in practice. Sci. Rep. 2024, 14, 26272. [Google Scholar] [CrossRef]
  32. Zhang, Z.T.; Gao, W.H.; Wang, X.; Zhang, J.Q.; Tang, X.Y. Degradation-induced evolution of particle roundness and its effect on the shear behaviour of railway ballast. Transp. Geotech. 2020, 24, 100388. [Google Scholar] [CrossRef]
  33. Zhang, J.; Wang, X.; Yin, Z.-Y.; Liang, Z. DEM modeling of large-scale triaxial test of rock clasts considering realistic particle shapes and flexible membrane boundary. Eng. Geol. 2020, 279, 105871. [Google Scholar] [CrossRef]
  34. Harkness, J.; Zervos, A.; Le Pen, L.; Aingaran, S.; Powrie, W. Discrete element simulation of railway ballast: Modelling cell pressure effects in triaxial tests. Granul. Matter 2016, 18, 65. [Google Scholar] [CrossRef]
  35. Shi, X.S.; Nie, J.Y.; Zhao, J.D.; Gao, Y.F. A homogenization equation for the small strain stiffness of gap-graded granular materials. Comput. Geotech. 2020, 121, 103440. [Google Scholar] [CrossRef]
  36. Zhang, R.X.; Su, D.; Lin, X.T. A theoretical model for trapdoor tests considering the interaction of soil arches. Acta Geotech. 2025, 20, 707–721. [Google Scholar] [CrossRef]
  37. Shi, X.S.; Zhao, J. Practical estimation of compression behavior of clayey/silty sands using equivalent void-ratio concept. J. Geotech. Geoenviron. Eng. 2020, 146, 04020046. [Google Scholar] [CrossRef]
  38. Xiao, Y.; Wang, X.; Yu, Q. Discrete element modeling of instability mechanisms of unbound permeable aggregate base materials in triaxial compression. Materials 2022, 15, 2716. [Google Scholar] [CrossRef]
  39. Chen, L.; Ghorbani, J.; Zhang, C. Stress overshooting solution for soil plasticity models. Comput. Geotech. 2022, 152, 105008. [Google Scholar] [CrossRef]
  40. Zhang, J.Q.; Wang, X.; Yin, Z.Y. DEM-based study on the mechanical behaviors of sand-rubber mixture in critical state. Con-Struction Build. Mater. 2023, 370, 130603. [Google Scholar] [CrossRef]
  41. Li, J.; Yin, Z.Y.; Cui, Y.J.; Liu, K.; Yin, J.-H. An elasto-plastic model of unsaturated soil with an explicit degree of satura-tion-dependent CSL. Eng. Geol. 2019, 260, 105240. [Google Scholar] [CrossRef]
  42. Qi, Y.; Indraratna, B.; Heitor, A.; Vinod, J.S. Closure to “Effect of Rubber Crumbs on the Cyclic Behavior of Steel Furnace Slag and Coal Wash Mixtures” by Yujie Qi, Buddhima Indraratna, Ana Heitor, and Jayan S. Vinod. J. Geotech. Geoenviron. Eng. 2018, 144, 04017107. [Google Scholar] [CrossRef]
  43. Chang, C.S.; Yin, Z.Y. Modeling Stress-Dilatancy for Sand under Compression and Extension Loading Conditions. J. Eng. Mech.-Asce 2010, 136, 777–786. [Google Scholar] [CrossRef]
  44. Zhang, J.R.; Chen, J.X.; Lei, W.; Peng, W. Effect of drainage conditions during triaxial shearing on particle breakage, deformation, and strength properties of calcareous sand. Rock Soil Mech. 2024, 45, 375–384. [Google Scholar] [CrossRef]
  45. He, S.H.; Ding, Z.; Sun, Y.F.; Chen, W.Y.; Xia, T.D. Cumulative deformations and particle breakage in calcareous sand subjected to drained high-cyclic loading: Experimental investigation. Soil Dyn. Earthq. Eng. 2022, 161, 13. [Google Scholar] [CrossRef]
  46. Lin, Y.; Li, C.; Ma, J.; Lei, M.; Huang, L. Effects of void morphology on fracturing characteristics of porous rock through a finite-discrete element method. J. Nat. Gas Sci. Eng. 2022, 104, 104684. [Google Scholar] [CrossRef]
  47. Yao, Y.; Fan, J.; Li, J. A Review of Advanced Soil Moisture Monitoring Techniques for Slope Stability Assessment. Water 2025, 17, 1192–1196. [Google Scholar] [CrossRef]
  48. Mueller, A.V.; Fernandez, L.A. Assessment of Fabric Masks as Alternatives to Standard Surgical Masks in Terms of Particle Filtration Efficiency. medRxiv 2020. [Google Scholar] [CrossRef]
  49. Cey, E.E.; Rudolph, D.L. Field study of macropore flow processes using tension infiltration of a dye tracer in partially saturated soils. Hydrol. Process. 2009, 23, 1768–1779. [Google Scholar] [CrossRef]
Figure 1. Tested materials.
Applsci 15 04888 g001
Figure 2. Grading Curve.
Applsci 15 04888 g002
Figure 3. Stress ratio–strain curve.
Applsci 15 04888 g003
Figure 4. Stress ratio–strain curves for different mask sizes.
Applsci 15 04888 g004
Figure 5. Peak stress ratio.
Applsci 15 04888 g005
Figure 6. Initial modulus.
Applsci 15 04888 g006
Figure 7. Cohesion force and internal friction angle.
Applsci 15 04888 g007
Figure 8. Volumetric strain curve.
Applsci 15 04888 g008
Figure 9. Volumetric strain curves for different mask sizes.
Applsci 15 04888 g009
Figure 10. (a) Dilatancy during shear and (b) dilatancy angle.
Applsci 15 04888 g010
Figure 11. Phase transformation state line.
Applsci 15 04888 g011
Figure 12. (a) Relationship between relative breakage rate and mask content and (b) relationship between relative breakage rate and internal friction angle.
Applsci 15 04888 g012
Figure 13. (a) Proportion of particle loss and (b) coefficient of permeability.
Applsci 15 04888 g013
Table 1. Density test data summary.
Mask Mass Content (%)00.30.60.9
Max. density (g/cm3)1.561.501.441.41
Min. density (g/cm3)1.351.271.191.13
Table 2. Summary of specimen information.
Specimen NameMask Mass Content (%)Pressurization (kPa)Pre-Shear Pore Ratio
C0P800800.879
C0P200200
C0P500500
C03P800.3800.945
C03P200200
C03P500500
C06P800.6801.020
C06P200200
C06P500500
C09P800.9801.065
C09P200200
C09P500500
Disclaimer/Publisher’s Note: The statements, opinions and data contained in all publications are solely those of the individual author(s) and contributor(s) and not of MDPI and/or the editor(s). MDPI and/or the editor(s) disclaim responsibility for any injury to people or property resulting from any ideas, methods, instructions or products referred to in the content.

