Abstract
The purpose of this article is to evaluate and compare the mechanical and electrochemical properties of four new materials, composed of a B4C ceramic matrix doped with 0.5%, 1%, 2% and 3% volumes of CoCrFeNiMo HEA with monolithic B4C. The studied samples were obtained using the spark plasma sintering technique. The structure and hardness of the samples were analyzed via scanning electron microscopy (SEM) and a Vickers microhardness test. After immersion in artificial sea water to simulate a corrosive marine environment, corrosion potential, corrosion rate and electrochemical impedance spectroscopy tests were carried out to determine the samples’ electrochemical behavior. Tafel slopes and the equivalent circuit that fit the EIS experimental data were obtained. A denser microstructure and smaller grain size was achieved as the HEA content increase. According to the Vickers measurements, every sample showed a normal distribution. All studied samples exhibit great corrosion resistance in a two-step chemical interaction, influenced by the presence of the Warburg element. The research demonstrates that increasing the HEA content implies better performance of corrosion resistance and mechanical properties, confirming the materials’ potential use in corrosive environments and harsh mechanical applications.
1. Introduction
Boron carbide (B4C) is a ceramic material with outstanding mechanical properties, such as good thermal stability and conductivity (30 W/m K), a low density (2.52 g/cm3), a high melting point (2450 °C) and high hardness (30 GPa) [1]. These properties guarantee B4C as an extremely competitive material for a wide range of industrial applications, such as ballistic, refractory or electronics fields [2]. B4C behaves as a thermoelectric material with a high Seebeck coefficient of 300 µV/K. This characteristic makes it a very interesting material for emerging applications in thermocouples, diodes and transistors. B4C is recognized as the third-hardest material, after diamond and cubic boron nitride. It combines exceptional hardness, maintaining a low density, which makes it a lightweight alternative to diamond (~3.51 g/cm3). B4C exhibits good thermal conductivity but lower than diamond’s. Electrically, B4C behaves as a semiconductor with low conductivity, contrasting with diamond, which is a magnificent electrical insulator. B4C works good in harsh environments due to its high resistance to corrosion. Diamond, despite its chemical inertness, can oxidize at elevated temperatures. B4C could replace the use of diamond as a more cost-effective and readily-available-in-larger-quantities material, making it attractive for industrial applications [3].
Ionizing radiation is very important in medical and industrial fields. In medicine, it is used for diagnostic imaging techniques and nuclear medicine treatments. In the industrial field, radiation is used for applications such as sterilization, material testing and quality control. Nuclear power generation contributes significantly to global energy production, offering a low-carbon alternative to fossil fuels. The challenge is determining how to take advantage of the benefits of ionizing radiation while minimizing the associated risks. In this context, B4C exhibits exceptional neutron absorption capacity (600 barns). This makes it extensively used in nuclear reactor protection and monitoring systems as effective shielding [4,5].
Beyond its nuclear applications, B4C has high hardness and reduced density compared to other ceramics, like SiC, Al2O3, Si3N4 and ZrO2. These characteristics make polymers reinforced with B4C highly attractive for tribological applications [6].
B4C is a promising semiconductor with a hopping-type electrical transport behavior. Its bandgap (approximately 2.09 eV) is influenced by its composition and structural order. It is a p-type material with potential for innovative electronic device applications [2].
A critical aspect when processing B4C is densification. Dense materials are often needed for many advanced applications. Different sintering additives have been explored to increase densification rates, control grain growth and improve mechanical properties. Carbon has proven effective in reducing the oxide layer on B4C powders, which helps sintering and limits grain growth [7].
High-entropy alloys (HEAs) appeared in 2004 as a result of at least five different metallic elements being combined at approximately equal atomic ratios [8,9]. This kind of alloy rapidly became of high interest in the academic field due to their remarkable properties and their possible engineering applications, where high strength, ductility, thermal stability or corrosion resistance are required [10]. HEAs are found in a wide range of industrial applications, exhibiting superior properties to traditional alloys, which typically consist of only one or two primary elements, in biomedical [11,12], nuclear [13,14,15] and refractory applications, such as jet engines and turbines [16]. The actual focus of HEAs has appeared to expand to magnetic applications, energy conversion, hydrogen storage and catalysis [17], answering actual social or industrial problems. Many HEAs have been and are being studied nowadays in order to obtain better properties or increase their application range, such as MoNbTiVTaW [18], Fe20Mn15Cr15V10Al10C2.5 [19], CoCrFeMnNi [20], TiNbTaZrMoHfWCr [21], Fe20Co30Ni10Cr20Mn20 [22] and CoCrFeNiMo [23,24,25].
CoCrFeNiMo HEA has been doped with silicium [26], zirconium [27], aluminum [28] or titanium [29], as well as used as a coating [30,31], which enhance the HEA’s versatility in different engineering applications. The effect of Mo has proven to be crucial not just on its mechanical properties, such as high hardness [32], but in the formation of a passive layer in the marine environment with the creation of Cr2O3 and MoO3, which increases the HEA’s corrosion resistance [31,33]. On the other hand, the addition of Ni and Cr on the HEA contributes to the formation of a resistant protective oxide film over the outer layer of the material, implying also an improvement in corrosion resistance [34,35].
This paper aims to investigate the mechanical and electrochemical properties of B4C materials doped with 0.5% and 1% CoCrFeNiMo HEA and compare the results with those of B4C doped with 2% and 3% CoCrFeNiMo [36,37].
Thus, in this study, the impact of CoCrFeNiMo HEA doping on the electrochemical and mechanical properties of B4C ceramic has been investigated. Electrochemical tests were conducted in an artificial seawater environment, a 3.5% volume of NaCl solution. Additionally, scanning electron microscopy (SEM) and a microhardness statistical analysis were conducted. The study focuses on evaluating and comparing these two new compositions against the previously analyzed compounds under a marine and corrosive environment. By expanding the scope of the investigation, this work seeks to provide a deeper understanding of how CoCrFeNiMo HEA doping affects B4C ceramic and which of these compounds have the optimal composition, with an emphasis on applications where factors such as durability, corrosion resistance and enhanced hardness are essential.
2. Materials and Methods
2.1. Material Preparation
The investigation was conducted on 4 different composites of B4C ceramic doped with 0.5%, 1%, 2% and 3% volumes of CoCrFeNiMo HEA, created by the Department of Metallurgical and Materials Engineering of Istanbul Technical University. The preparation of the samples starting from raw materials is presented in our previous articles [37]. A graphite sheet was inserted between the punches and the powder to improve conductivity and facilitate post-sintering removal. Carbon felt insulation was used to minimize heat dissipation.
Sintering was carried out under vacuum using a Spark Plasma Sintering (SPS) system (SPS-7.40 MK-VII, SPS Syntex Inc., Saitama, Japan), applying a uniaxial pressure of 40 MPa and a pulsed direct current (12 ms/on, 2 ms/off). The temperatures during the whole process were measured with an optical pyrometer (Chino, IR-AH, Tokyo, Japan) on a designated spot in the graphite die. Continuous shrinkage tracking was conducted through punch rod displacement, with thermal expansion corrections based on a blank test. The holding time (5 min), heating rate (100 °C/min) and sintering temperature (1600 °C) were the established SPS conditions.
Then, the manufactured samples were embedded in a two-component epoxy resin. Using a Struers TegraPol-11 system (Struers, Copenhagen, Denmark), the surface was prepared via a two-step polishing procedure that included initial grinding with silicon carbide abrasive sheets (240–2000 grit) and final polishing with a 0.1 µm alpha alumina suspension to achieve a mirror-like sheen. The fabrication and preparation procedure of all studied samples is described in Figure 1.
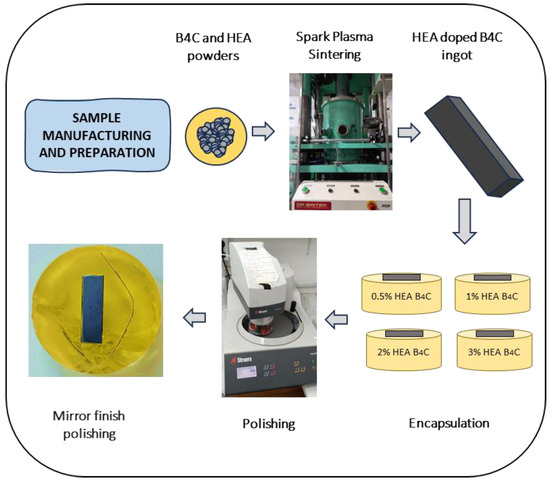
Figure 1.
Schematic representation of the material preparation.
2.2. Scanning Electron Microscopy (SEM)
The scanning electron microscope model FESEM JSM 7000 F (JEOL Ltd., Tokyo, Japan) was used to analyze the microstructures of the samples under study. For a precise and easier evaluation of the images, the composites were electrochemically attacked for 15 s with a 10% NaOH solution. This process helps to reveal grain boundaries and other microstructural features, using, to maximize the results, a potential of 10 V and a current density of 0.25 A/cm2. The linear intercept method (ASTM E112-96 [38]) was used to calculate the average grain size.
2.3. Electrochemical Tests
After finishing the sample preparation, electrochemical evaluations were carried out on the four different B4C variants. Potentiostat BioLogic Essential SP-150 (Bio-Logic Science Instruments SAS, Seyssinet-Pariset, France) and an electrochemical cell were used to carry out the different tests. A total of 3 electrochemical tests were performed: direct-current open-circuit potential (OCP) and linear polarization and alternative-current electrochemical impedance spectroscopy (EIS). All tests were conducted in a 3.5% NaCl artificial seawater solution to simulate a marine environment. Test parameters were configured, and data analysis was conducted using EC-Lab® v-9.55 software, in accordance with the ASTM G5-94(2004) standard [39]. Each experiment utilized a conventional three-electrode electrochemical setup, where the doped B4C samples served as the working electrodes, a saturated calomel electrode acted as the reference, and a platinum electrode functioned as the counter electrode.
2.3.1. Corrosion Potential
The open-circuit potential (OCP) was monitored over 24 h using the “Ecorr vs. Time” technique, with data recorded every 30 s or when a potential shift of 100 mV occurred. The results were analyzed to determine whether the material exhibited stable corrosion potential, passivation behavior or progressive degradation over time.
2.3.2. Corrosion Rate
The Tafel slope is utilized to establish the corrosion rate. Tafel slopes for both anodic (ba) and cathodic (bc) processes were determined by shifting the linear polarization curves. The ASTM G5-87 [40] Standard Reference Test Method for Conducting Potentiostatic and Potentiodynamic Anodic Polarization Measurements has been followed properly.
2.3.3. Electrochemical Impedance Spectroscopy (EIS)
EIS is a non-destructive alternative current technique with which the electrochemical impedance of all studied samples was evaluated in a wide frequency range (100 mHz to 100 kHz).
Electrochemical processes that happen slowly, like long-term stability or diffusion, can often be seen at low frequencies (100 mHz to 1 Hz). This helps to identify mass-transport limitations, electrode porosity or faradaic reactions. Medium frequencies (1 Hz to 10 kHz) are crucial for analyzing double-layer capacitance and charge-transfer resistance. This frequency range offers important information about ion diffusion and interfacial interactions at the electrode–electrolyte boundary. High frequencies (10 kHz to 100 kHz) provide information on the bulk electrolyte properties, including ionic conductivity, capacitive behavior and dielectric response.
Frequencies below 100 mHz were excluded because they prolong the measurement times and are often affected by noise interference. Frequencies above 100 kHz were not considered either, as they provide minimal additional information for most electrochemical systems. This frequency is also beyond the operational limits of the available equipment.
This test followed the ISO 16773-1-4:2016 standard [41]. The obtained impedance data were represented using Nyquist and Bode diagrams. Additionally, equivalent circuits (ECs) were utilized to model and interpret the electrochemical behavior of the material, providing insights into its impedance characteristics.
2.4. Microhardness
With the use of an FM-810 Microhardness Tester (Future Tech, Kawasaki, Japan), the Vickers microhardness of all the composites under study was established using an indentation test. To guarantee precise measurements, the surface was polished to a mirror finish for clear visibility of the indentations. The test was performed according to the ISO 14577-1:2015 standard [42], with 19.61 N load applied due to the material’s high hardness. A minimum of 45 indentations were created in various areas of all doped B4C composites and the monolithic B4C surface. Then, the average Vickers hardness (HV2) was calculated like all other statistical parameters.
3. Results
For clarity and ease of reference, the B4C ceramic samples doped with 0.5%, 1%, 2% and 3% volumes of CoCrFeNiMo HEA will be, on occasion, designated as B4C.05, B4C.1, B4C.2 and B4C.3, respectively.
3.1. Scanning Electron Microscope (SEM)
SEM images of the samples after the electrochemical attack are shown in Figure 2.


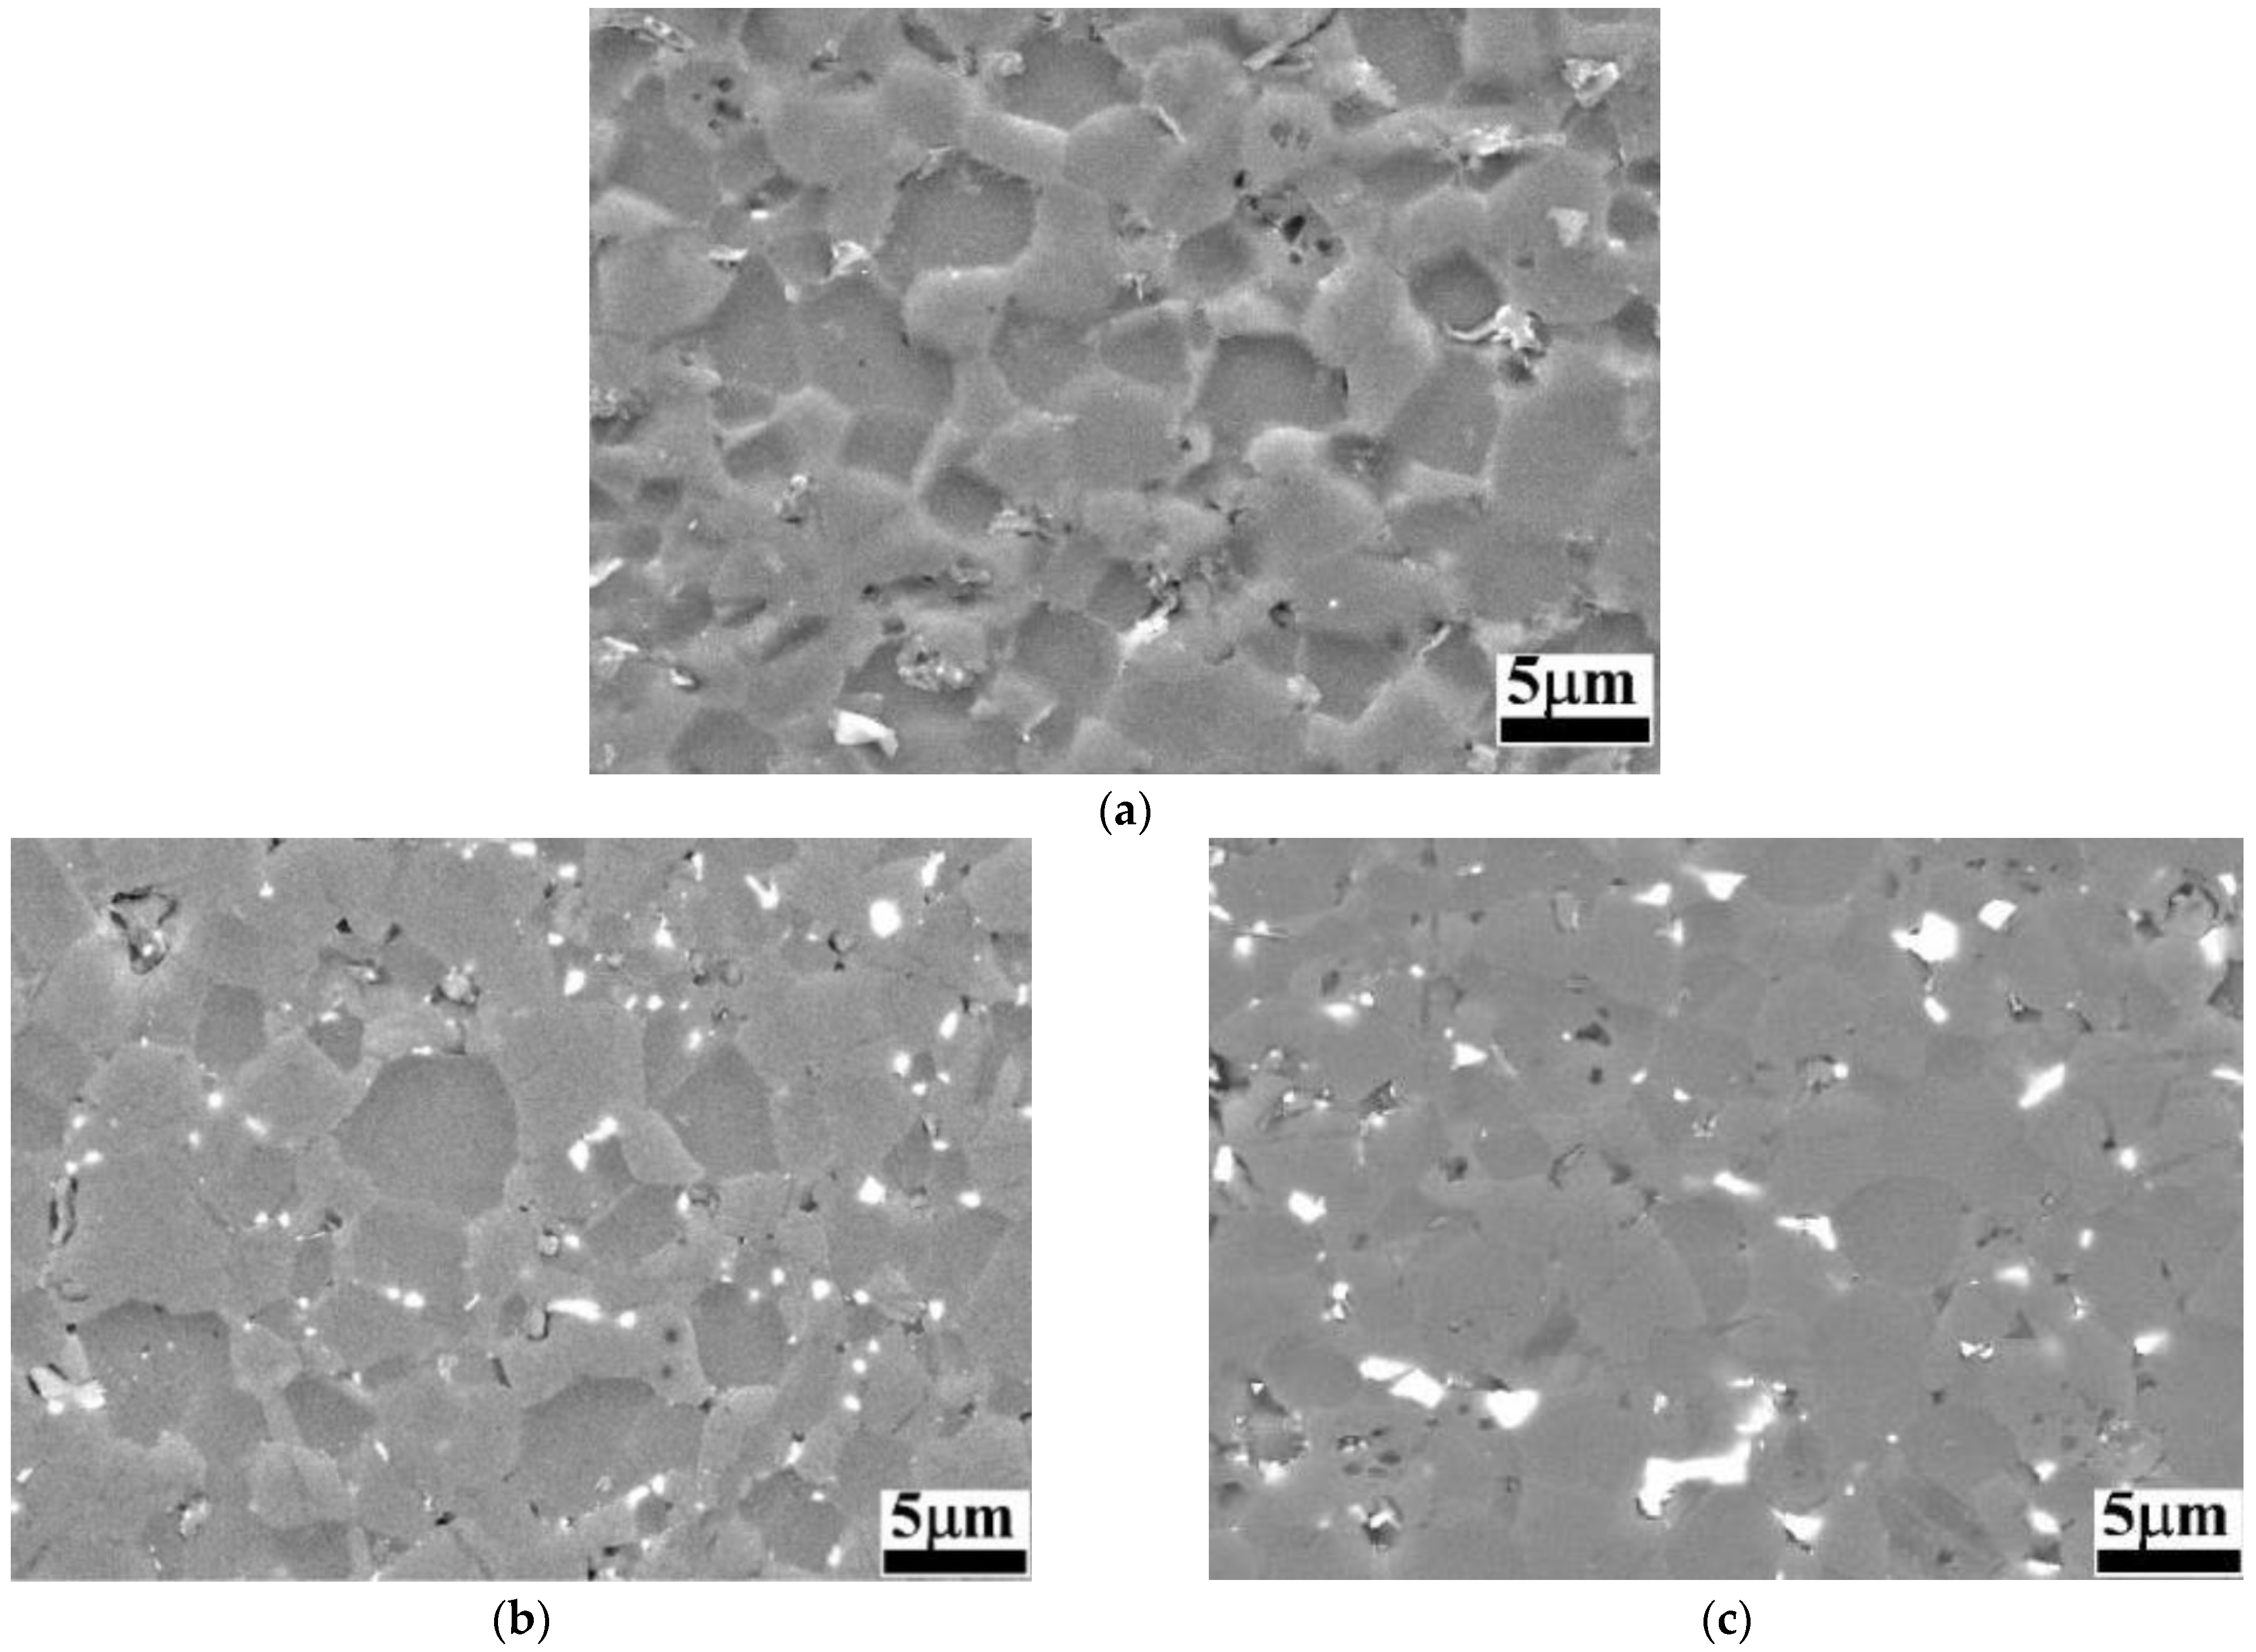
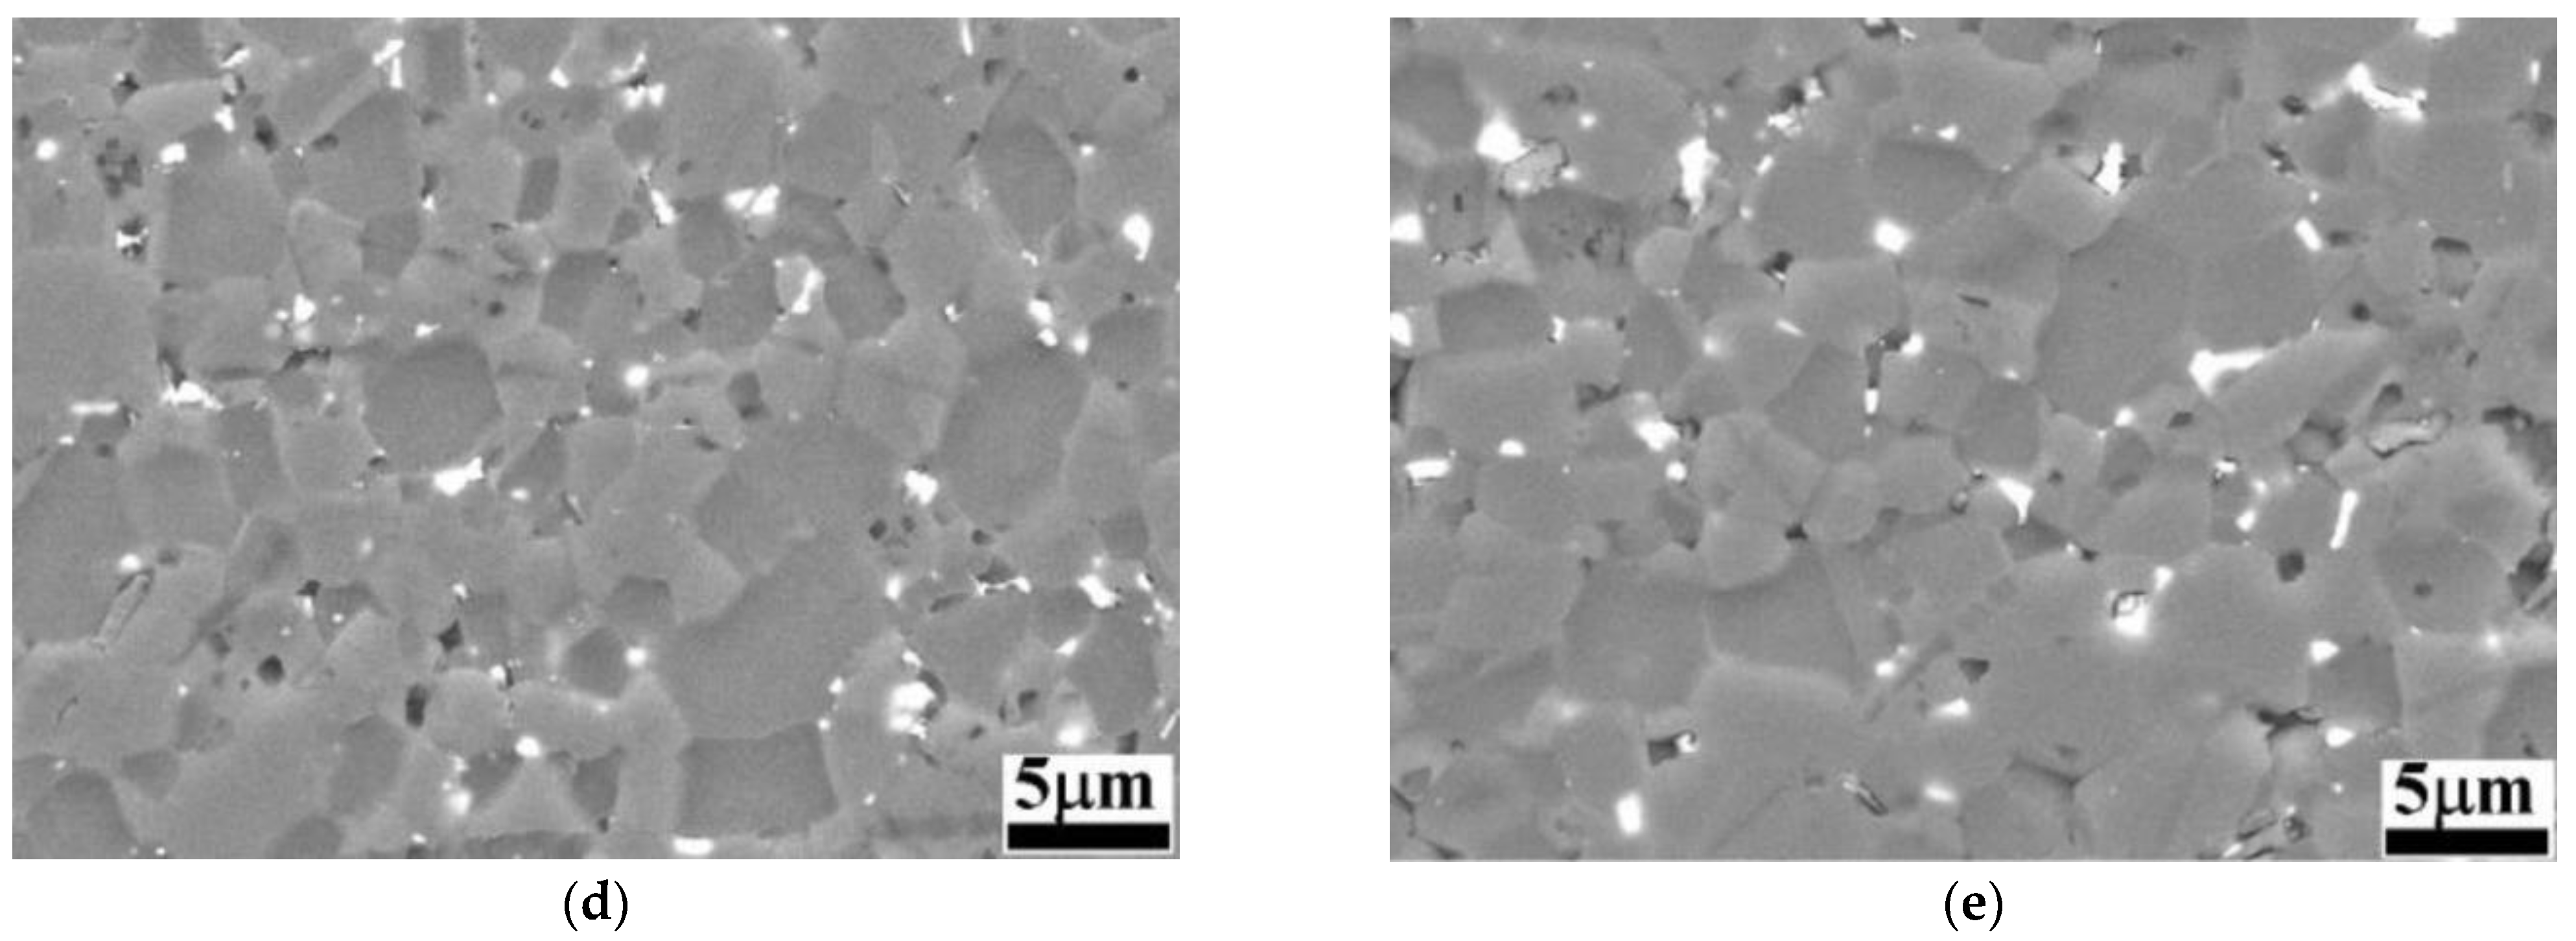
Figure 2.
BSE-SEM images of B4C and B4C-doped composites: (a) monolithic B4C; (b) B4C.05; (c) B4C.1; (d) B4C.2; (e) B4C.3.
When analyzing the etched microstructures of the composites, the grain size was measured: B4C.05 (2.53 ± 0.32 μm), B4C.1 (2.51 ± 0.35 μm), B4C.2 (2.16 ± 0.20 μm) and B4C.3 (2.52 ± 0.27 μm). All samples presented smaller average grain sizes compared to monolithic B4C (2.57 ± 0.11 μm). It can be observed that the sample with 2% HEA content exhibits the smallest average grain size. It can be observed how the CoCrFeNiMo addition phase is clearly localized at the triple junctions and along the grain boundaries, contributing to understanding the high-entropy behavior within the B4C matrix. HEA is observed as mainly filling pores or smaller grains, due to natural liquid-phase behavior, that tend to occupy configurations with the lowest energy [43]. The theoretical density of all samples increases with the HEA content: monolithic B4C (2.52 g/cm3), B4C.05 (2.55 g/cm3), B4C.1 (2.58 g/cm3), B4C.2 (2.64 g/cm3) and B4C.3 (2.71 g/cm3). The measured density also increases as the HEA content of the samples increases: monolithic B4C (2.43 g/cm3), B4C.05 (2.49 g/cm3), B4C.1 (2.54 g/cm3), B4C.2 (2.61 g/cm3) and B4C.3 (2.66 g/cm3). Finally, the porosity was measured: monolithic B4C (3.57%), B4C.05 (2.42%), B4C.1 (1.42%), B4C.2 (0.78%) and B4C.3 (1.95%).
3.2. Electrochemical Tests
3.2.1. Corrosion Potential
The voltage at which the cathodic current density transitions to anodic when a metal is submerged in a solution, artificial sea water in this case, is called corrosion potential. The variation in corrosion potential over time provides a reliable indicator of the corrosion behavior, where oxidation and reduction reactions take place at equal rates on the samples surface [44].
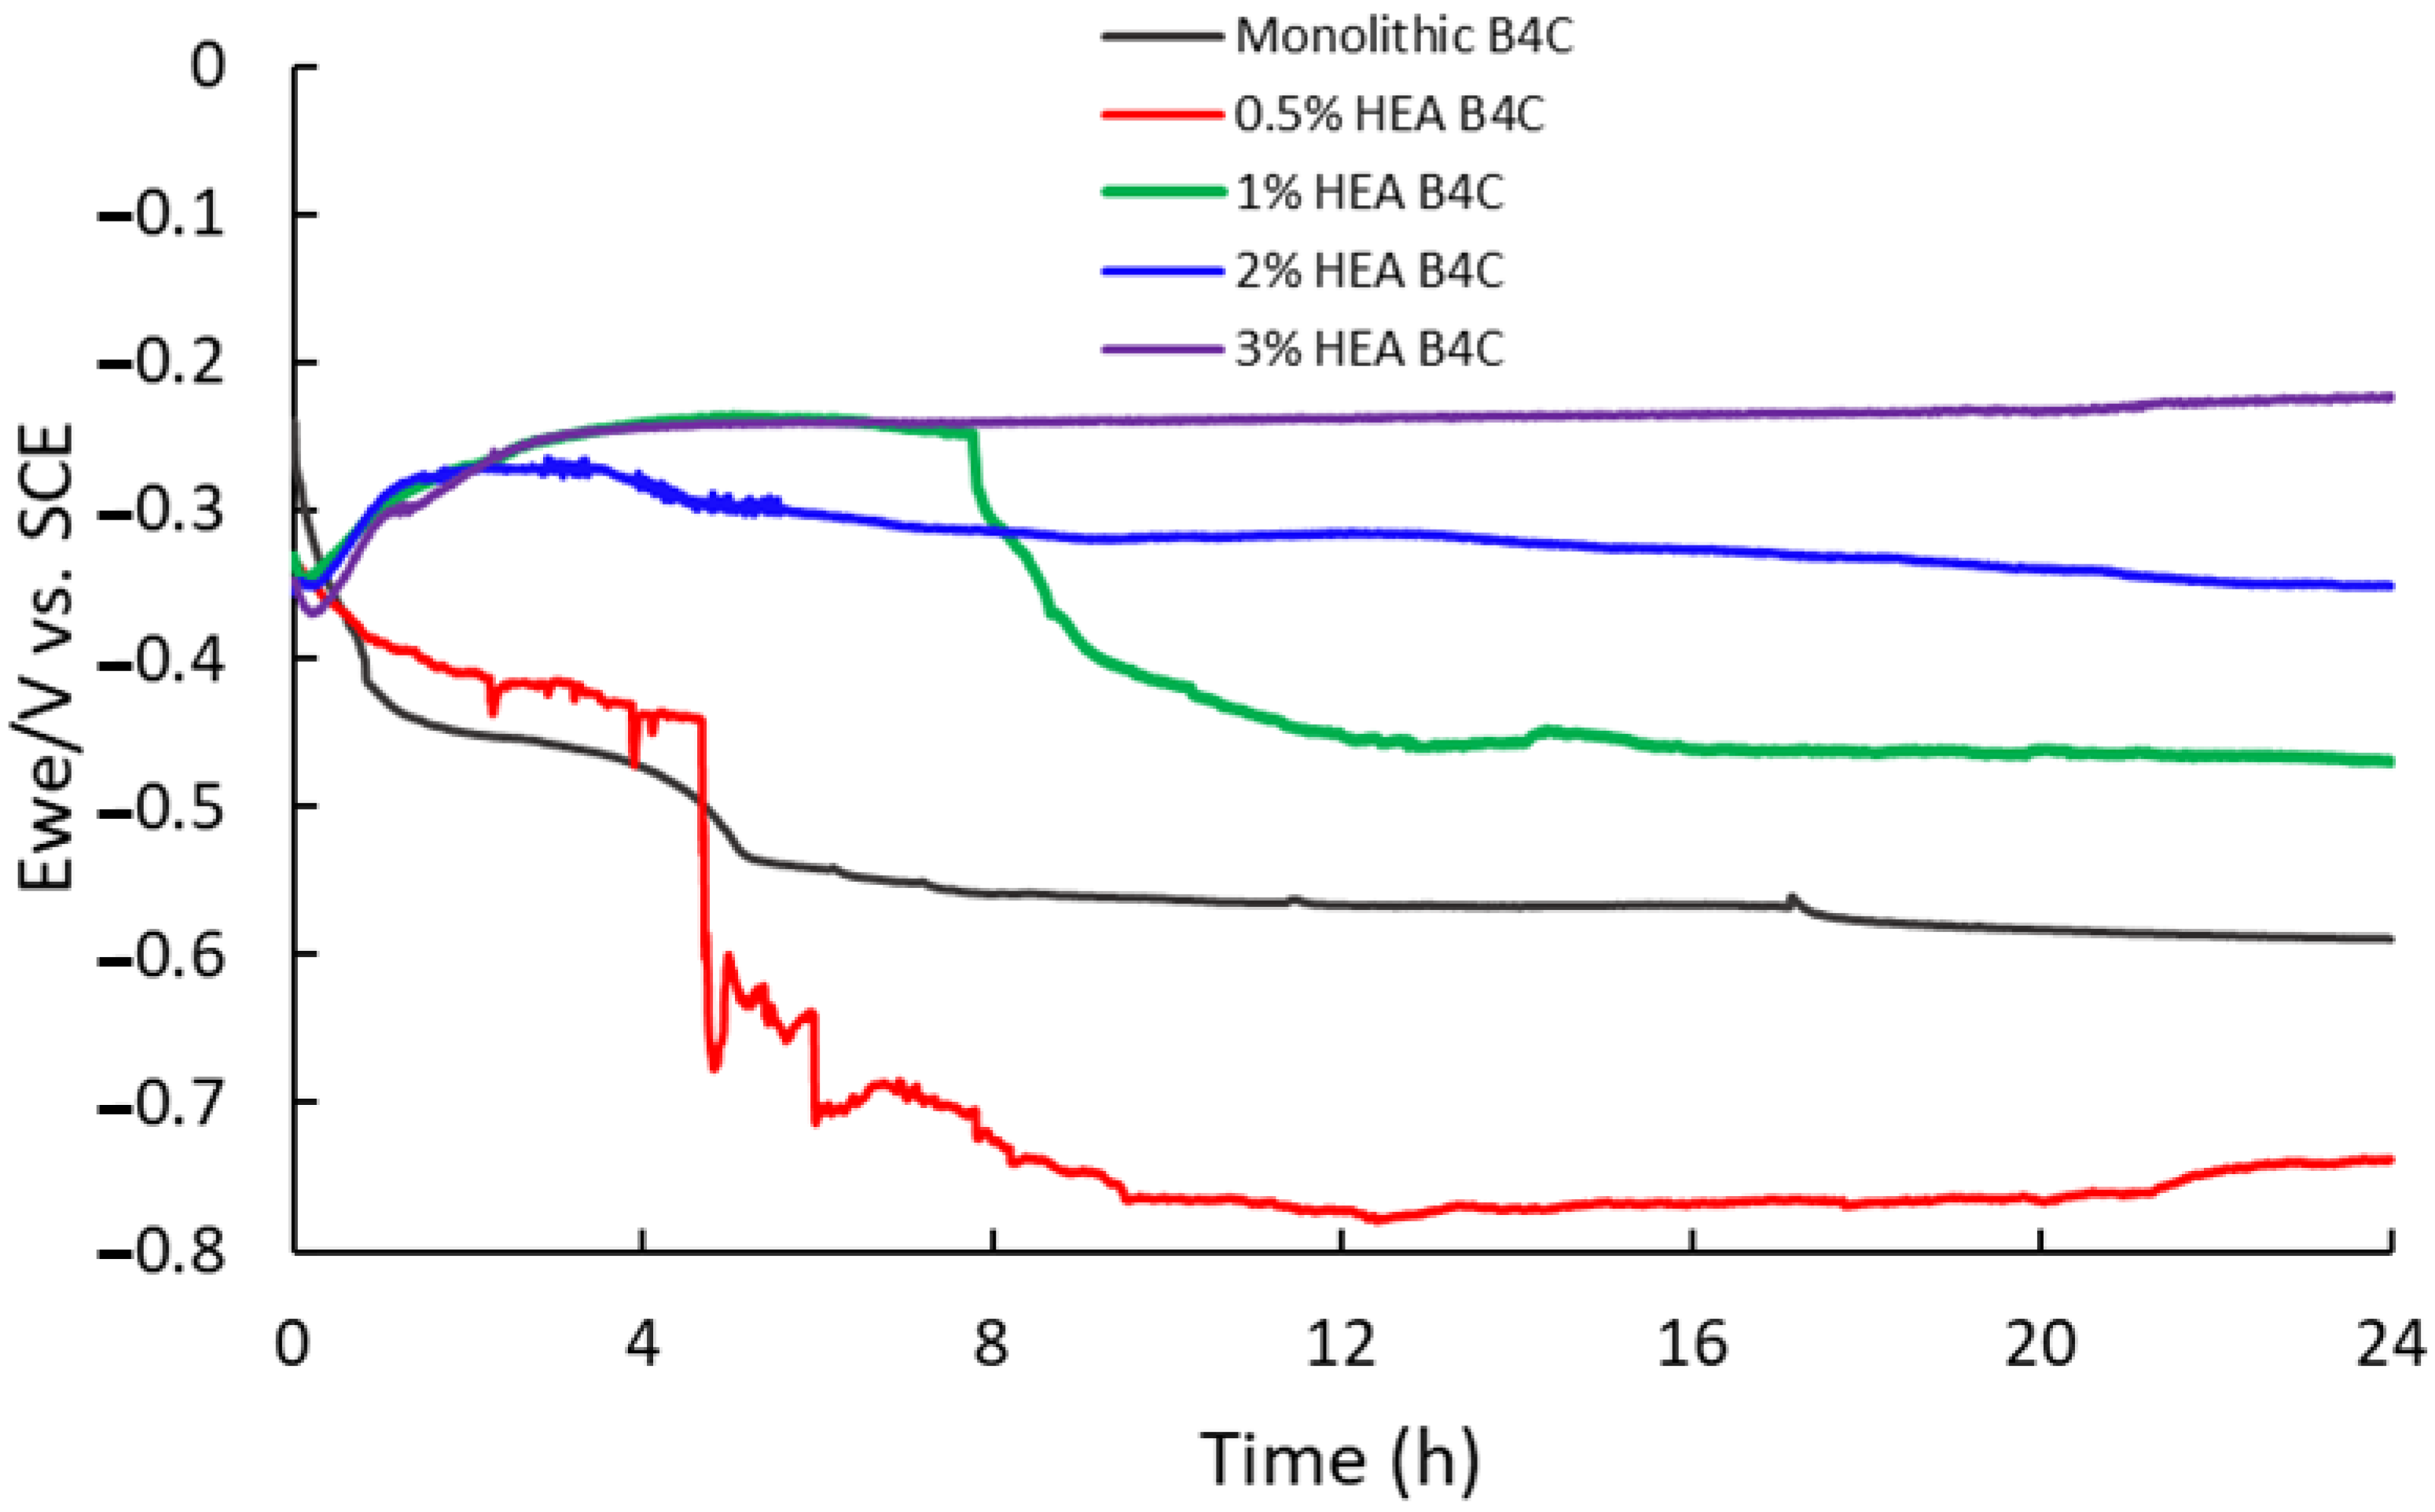
Figure 3 presents a clear tendency towards higher corrosion potential as the HEA volume percentage increases. The B4C.05 sample shows a remarkable drop close to 5 h of immersion, which indicates a surface activation during exposure to 3.5% NaCl solution; however, after 13 h of immersion its corrosion potential began to increase, inherent to the creation of a passive film on the outer layers of the composite, suggesting that it becomes thermodynamically stable under a marine environment. Sample B4C.1, at close to 8 h of immersion, shows another potential drop, followed by a slight tendency to a potential decrease. Sample B4C.3’s corrosion potential first decreased but rapidly increased, just like sample B4C.2’s corrosion potential; however, during exposure, B4C.3’s corrosion potential shows a clear positive tendency.
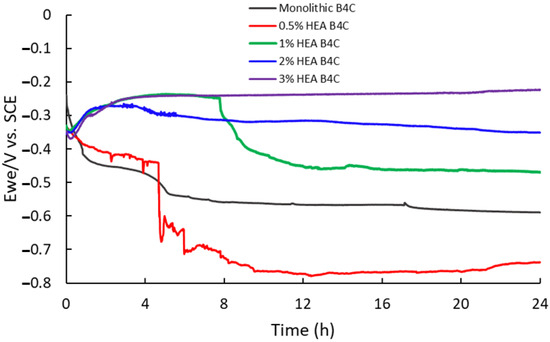
Figure 3.
Comparison of corrosion potentials vs. time for 24 h of immersion in 3.5% NaCl solution of studied samples.
3.2.2. Corrosion Rate
The corrosion rate procedure offers insight into the effect of the environment on a material and can be determined through linear polarization curves, which relate potential to current. Figure 4 illustrates the linear polarization test performed to measure the corrosion rate of the composites immersed in artificial seawater, represented on a semi-logarithmic scale of current values.
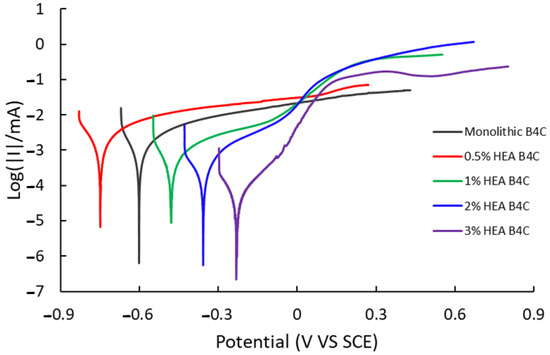
Figure 4.
Polarization curve of studied samples in 3.5% NaCl solution.
The 0.5% HEA B4C sample shows the most negative corrosion potential (Ecorr) and the highest corrosion current (Icorr) of all the composites under study, as can be seen in Table 1. It was observed to be oxidized the most among all samples. To obtain the corrosion rate, first, the Tafel slopes (βc and βa), equivalent weight, density and surface were calculated.

Table 1.
Corrosion parameters for all samples tested.
As the HEA content of composites increases, their corrosion rate decreases, indicating a higher corrosion resistance. Of all samples, B4C.3 presented the lowest corrosion potential, corrosion current and corrosion rate values, confirming that increasing the HEA content implies better performance regarding corrosion resistance. All four of the samples in our study tend to passivate, probably due to the creation of a passive film on their surface.
3.2.3. Electrochemical Impedance Spectroscopy (EIS)
EIS is an advanced method, being highly effective and accurate for analyzing interfacial properties associated with surface processes in metallic alloys. Unlike other electrochemical techniques, EIS offers significant advantages, such as operating under steady-state conditions, efficiently measuring small signals and covering a broad frequency range from 100 mHz up to 100 kHz.
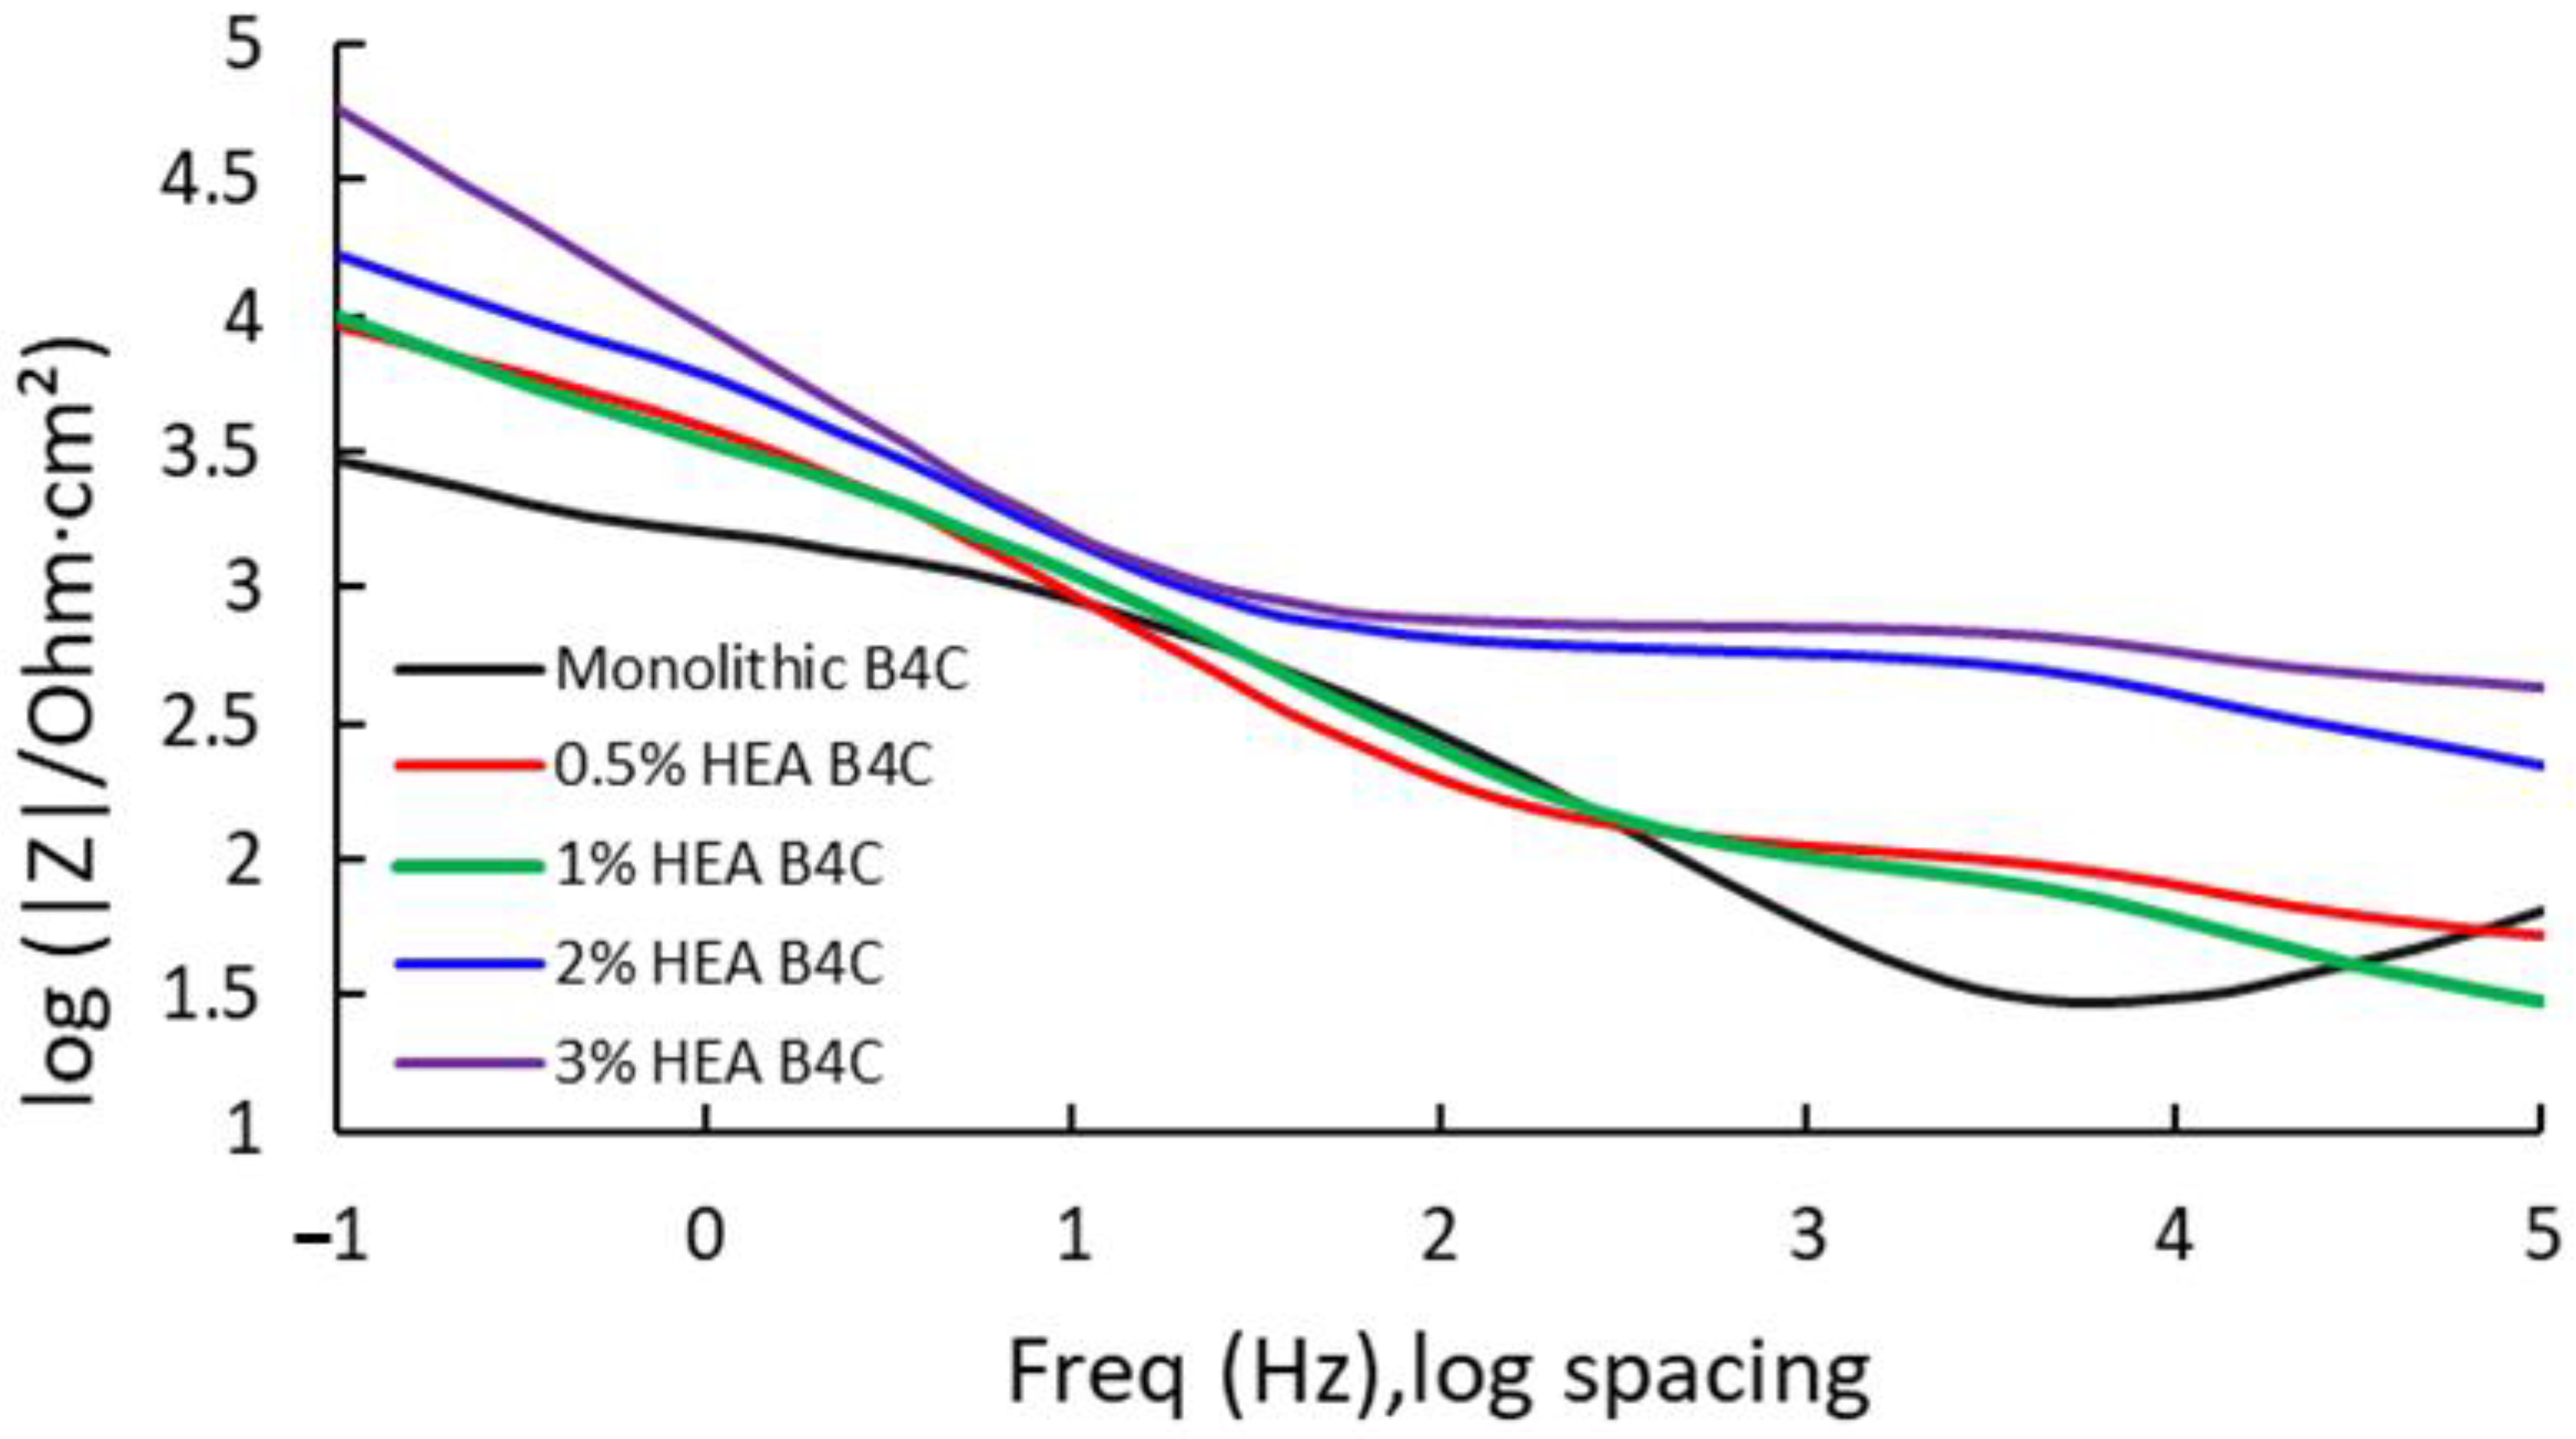
Electrochemical impedance spectroscopy results of the different composites are presented as Bode-phase impedance plots, recorded at a consistent potential in a 3.5% NaCl solution. Due to the high number of samples under study, the Bode impedance plot is presented in Figure 5 and the Bode-phase plot in Figure 6; this way, the conducted test can be interpretated easier.

Figure 5.
Bode impedance for the studied samples at Ecorr after 24 h of immersion in 3.5% NaCl solution.

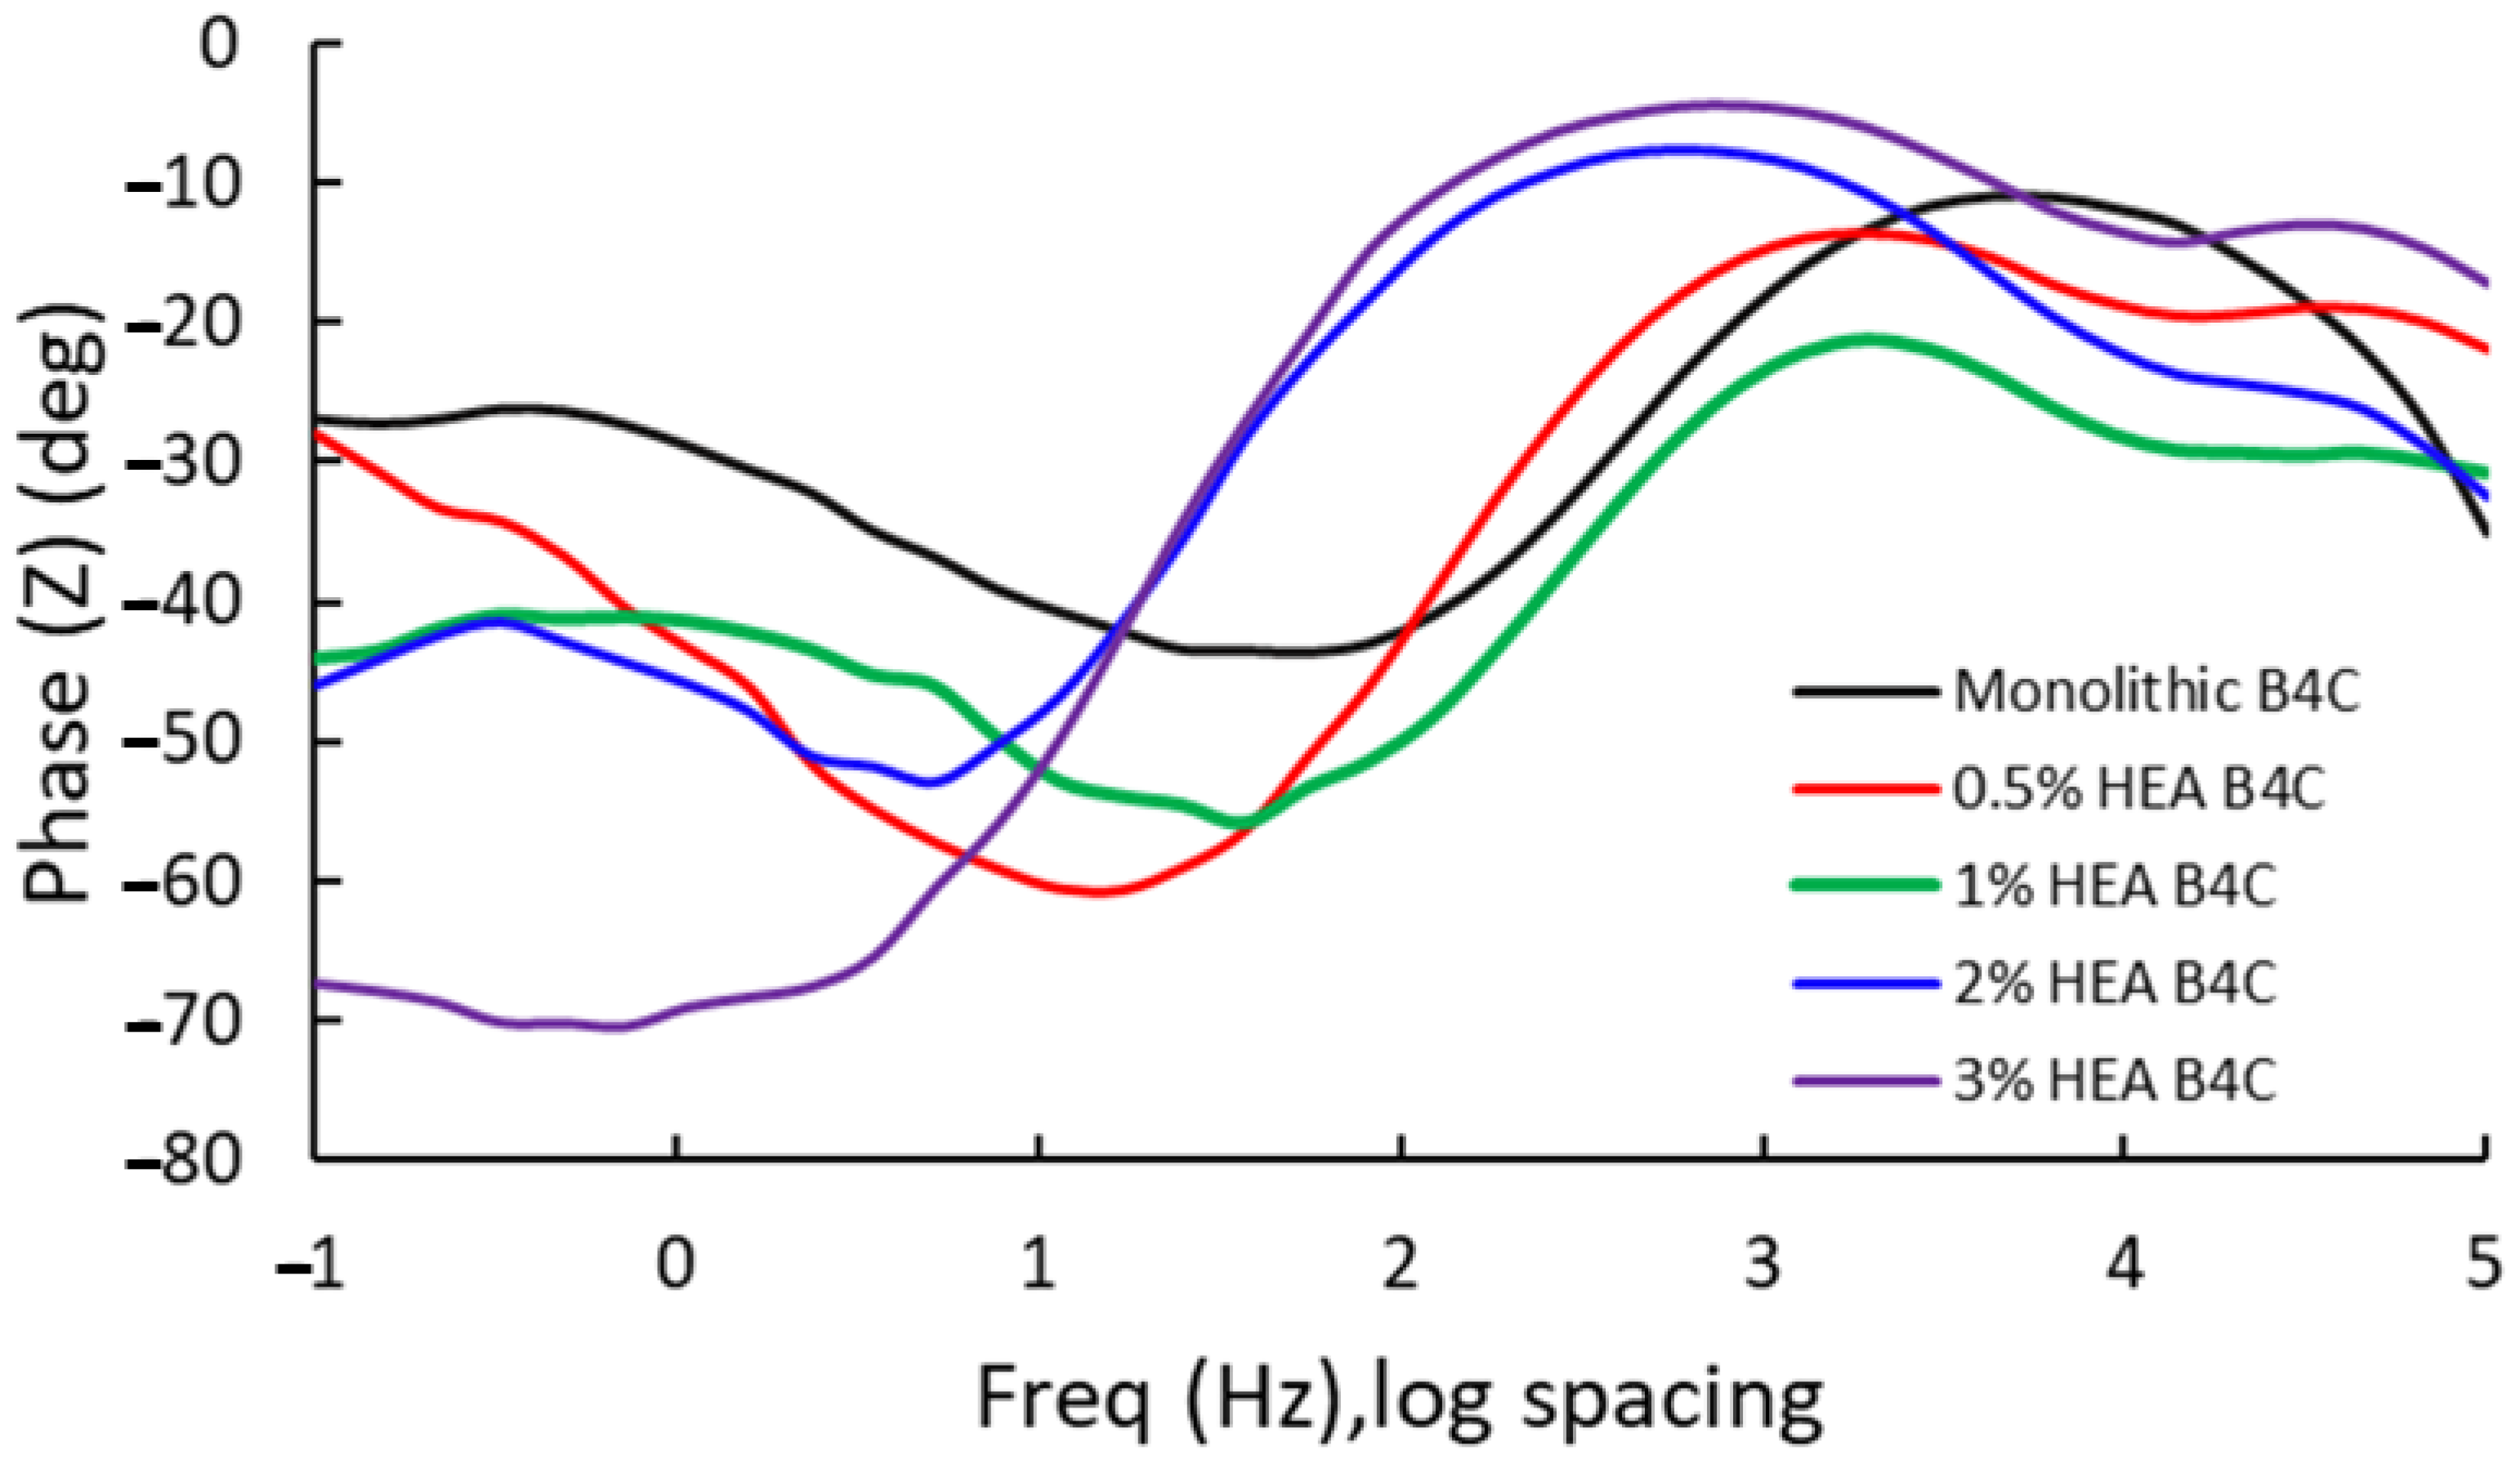
Figure 6.
Bode phase for the studied samples at Ecorr after 24 h of immersion in 3.5% NaCl solution.
In Figure 5, it is observed that the highest measure of impedance is attributed to B4C.3, which registered a value of 60.047 kΩ. This indicates that the 3% HEA composite has higher corrosion resistance as result of its capacity to oppose electric current. This is followed by B4C.2, presenting a similar result as obtained for the corrosion potential, as when the HEA volume percentage increases in the sample composition, the higher its corrosion resistance behavior. B4C.05 and B4C.1 presented similar results, indicating a very similar behavior.
The data obtained from the EIS measurements of B4C composites demonstrated a very high resistance to corrosion in artificial seawater, especially B4C.3. On the other hand, Bode-phase analysis of B4C-reinforced samples reveals significant differences in their electrochemical behaviors across frequency ranges (see Figure 7).
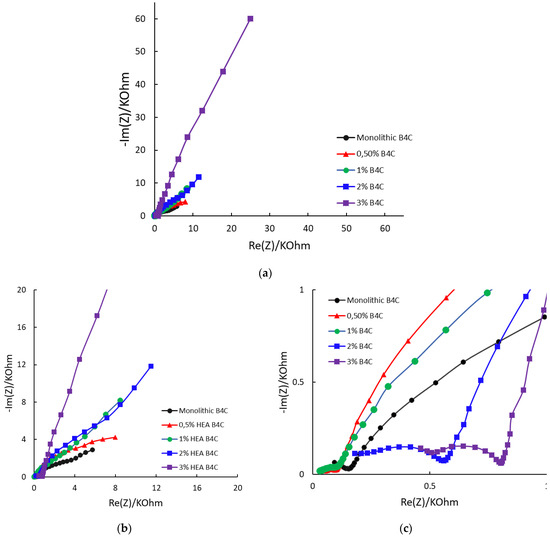
Figure 7.
Nyquist diagrams for the studied samples at Ecorr after 24 h of immersion in 3.5% NaCl solution: (a) complete plot; (b) detail at medium frequencies; (c) detail at low frequencies.
At low frequencies, the B4C.3 sample shows the most negative phase angle (−75°), which indicates a strong capacitive behavior and a strong passive layer. The B4C.05 sample shows a lower phase shift (~−30°), which implies a higher charge transfer rate and lower capacitive response. These results suggest that lower HEA concentrations lead to a thinner or less effective passive layer.
At medium frequencies, all the samples transition towards a mix between capacitive and resistive response. The 3% HEA B4C sample maintains the highest phase shift. This indicates superior electrochemical stability, which matches the corrosion potential and corrosion rate test results.
At high frequencies, it can be seen how all composites converge towards lower phase angles (~−10° to −30°), dominated by electrolyte resistance. The B4C.3 sample consistently demonstrates the best capacitive properties, implying improved corrosion resistance. On the other hand, the 0.5% and 1% B4C samples show the weakest capacitive response. This suggests that lower HEA concentrations result in a less effective passive layer. The intermediate behavior of the 2% B4C sample implies a balance between resistive and capacitive contributions.
The Nyquist diagram reveals, for every sample, three remarkable zones, as seen in Figure 7. High and medium frequencies are described with semicircles, and low frequencies are defined by a straight line, which indicates Warburg element appearance. This indicates that the corrosion mechanism of the samples is changing, from charge transfer to diffusion, with the B4C.3 sample exhibiting the most pronounced Warburg impedance [45,46]. The overall trend indicates that increasing the HEA content enhances resistance behavior. This can be explained potentially due to agglomeration effects or altered charge transport mechanisms. This must be considered when optimizing these materials for electrochemical applications.
A more vertical line in the low-frequency region suggests that the system behaves more like an ideal capacitor. This behavior may be associated with the formation of protective layers or barriers that restrict corrosion, confirming that of all composites, B4C.3 has the highest resistance to corrosion under the studied situation.
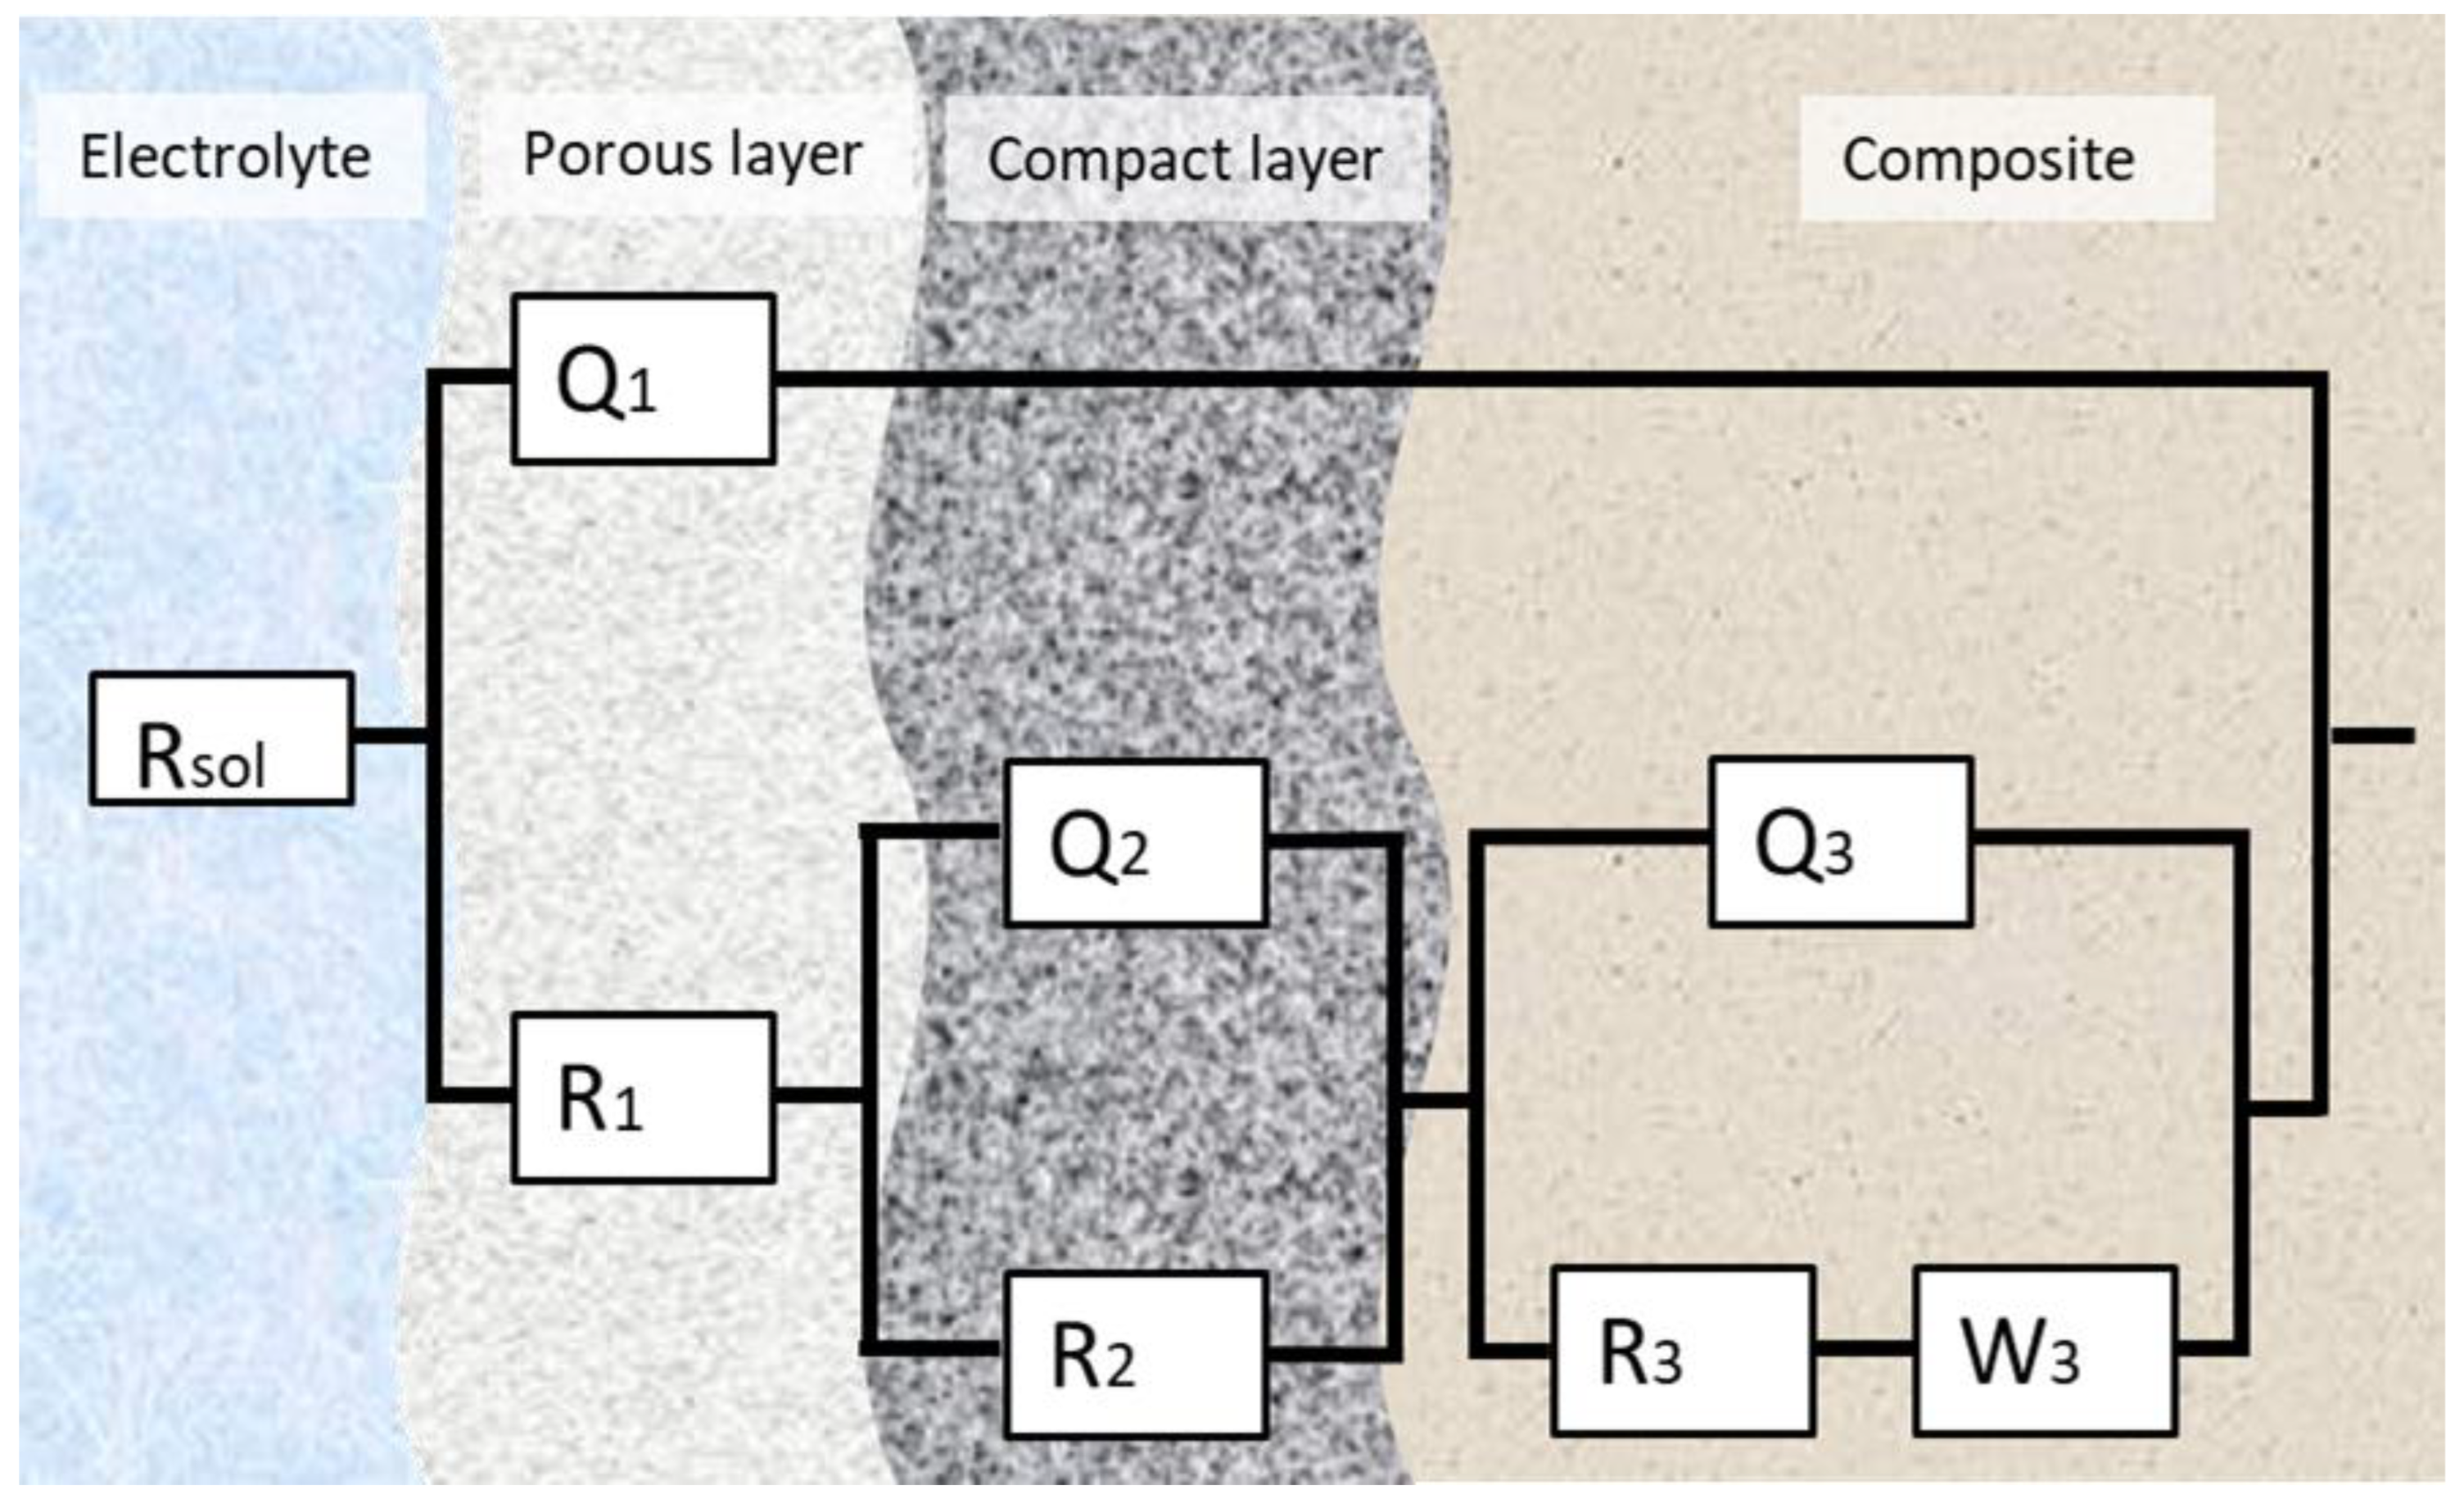
The experimental EIS data were analyzed using an electrical equivalent-circuit model, and ZSimpWin 3.6 software (Informer Technologies, Los Angeles, CA, USA) was used to accurately represent the impedance response. The equivalent-circuit model that provided the best fit for all studied samples can be seen in Figure 8. A chi-square (χ2) parameter close to 10−4 suggests a highly accurate fit between experimental and simulated data.
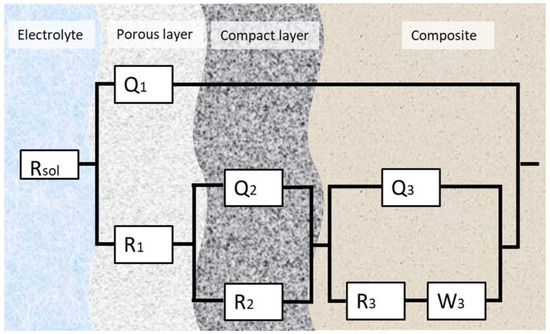
Figure 8.
The equivalent circuit for the fitting of the EIS data.
In contexts where the passivated surface is considered, the letter “Q” stands for a Constant Phase Element (CPE). When it comes to the diffusion of ions or electrons in solids or liquids, the “W” stands for the Warburg element.
This configuration suggests that before reaching the alloy film, the outer layers of the samples offer resistance to dissolution, characterized by a dual-layer passive structure, consisting of both porous and compact regions. After applying Kirchhoff’s circuit laws to the circuit and replacing the CPE and Warburg element, we obtained the following equation:
where the letters “A”, “B”, “C” and “D” stand for
The equivalent-circuit parameters for all samples can be seen in Table 2.
Table 2.
R(Q(R(QR)Q(RW))) equivalent-circuit parameters for all B4C-doped samples under study.
This study evaluates the electrochemical behavior of the composites under study, which suggests the appearance of a two-layer passive film. First, a porous outer layer, and secondly, a more compact inner layer, both play a role in the corrosion resistance of the samples.
In the first place, protective and corrosive processes are facilitated by the porous layer, which controls the diffusion of ions and oxygen. Its porosity, thickness and roughness play an important role in chloride ion penetration, which directly affects the compact layer.
Finally, the compact layer works as the primary corrosion barrier. It ensures surface passivation by limiting ion and electron transport. Its stability is crucial for long-term protection, as degradation may lead to localized corrosion. Metal ion migration (e.g., Fe2+ or Cr3+) and oxygen diffusion contribute to passivity maintenance by the formation of protective oxides.
The EIS analysis confirms the existence of multiple corrosion layers. The appearance of the Warburg element on both Nyquist diagrams and the equivalent circuit indicates that the corrosion process is controlled by diffusion. This implies the creation of a protective film that helps with the passivation of the alloy.
3.3. Microhardness
The aggregation of HEA phases at grain junctions, frequently observed in earlier B4C composite microhardness studies, was responsible for the identification of a porous microstructure and various fissures on the SEM images, primarily along the grain borders [47,48,49]. This suggested the need to perform a microhardness statistical analysis.
In order to perform this analysis, a fixed load of 19.61 N was applied on numerous occasions along different regions of the surface of all studied samples. With the use of a diamond point pyramidal indenter (136° edge angle), an indentation was developed after applying a vertical load for 15 s. The hardness of all studied samples as a relation between the applied load and the indentation mark was determined using the Vickers method.
Table 3 provides a summary of the findings of all studied samples, accompanied by different visual representations (boxplots, histograms and normal distribution curves) to provide a comprehensive comparison of hardness values across the different composites.
Table 3.
Statistical parameters of Vickers hardness measurements for B4C composites and monolithic B4C sample.
In the analysis of the statistical values, it can be seen how 2% and 3% HEA samples exhibit the greatest hardness values, which confirms that HEA doping positively influences the hardness of B4C ceramics. Lower HEA concentrations (0.5% and 1%) showed lower hardness values. This relation can be explained with the microstructure analysis seen in the SEM images, where the porosity of the lower HEA concentration composites was not completely filled, leading to an incomplete phase integration with the ceramic matrix and microstructural inconsistencies.
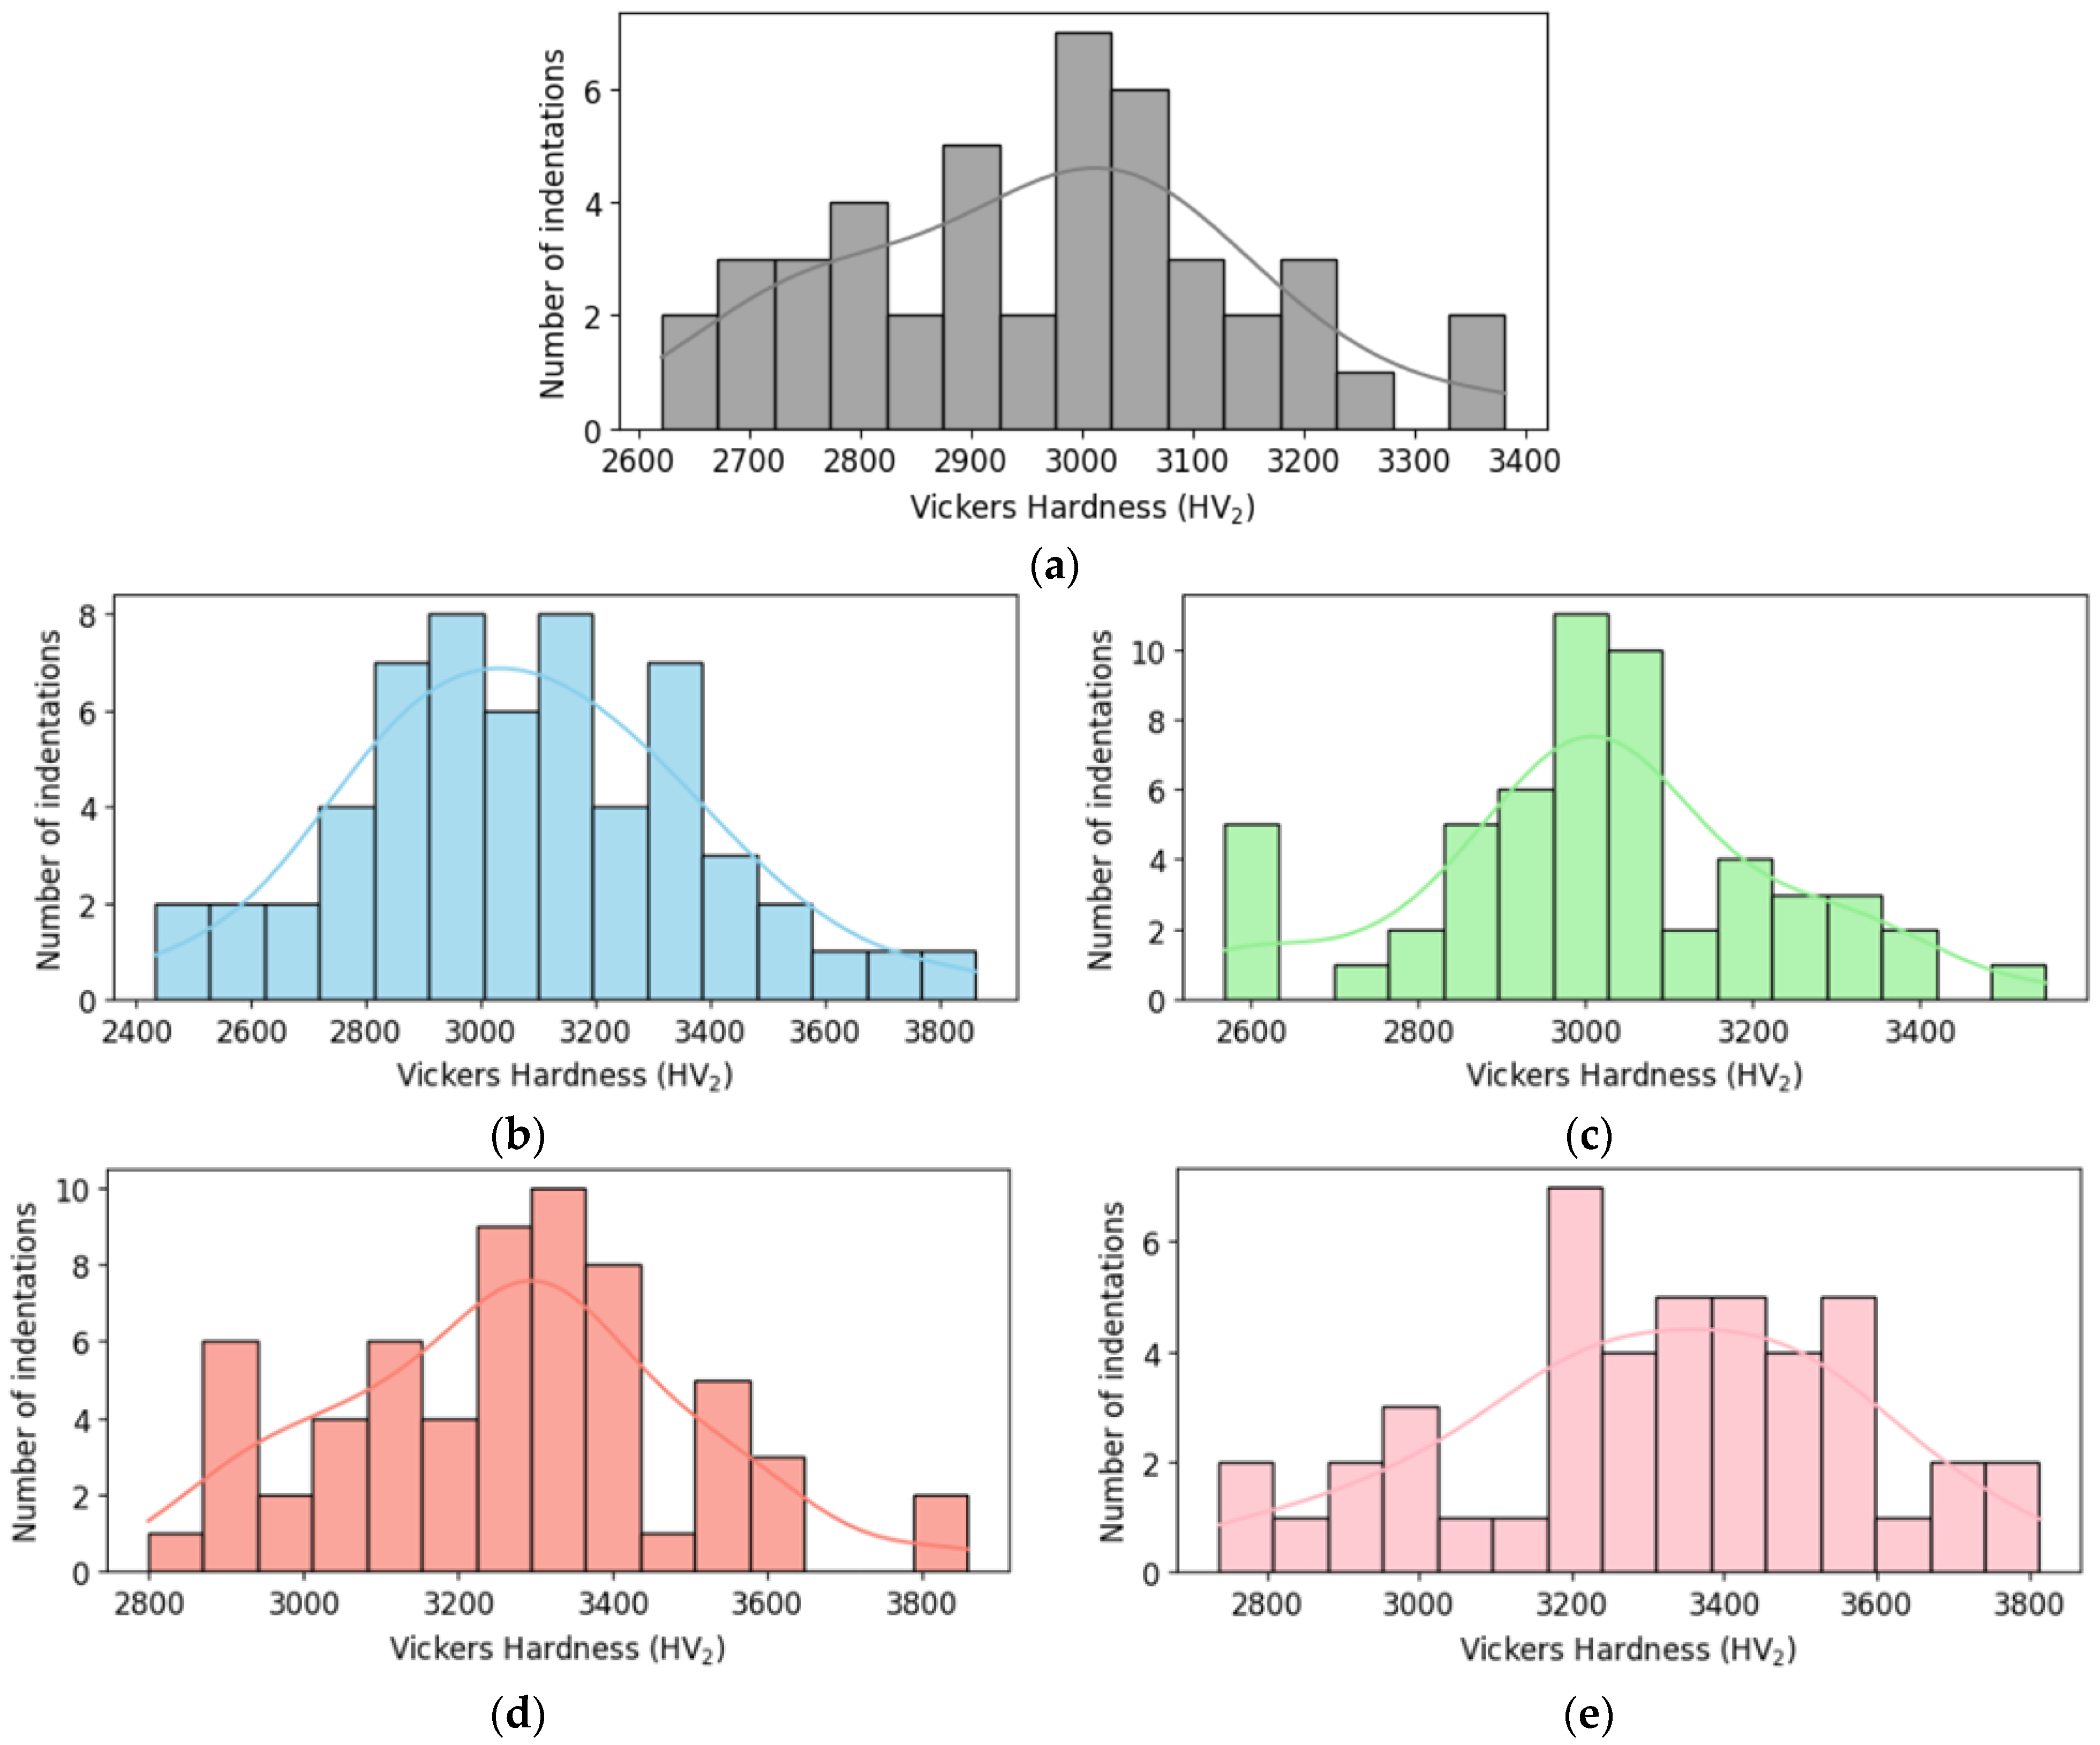
The histogram provides a visual representation of the frequency distribution of Vickers hardness values for each B4C sample under study. This allows for an easy and intuitive comparison of the hardness variations among different compositions. By analyzing the histograms, it is possible to identify the spread, central tendency and asymmetries of the hardness distributions among HEA additions (see Figure 9).

Figure 9.
Histogram of Vickers hardness for (a) monolithic B4C; (b) B4C.05; (c) B4C.1; (d) B4C.2; and (e) B4C.3.
Histograms charts reveal how the addition of HEA affects the hardness distribution. They show the hardness values of all indentations classified into different ranges. Composites with high HEA doping show higher hardness measures and smaller spread, suggesting a more homogenous hardness profile. The 0.5% HEA composite shows lower hardness measures and a wider distribution, which indicates greater variability.
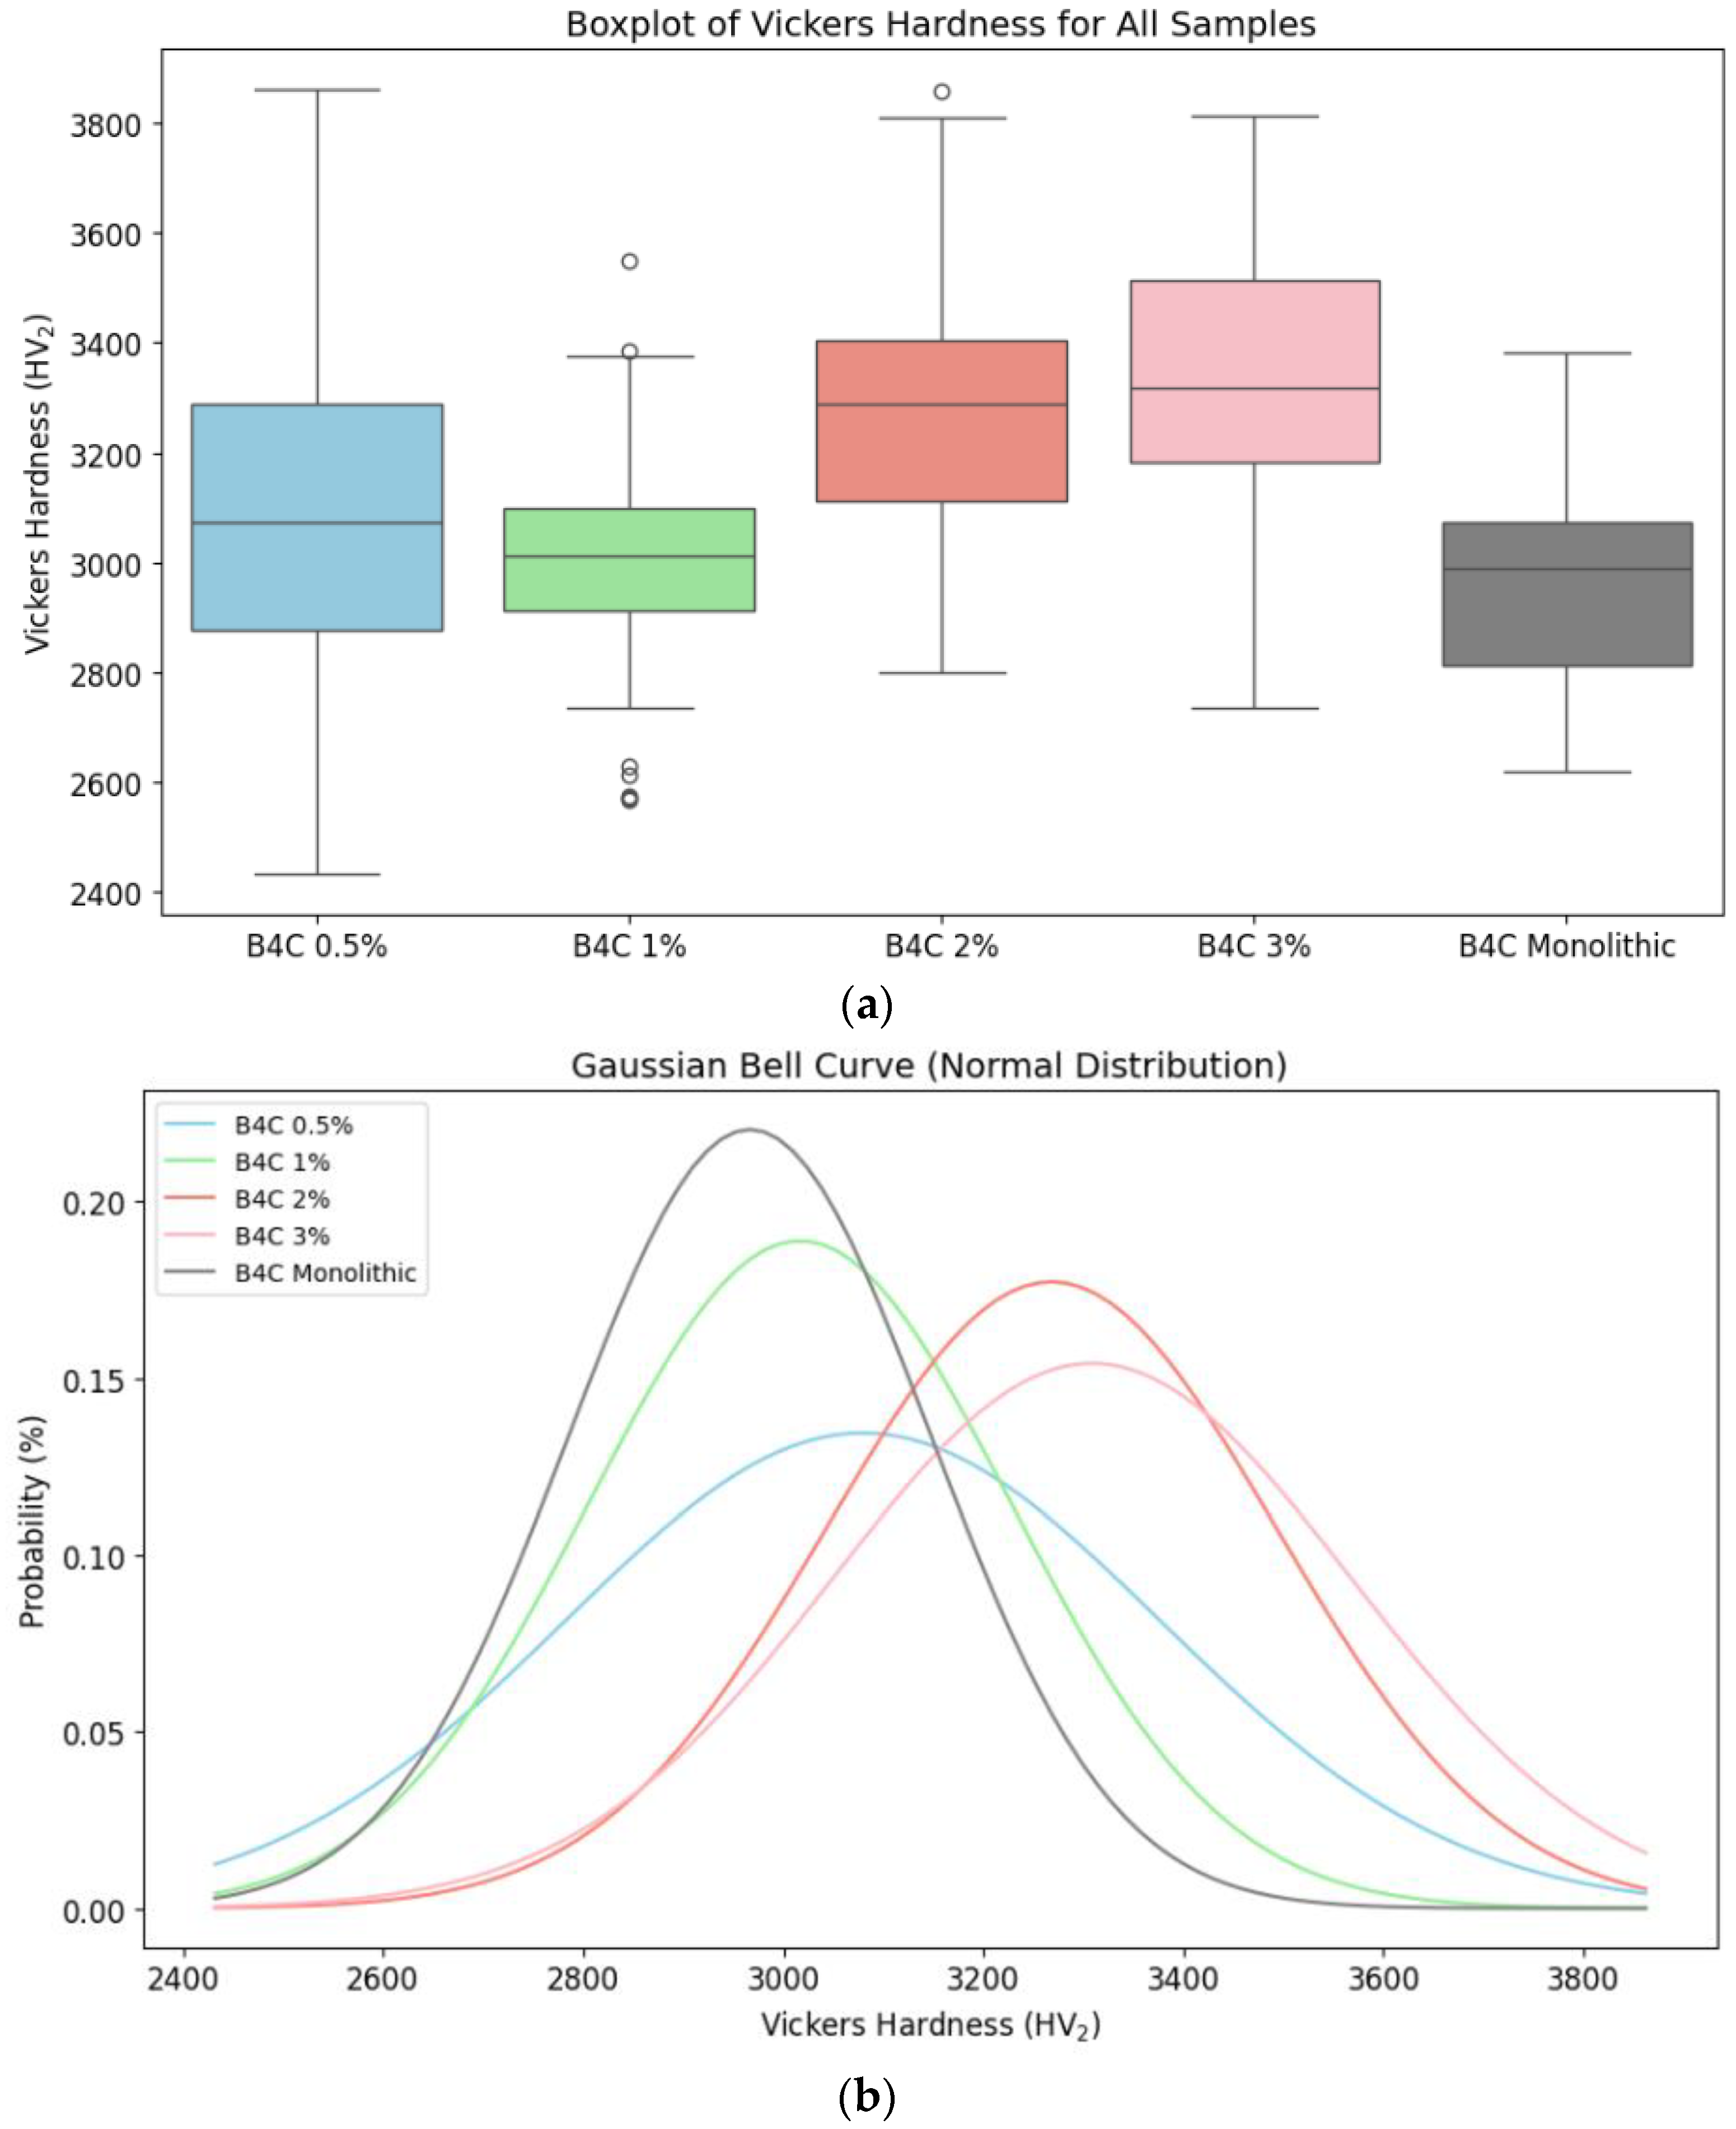
In addition, box plots and normal distribution graphs of the Vickers hardness values obtained (see Figure 10) were generated in order to complete the statistical analysis. Information about the mechanical behavior of all composites and the impact of varying doping concentrations is obtained.

Figure 10.
Vickers hardness for B4C composites and monolithic sample comparison: (a) distribution of Vickers hardness data through its quartiles; (b) probability distribution of the hardness values.
The analysis of quartiles and Gaussian curves demonstrates that the 1% and 2% of HEA samples have a more consistent and predictable hardness distribution. The 0.5% HEA concentration composite possesses a wider spread and more variability, indicating continuous microstructural modifications. On the other hand, the B4C.2 sample has less variability, confirming the SEM results. These results prove the idea that HEA doping improves the B4C ceramic’s mechanical performance, with the greatest results shown for higher HEA concentrations.
4. Conclusions
Focusing on the electrochemical and mechanical performances of B4C ceramics doped with varying concentrations (0.5%, 1%, 2% and 3%) of CoCrFeNiMo HEA, the principal findings are described as follows:
- When CoCrFeNiMo high-entropy alloy is added to the B4C ceramic matrix, a denser structure is obtained. A more refined grain structure was obtained because of this doping procedure. HEA addition leads to a more compact configuration and the inhibition of grain expansion in comparison to monolithic B4C, resulting in notable microstructure alterations. Of all the samples studied, the smaller average grain size and the denser configuration were achieved in the 2% HEA concentration sample.
- Electrochemical tests revealed that corrosion resistance improved progressively with higher HEA content. The 3% HEA-doped B4C demonstrates the highest resistance in artificial seawater conditions. The enhanced performance is attributed to the formation of a more compact and protective passive layer, effectively mitigating material corrosion.
- The statistical microhardness analysis of all composites revealed that even though every sample followed a normal distribution (suggesting a homogeneous structure), the 0.5% and 3% HEA concentrations had a less uniform and predictable hardness distribution, which suggests ongoing microstructural adjustments. The Vickers hardness of the B4C-doped composites were higher as the HEA percentage increased, indicating a strict relation between doping and hardness.
All the tests carried out clearly determine that increasing the HEA content implies better performance regarding corrosion resistance and mechanical properties. The 3% HEA B4C composite exhibited the best results across all different tests, while the 0.5% HEA B4C sample showed the poorest performance. The study finally determines the potential of CoCrFeNiMo HEA-doped B4C ceramics for applications that involve mechanical strength and corrosion resistance. It highlights the outstanding behavior of all composites in aggressive environments, especially the 3% HEA-doped composite.
Author Contributions
Conceptualization A.D.R.-C.; methodology, A.D.R.-C.; software, A.D.R.-C.; validation, J.C.M.-R. and G.G.; formal analysis, A.D.R.-C. and B.C.O.; investigation, A.D.R.-C.; resources, J.C.M.-R. and G.G.; data curation, A.D.R.-C.; writing—original draft preparation, A.D.R.-C.; writing—review and editing, A.D.R.-C.; visualization, A.D.R.-C.; supervision, J.C.M.-R. and G.G. All authors have read and agreed to the published version of the manuscript.
Funding
This research was funded by European project 2023-1-RO01-KA220-HED-000159985: Smart Healthcare Engineering and Government of Gran Canaria project, with the reference PROID2024010003.
Institutional Review Board Statement
Not applicable.
Informed Consent Statement
Not applicable.
Data Availability Statement
The original contributions presented in this study are included in the article. Further inquiries can be directed to the corresponding author.
Acknowledgments
We hereby acknowledge the European project 2023-1-RO01-KA220-HED-000159985: Smart Healthcare Engineering and Government of Gran Canaria project, with the reference PROID2024010003.
Conflicts of Interest
The authors declare no conflicts of interest.
References
- Yavas, B.; Sahin, F.; Yucel, O.; Goller, G. Effect of Particle Size, Heating Rate and CNT Addition on Densification, Microstructure and Mechanical Properties of B4C Ceramics. Ceram. Int. 2015, 41, 8936–8944. [Google Scholar] [CrossRef]
- Domnich, V.; Reynaud, S.; Haber, R.A.; Chhowalla, M. Boron Carbide: Structure, Properties, and Stability under Stress. J. Am. Ceram. Soc. 2011, 94, 3605–3628. [Google Scholar] [CrossRef]
- Suri, A.K.; Subramanian, C.; Sonber, J.K.; Ch Murthy, T.S.R. Synthesis and Consolidation of Boron Carbide: A Review. Int. Mater. Rev. 2010, 55, 4–38. [Google Scholar] [CrossRef]
- Pérez, S.; Tamayo, P.; Rico, J.; Alonso, J.; Thomas, C. Effect of Fibers and Boron Carbide on the Radiation Shielding Properties of Limestone and Magnetite Aggregate Concrete. Prog. Nucl. Energy 2024, 175, 105320. [Google Scholar] [CrossRef]
- Tamayo, P.; Thomas, C.; Rico, J.; Pérez, S.; Mañanes, A. Radiation Shielding Properties of Siderurgical Aggregate Concrete. Constr. Build. Mater. 2022, 319, 126098. [Google Scholar] [CrossRef]
- Zhang, W. A Review of Tribological Properties for Boron Carbide Ceramics. Prog. Mater. Sci. 2021, 116, 100718. [Google Scholar] [CrossRef]
- Zorzi, J.E.; Perottoni, C.A.; Da Jornada, J.A.H. Hardness and Wear Resistance of B4C Ceramics Prepared with Several Additives. Mater. Lett. 2005, 59, 2932–2935. [Google Scholar] [CrossRef]
- Cantor, B.; Chang, I.T.H.; Knight, P.; Vincent, A.J.B. Microstructural Development in Equiatomic Multicomponent Alloys. Mater. Sci. Eng. 2004, 375, 213–218. [Google Scholar] [CrossRef]
- Yeh, J.W. Recent Progress in High-Entropy Alloys. Ann. Chim. Sci. Mater. 2006, 31, 633–648. [Google Scholar] [CrossRef]
- Kozhakhmetov, Y.; Skakov, M.; Kurbanbekov, S.; Uazyrkhanova, G.; Kurmantayev, A.; Kizatov, A.; Mussakhan, N. High-Entropy Alloys: Innovative Materials with Unique Properties for Hydrogen Storage and Technologies for Their Production. Metals 2025, 15, 100. [Google Scholar] [CrossRef]
- de Oliveira, T.G.; Fagundes, D.V.; Capellato, P.; Sachs, D.; da Silva, A.A.A.P. A Review of Biomaterials Based on High-Entropy Alloys. Metals 2022, 12, 1940. [Google Scholar] [CrossRef]
- Castro, D.; Jaeger, P.; Baptista, A.C.; Oliveira, J.P. An Overview of High-entropy Alloys as Biomaterials. Metals 2021, 11, 648. [Google Scholar] [CrossRef]
- Gawel, R.; Rogal, Ł.; Smoła, G.; Grzesik, Z. High-Temperature Oxidation and Diffusion Studies on Selected Al–Cr–Fe–Ni High-Entropy Alloys for Potential Application in Thermal Barrier Coatings. Intermetallics 2024, 169, 108273. [Google Scholar] [CrossRef]
- Yang, H.; Shao, Z.; Lu, Q.; Cui, C.; Xu, L.; Yang, G. Development of Reduced-Activation and Radiation-Resistant High-Entropy Alloys for Fusion Reactor. Int. J. Refract. Met. Hard Mater. 2024, 121, 106674. [Google Scholar] [CrossRef]
- Chakraborty, P.; Sarkar, A.; Ali, K.; Jha, J.; Jothilakshmi, N.; Arya, A.; Tewari, R. Design and Development of Low Density, High Strength ZrNbAlVTi High Entropy Alloy for High Temperature Applications. Int. J. Refract. Met. Hard Mater. 2023, 113, 106222. [Google Scholar] [CrossRef]
- Xu, Z.Q.; Ma, Z.L.; Wang, M.; Chen, Y.W.; Tan, Y.D.; Cheng, X.W. Design of Novel Low-Density Refractory High Entropy Alloys for High-Temperature Applications. Mater. Sci. Eng. 2019, 755, 318–322. [Google Scholar] [CrossRef]
- Nartita, R.; Ionita, D.; Demetrescu, I. A Modern Approach to HEAs: From Structure to Properties and Potential Applications. Crystals 2024, 14, 451. [Google Scholar] [CrossRef]
- Naveen, L.; Umre, P.; Chakraborty, P.; Rahul, M.R.; Samal, S.; Tewari, R. Development of Single-Phase BCC Refractory High Entropy Alloys Using Machine Learning Techniques. Comput. Mater. Sci. 2024, 238, 112917. [Google Scholar] [CrossRef]
- Wakai, E.; Noto, H.; Shibayama, T.; Furuya, K.; Ando, M.; Kamada, T.; Ishida, T.; Makimura, S. Microstructures and Hardness of BCC Phase Iron-Based High Entropy Alloy Fe-Mn-Cr-V-Al-C. Mater. Charact. 2024, 211, 113881. [Google Scholar] [CrossRef]
- Li, C.; Ma, Z.; Tong, S.; Liu, J.; Zhang, W.; Shen, G.; Wang, S.; Zhao, H.; Ren, L. Mechanical-Thermal Coupling Fatigue Failure of CoCrFeMnNi High Entropy Alloy. J. Mater. Res. Technol. 2024, 30, 3430–3437. [Google Scholar] [CrossRef]
- Matsuzaka, T.; Hyakubu, A.; Kim, Y.S.; Matsugaki, A.; Nagase, T.; Ishimoto, T.; Ozasa, R.; Kim, H.S.; Mizuguchi, T.; Gokcekaya, O.; et al. Development of an Equiatomic Octonary TiNbTaZrMoHfWCr Super-High-Entropy Alloy for Biomedical Applications. Mater. Chem. Phys. 2024, 316, 129120. [Google Scholar] [CrossRef]
- Wu, Y.; Du, C.; Yu, Z.; Wang, R.; Ren, X. Effect of Cu Content on the Microstructure and Mechanical Properties of Fe20Co30Ni10Cr20Mn20 FCC-Typed HEAs. Mater. Sci. Eng. 2024, 897, 146336. [Google Scholar] [CrossRef]
- Yen, C.C.; Lin, S.Y.; Ting, C.L.; Tsai, T.L.; Chen, Y.T.; Yen, S.K. Passivation Mechanisms of CoCrFeNiMox (x = 0, 0.1, 0.2, 0.3) High Entropy Alloys and MP35N in 3.5 Wt% NaCl Aerated Aqueous Solutions. Corros. Sci. 2024, 228, 111812. [Google Scholar] [CrossRef]
- Dong, D.; Jiang, W.; Wang, X.; Ma, T.; Zhu, D.; Wang, Y.; Huo, J. Enhanced Mechanical Properties of High Pressure Solidified CoCrFeNiMo0.3 High Entropy Alloy via Nano-Precipitated Phase. Intermetallics 2024, 166, 108192. [Google Scholar] [CrossRef]
- Zin, V.; Montagner, F.; Miorin, E.; Mortalò, C.; Tinazzi, R.; Bolelli, G.; Lusvarghi, L.; Togni, A.; Frabboni, S.; Gazzadi, G.; et al. Effect of Mo Content on the Microstructure and Mechanical Properties of CoCrFeNiMox HEA Coatings Deposited by High Power Impulse Magnetron Sputtering. Surf. Coat. Technol. 2024, 476, 130244. [Google Scholar] [CrossRef]
- Guo, K.; Sun, Y.; Cheng, W.; Gu, J.; Chen, Y.; Zhang, S. Effect of Rare Earth La2O3 on the Microstructure and Corrosion Resistance of CoCrFeNiMoSi High Entropy Alloys. Surf. Interfaces 2024, 44, 103683. [Google Scholar] [CrossRef]
- Brito-Garcia, S.; Mirza-Rosca, J.; Geanta, V.; Voiculescu, I. Mechanical and Corrosion Behavior of Zr-Doped High-Entropy Alloy from CoCrFeMoNi System. Materials 2023, 16, 1832. [Google Scholar] [CrossRef]
- Semikolenov, A.; Shalnova, S.; Klinkov, V.; Andreeva, V.; Salynova, M.; Larionova, T.; Tolochko, O. Effect of al Content on Phase Compositions of FeNiCoCrMo0.5AlxHigh Entropy Alloy. Metals 2021, 11, 1734. [Google Scholar] [CrossRef]
- Brito-García, S.; Jiménez-Marcos, C.; Mirza-Rosca, J.; Voiculescu, I. Behavior of Ti-Doped CoCrFeMoNi High Entropy Alloy. Microsc. Microanal. 2023, 29, 439–444. [Google Scholar] [CrossRef]
- Li, Y.; Zhang, J.; Huang, X.; Liu, J.; Deng, L.; Han, P. Influence of Laser Power on Microstructure Evolution and Properties of Laser Cladded FeNiCoCrMo HEA Coatings. Mater. Today Commun. 2023, 35, 105615. [Google Scholar] [CrossRef]
- Wu, H.; Zhang, S.; Wang, Z.Y.; Zhang, C.H.; Chen, H.T.; Chen, J. New Studies on Wear and Corrosion Behavior of Laser Cladding FeNiCoCrMox High Entropy Alloy Coating: The Role of Mo. Int. J. Refract. Metals. Hard. Mater. 2022, 102, 105721. [Google Scholar] [CrossRef]
- Wang, W.; Wang, J.; Sun, Z.; Li, J.; Li, L.; Song, X.; Wen, X.; Xie, L.; Yang, X. Effect of Mo and Aging Temperature on Corrosion Behavior of (CoCrFeNi)100-XMox High-Entropy Alloys. J. Alloys Compd 2020, 812, 152139. [Google Scholar] [CrossRef]
- Fu, Y.; Huang, C.; Du, C.; Li, J.; Dai, C.; Luo, H.; Liu, Z.; Li, X. Evolution in Microstructure, Wear, Corrosion, and Tribocorrosion Behavior of Mo-Containing High-Entropy Alloy Coatings Fabricated by Laser Cladding. Corros. Sci. 2021, 191, 109727. [Google Scholar] [CrossRef]
- Dai, C.; Luo, H.; Li, J.; Du, C.; Liu, Z.; Yao, J. X-Ray Photoelectron Spectroscopy and Electrochemical Investigation of the Passive Behavior of High-Entropy FeCoCrNiMox Alloys in Sulfuric Acid. Appl. Surf. Sci. 2020, 499, 143903. [Google Scholar] [CrossRef]
- Wang, L.; Mercier, D.; Zanna, S.; Seyeux, A.; Laurent-Brocq, M.; Perrière, L.; Guillot, I.; Marcus, P. Study of the Surface Oxides and Corrosion Behaviour of an Equiatomic CoCrFeMnNi High Entropy Alloy by XPS and ToF-SIMS. Corros. Sci. 2020, 167, 108507. [Google Scholar] [CrossRef]
- Rico-Cano, A.D.; Mirza-Rosca, J.C.; Ocak, B.C.; Goller, G. Corrosion Behavior and Microhardness of a New B4C Ceramic Doped with 3% Volume High-Entropy Alloy in an Aggressive Environment. Metals 2025, 15, 79. [Google Scholar] [CrossRef]
- Rico-Cano, A.D.; Mirza-Rosca, J.C.; Ocak, B.C.; Goller, G. Corrosion Behavior of New B4C Ceramic Doped with High-Entropy Alloy in an Aggressive Environment. Microsc. Microanal. 2024, 30, ozae044.666. [Google Scholar] [CrossRef]
- ASTM E112-96; Standard Test Methods for Determining Average Grain Size. ASTM International: West Conshohocken, PA, USA, 2004.
- ASTM G5-94; Standard Reference Test Method for Making Potentiostatic and Potentiodynamic Anodic Polarization Measurements. ASTM: West Conshohocken, PA, USA, 2004.
- ASTM G5-87; Recommended Practice for Making Potentiostatic and Potentiodynamic Polarization Measurements, Annual Book of Standards. ASTM International: West Conshohocken, PA, USA, 2002.
- ISO 16773-1-4:2016; Electrochemical Impedance Spectroscopy (EIS) on Coated and Uncoated Metallic Specimens n.d. ISO: Geneva, Switzerland, 2016.
- ISO 14577-1:2015; Metallic Materials—Instrumented Indentation Test for Hardness and Materials Parameters—Part 1: Test Method n.d. ISO: Geneva, Switzerland, 2015.
- German, R.M.; Suri, P.; Park, S.J. Review: Liquid Phase Sintering. J. Mater. Sci. 2009, 44, 1–39. [Google Scholar] [CrossRef]
- Wagner, C.; Traud, W. “On the Interpretation of Corrosion Processes through the Superposition of Electrochemical Partial Processes and on the Potential of Mixed Electrodes,” with a Perspective by F. Mansfeld. Corrosion 2006, 62, 843. [Google Scholar]
- Xu, M.; Zheng, Z.; Han, D.; Ma, R.; Du, A.; Fan, Y.; Zhao, X.; Cao, X. Improvement of Cracking Resistance of Hot-Dip Zn-Al-Mg Coatings by Heat Treatment. Mater. Today Commun. 2023, 36, 106521. [Google Scholar] [CrossRef]
- Wang, J.; Han, D.; Qiao, Z.; Zheng, Z.; Ma, R.; Du, A.; Fan, Y.; Zhao, X.; Yu, H.; Cao, X. Study on the Microstructure and Corrosion Resistance of Hot-Dip Al-Zn-Si-XMg Coating. Surf. Coat. Technol. 2025, 496, 131654. [Google Scholar] [CrossRef]
- Uzun, A.; Asikuzun, E.; Gokmen, U.; Cinici, H. Vickers Microhardness Studies on B4C Reinforced/Unreinforced Foamable Aluminium Composites. Trans. Indian Inst. Met. 2018, 71, 327–337. [Google Scholar] [CrossRef]
- Cramer, C.L.; Cakmak, E.; Unocic, K.A. Hardness Measurements and Interface Behavior of SiC-B4C-Si Multiple Phase Particulate Composites Made with Melt Infiltration and Additive Manufacturing. J. Compos. Sci. 2023, 7, 172. [Google Scholar] [CrossRef]
- Ma, H.; Liang, Y.; Fu, H. Effect of B4C Addition on Microstructure and Wear Resistance of Laser Cladding NiCrBSi Coatings. JOM 2023, 75, 515–525. [Google Scholar] [CrossRef]


Disclaimer/Publisher’s Note: The statements, opinions and data contained in all publications are solely those of the individual author(s) and contributor(s) and not of MDPI and/or the editor(s). MDPI and/or the editor(s) disclaim responsibility for any injury to people or property resulting from any ideas, methods, instructions or products referred to in the content. |
© 2025 by the authors. Licensee MDPI, Basel, Switzerland. This article is an open access article distributed under the terms and conditions of the Creative Commons Attribution (CC BY) license (https://creativecommons.org/licenses/by/4.0/).