Article

Electromagnetic-Based Localization of Moisture Anomalies in Grain Using Delay-Multiply-and-Sum Beamforming Technique

by
Xiaoxu Deng
1,*,
Xin Yan
1,
Jinyi Zhong
1 and
Zhongyu Hou
2
1
Guangzhou Institute of Advanced Technology, Guangzhou 511458, China
2
National Key Laboratory of Science and Technology on Micro/Nano Fabrication, Department of Micro/Nano Electronics, School of Electronic Information and Electrical Engineering, Shanghai Jiao Tong University, Shanghai 200240, China
*
Author to whom correspondence should be addressed.
Appl. Sci. 2025, 15(9), 4848; https://doi.org/10.3390/app15094848
Submission received: 2 April 2025 / Revised: 20 April 2025 / Accepted: 22 April 2025 / Published: 27 April 2025

Abstract

:

Featured Application

grain storage monitoring; quality control; and food safety.

Abstract

Timely detection and treatment of moisture anomalous regions in grain storage facilities is crucial for preventing mold growth, germination, and pest infestation. To locate these regions, this paper presents a novel anomalous moisture region localization algorithm based on the delay-multiply-and-sum (DMAS) beamforming techniques, including the design of an effective spatial arrangement of electromagnetic wave transmitters and receivers, along with comprehensive testing of detectable regions and experimental validation of anomaly localization across varying moisture levels and positions within grain piles. Following initial localization using the proposed algorithm, the study introduces a reliability assessment method for unknown samples based on the signal-to-mean ratio (SMR) value and compares the region of maximum response intensity with that of maximum connected domain volume. The system demonstrated successful localization of a 7 cm × 7 cm × 7 cm region with 15.4% moisture content within a cubic experimental bin containing 10.5% moisture content long-grained rice, achieving an average recall accuracy exceeding 50%. The proposed method presents rapid detection capabilities and precise localization, showing potential for moisture content evaluation of anomalous regions and practical applications in grain storage monitoring systems.

1. Introduction

Grain storage systems are crucial for ensuring food security. However, global grain storage losses amount to approximately 8% annually, with even more substantial losses among dispersed rural households due to inadequate storage conditions. Storage losses are primarily influenced by two factors: moisture and temperature. Moisture impact is particularly significant, as excessive moisture can lead to localized hotspots (deteriorating regions with elevated temperatures and moisture) within storage facilities. These conditions trigger multiple issues, including seed germination, mold growth, and pest infestation [1]. Currently, effective methods for the timely detection of these anomalies in deep grain storage areas remain lacking.
In situ moisture detection techniques for grain piles primarily include conventional sensors (temperature, moisture, or chemical sensors) [2,3], near-infrared moisture measurement [4], acoustic temperature detection, and microwave scattering methods [5]. The first three approaches share a common limitation: shallow detection depth. This constraint arises from two main factors: (1) grain’s excellent thermal insulation properties, which limit sensor sensitivity to nearby grains only; and (2) the limited penetration capabilities of near-infrared and acoustic methods, restricting their application to surface-level detection. These limitations make it difficult to detect hotspots in deep grain layers. In contrast, microwave-based methods show promising potential for deep-layer hotspot detection, primarily due to microwaves’ superior penetration capability.
Current microwave-based methods for detecting moisture anomalies in grain piles primarily comprise two approaches: electromagnetic imaging reconstruction [6,7,8,9,10,11] and electromagnetic wave reflection analysis [12,13,14]. For instance, Joe LoVetri et al. [7,8] at the University of Manitoba applied electromagnetic imaging to grain inspection, developing a finite element contrast source inversion (FEM-CSI) method and designing thin coaxial semi-circular antennas for hotspot detection in industrial-scale grain silos. However, significant challenges persist. Methods using Maxwell’s equations to describe microwave scattering phenomena face inherent complexities [15], including solution non-uniqueness due to non-radiating currents, non-linearity associated with multiple scattering effects, ill-conditioned problems, and high computational costs [16]. These challenges can result in processing times of several hours and potential artifacts. CHEN et al. [17] also applied their method to granaries. Similar to humidity sensors, the accuracy of radio-frequency moisture sensors for grain moisture detection was affected to varying degrees by ventilated granary conditions.
Despite microwaves’ strong penetration capability, electromagnetic reflection methods for moisture assessment typically achieve only shallow detection depths [12,14]. For example, Zhang et al. [12] developed an open-ended coaxial wave-guide sensor for direct insertion into grain piles for moisture measurement. However, this sampling-based approach has significant limitations: it may miss anomalies when multiple irregular regions exist, and it proves ineffective for detecting deep-layer anomalies within grain piles.
In summary, deep-layer moisture anomaly detection in grain piles faces multiple challenges, including artifacts, slow computation speeds, limited detection depth, and susceptibility to external interference. Beyond the aforementioned methods, digital beamforming offers an alternative approach to electromagnetic imaging. As a readily implementable and rapid imaging technique, digital beamforming has been successfully applied in radar systems, sonar systems, seismological research, and medical imaging [18,19,20]. This paper presented a novel application of digital beamforming technology [21] to grain moisture detection, employing the delay-multiply-and-sum (DMAS) algorithm [20,22] for rapid localization of moisture anomalies in grain piles. This approach offered distinct advantages: rapid detection speed and accurate positioning, demonstrating significant potential for grain monitoring applications.
This study employed long-grained rice as the test subject, which, after drying, exhibited a moisture content of approximately 10.5%. Generally, moisture levels exceeding 5% above that of dried grain were considered abnormal and unsuitable for long-term storage. Therefore, the primary objective of this research was to locate regions with moisture content greater than 15% within a cubic experimental bin containing long-grained rice dried to 10.5% moisture content. This localization aimed to facilitate subsequent treatment and prevent grain deterioration. The remainder of this paper was organized as follows: Section 2 presents the detection system based on electromagnetic wave DMAS beamforming techniques, the fundamental principles of DMAS, and the algorithm for localizing abnormal moisture regions within grain piles. Section 3 shows the impact of electromagnetic transmitter and receiver layouts on the detection area’s resolution capability and determination of the detectable region. Section 4 discusses the method for assessing the reliability of localization results and localization tests for areas with 15.4% abnormal moisture content within the grain pile. Section 5 provides a conclusion and insights into potential future research directions.

2. Materials and Methods

2.1. Experimental Setup of a Detection System for Anomalous Moisture Region in Grain Piles

Multiple grain samples with moisture content exceeding 15.0% were prepared for this experiment. These anomalous samples were placed in acrylic cubic containers of 7 cm × 7 cm × 7 cm volume. Dry grain was placed in a 0.4 m × 0.4 m × 0.4 m cubic experimental bin, with the moisture-anomalous samples positioned at arbitrary locations within the bin. Patch antennas were uniformly distributed on all four side walls, with the most effective arrangement of this paper shown in Figure 1 (the impact of different transmitter and receiver layouts on detection area resolution is discussed in Section 3.1). These antennas serve as both electromagnetic wave transmitters and receivers. For precise localization, antennas on two side walls were designated as transmitters, while those on the remaining walls functioned as receivers. This study employed ultra-wideband electromagnetic waves with a frequency range of 2–3 GHz. The measurement speed was approximately 2 min. Although computational speed decreased as sampling data increased, improvements in both sampling and calculation speeds could be achieved through hardware optimization.
The data acquisition and processing unit comprised the following components and functionalities: radio frequency (RF) switches were employed to selectively connect electromagnetic wave transmission channels; a micro-controller served as the control circuit, working in conjunction with a host computer to coordinate the channel switching of the RF switches; a vector network analyzer (VNA) (LiteVNA, v1.3), operating through the RF switches, was utilized to collect electromagnetic field data; a master control computer managed the vector network analyzer to acquire data for subsequent processing. This system operated by controlling the emission and reception of electromagnetic waves, collecting electromagnetic field data that contained information about moisture anomalies. The computer then processed and analyzed this data.

2.2. Principle of DMAS-Based Localization Method for Anomalous Moisture Region in Grain Piles

This paper employed a digital beamforming technique based on the DMAS algorithm to localize regions of anomalous moisture content within the grain pile. Data acquisition was performed using an extended multi-static approach: N transmitting antennas in the antenna array emitted signals in succession, while the scattered signals were received by all M receiving antennas. Upon completion of the transmission cycle by all elements, a total of N × M scattered signals were recorded. Additionally, for layouts with cross-shaped structures, the number of scattered signals was 2 × M / 2 × N / 2 .
To enhance detection accuracy, this experiment necessitated the reduction of environmental interferences, as the amplitude significantly exceeded that of the response from anomalous regions. These environmental interferences primarily originate from internal metallic structures, foreign matter in the grain, such as insects and pebbles, and biological entities in the surrounding test environment. The presence of these extraneous elements affects the collected scattered field signals.
Consequently, we proposed a calibration method for the scattered field data, y s c t . The scattered field data collected under conditions of completely dry grain was utilized as background data y i n c . Thus, the calibrated scattered field data could be expressed as y s c t = y i n c y e n v . This calibration method was readily implementable, as the condition of completely dry grain could be conveniently achieved and maintained for reference measurements. For measurements involving diverse grain varieties and varying test environments, recalibration using a consistent methodology is imperative. This process includes the separate acquisition of background and scattered field data for each scenario.
The algorithm principle is as follows: First, calculate the round-trip path length from each transmitting antenna to a focal point in the grain and then to the receiving antenna, converting this to a time delay. The calculation considers all media traversed during the round trip, computing signal propagation velocity in each medium by assuming the relative dielectric constant at the excitation pulse’s center frequency. Time shifts are applied to the processed scattered signals based on the calculated time delays, followed by paired multiplication and summation, with the output as y * ( t ) . Finally, the focal point response r i is obtained by integrating over a time window W [22]:
r i = 0 W y * t d t .
The time window is W = a Δ t , where a represents the number of time steps in the finite difference time domain (FDTD) method. The paired multiplication refers to the calculation of spatial cross-correlation between all received signals. Specifically, this is achieved by computing the signed geometric mean values between two adjacent signals, which is equivalent to a new signal. Subsequently, all equivalent signals are summed, resulting in the following expression [22]:
y * t = i = 1 N s 1 j = i + 1 N s s i g n y i s c t t y j s c t t × y i s c t t y j s c t t ,
where, N s represents the number of the recorded scattered signals.

2.3. Anomalous Moisture Region Localization Algorithm

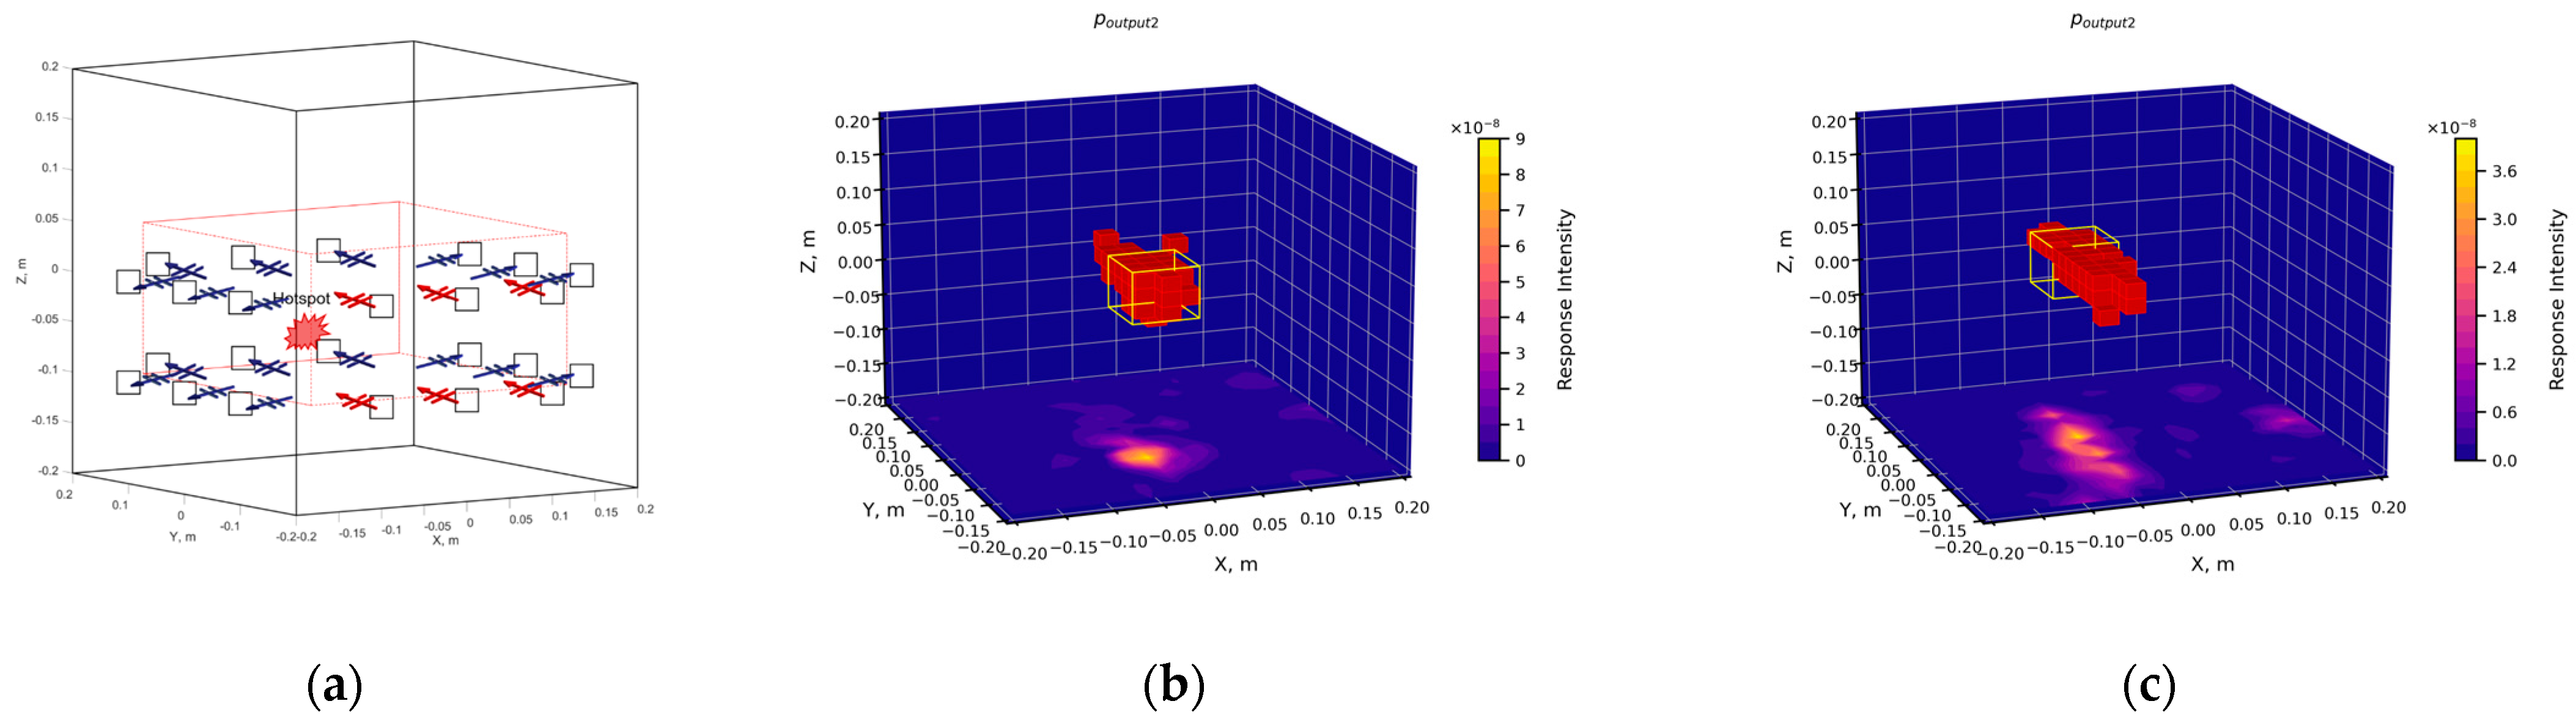
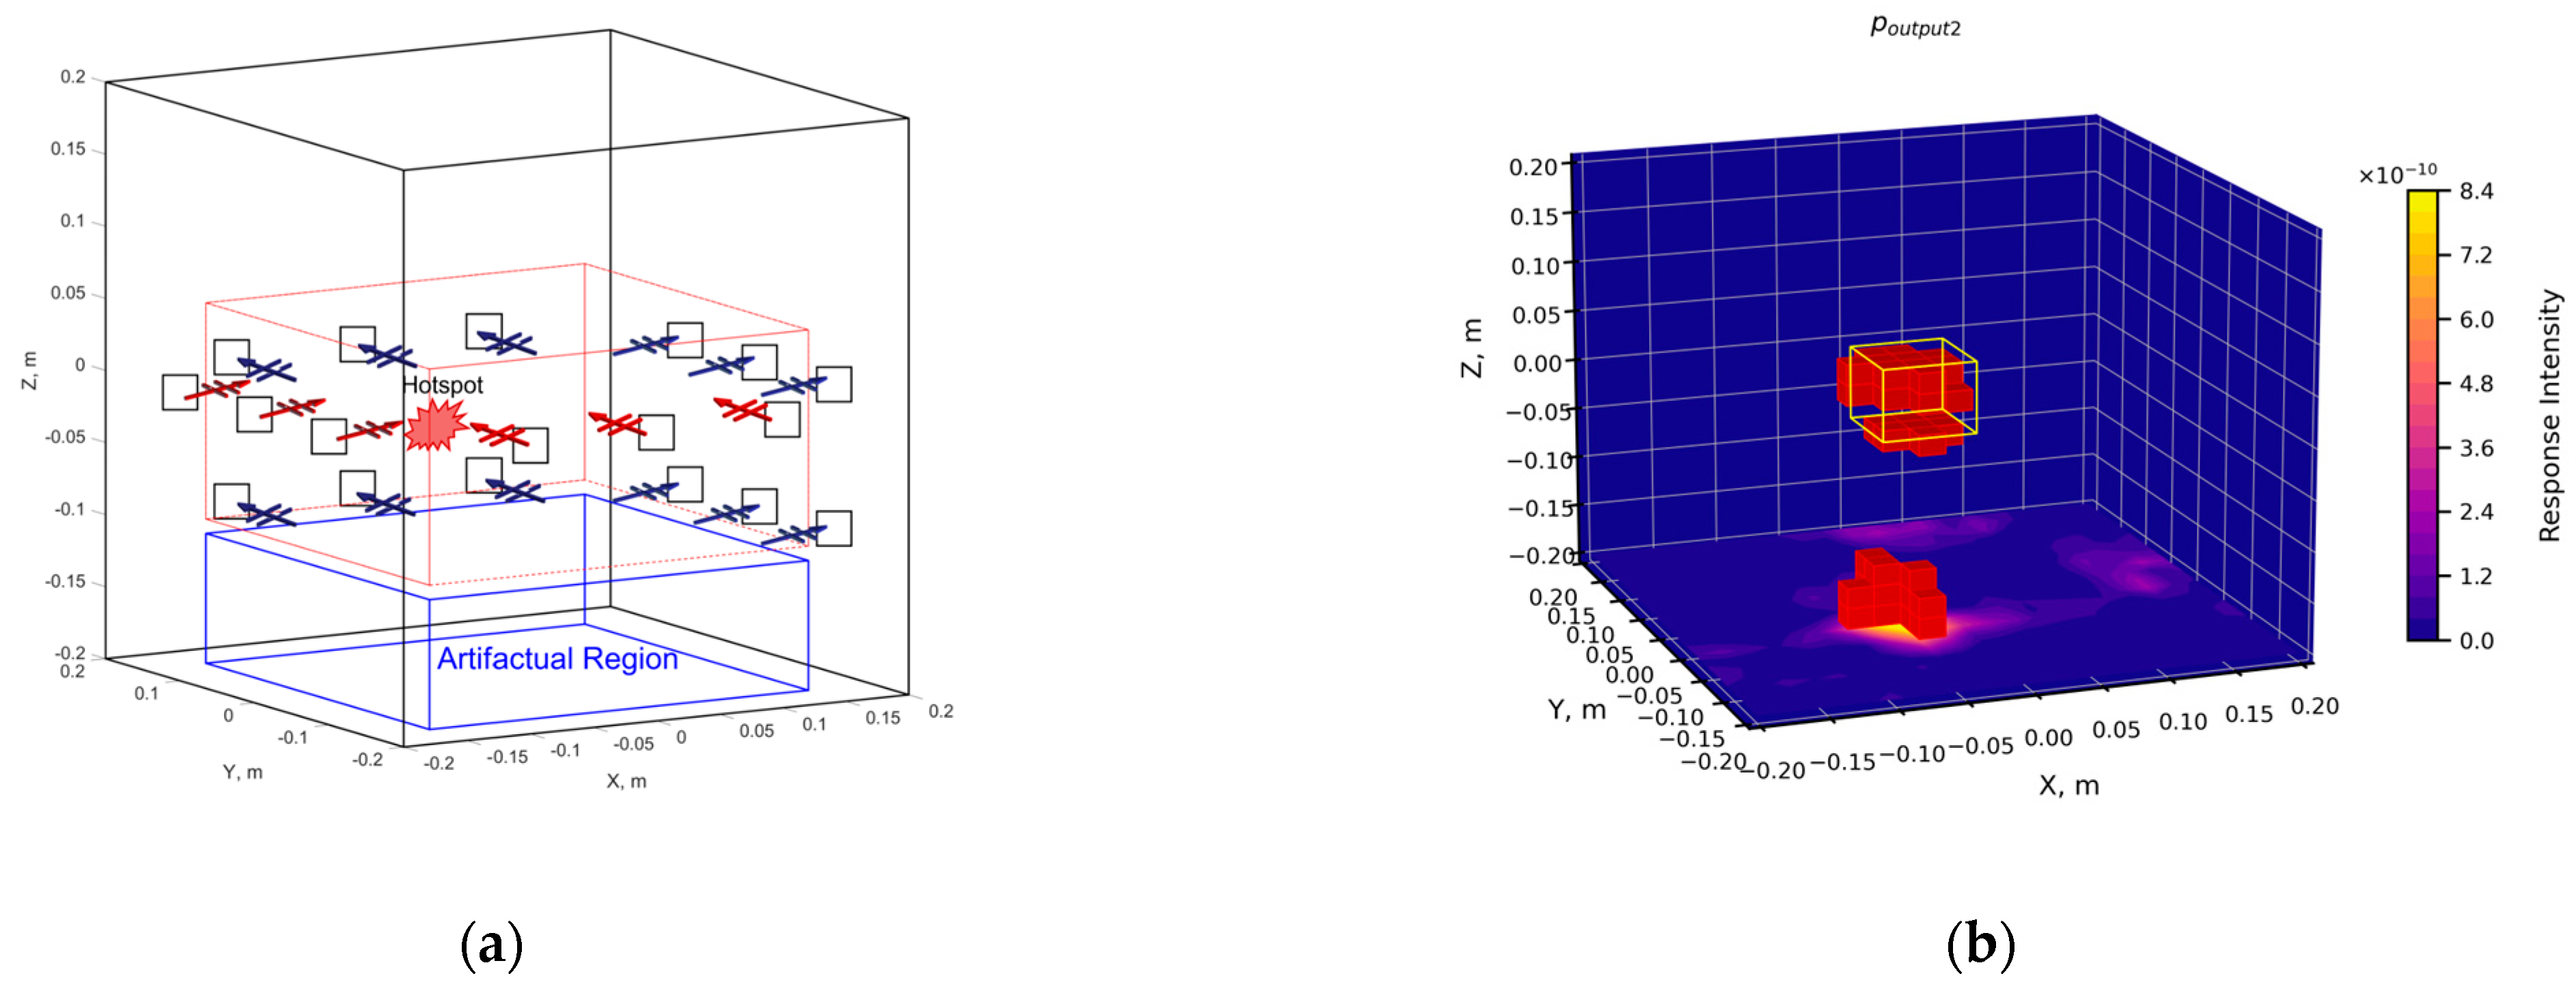
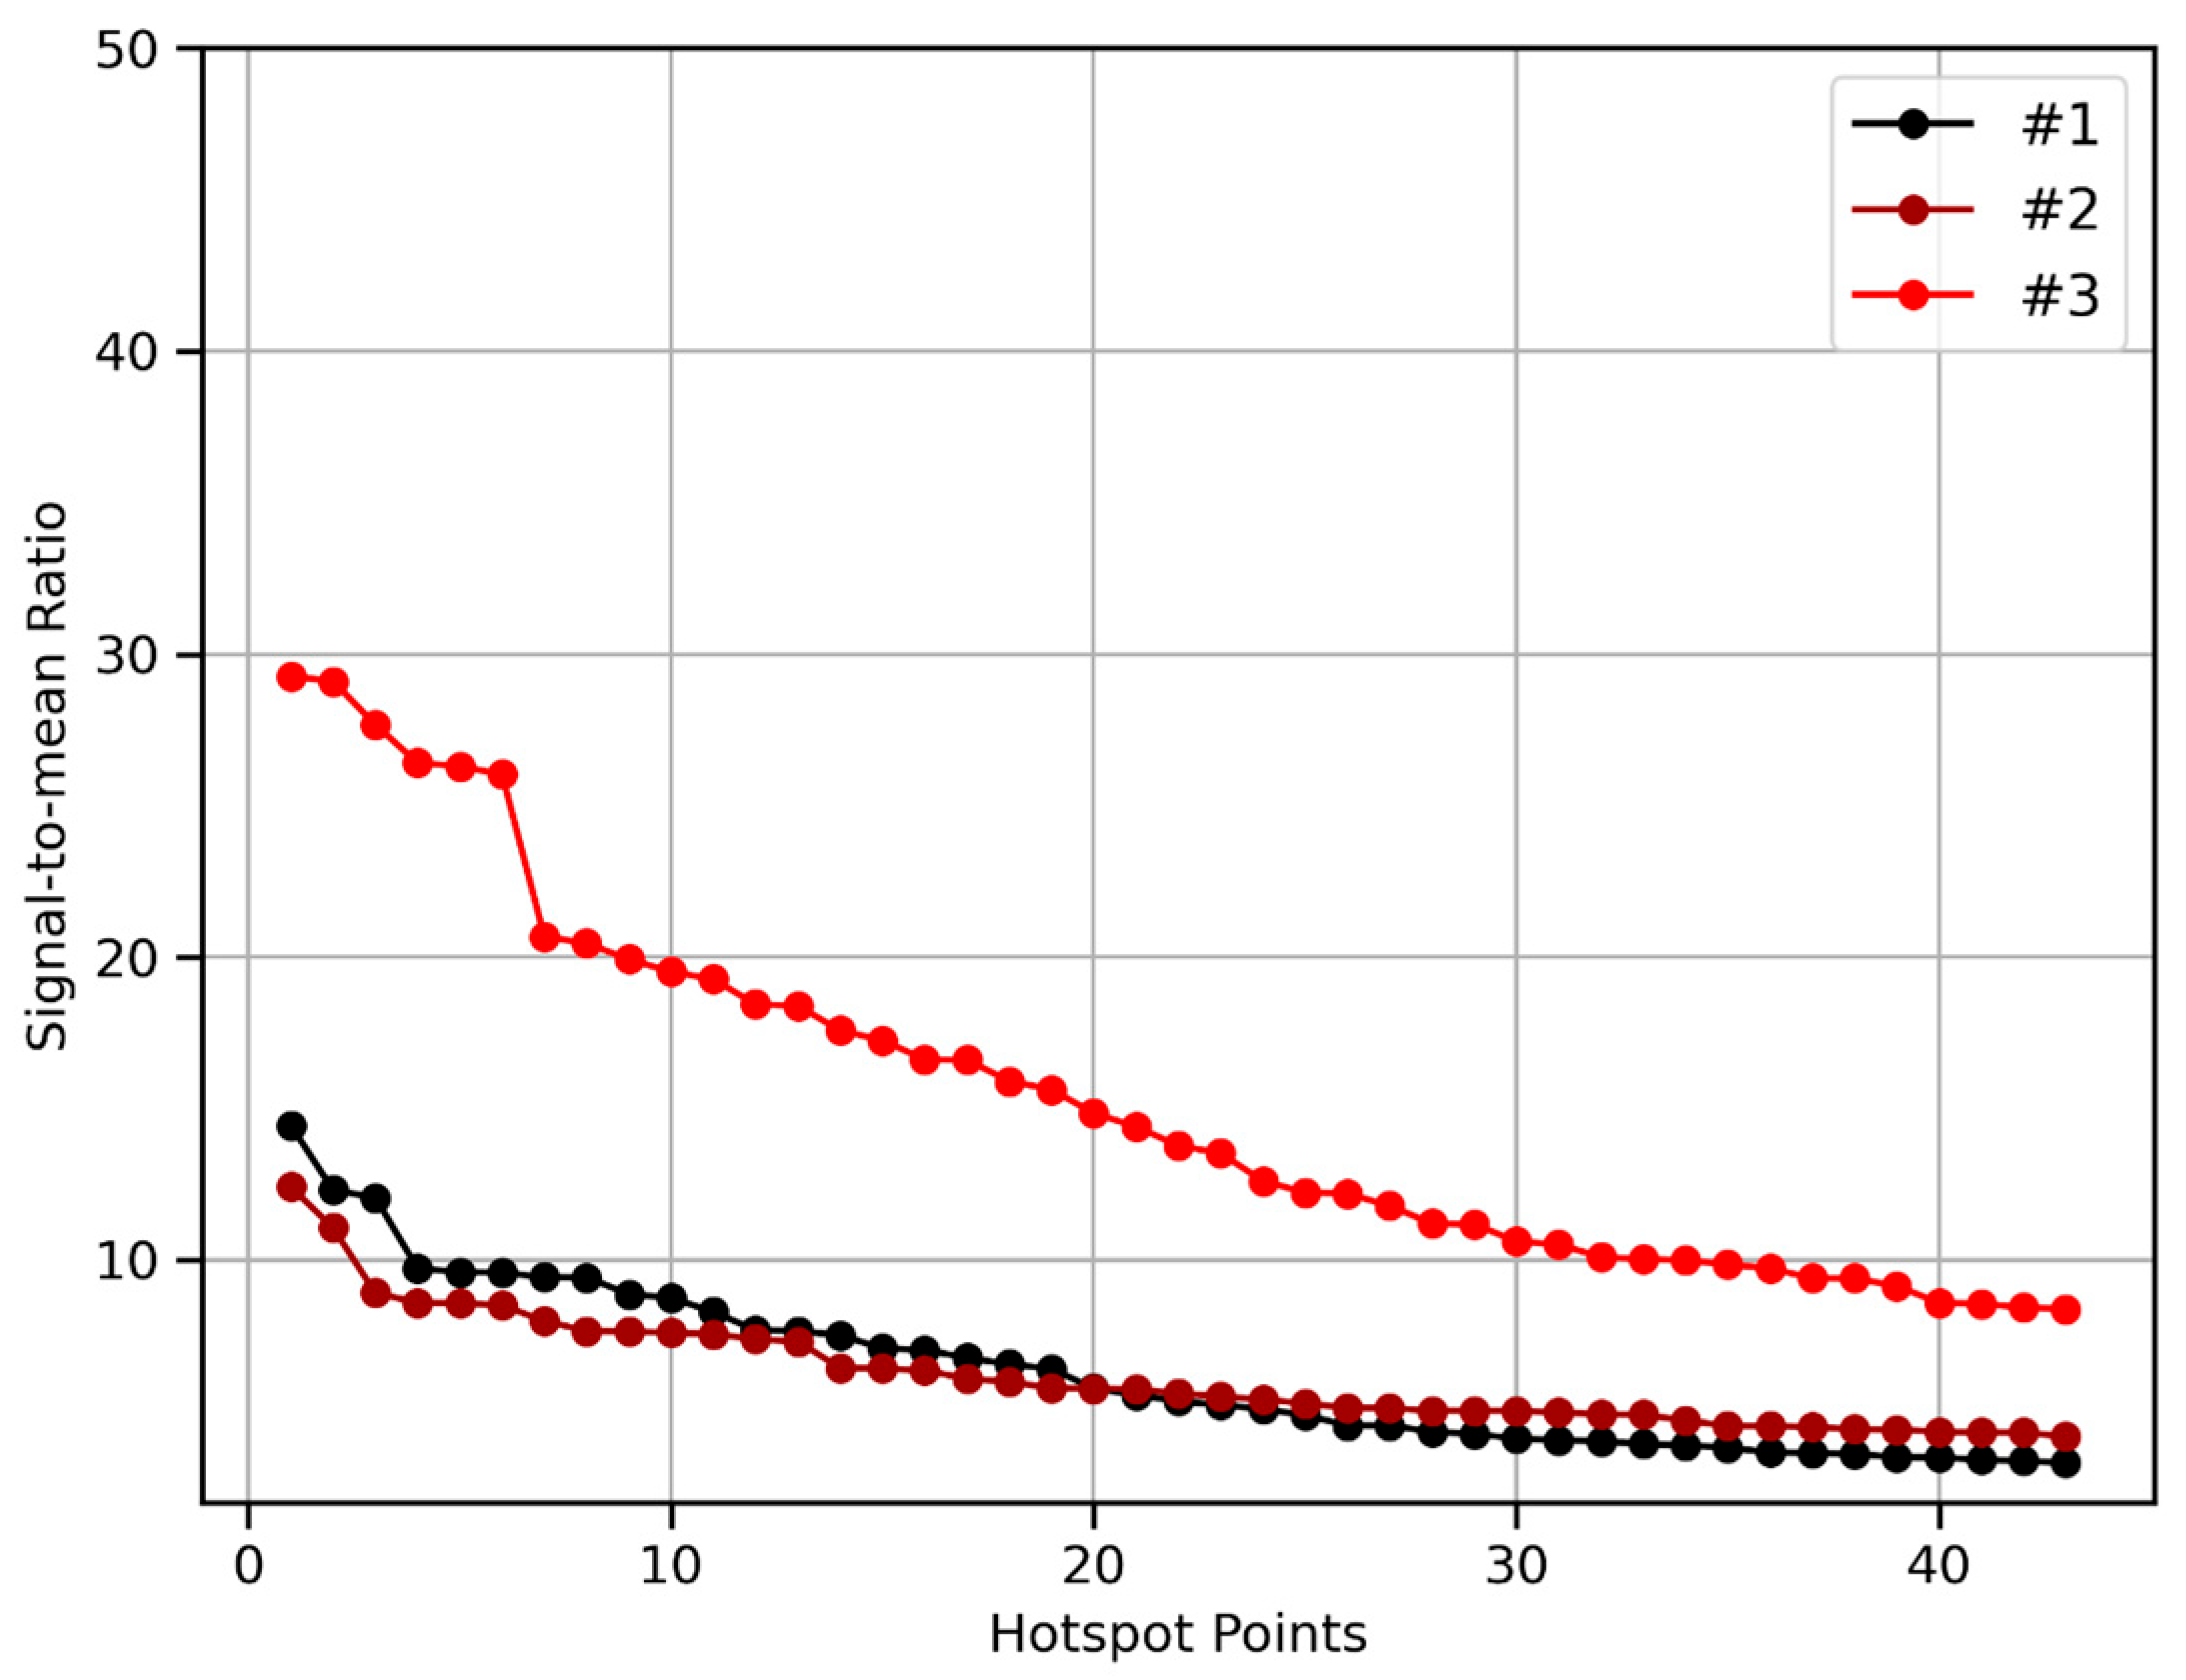
The grain pile anomalous moisture region localization algorithm developed in this paper was designed to locate the anomalous moisture region. It was important to note that the full width at half maximum (FWHM) method, commonly used in tumor detection, could not be directly applied to identify the region with the maximum value as the anomalous moisture area in grain piles. This was because the response from normal regions (10.5% moisture content grain) and anomalous regions (>15% moisture content grain) did not differ significantly, especially for grain with 15% moisture content. The signal-to-mean ratio (SMR) (Equation (A1)) for such cases only differed by approximately 10 (refer to Section 4.1 and Section 4.2). In this experiment, smaller maximum values were particularly susceptible to misidentification due to interference. Additionally, there was no definitive solution for determining what percentage of the maximum value should be classified as an anomalous region in grain-related applications. Finally, when using the recall method (Equation (3)) to evaluate localization accuracy, it was necessary to provide the actual target object size. Therefore, the size of the anomalous region to be detected was predetermined. The specific process is illustrated in Figure 2. For the detailed algorithm, refer to Appendix A.
Anomalous regions typically correspond to higher SMR values. To identify these areas, this study employed a two-stage localization process: preliminary and secondary localization.
The objective of preliminary localization is to identify all anomalous regions by detecting areas with rapid SMR decline. It is noteworthy that extensive experimental testing has revealed these regions may include both anomalous and normal areas (refer to Section 4.1), particularly when grain moisture anomalies are low.
However, distinguishing between normal and anomalous regions is challenging. Due to the emergence of sporadic interference with strong responses from normal regions, the secondary localization process is implemented to identify the area most likely to be a hotspot. In cases of multiple moisture anomalies, it is recommended to remove the initially localized anomalous area and conduct subsequent measures to locate the next anomalous region.
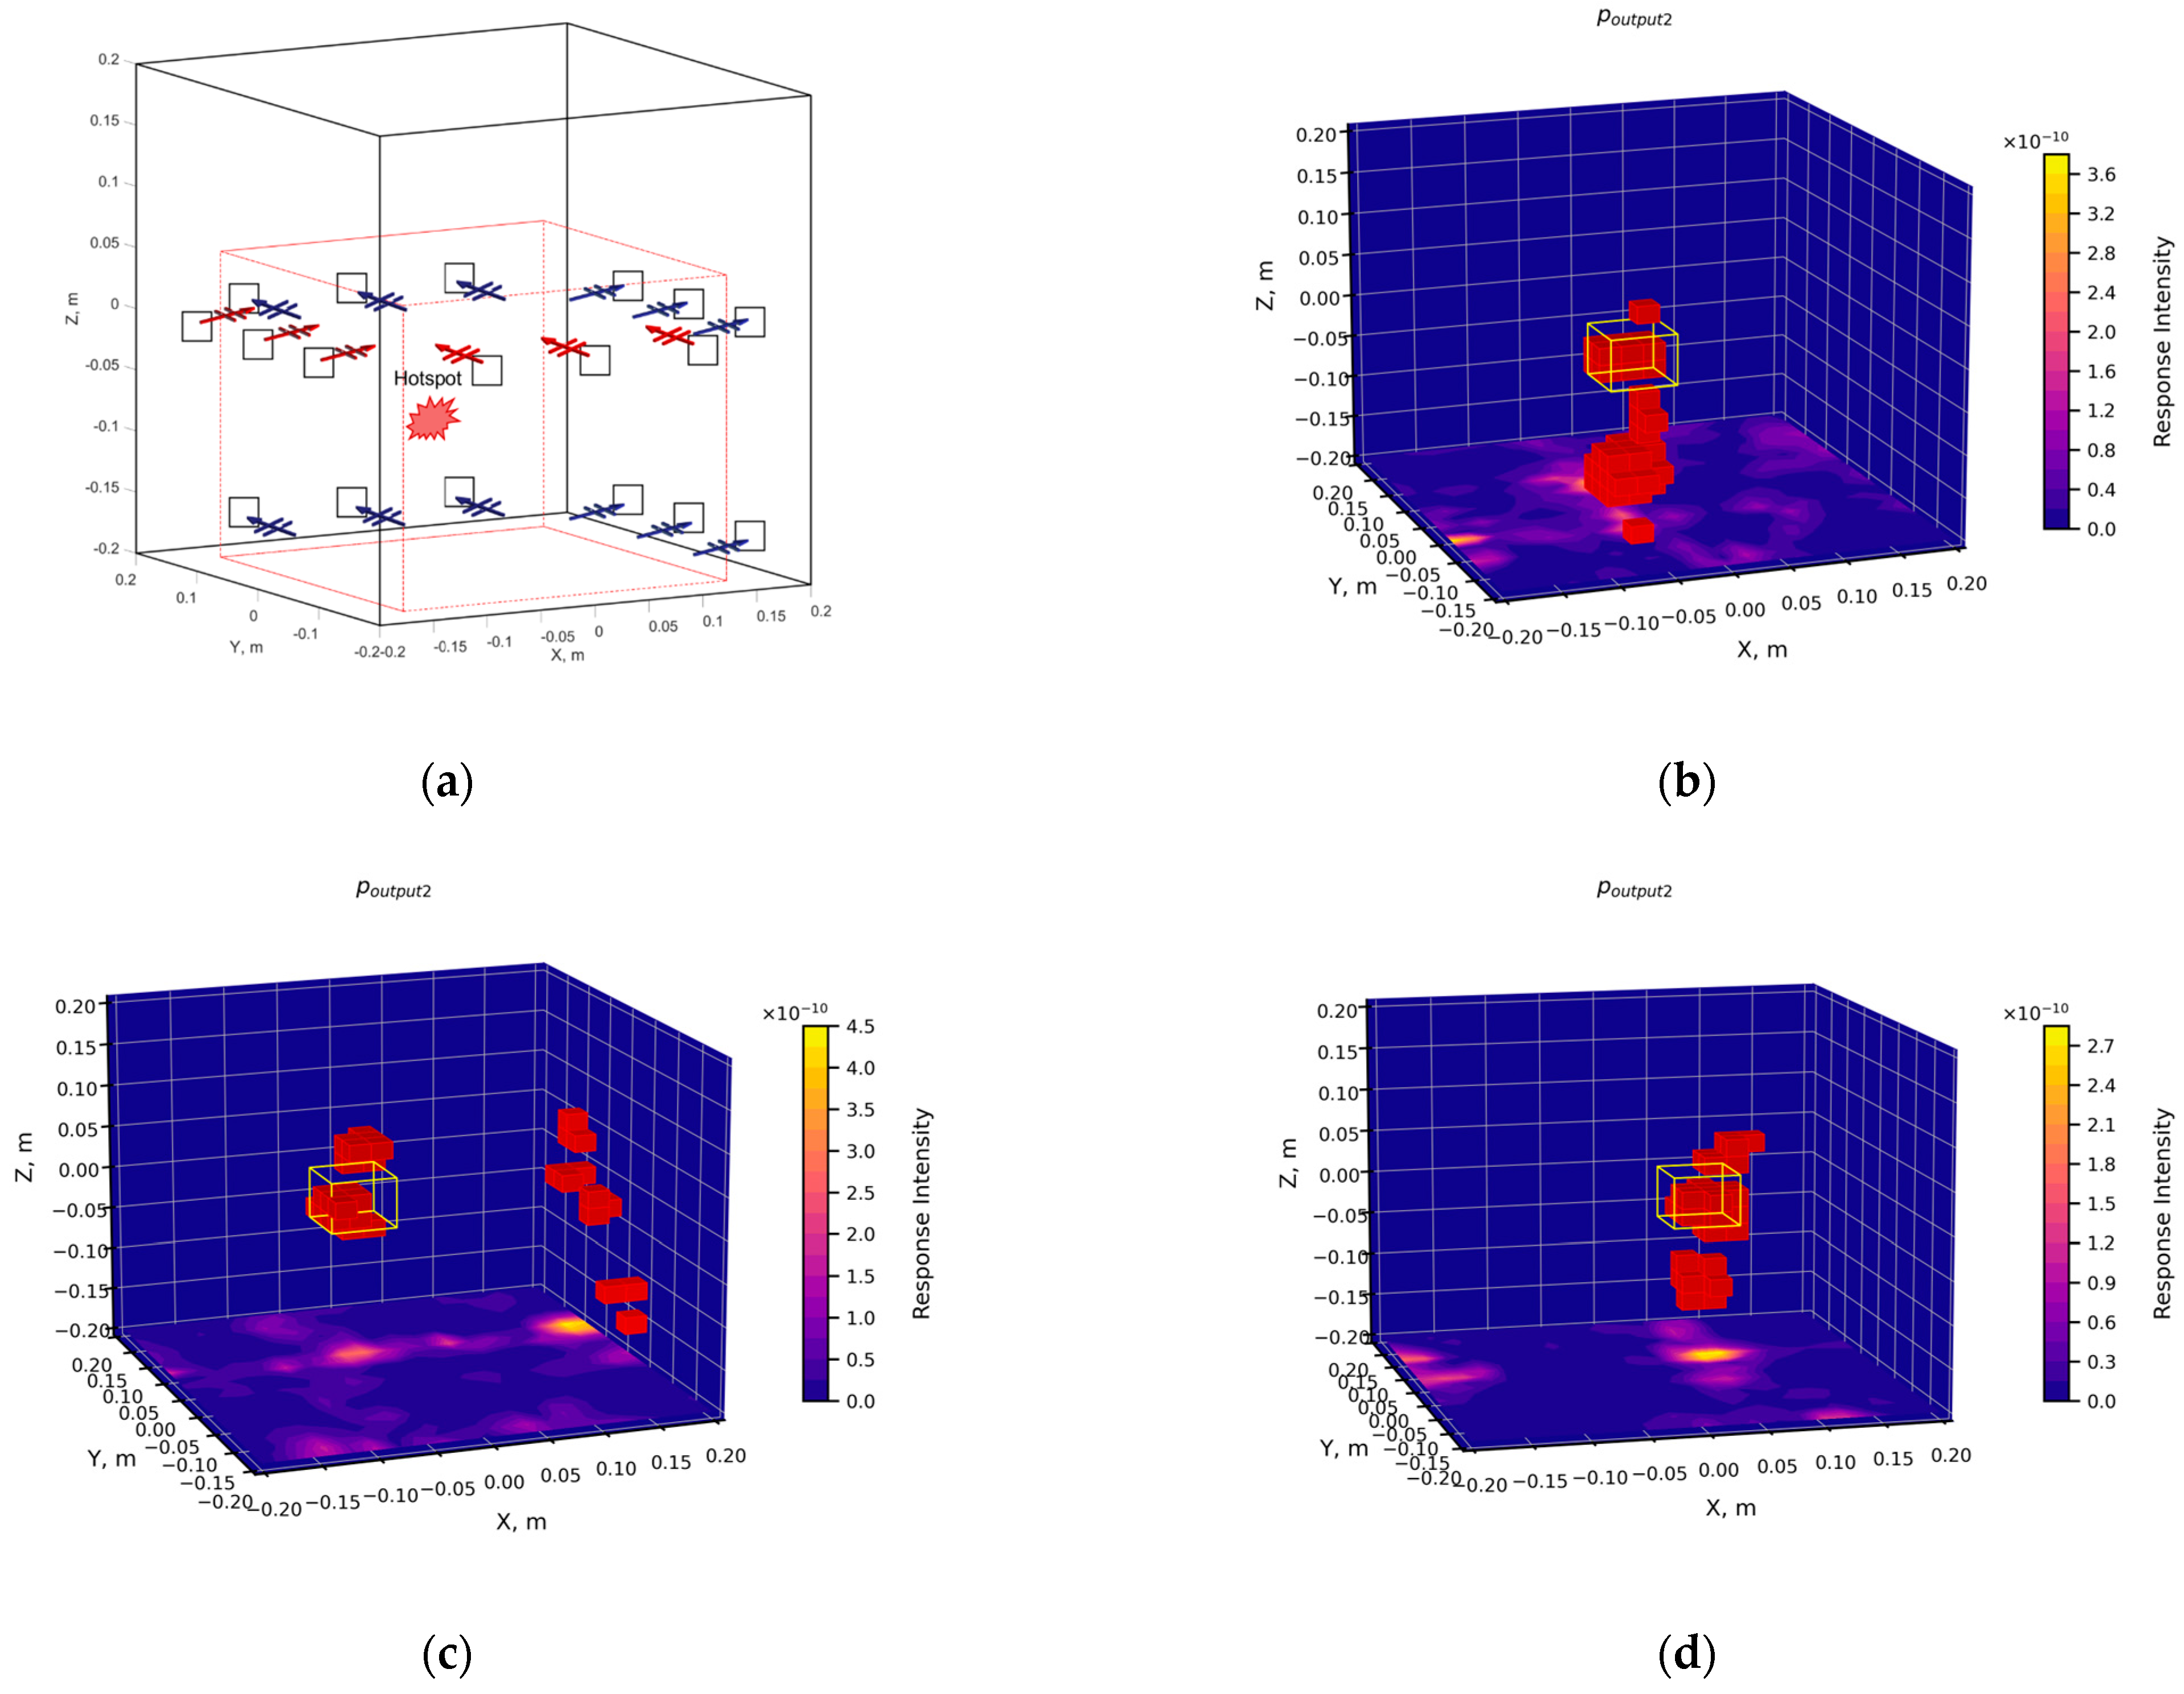
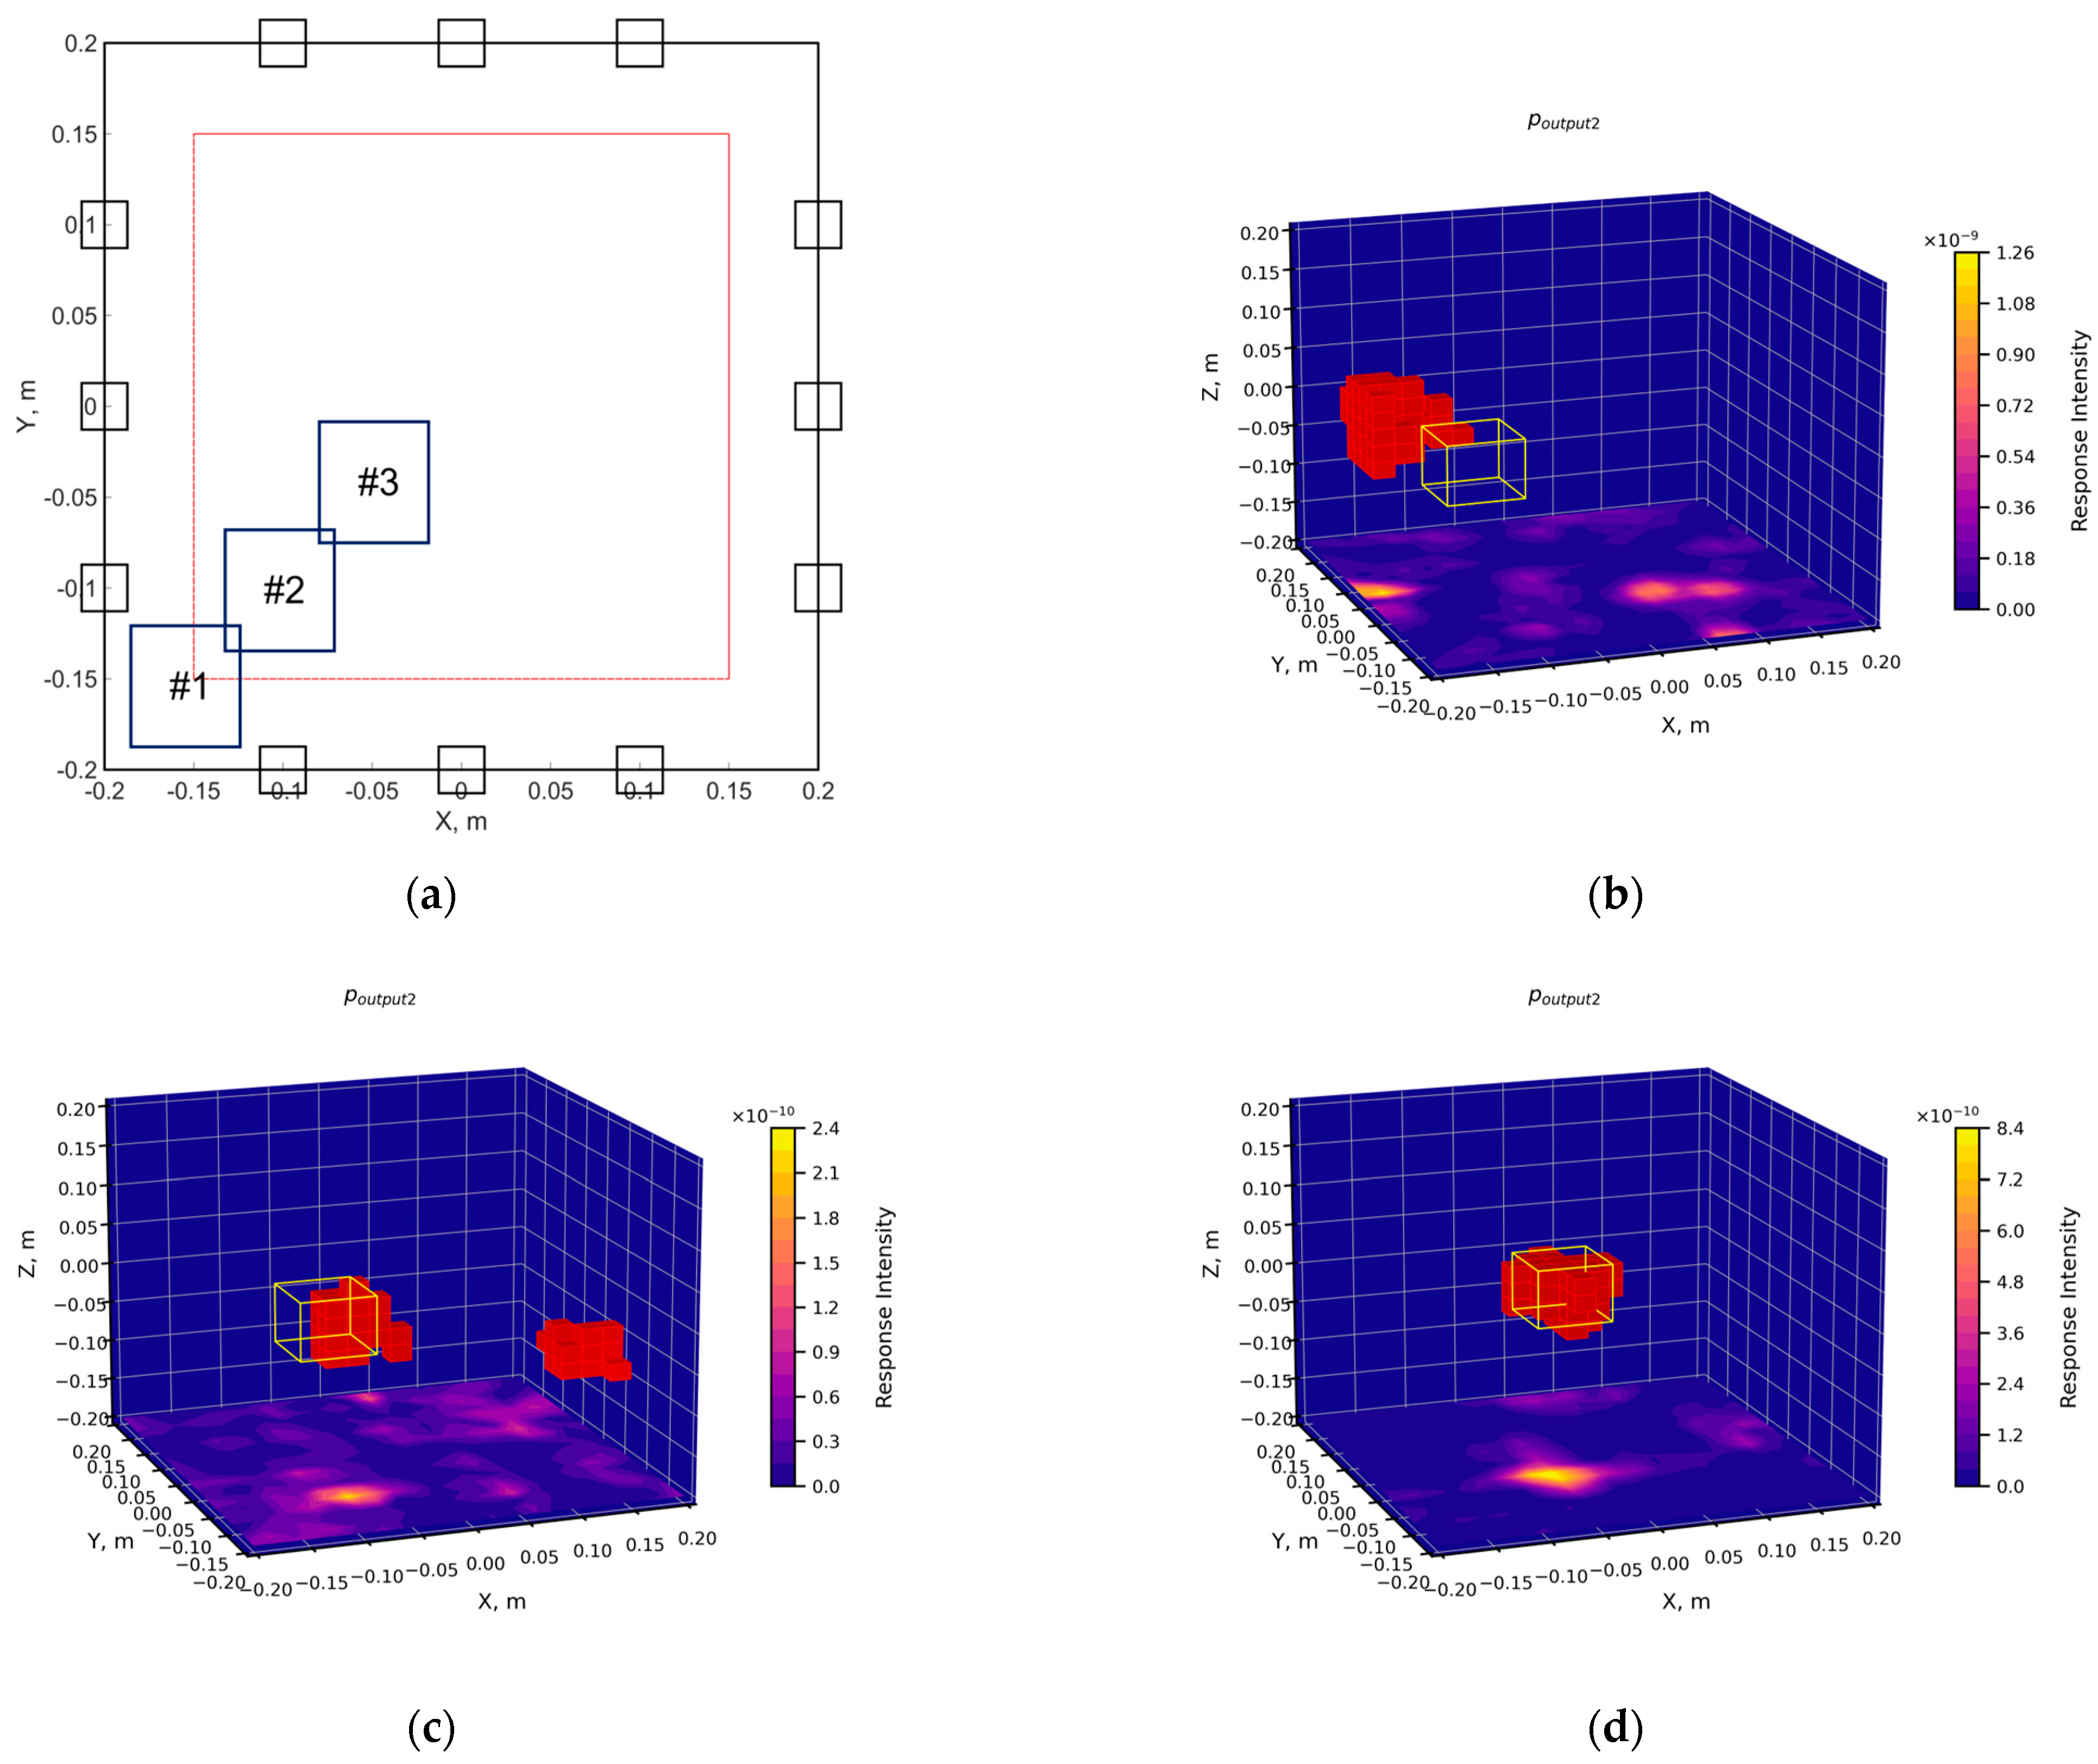
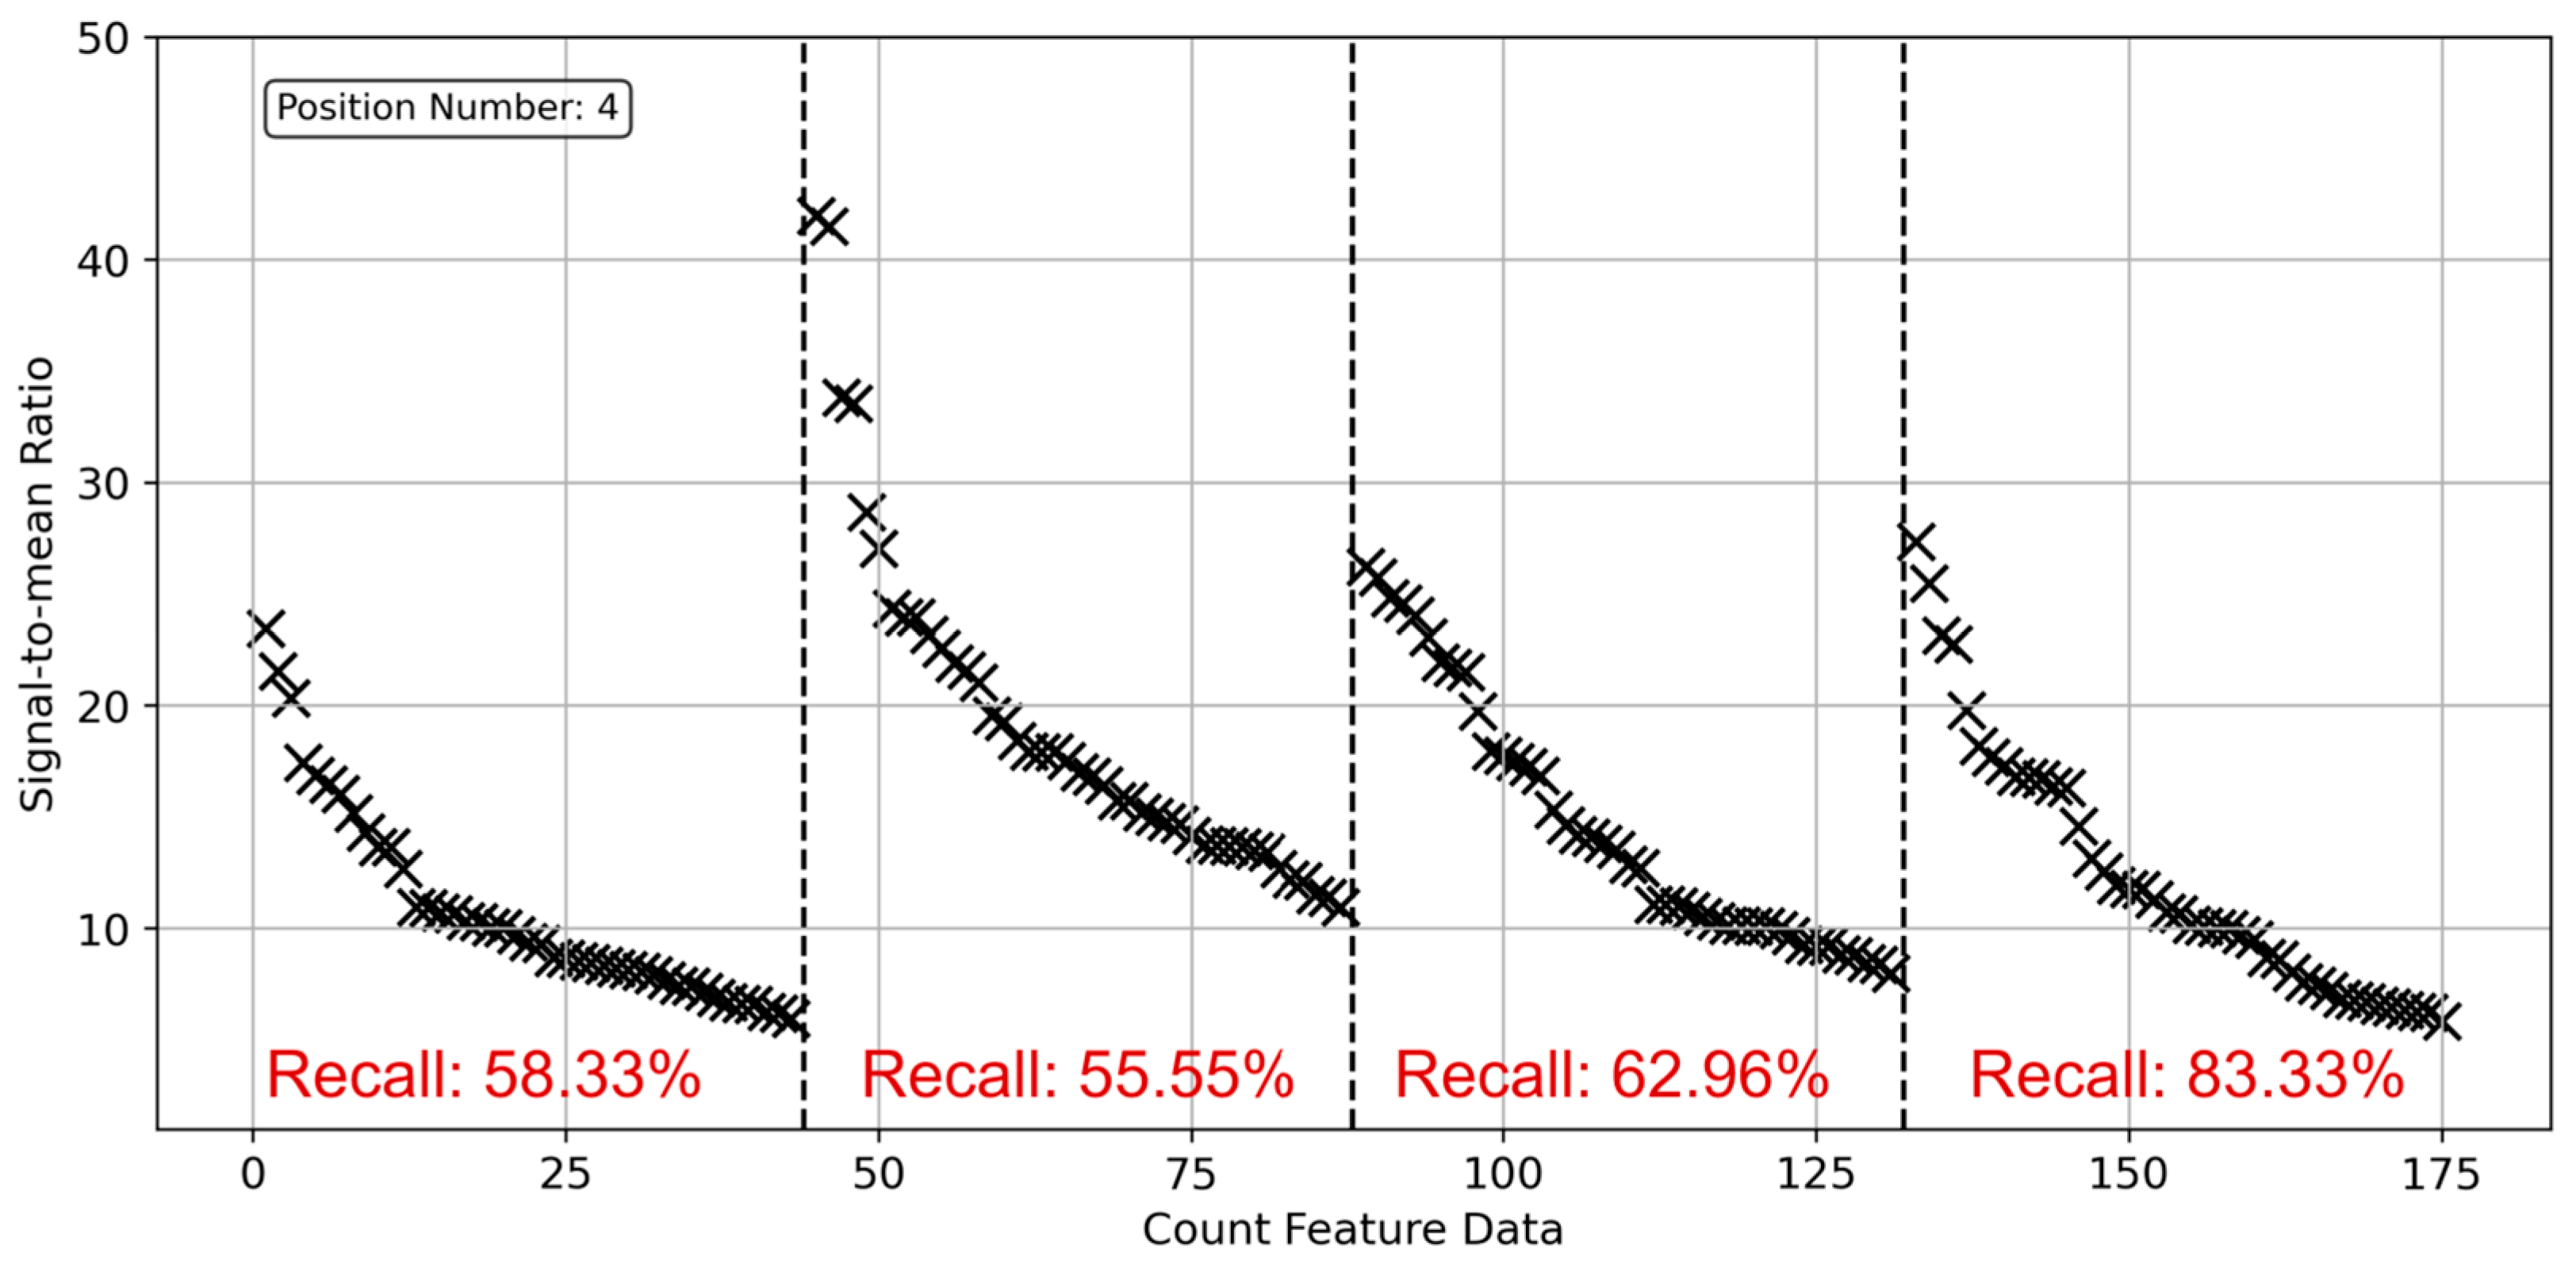
To counteract strong interference, in addition to calculating the region containing the maximum value within these connected domains ( D m a x ), a method for determining the region with the maximum volume ( D v o l ) was introduced. When moisture differences are substantial, resulting in strong responses, D m a x and D v o l yield consistent results. However, when responses are weak, the minimal difference between the maximum value and other values increases the likelihood of D m a x misclassification. During experimentation, discrepancies between D m a x and D v o l frequently arose when the SMR of the anomalous region was approximately 10.
To evaluate the accuracy of the localization of anomalous moisture regions in grain piles, this paper proposed the use of the recall method, commonly employed in the field of image segmentation [23,24]. Let A represent the actual region and B represent the predicted region. The recall is defined as
r e c a l l = A B A .
Recall can only assess the accuracy of localization for known samples, whereas accuracy cannot be calculated for unknown samples. A validation process for unknown samples was deemed necessary because preliminary localization always produced results, regardless of whether the actual moisture anomaly in the grain pile was successfully located. This paper proposed a method for assessing the reliability of localization results for unknown samples. If D m a x = D v o l , it typically indicates that the SMR value of the anomalous region is relatively high, and the calculated recall value is also high, suggesting high reliability of the localization results. Occasionally, instances of D m a x = D v o l with incorrect localization might occur, manifesting as lower SMR values. Therefore, incorporating SMR value analysis could enhance the reliability of localization results. Conversely, if D m a x D v o l , the recall value tends to be relatively low, indicating a decrease in the reliability of the results, as explained in Section 4.1.

3. Results

3.1. Limited Resolution Capability of Detection Area Affected by Electromagnetic Transmitter and Receiver Layout

To suppress clutter and enhance anomalous region responses, this paper employed a method similar to multi-static approaches, increasing the quantity of sampling data. This technique aimed to achieve reliable detection in reconstructed images through additional clutter suppression and anomaly enhancement. The experiment explored how to obtain reliable detection results using fewer sampling data. For cubic experimental bins, detectors needed the capability to resolve moisture anomalies along the x, y, and z axes.
This paper evaluated several electromagnetic transmitter and receiver layout methods. A 7 cm × 7 cm × 7 cm acrylic cubic container filled with grain samples of varying moisture content was used. The localization results of moisture anomalies in the grain pile were as follows:

3.1.1. Comparison of “Single-Layer” and “Double-Layer” Layouts

Figure 3a,b clearly demonstrate that the “single-layer” layout was unable to obtain height information. With only 18 sets of sampling data, accurate localization was not possible, resulting in erroneous localization areas. However, the detector exhibited a preliminary capability to distinguish anomalous regions. By increasing sampling data along the z-axis, as shown in Figure 3c,d, the “double-layer” layout achieved a degree of z-axis resolution. This increase in sample size enhanced prediction capability, potentially eliminating prediction errors.
Comparing the SMR between single and double layers, as illustrated in Figure 4, revealed that increasing the sample size enhanced the response to anomalous regions. When the SMR fell below 10, prediction capability decreased, and external interference increased. Therefore, in this experiment, to improve prediction accuracy, efforts were made to ensure the SMR of anomalous regions reached or exceeded 10.

3.1.2. “Fan-Shaped” Layout

The “fan-shaped” layout was an intuitive arrangement initially considered. The ultimate goal was to develop a detector capable of resolving moisture anomalies in grain piles along the x, y, and z axes. However, as evident from Figure 5, the “fan-shaped” layout clearly lacked resolution capability along the y-axis. Although the regions near the transmitter, where electromagnetic field channels were dense, allowed for more accurate localization, the y-axis resolution deteriorated significantly at greater distances from the transmitter. This resulted in elongated voxel representations of the anomalous regions in the localization results. Given these limitations, it became necessary to improve the transmitter layout to achieve the desired resolution capabilities across all three axes.

3.1.3. “Cross-Shaped” Layout

In Figure 6, each face utilized three transmitters or six receivers. This configuration aimed to reduce costs and accelerate computation speed by minimizing the number of transmitters and receivers. Additionally, the double-layer arrangement of receivers was implemented to achieve z-axis resolution capability.
The experimental results aligned with expectations: the three-row transmitter or receiver arrangement along the x-axis provided resolution capability only in the x-direction. Similarly, the three-row arrangement along the y-axis yielded resolution capability only in the y-direction. When these two layout methods were combined, as shown in Figure 6e, the two elongated prediction areas overlapped at the hotspot. This combination resulted in resolution capability in both x and y directions.

3.2. Artifactual Regions

In Figure 7, the vertical spacing between the upper and lower layers of receivers was 10 cm. At this distance, the signals received by the two layers were approximately similar, which led to the emergence of artifacts. Based on the analysis in the previous section, this study concluded that to achieve z-axis resolution capability, at least three rows of transmitters or receivers should be arranged along the z-axis, similar to the arrangement in the x and y directions. Consequently, the measurable area for the layout method shown in Figure 6e was limited to the region within the red box.
To enhance the signal difference between the two receiver layers, this experiment increased the vertical distance between them. The test results, as shown in Figure 8, revealed that while symmetrical artifacts were not observed, the z-axis resolution capability remained poor due to insufficient z-axis sampling data. This outcome aligned with the analysis from the previous section. Furthermore, the increased electromagnetic wave propagation distance enhanced the differentiation between the data received by the two antenna layers. However, the lower layer of receivers still detected the anomalous region above, resulting in a small number of anomalous points at lower positions.

3.3. Detection of Blind Spots

The SMR values and detectability of grain moisture anomalies varied depending on their location within the experimental storage. As shown in Figure 9, the detectable area (indicated by the red box) was smaller than the entire experimental storage, with areas outside the red box constituting detection blind spots. To enhance the response and improve accuracy, it was determined that increasing the number of electromagnetic field channels passing through the anomalous region would be beneficial.

4. Discussion

4.1. Reliability of Localization Results for Unknown Samples

This paper extensively demonstrated, as shown in Figure 2, that the reliability of results for unknown samples could be determined based on the SMR value and comparing the region of maximum response intensity ( D m a x ) with that of maximum connected domain volume ( D v o l ). Figure 9 presents three different types of localization results. Consequently, their SMR values were plotted for analysis to assess the reliability of each result.
As illustrated by position #3 in Figure 10, when the response from the anomalous location was significantly higher than other areas, accurate localization of the true region was achieved. However, as demonstrated by positions #1 and #2 in Figure 10, when the difference in response between the anomalous location and normal areas decreased, the prediction accuracy diminished, resulting in either low accuracy or completely erroneous predictions.
Extensive experimental results, exemplified in Figure 11, demonstrated that while the SMR values for anomalous locations were typically around 10, interference from normal regions frequently exceeded this threshold. In Figure 11a, several areas with SMR values above 10 were scattered across various regions. More critically, as shown in Figure 11b, the interference SMR values from normal regions occasionally surpassed the response from the actual anomalous area. This phenomenon rendered the D m a x localization method ineffective in identifying the true anomalous region. Instead, the actual anomalous area corresponded to the region D v o l , as illustrated in Figure 12. This observation explained why the localization accuracy recall decreased when the SMR of the anomalous region only marginally exceeded 10.
The experimental critical parameters and prediction results are summarized in Table 1. We observed that when D m a x = D v o l , higher SMR values were typically associated with improved recall. Conversely, when D m a x D v o l , recall decreased, accompanied by lower SMR values.

4.2. Localization Results of Anomalous Areas with 15.4% Target Moisture Content in Grain Piles

This section evaluated the ability of the layout depicted in Figure 6e to localize anomalous regions with a moisture content of 15.4% within grain piles. Test results from four arbitrary positions within the higher reliable region based on the Blind Spot Test result, as illustrated in Figure 13, successfully located the anomalous regions. The maximum SMR values of the responses exceeded 20, aligning with the predicted SMR range from the previous section, which suggested that the SMR of anomalous regions should be distinguishable from the interference SMR of normal regions. The localization accuracy for these positions was calculated to be above 50%, with position 4 achieving a remarkable 88.33% accuracy. Figure 14 displays the localization result for the anomalous region at position 4.
Finally, the device demonstrated the capability to localize anomalous regions in grain piles with 15.4% moisture content and dimensions of 7 cm × 7 cm × 7 cm, with the potential for localizing regions of even lower moisture content. As is evident from Figure 9 and Figure 13, SMR results varied across different positions, with enhanced response when the target was penetrated by more electromagnetic fields. Additionally, SMR was influenced by factors such as the volume of the anomalous region and variations in moisture content. Consequently, evaluating detection capability requires extensive experimentation. Moreover, the choice of transmitters and receivers significantly impacts measurement detection capacity.

5. Conclusions

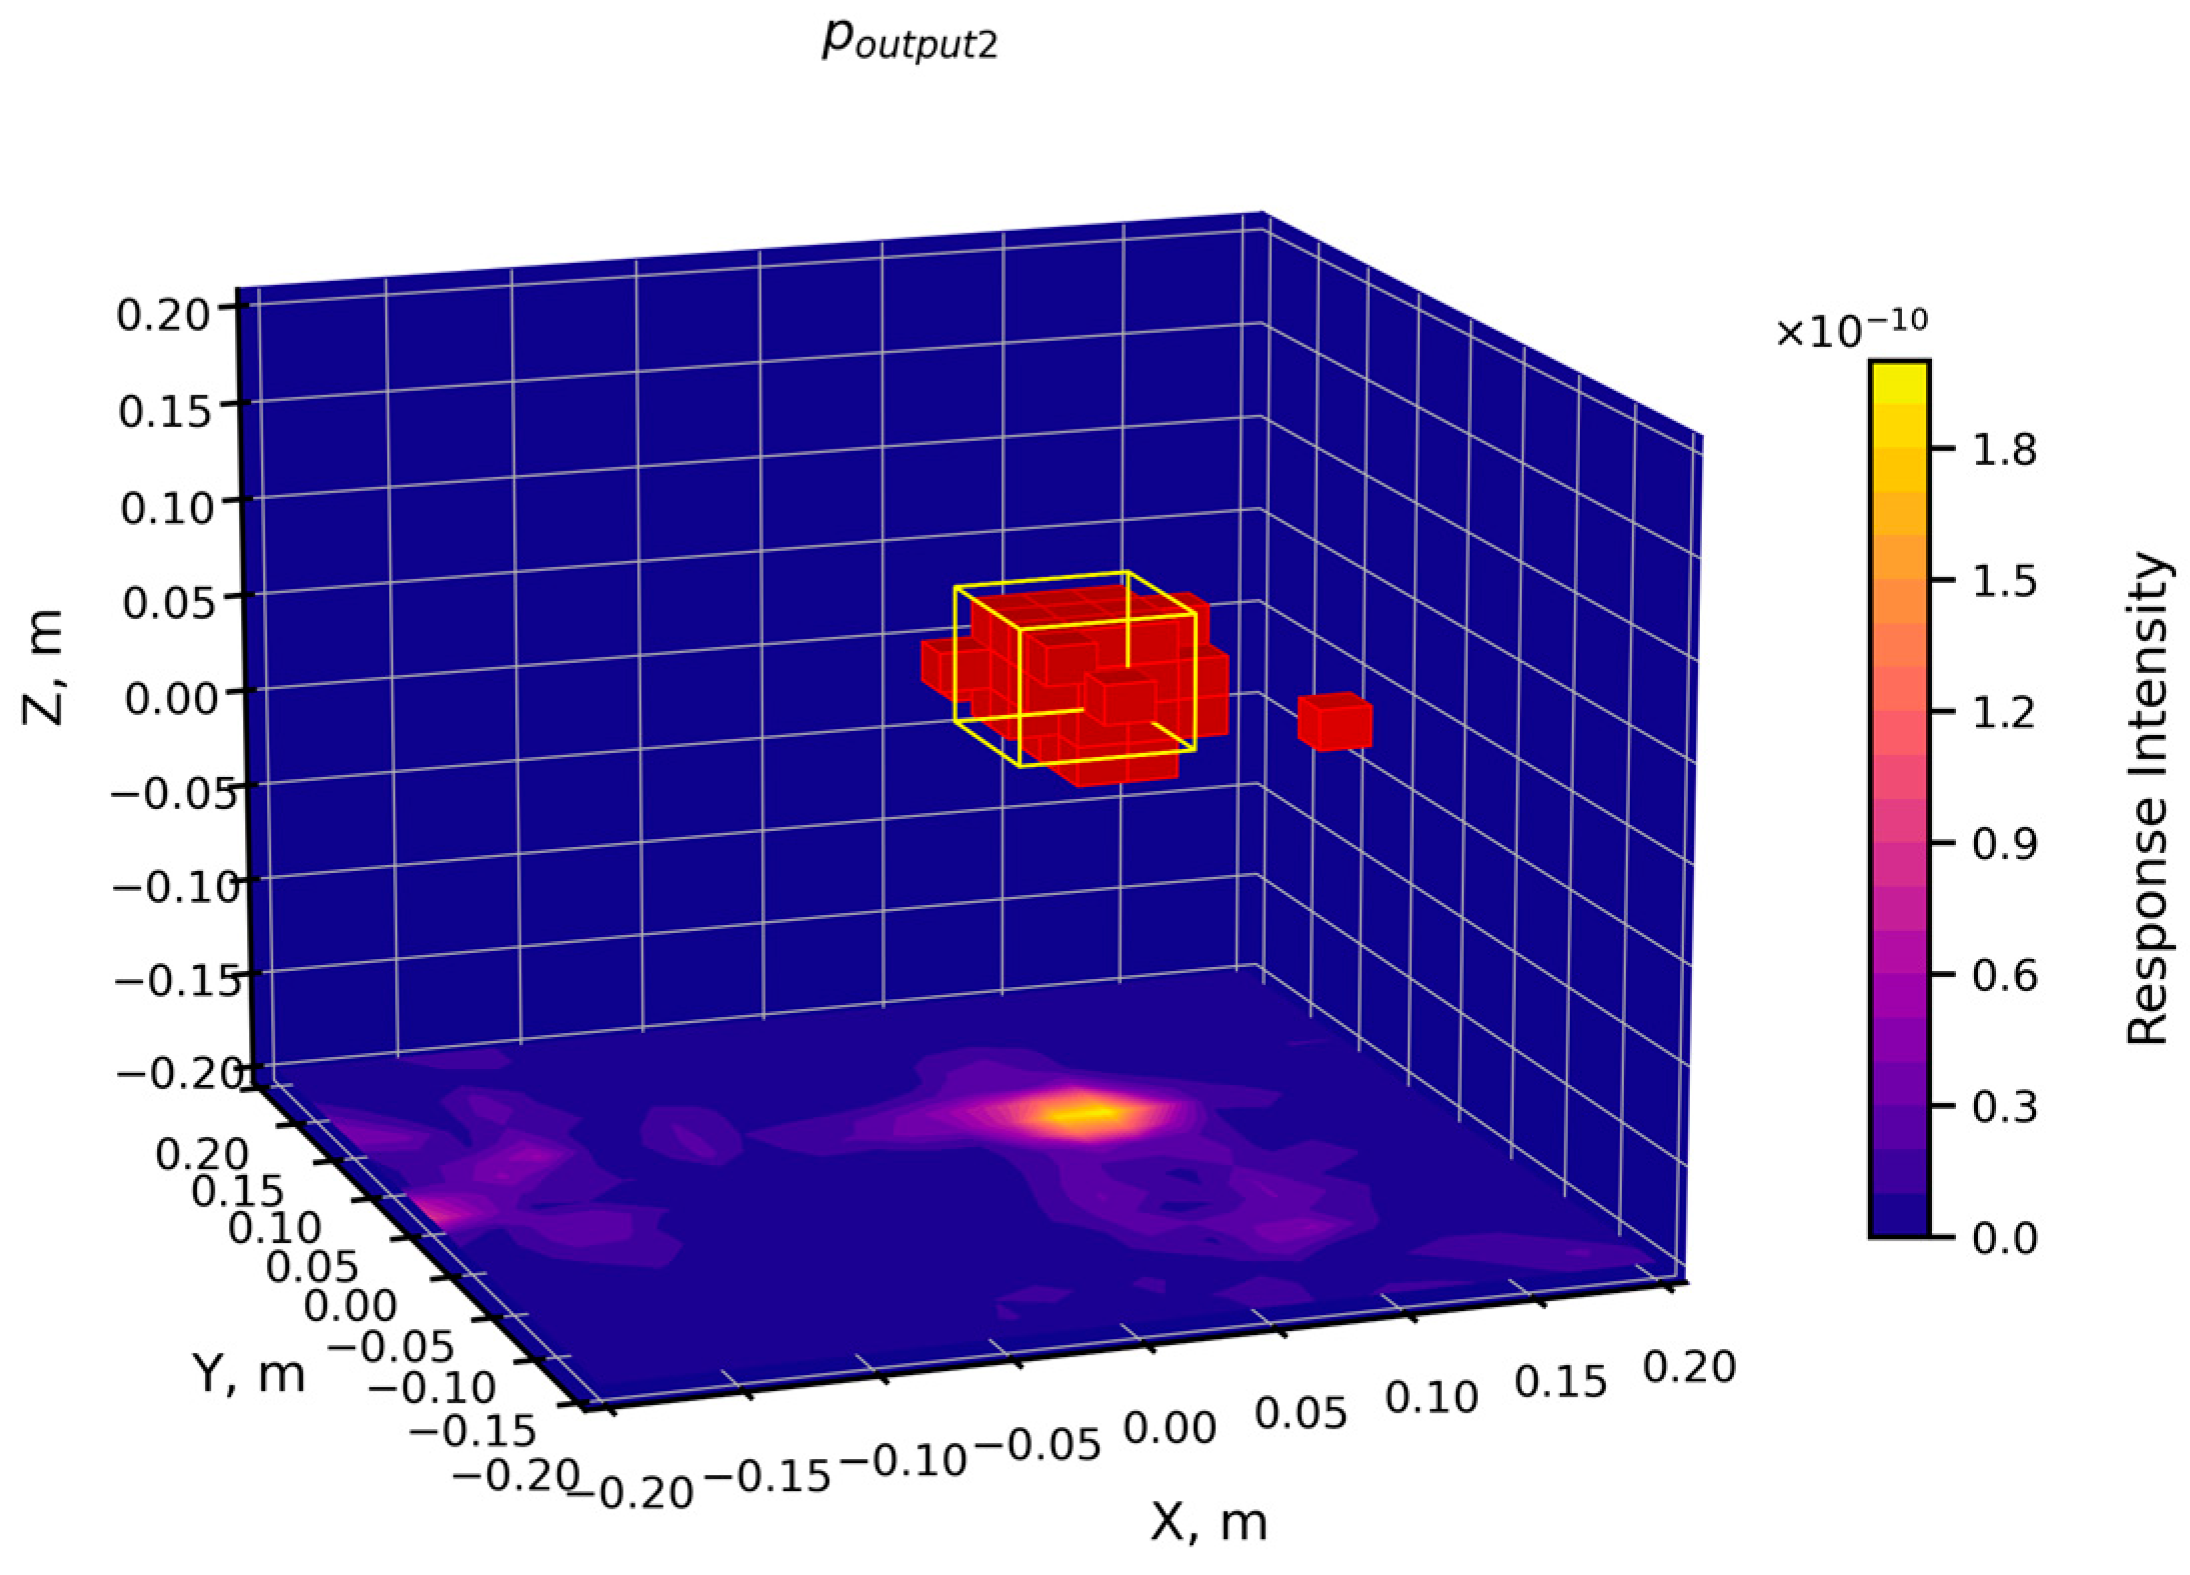
This paper, based on DMAS beamforming techniques and the grain pile anomalous moisture region localization algorithm, successfully located a 7 cm × 7 cm × 7 cm region with 15.4% moisture content within an experimental cubic bin containing 10.5% dry long-grained rice. The average localization accuracy recall exceeded 50%.
Through testing various layouts of electromagnetic wave transmitters and receivers, an effective configuration and detectable space were identified. Detection capabilities varied across different positions, with stronger detection observed when the target was penetrated by more electromagnetic fields. To achieve enhanced spatial resolution and reduce artifacts, at least three rows of electromagnetic wave transmitters or receivers were arranged along each axis.
Extensive experimental validation revealed that after preliminary localization using the grain pile anomalous moisture region localization algorithm, the reliability of unknown sample localization results could be effectively assessed by the SMR value and comparing D m a x and D v o l . When D m a x = D v o l with higher SMR, reliability was high, with the anomalous region exhibiting improved recall. Conversely, when D m a x D v o l , reliability decreased, typically accompanied by lower SMR values and reduced recall.
While the developed method demonstrated rapid detection and accurate localization, several challenges remained for practical application. Future research directions include adaptation for larger grain storage facilities; improvement in detection speed; and reduction of external interference.
For application in large-scale grain storage facilities, specialized hardware is required to meet practical performance needs in terms of increased penetration depth and resolution. Furthermore, due to large volume constraints in such facilities, the detection resolution requirements are reduced to 1 m3.
The method’s sensitivity to interference was attributed to the small difference in moisture content between anomalous and normal regions, resulting in similar calculated responses. While increasing sampling data could enhance the response, this approach would increase both cost and computation time. Moreover, moisture content evaluation remained a significant challenge. The relationship between moisture content, size, location of anomalous regions, and response intensity exhibited complex non-linear characteristics.

Author Contributions

Conceptualization, X.D. and Z.H.; methodology, X.D.; software, X.D.; validation, X.Y. and J.Z.; formal analysis, X.D.; investigation, X.D.; resources, X.D.; data curation, X.D.; writing—original draft preparation, X.D.; writing—review and editing, X.D.; visualization, X.D.; supervision, J.Z.; project administration, Z.H. All authors have read and agreed to the published version of the manuscript.

Funding

This research received no external funding.

Institutional Review Board Statement

Not applicable.

Informed Consent Statement

Not applicable.

Data Availability Statement

The original contributions presented in this study are included in the article. Further inquiries can be directed to the corresponding author.

Acknowledgments

This work was technically supported by Shanghai Jiao Tong University.

Conflicts of Interest

The authors declare no conflicts of interest. The funders had no role in the design of the study; in the collection, analyses, or interpretation of data; in the writing of the manuscript; or in the decision to publish the results.

Appendix A

This appendix explains the specific algorithms in Figure 2.
The set of points within the grain pile region P = { p 1 p 2 , ,   p n } . The corresponding response values r i of p i have been calculated according to Equations (1) and (2). To facilitate a more intuitive analysis and comparison of the data, as well as to eliminate environmental interference, the response value of each point r i is converted to its corresponding SMR value r ^ i . This is accomplished by dividing r i by the average response value of the entire region:
r ^ i = r i 1 n i = 1 n r i .
In the preliminary localization process, the computational method involves sorting spatial points in descending order, followed by smoothing to obtain r ~ i :
r ~ i = S m o o t h S o r t D e s c r ^ i .
Subsequently, the rate of descent between adjacent points is calculated. A slope threshold θ is established, which is used to determine the corresponding response intensity threshold. Regions exceeding this response intensity threshold p o u t p u t 1 are then extracted for further analysis:
p o u t p u t 1 = { p i : i m a x j : r ~ j r ~ j + 1 d j > θ } .
The slope threshold θ is an empirical value determined through experimentation. For all types of grains and containers, recalibration is necessary to ensure that all anomalous regions are included after the preliminary localization process. Notably, θ does not exhibit a strong correlation with final localization results, making its determination relatively straightforward and applicable to the majority of cases.
Extensive experimental testing has demonstrated that, given a constant volume of the anomalous region, an increase in grain moisture content corresponds to an increase in the number of points displayed. The aim is to localize grain with 15% anomalous moisture content ( θ 0.01 ). Consequently, when measuring grain with other moisture contents, the region obtained after preliminary localization is typically much larger than the actual volume of the anomalous region.
In the secondary localization process, nevertheless, experimental evidence suggests a high probability that the anomalous region is located within the merged area of these two methods:
p 2 = D m a x D v o l , D m a x , D v o l p o u t p u t l ,
where the value of each point within p 2 is r 2 i . Finally, the responses within p 2 are arranged in descending order. Based on the predetermined volume of the area to be detected, the strongly responsive points corresponding to this volume size are
p o u t p u t 2 = p 2 j : j V N   a n d   j S o r t D e s c r 2 i ,
where, V N represents the number of voxels calculated based on the volume of the area to be detected and the spatial resolution.

References

  1. Ziegler, V.; Paraginski, R.T.; Ferreira, C.D. Grain storage systems and effects of moisture, temperature and time on grain quality—A review. J. Stored Prod. Res. 2021, 91, 101770. [Google Scholar] [CrossRef]
  2. Flor, O.; Palacios, H.; Suárez, F.; Salazar, K.; Reyes, L.; González, M.; Jiménez, K. New Sensing Technologies for Grain Moisture. Agriculture 2022, 12, 386. [Google Scholar] [CrossRef]
  3. Lutz, É.; Coradi, P.C. Applications of new technologies for monitoring and predicting grains quality stored: Sensors, Internet of Things, and Artificial Intelligence. Measurement 2022, 188, 110609. [Google Scholar] [CrossRef]
  4. Ibrahim, A.A.A. Monitoring some quality attributes of different wheat varieties by infrared technology. Agric. Eng. Int. CIGR J. 2018, 20, 201–210. [Google Scholar]
  5. Aria, A.; Peter, M.V.D.B. The contrast source inversion method for location and shape reconstructions. Inverse Probl. 2002, 18, 495. [Google Scholar]
  6. LoVetri, J.; Asefi, M.A.; Gilmore, C.; Jeffrey, I. Innovations in Electromagnetic Imaging Technology: The Stored-Grain-Monitoring Case. IEEE Antennas Propag. Mag. 2020, 62, 33–42. [Google Scholar] [CrossRef]
  7. Asefi, M.; Jeffrey, I.; LoVetri, J.; Gilmore, C.; Card, P.; Paliwal, J. Grain bin monitoring via electromagnetic imaging. Comput. Electron. Agric. 2015, 119, 133–141. [Google Scholar] [CrossRef]
  8. Gilmore, C.; Asefi, M.; Paliwal, J.; LoVetri, J. Industrial scale electromagnetic grain bin monitoring. Comput. Electron. Agric. 2017, 136, 210–220. [Google Scholar] [CrossRef]
  9. Asefi, M.; Gilmore, C.; Jeffrey, I.; LoVetri, J.; Paliwal, J. Detection and continuous monitoring of localised high-moisture regions in a full-scale grain storage bin using electromagnetic imaging. Biosyst. Eng. 2017, 163, 37–49. [Google Scholar] [CrossRef]
  10. Asefi, M.; Zakaria, A.; Lovetri, J. Microwave Imaging Using Normal Electric-Field Components Inside Metallic Resonant Chambers. IEEE Trans. Microw. Theory Tech. 2017, 65, 923–933. [Google Scholar] [CrossRef]
  11. Gilmore, C.; Asefi, M.; Nemez, K.; Paliwal, J.; LoVetri, J. Three dimensional radio-frequency electromagnetic imaging of an in-bin grain conditioning process. Comput. Electron. Agric. 2019, 167, 105059. [Google Scholar] [CrossRef]
  12. Zhang, C.; Shi, Z.; Yang, H.; Zhou, X.; Wu, Z.; Jayas, D.S. A Novel, Portable and Fast Moisture Content Measuring Method for Grains Based on an Ultra-Wideband (UWB) Radar Module and the Mode Matching Method. Sensors 2019, 19, 4224. [Google Scholar] [CrossRef] [PubMed]
  13. Trabelsi, S.; Paz, A.M.; Nelson, S.O. Microwave dielectric method for the rapid, non-destructive determination of bulk density and moisture content of peanut hull pellets. Biosyst. Eng. 2013, 115, 332–338. [Google Scholar] [CrossRef]
  14. Wang, J.; Fan, L.; Zhou, Q.; Li, J.; Zhao, P.; Wang, Z.; Zhang, H.; Yan, S.; Huang, L. Rapid Determination of Meat Moisture Content Using Radio-Frequency Dielectric Measurement. IEEE Access 2018, 6, 51384–51391. [Google Scholar] [CrossRef]
  15. Salucci, M.; Poli, L.; Rocca, P.; Massa, A. Learned Global Optimization for Inverse Scattering Problems: Matching Global Search with Computational Efficiency. IEEE Trans. Antennas Propag. 2022, 70, 6240–6255. [Google Scholar] [CrossRef]
  16. Zhang, H.H.; Yao, H.M.; Jiang, L.; Ng, M. Enhanced Two-Step Deep-Learning Approach for Electromagnetic-Inverse-Scattering Problems: Frequency Extrapolation and Scatterer Reconstruction. IEEE Trans. Antennas Propag. 2023, 71, 1662–1672. [Google Scholar] [CrossRef]
  17. Chen, Z.; Wu, W.; Dou, J.; Liu, Z.; Chen, K.; Xu, Y. Design and Analysis of a Radio-Frequency Moisture Sensor for Grain Based on the Difference Method. Micromachines 2021, 12, 708. [Google Scholar] [CrossRef]
  18. Nilavalan, R.; Gbedemah, A.; Craddock, I.; Li, X.; Hagness, S. Numerical investigation of breast tumour detection using multi-static radar. Electron. Lett. 2003, 39, 1787–1789. [Google Scholar] [CrossRef]
  19. O’loughlin, D.; Oliveira, B.L.; Elahi, M.A.; Glavin, M.; Jones, E.; Popović, M.; O’halloran, M. Parameter Search Algorithms for Microwave Radar-Based Breast Imaging: Focal Quality Metrics as Fitness Functions. Sensors 2017, 17, 2823. [Google Scholar] [CrossRef]
  20. Lim, H.B.; Nhung, N.T.T.; Li, E.-P.; Thang, N.D. Confocal Microwave Imaging for Breast Cancer Detection: Delay-Multiply-and-Sum Image Reconstruction Algorithm. IEEE Trans. Biomed. Eng. 2008, 55, 1697–1704. [Google Scholar]
  21. Perrot, V.; Polichetti, M.; Varray, F.; Garcia, D. So you think you can DAS? A viewpoint on delay-and-sum beamforming. Ultrasonics 2021, 111, 106309. [Google Scholar] [CrossRef] [PubMed]
  22. Matrone, G.; Savoia, A.S.; Caliano, G.; Magenes, G. The Delay Multiply and Sum Beamforming Algorithm in Ultrasound B-Mode Medical Imaging. IEEE Trans. Med. Imaging 2015, 34, 940–949. [Google Scholar] [CrossRef] [PubMed]
  23. Wu, D.; Yin, X.; Jiang, B.; Jiang, M.; Li, Z.; Song, H. Detection of the respiratory rate of standing cows by combining the Deeplab V3+ semantic segmentation model with the phase-based video magnification algorithm. Biosyst. Eng. 2020, 192, 72–89. [Google Scholar] [CrossRef]
  24. Ronneberger, O.; Fischer, P.; Brox, T. U-Net: Convolutional Networks for Biomedical Image Segmentation. In Proceedings of the Medical Image Computing and Computer-Assisted Intervention—MICCAI 2015, Munich, Germany, 5–9 October 2015; Springer International Publishing: Cham, Switzerland, 2015. [Google Scholar]
Figure 1. Detection system for detecting anomalous moisture regions in the grain pile and the data acquisition and processing unit. Red arrows indicate electromagnetic wave emission, while blue arrows represent the reception of electromagnetic waves containing information about hotspots (areas of anomalous grain moisture).
Applsci 15 04848 g001
Figure 2. Flow chart of the grain pile anomalous moisture region localization algorithm. In the hotspot localization result image, the red voxels represent the localization result, while the yellow frame indicates the actual anomalous region, and the bottom is a cross-sectional view of the focal point responses at z = 0. No further explanation will be provided hereafter.
Applsci 15 04848 g002
Figure 3. Results using 19.0% moisture content grain. (a) “Single-layer” layout with “Cross-shape” along the z-axis; (b) Hotspot localization results for the “single-layer” layout, showing lower response intensity and inability to obtain height information, resulting in localization errors; (c) “Double-layer” layout along the z-axis; (d) Hotspot localization results for the “double-layer” layout, demonstrating enhanced response intensity and improved anomaly resolution capability along the z-axis, but poor resolution capability along the y-axis. The red boxes in the layout diagrams indicated the currently detectable areas (analyzed and explained in Section 3.2 and Section 3.3).
Applsci 15 04848 g003
Figure 4. Comparison of SMR values for “single-layer” and “double-layer” layouts. The SMR values for the “double-layer” layout were higher than those for the “single-layer” layout. When the SMR fell below 10, localization accuracy decreased, resulting in erroneous regions, as shown in Figure 3b.
Applsci 15 04848 g004
Figure 5. Results using 19.0% moisture content grain. (a) The “fan-shaped” layout configuration; (b) Hotspot localization results near the transmitter (x-axis); (c) Hotspot localization results far from the transmitter (x-axis). Near the x-axis, the layout demonstrated resolution capability in both x and y directions. However, at greater distances from the x-axis, while x-axis resolution was maintained, y-axis resolution decreased significantly. The predicted hotspot regions appeared “elongated” and were inaccurately positioned along the y-axis, showing a shift towards the x-axis.
Applsci 15 04848 g005
Figure 6. Results using 15.4% moisture content grain. (a) X-axis transmitter layout; (b) This layout demonstrated resolution capability only along the x-axis. The voxel representation of the anomalous region was elongated in the y-axis direction; (c) Y-axis transmitter layout; (d) This configuration showed resolution capability only along the y-axis. The voxel representation of the anomalous region was elongated in the x-axis direction; (e) “Cross-shaped” layout; (f) This arrangement resulted in a “cross-shaped” hotspot, successfully localizing the anomaly with resolution capability in both x and y directions.
Applsci 15 04848 g006
Figure 7. Results using 17.7% moisture content grain. (a) The layout method that previously achieved accurate localization (as shown in Figure 6e) was employed. The blue boxed area indicated regions where artifacts appeared; (b) When the calculation area was expanded to include the blue boxed region, artifacts emerged at the bottom of the expanded area.
Applsci 15 04848 g007
Figure 8. Results using 17.5% moisture content grain. (a) The layout from Figure 6e was modified by increasing the vertical distance between the upper and lower layers of receivers; (bd) showed localization results for three different positions. While this modification expanded the detection range, it did not significantly improve the z-axis resolution capability. Instead, the response intensity decreased, making the system more susceptible to interference, potentially reducing localization accuracy.
Applsci 15 04848 g008
Figure 9. Results using 19.0% moisture content grain. (a) A top view of the layout from Figure 6e was shown, with localization performed for hotspot areas in three different positions. (bd) displayed the localization results for positions #1, #2, and #3, respectively. Only position #3 was predicted accurately. Position #2 showed relatively low prediction accuracy, while the prediction for position #1 was entirely incorrect. Consequently, the area capable of accurate prediction was limited to the region within the red box.
Applsci 15 04848 g009
Figure 10. The SMR values of the response intensities for the three positions shown in Figure 9.
Applsci 15 04848 g010
Figure 11. (a) The distribution map p o u t p u t 1 after preliminary localization for the hotspot shown in Figure 2. The final localization accuracy recall = 64.58%; (b) The distribution map p o u t p u t 1 for position #2 from Figure 9, recall = 25.00%.
Applsci 15 04848 g011
Figure 12. The SMR values for the region p o u t p u t 1 containing D m a x and D v o l from Figure 11b. Red line: SMR value of D m a x region. Black line: SMR value of D v o l region. In this case, D m a x and D v o l were not identical, while the actual anomalous location was at D v o l . Consequently, a method combining the D m a x and D v o l regions was proposed to enhance localization accuracy. However, the recall (25.00%) was lower, leading to a decrease in the reliability of the localization results.
Applsci 15 04848 g012
Figure 13. The four test results of SMR response and localization accuracy for anomaly areas using the layout of Figure 6e.
Applsci 15 04848 g013
Figure 14. Example of anomaly area localization results at the fourth position in Figure 13.
Applsci 15 04848 g014
Table 1. Experimental parameters table. The spatial resolution of the DMAS algorithm was 2 cm, corresponding to a 10% resolution of the length. S M R ¯ represents the average SMR of voxels in the anomalous region. High recall values did not necessarily indicate that the localization result closely approximated the actual shape when using the wrong layout.
LayoutTest NamePosition NumberScattered Signal NumberMoisture Content D m a x   =   D v o l ? S M R ¯ Recall
Single-layerFeasibility Test#11819.0%N6.6027.08%
Double-layerFeasibility Test#13619.0%Y9.0637%
Fan-shapeFeasibility Test#110819.0%Y23.3666.67%
#2Y16.9422.22%
Cross-shape *Artifactual
Regions Test
#13617.5%Y10.2729.17%
#2N8.9633.33%
#3Y14.8161.11%
Blind Spot Test#119.0%Y6.290.00%
#2N6.1825.00%
#3 *Y15.3866.67%
Position Test *#1 *15.4%Y10.7858.33%
#2 *Y19.2055.55%
#3 *Y14.5762.96%
#4 *Y12.2883.33%
* Effective layout and tests with high localization accuracy.
Disclaimer/Publisher’s Note: The statements, opinions and data contained in all publications are solely those of the individual author(s) and contributor(s) and not of MDPI and/or the editor(s). MDPI and/or the editor(s) disclaim responsibility for any injury to people or property resulting from any ideas, methods, instructions or products referred to in the content.

