Article

Predictive Models of Patient Severity in Intensive Care Units Based on Serum Cytokine Profiles: Advancing Rapid Analysis

by
Cristiana P. Von Rekowski
1,2,3,
Tiago A. H. Fonseca
1,2,3,
Rúben Araújo
1,2,3,
Ana Martins
2,4,5,
Iola Pinto
2,6,
M. Conceição Oliveira
7,
Gonçalo C. Justino
7,
Luís Bento
8,9 and
Cecília R. C. Calado
2,10,*
1
NMS—NOVA Medical School, FCM—Faculdade de Ciências Médicas, Universidade NOVA de Lisboa, Campo Mártires da Pátria 130, 1169-056 Lisbon, Portugal
2
ISEL—Instituto Superior de Engenharia de Lisboa, Instituto Politécnico de Lisboa, Rua Conselheiro Emídio Navarro 1, 1959-007 Lisbon, Portugal
3
CHRC—Comprehensive Health Research Centre, Universidade NOVA de Lisboa, 1150-082 Lisbon, Portugal
4
CIMOSM—Centro de Investigação em Modelação e Optimização de Sistemas Multifuncionais, ISEL—Instituto Superior de Engenharia de Lisboa, Instituto Politécnico de Lisboa, Rua Conselheiro Emídio Navarro 1, 1959-007 Lisbon, Portugal
5
CIMA—Research Centre for Mathematics and Applications, Rua Conselheiro Emídio Navarro 1, 1959-007 Lisbon, Portugal
6
NOVA Math—Center for Mathematics and Applications, NOVA FCT—NOVA School of Science and Technology, Universidade NOVA de Lisboa, Largo da Torre, 2829-516 Caparica, Portugal
7
Centro de Química Estrutural—Institute of Molecular Sciences, Instituto Superior Técnico, Universidade de Lisboa, Av. Rovisco Pais 1, 1049-001 Lisbon, Portugal
8
Intensive Care Department, ULSSJ—Unidade Local de Saúde de São José, Rua José António Serrano, 1150-199 Lisbon, Portugal
9
Integrated Pathophysiological Mechanisms, CHRC—Comprehensive Health Research Centre, NMS—NOVA Medical School, FCM—Faculdade de Ciências Médicas, Universidade NOVA de Lisboa, Campo Mártires da Pátria 130, 1169-056 Lisbon, Portugal
10
iBB—Institute for Bioengineering and Biosciences, i4HB—The Associate Laboratory Institute for Health and Bioeconomy, IST—Instituto Superior Técnico, Universidade de Lisboa, Av. Rovisco Pais, 1049-001 Lisbon, Portugal
*
Author to whom correspondence should be addressed.
Appl. Sci. 2025, 15(9), 4823; https://doi.org/10.3390/app15094823
Submission received: 12 March 2025 / Revised: 19 April 2025 / Accepted: 22 April 2025 / Published: 26 April 2025
(This article belongs to the Special Issue Advances in Biological and Biomedical Optoelectronics)

Abstract

:
Predicting disease states and outcomes—and anticipating the need for specific procedures—enhances the efficiency of patient management, particularly in the dynamic and heterogenous environments of intensive care units (ICUs). This study aimed to develop robust predictive models using small sets of blood analytes to predict disease severity and mortality in ICUs, as fewer analytes are advantageous for future rapid analyses using biosensors, enabling fast clinical decision-making. Given the substantial impact of inflammatory processes, this research examined the serum profiles of 25 cytokines, either in association with or independent of nine routine blood analyses. Serum samples from 24 male COVID-19 patients admitted to an ICU were divided into three groups: Group A, including less severe patients, and Groups B and C, that needed invasive mechanical ventilation (IMV). Patients from Group C died within seven days after the current analysis. Naïve Bayes models were developed using the full dataset or with feature subsets selected either through an information gain algorithm or univariate data analysis. Strong predictive models were achieved for IMV (AUC = 0.891) and mortality within homogeneous (AUC = 0.774) or more heterogeneous (AUC = 0.887) populations utilizing two to nine features. Despite the small sample, these findings underscore the potential for effective prediction models based on a limited number of analytes.

1. Introduction

Improving the management of critically ill patients, particularly in intensive care units (ICUs), has become crucial, given the growing prevalence of chronic diseases, the emergence of new infectious diseases such as the coronavirus disease 2019 (COVID-19), and the concomitant rise in healthcare expenses over the past few years. To improve patient management within the dynamic and heterogeneous populations at ICUs, it is fundamental to create models for the early stratification of patients, considering illness severity, potential complications and mortality risk. Within this context, diverse ICU severity scores have been developed, including the Acute Physiology and Chronic Health Evaluation System (APACHE) and the Simplified Acute Physiology Score (SAPS), as well as organ dysfunction scores like the Sequential Organ Failure Assessment (SOFA) [1,2]. However, these scores often require a substantial amount of demographic and clinical data and present a significant margin of error, hence being primarily used for risk stratification, inter-unit comparisons, and evaluating care quality for patients with similar risk profiles [1,2]. Therefore, it remains relevant to develop new models that, relying on a limited number of variables that may be easily collected throughout hospitalization, can accurately and precisely predict disease severity and patient outcomes in the ICU. Such a small number of analytes could, in the future, be detected using biosensors with minimally invasive methods like a drop of blood, providing essential predictive information and enabling rapid decision-making in ICUs.
A common factor among critically ill patients in ICUs is their complex inflammatory processes, which must be well understood for effective management. Serum cytokines could overcome the limitations of the aforementioned scoring systems, as they are individual quantifiable and objective indicators of physiological and pathological processes. Furthermore, they can be measured repeatedly, offering real-time insights into patients’ conditions. By developing predictive models that integrate cytokines and other biomarkers, healthcare professionals could achieve more accurate, reliable, and comprehensive assessments of patients’ conditions in the ICU, enhancing decision-making and improving patient outcomes. For example, Yu et al. developed several models to predict in-hospital mortality in COVID-19 patients using clinical characteristics and inflammatory cytokines levels from the first day of admission [3]. All models achieved accuracies greater than 80%, with IFN-α, IL-8, and IL-6 being identified as key biomarkers for the prognosis of COVID-19 patients [3]. Luo et al. demonstrated that COVID-19 mortality could be predicted using a combination of IL-8 and lymphocyte subsets, achieving an AUC of 0.956 (95% CI, 0.928 to 0.984), with sensitivity and specificity exciding 90% [4]. Recently, Tulu et al. also developed another significant prediction model for COVID-19 mortality risk, incorporating 20 biomarkers, with an AUC of 0.98 (95% CI, 0.96 to 0.98) [5]. Moreover, Nguyen et al. determined that D-dimer, ferritin, and IL-6 could predict the severity of COVID-19 with 97% accuracy; this model even achieved 92% accuracy when IL-6 was not considered, making it useful for hospitals with limitations in testing for this biomarker [6]. Methodologies like these that use patients’ clinical information and laboratory analyses have also been applied in other areas, enabling the prediction of, e.g., pulmonary infection in stroke patients [7], sepsis in the ICU [8], and acute kidney injury in ICU patients with cerebrovascular disease [9]. All of these findings underscore the critical importance of comprehending the intricate immunopathological mechanisms underlying inflammatory responses to optimize patient care. Despite their usefulness, most of these models primarily focus on hospitalized patients, with relatively few studies specifically addressing ICU care—particularly in the context of COVID-19 populations. Furthermore, the complexity of inflammatory processes, coupled with the dynamic and heterogenous nature of ICU populations and the greater severity of their conditions compared to other hospitalized patients, still presents a great challenge in formulating a predictive tool that is suitable for various clinical scenarios.
Hence, the present work aimed to develop predictive models for disease severity, including mortality risk, specifically for ICU-admitted COVID-19 patients. Serum samples from 24 male patients were analyzed, yielding results for 25 cytokines that were implemented in different prediction models alongside routine blood analyses. These included leukocytes profiles (neutrophils, eosinophils and lymphocytes), red blood cells (RBCs), ferritin, platelets, fibrinogen, D-dimers, procalcitonin, CRP, lactate dehydrogenase (LDH), creatinine, and high-sensitivity cardiac troponin I (hs-cTn I). The 24 patients were equally divided into three groups: Group A included less severe patients who did not require invasive mechanical ventilation (IMV), while Groups B and C included patients who needed IMV, with those in Group C dying in the ICU an average of 7 days after the analysis. Naïve Bayes models were developed to predict disease severity (i.e., need for IMV) and mortality in the ICU, incorporating either cytokines, routine blood analyses results, or a combination of both kinds of data.

2. Material and Methods
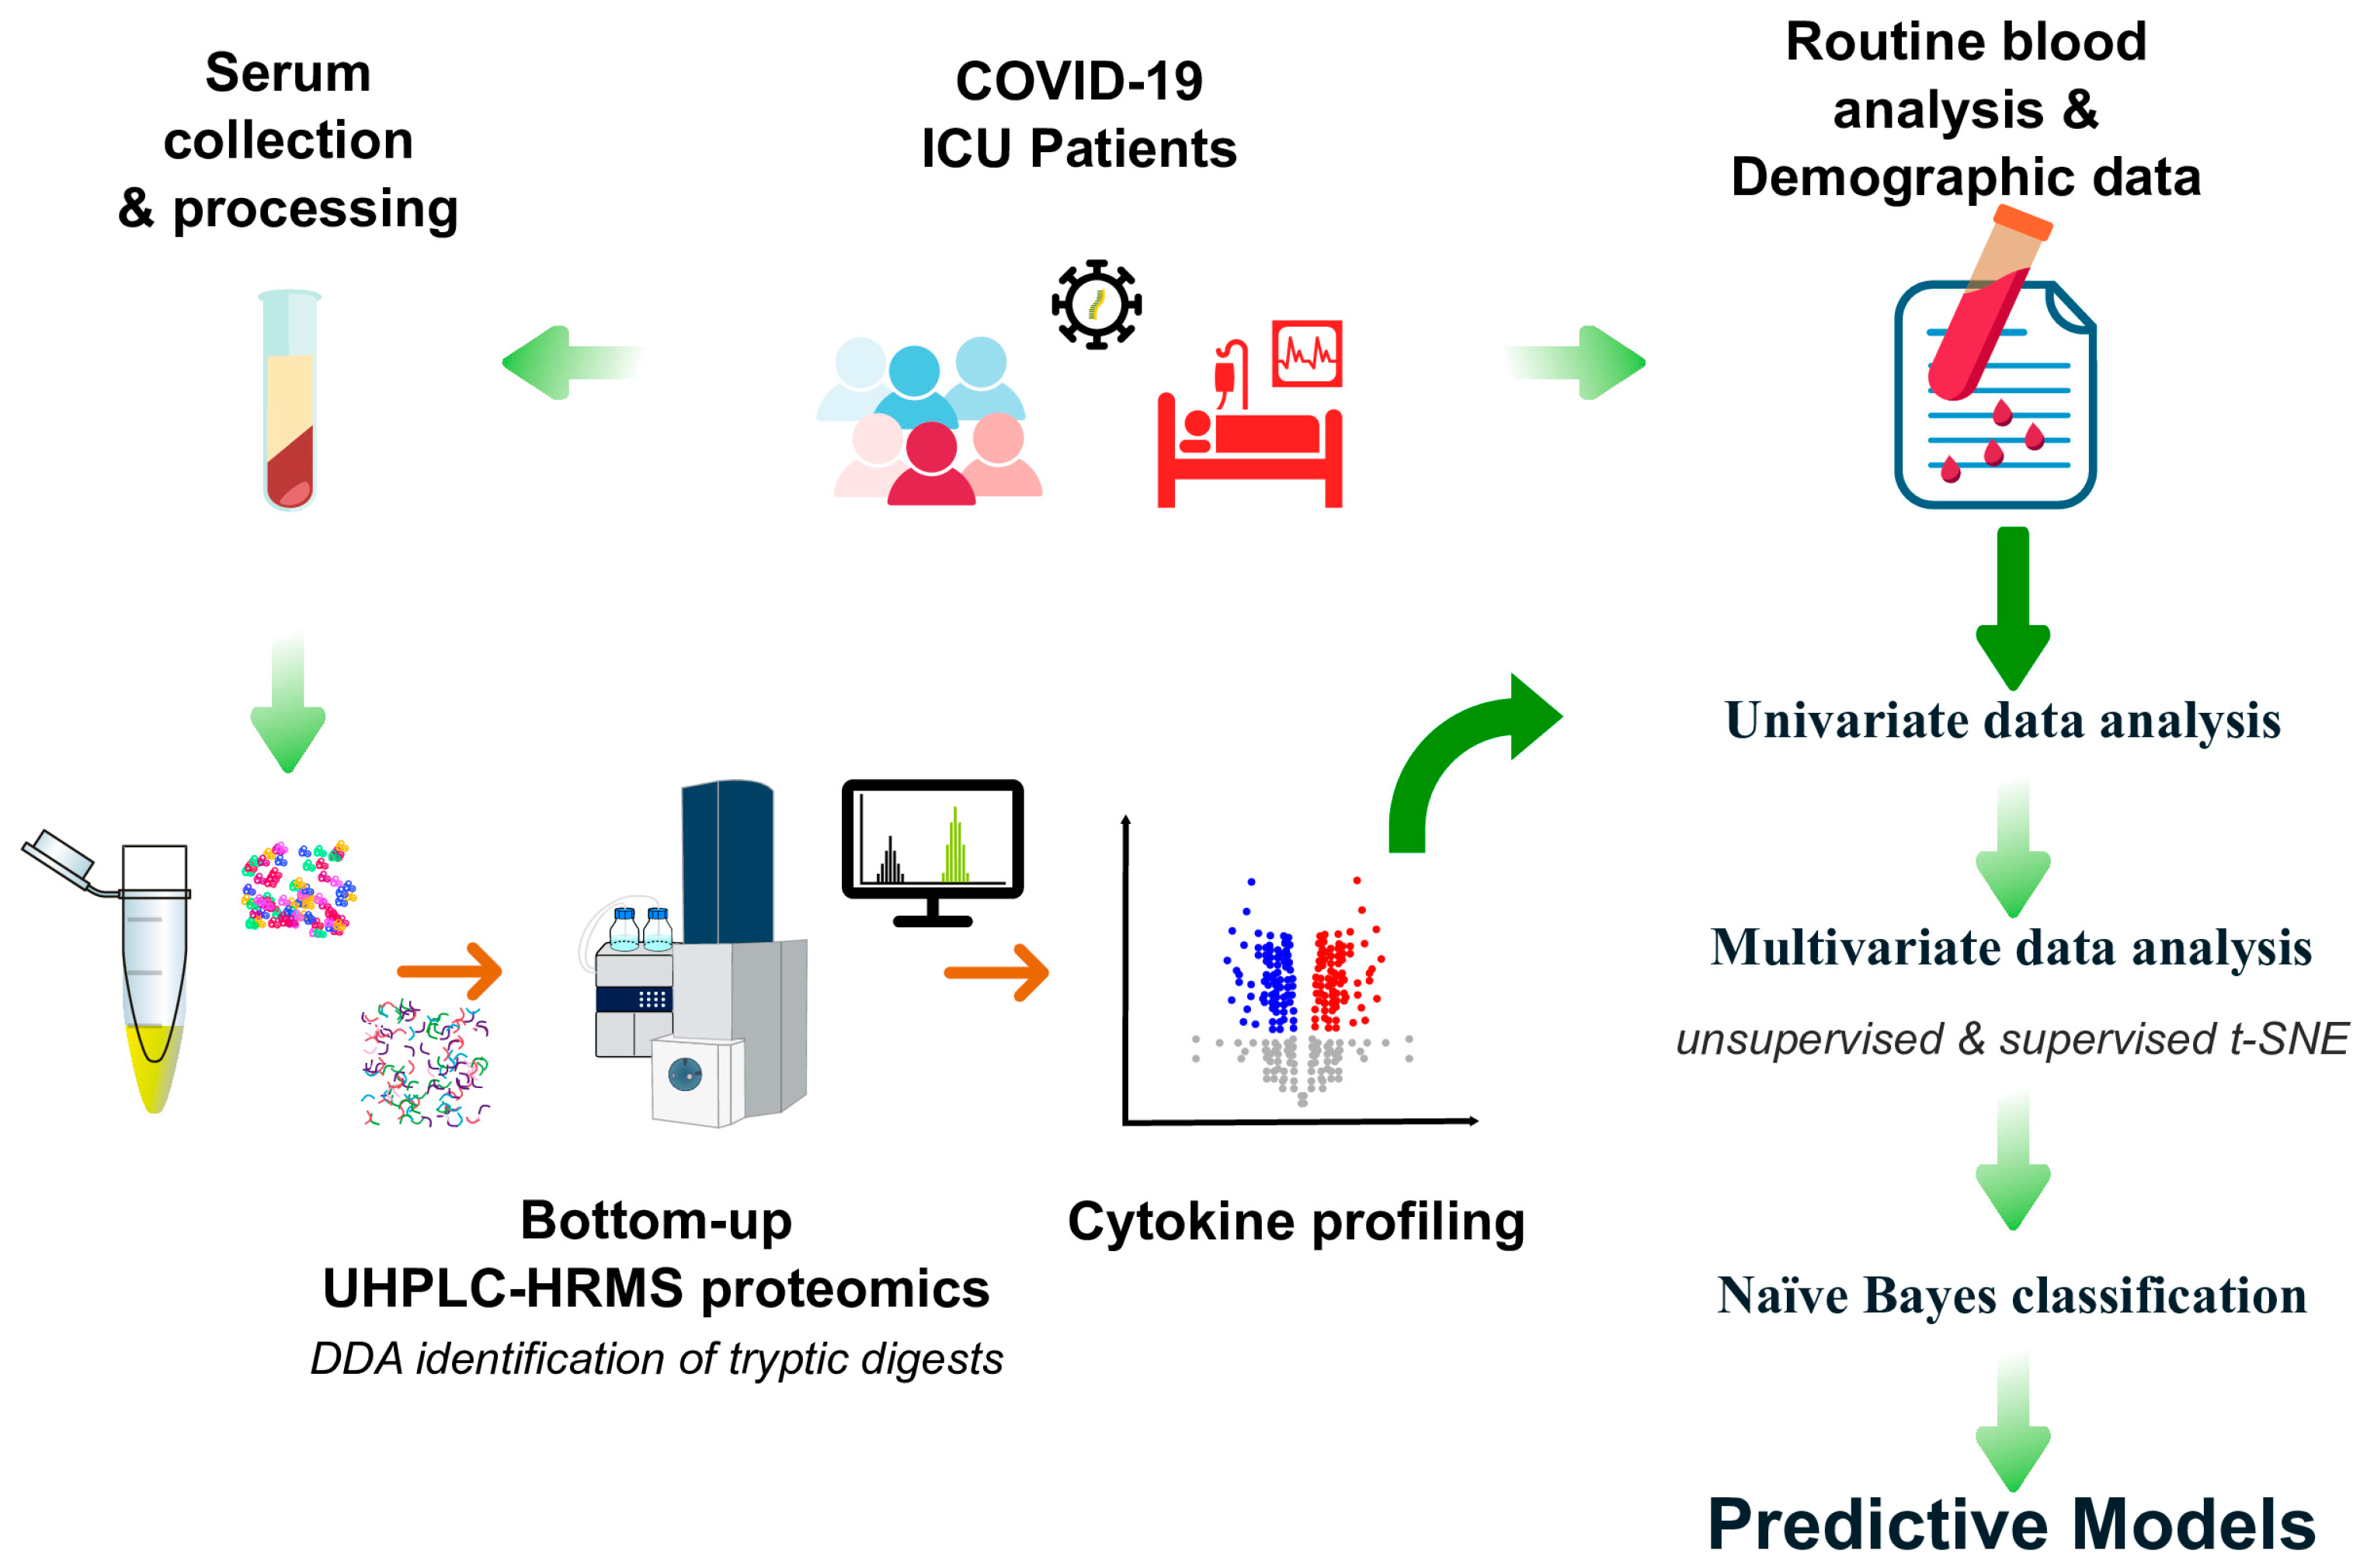
2.1. Study Design

A retrospective, single-center study was conducted, enrolling 24 male COVID-19 patients admitted to the ICU of Hospital de São José, Unidade Local de Saúde de São José, between November 2020 and Jully 2021. For all patients, demographic and clinical data, routine laboratory parameters results, and whole blood samples were collected. Patients were divided into three groups of eight individuals each based on disease severity: Group A included less severe patients who were discharged from the ICU without requiring IMV; Group B with patients who required IMV and were also discharged from the ICU; and Group C with those who needed IMV and died in the ICU. In COVID-19, severe disease is typically classified as requiring hospitalization and supplemental oxygen, while critical disease involves the need for noninvasive or mechanical ventilation [10]. Hence, patients from Group A were considered to have a less severe condition than those from Group B. In Groups B and C, all required IMV, being solely differentiated based on their outcomes, specifically, whether they were discharged from the ICU or deceased. The three groups’ demographic, clinical, and laboratory data were compared concerning the outcomes “need for IVM” (A vs. B) and “mortality in the ICU” (B vs. C and A + B vs. C) in order to develop predictive models (Figure 1).
Ethical approval was granted by the hospital’s Ethics Committee (project number 1043/2021, 20 May 2020), and informed consent was obtained from all patients or their family members prior to enrolment. COVID-19 diagnosis was confirmed with real-time polymerase chain reaction tests for SARS-CoV-2. Patients’ clinical data were obtained from the hospital’s electronic medical record system and properly anonymized. Serum samples were collected within the first 14 days of ICU admission. Due to limitations in sample availability and the very low number of female patient samples, only male patients were included to ensure the robustness of the models by minimizing confounding factors. Consequently, it is important to acknowledge that the inclusion of only male patients and the small sample size of 24 individuals are limitations of the study that should be considered upfront, as they can affect the generalizability of the findings.

2.2. Demographics and Clinical Characteristics

Demographic variables included age, body mass index (BMI) (kg/m2), and patients’ geographical area of origin (i.e., Portugal, other European countries, Africa and Asia). Clinical characteristics included the general presence/absence of the following comorbidities: arterial hypertension, obesity, diabetes, dyslipidemia, and chronic respiratory diseases (such as asthma, chronic obstructive pulmonary disease, and emphysema). Respiratory support concerned the need for IMV and/or high-flow oxygen (HFO) therapy, at least one time during patients’ ICU admission. The patients’ ICU length of stay and the number of days they were admitted when their blood samples were collected were also considered clinical variables.

2.3. Serum Cytokines

Patients’ serum samples were obtained from peripheral whole blood, by centrifugation at 3000 rpm for 10 min. Serum samples were kept at −80 °C until analysis.

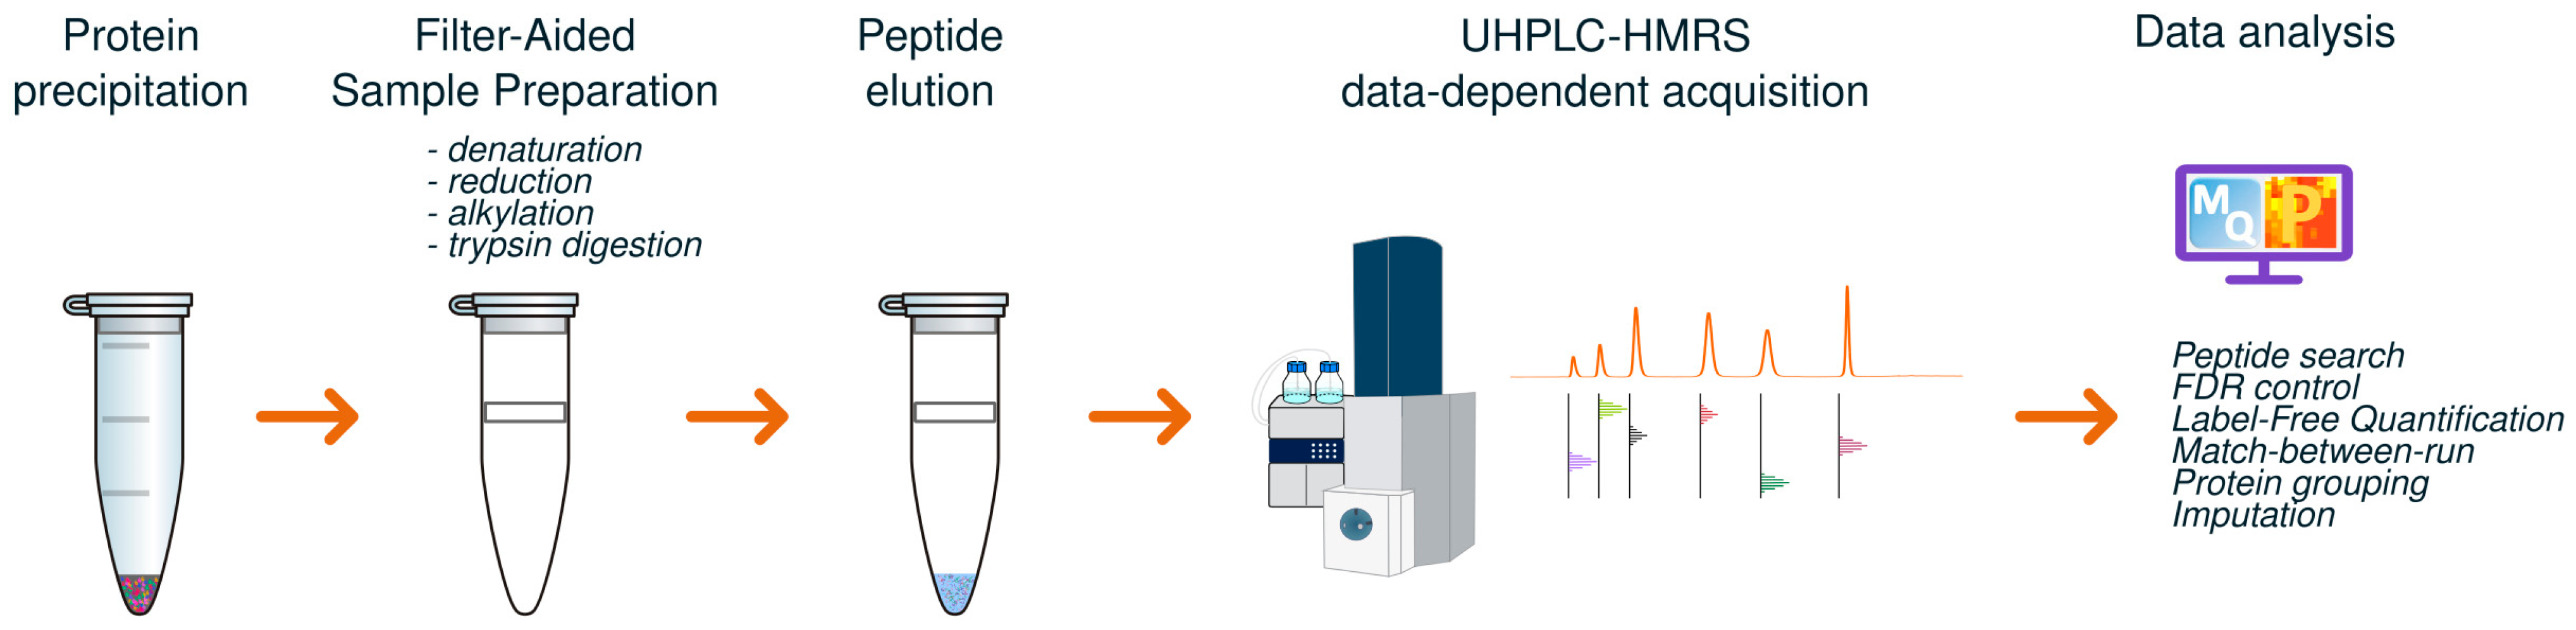
2.3.1. Filter-Assisted Sample Preparation (FASP) for Proteomics

Proteins from serum samples were precipitated from 75 μL serum aliquots by thoroughly mixing with six volumes of ice-cold acetone. The mixture was kept at −4 °C overnight, and the precipitated proteins were collected by centrifugation at 26,000× g for 30 min at 4 °C. Total serum protein in the precipitate was quantified by the Bradford method using a bovine serum albumin (BSA) calibration curve (Bio-Rad Protein Assay Dye Reagent Concentrate).
A total of 200 μg of protein was diluted to a volume of 200 μL with 100 mM Tris-HCl pH 7.8 lysis buffer supplemented with 50 mM dithiothreitol (DTT), 2% (w/v) sodium dodecyl sulfate (SDS), and protease inhibitor (cOmplete™, EDTA-free Protease Inhibitor Cocktail, Roche, Switzerland). The sample was then filtered with a regenerated cellulose centrifugal filter with a 3 kDa molecular weight cut-off (Amicon, USA) by centrifugation at 12,000× g for 30 min at 20 °C. The eluate was discarded, and the retained proteins were washed with 200 μL of an 8 M urea solution prepared in 25 mM ammonium bicarbonate.
After centrifugation at 12,000× g for 30 min at 20 °C, the retained proteins were alkylated for 20 min in the dark with 100 μL of a 50 mM iodoacetamide solution prepared in 8 M urea/25 mM ammonium bicarbonate. Samples were centrifuged at 12,000× g for 30 min at 20 °C and washed twice with 200 μL of 25 mM ammonium bicarbonate. The membranes containing the proteins were transferred to a new microtube, and 100 μL of a trypsin solution in 12.5 mM ammonium bicarbonate was added to each sample at a ratio of 1 μg of trypsin to 30 μg of total protein. Protein digestion was performed overnight (16 h) at 37 °C.
After sonification for 2 min, samples were centrifuged at 12,000× g for 30 min at 20 °C. Then, 50 μL of 3% (v/v) acetonitrile in water containing 0.1% (v/v) formic acid was added twice to the membrane to elute the remaining peptides. Eluates were stored at −80 °C until analysis.

2.3.2. UHPLC-HRMS Analysis

High-resolution mass spectrometry (HRMS) analyses were performed using an elute ultra-high performance liquid chromatography (UHPLC) system consisting of an elute UHPLC HPG 1300 pump with two pairs of serial-coupled, individually controlled linear drive pump heads, an elute autosampler, and an elute CSV column oven preheater. This system is coupled with an Impact II QqTOF mass spectrometer equipped with an electrospray ion source (Bruker Daltonics GmbH & Co., Bremen, Germany), enabling ultra-high performance liquid chromatography-high resolution mass spectrometry with electrospray ionization (UHPLC-ESI-HRMS).
Tryptic peptides were separated on a reverse-phase bioZen™ 2.6 µm Peptide XB-C18 column (100 Å, 100 mm × 2.1 mm, Phenomenex) at a constant temperature of 45 °C. The gradient elution was performed at a flow rate of 300 μL/min (mobile phase A: 0.1% (v/v) of formic acid in water; mobile phase B: 0.1% (v/v) formic acid in acetonitrile) for 0–2 min (0% B; 2–5 min, 1% B; 5–60 min, 1 to 50% B; 60–65 min, 50% B; 65–70 min, 50 to 95% B; 70–78 min, 95% B; 78–85 min, 95 to 1% B), followed by a 5 min column re-equilibration step.
After sample loading (10 μL), a simple on-line desalting step was implemented in the first 2 min of elution (0% B). Using a mass spectrometer six-port valve, the flow was sent to waste, avoiding contamination of the MS instrument. The MS acquisition parameters were set as follows: capillary voltage of 4.5 kV (ESI+), with an end plate offset of 500 V, a nebulizer pressure of 2.5 bar, a dry gas (N2) flow of 8.0 L/min, and a heater temperature of 200 °C. The tune parameters were set as follows: transfer funnel 1/2 RF power—400/600 Vpp; hexapole RF power—400 Vpp; ion energy—5.0 eV; low mass—200 m/z; collision energy—7.0 eV; pre pulse storage—5 μs, stepping—on, basic; collision RF power—200–1200 Vpp; transfer time—50–110 μs; timing—50%; and collision energy—100–120%. Spectra acquisition was performed in auto MS/MS mode with a threshold of 28 counts per 1000, a cycle time of 3.0 s with exclusion after 1 spectrum, and release after 0.50 min. All acquisitions were performed with an m/z range from 150 to 2200 and a 2 Hz spectra rate.
An in-line initial calibration segment was included in each run to ensure mass calibration, using the ESI-L Low Concentration Tuning-Mix (Agilent, Santa Clara, CA, USA) in enhanced quadratic calibration (EQC) mode. Internal calibration for each run was performed against the initial calibration segment in EQC mode, with a search range of ±0.1 ppm relative to each expected ion m/z and with a standard deviation below 0.1 ppm for the set of identified ions with an intensity threshold of 1000. The same calibrant was also used for an initial off-line spectrometer calibration by direct infusion at 200 μL/h, in EQC mode with a ±0.001% zooming window and ensuring a score above 99.95% and a standard deviation between 0.02 and 0.08 ppm.
After every 20 injections, a bovine serum albumin tryptic digest was analyzed to monitor retention time variation and base peak chromatogram peak intensity. These were maintained below 10 s and 10%, respectively, across all runs to ensure the consistency of the analyses.

2.3.3. Data Processing

The acquired raw data files were processed with the MaxQuant software v. 2.0.3.0 [11,12] using the internal search engine the Andromeda [13] and Uniprot [14] databases, restricted to specific protein sequences from Homo sapiens (Proteome UP000005640). To develop a comprehensive immune response profile, a selected number of cytokines was focused. This selection aimed to cover a broad spectrum of immune mediators, including pro-inflammatory and anti-inflammatory cytokines, chemokines, and growth factors particularly relevant to COVID-19 pathophysiology and immune responses, potentially enhancing the sensitivity for specific targets. Consequently, protein sequences were retrieved for pro-inflammatory cytokines (gene id) GM-CSF (CSF2), IFN-α (IFNA1), IL-1α (IL1A), IL-1β (IL1Β), IL-6 (IL6), IL-15 (IL-15), and TNF-α (TNF); anti-inflammatory cytokines (gene id) IL-1RA (IL1RN), IL-10 (IL10), and IL-13 (IL13); cytokines (gene id) IFN-β (IFNB), IFN-γ (IFNG), IL-2R (IL2RA), IL-7 (IL7), and IL-8 (CXCL8); chemokines (gene id) eotaxin (CCL11), IP-10 (CXCL10), MIG (CXCL9), MIP-1α (CCL3), MIP-1β (CCL4), and RANTES (CCL5); and growth factors (gene id) VEGF (VEGF), HGF (HGF), and EGF (EGF). PARK7 (Uniprot ID Q99497), one of the proteins with lowest variability in abundance among different human cell types, was used as an internal control for data analysis due to its stable expression, low cell-type specificity, and consistent detection in a wide range of tissues [15,16]. This was crucial considering the diverse range of cytokines that were analyzed, as it ensures that internal control remained unaffected by biological variations, thereby supporting accurate and reproducible results. Furthermore, PARK7 exhibited an average log2 (label-free quantification (LFQ)) across all samples of 14.56 ± 0.07 (0.5% standard deviation), reflecting minimal variability and thereby supporting its reliability as a reference point.
Methionine oxidation (+15.9949 Da), protein N-terminal acetylation (+42.0106 Da), as well as phosphorylation of serine, threonine, and tyrosine (+80.973607 Da), were defined as variable modifications, and cysteine carbamidomethylation (+57.0215 Da) was set as a fixed modification. A Q-TOF was used with default parameters (Bruker, Germany). Enzyme specificity was set to trypsin/P, allowing cleavages at the carboxyl side of arginine and lysine residues and before proline residues, with a maximum of two missed cleavages allowed. The false discovery rate for peptides and proteins was set to 1%. The minimum score for acceptance of MS/MS identification was set to 10 for unmodified peptides and 40 for modified peptides. A minimum of three razor or unique peptides was required for protein group identification, with a minimum sequence coverage of 25% and a minimum total score of 10. Match between runs was enabled with a 0.7 min match time window and a 20 min alignment window. Dependent peptides were enabled with a fold discovery rate of 1%. Normalized spectral protein LFQ intensities were calculated using the MaxLFQ algorithm [17], with a minimum ratio count of 1. MaxLFQ is a label-free intensity determination and normalization procedure that enables comparative proteomics studies to identify changes in protein expression levels across experimental conditions. This approach accounts for variability in sample preparation and fractionation; it relies only on common peptides between samples to avoid losing data due to missing intensities and assumes that most proteins remain unchanged between samples, eliminating the need for housekeeping proteins. As a result, MaxLFQ achieves high precision through global optimization and median-based calculations, handles incomplete datasets effectively, and accurately quantifies fold changes across several orders of magnitude [17].
MaxQuant output data were processed using Perseus v1.6.15.0 with default settings [18]. After filtering out proteins classified as only by site, contaminants, and reverse hits, group LFQ intensities (LFQ intensities of proteins aggregated across all replicates within a specific experimental group) were log-2-transformed, and the quantitative profiles were filtered from missing values with a minimum valid number of (number of replicates/2) + 1 in at least one group. Missing values in the MaxQuant output (below the DDA intensity thresholds of 300 for MS1 and 200 for MS2) were imputed from a random sampling of the Gaussian distribution with mean 1.8 standard deviations less than the population mean of all unimputed measurements and within ±0.3 standard deviations from this mean, as per the previously determined ideal parameters for LFQ based studies [19]. This imputation strategy aligns with the expected behavior of missing values in LFQ experiments, where missing data typically represent low-abundance proteins or peptides below the detection limit. By sampling from a Gaussian distribution centered 1.8 standard deviations below the mean, the imputed values reflected data variability and accounted for lower-intensity missing values. The ±0.3 standard deviation range ensured that the imputed values remained within a realistic intensity range, preventing unrealistic outliers. This method, informed by empirical studies that identified this as an effective estimate for missing LFQ data, preserved the overall data distribution and minimized biases from missing data [19].
Log ratios were calculated as the difference in average log 2 LFQ intensity values between the tested conditions. Inter-group changes were evaluated by a two-tails Student’s t test at a significance of 0.05 using a permutation-based False Discovery Rate (FDR) control. This is a robust non-parametric method for controlling FDR that adapts well to datasets with small sample sizes or complex variance structures. By using an FDR threshold (e.g., 5%), permutation-based control ensured that the proportion of false positives among significant findings remained low, providing reliable results for biological interpretation.
An average of 170,548 peptides were identified per sample (ranging from 131,780 to 249,508), with 4292 unique peptides common to all samples. The quality of the LC, MS, and data analysis was controlled a posteriori by analyzing the retention time, chromatographic peak width, precursor charge, mass precision, abundance, missed cleavages, and peptide identification per group, across all identified peptides (Figure S1; see Supporting Information). Identified protein groups are listed in Supplementary File S1 (see Supporting Information).
A schematic overview of the methodology presented in Section 2.3.1, Section 2.3.2 and Section 2.3.3 is presented in Figure 2, illustrating the sequential steps of the experimental workflow. The process began with protein precipitation from patient serum samples, followed by downstream processing and resulting in the analysis of the acquired data.

2.4. Routine Blood Analyses

Patients’ complete blood counts and blood biochemistry results were obtained from the hospital’s electronic medical record system. These data were retrieved individually for each patient, ensuring they corresponded to the same day the blood samples for cytokine analysis were collected, thereby minimizing discrepancies regarding patients’ pathophysiological states. The lower and/ or upper reference values for each variable were based on the hospital’s directives.
Daily maximum or minimum results were obtained for each of the selected variables to obtain a single measure per patient. Minimum results were retrieved for eosinophil, lymphocyte, RBCs, and platelet counts, whereas maximum results were obtained for neutrophil counts, procalcitonin, LDH, ferritin, fibrinogen, CRP, D-dimers, hs-cTn I, and creatinine. At this stage, four routine blood analyses—procalcitonin, ferritin, fibrinogen, and hs-cTn I—were excluded due to excessive missing values (over 20% of the total sample). Except for LDH, D-dimers, and eosinophil counts, which had less than 20% missing values, all other variables were complete, with no missing data.

2.5. Statistical Analysis

Categorical data were given as absolute frequencies and percentages. Shapiro-Wilk test was used to examine the normality of continuous variables, and because they were presented with deviations from normality and asymmetric distributions, they were expressed by their medians and interquartile ranges (IQRs).
For the univariate analysis, to make comparisons between two independent groups, non-parametric chi-square ( χ 2 ) or Fisher’s exact test (if the applicability conditions of the first test were not verified) were used for categorical variables. Given that normality was not verified for continuous variables, the Mann-Whitney U test was applied for comparisons between the two groups.
Concerning the multivariate data analysis, for data exploration and visualization, t-Distributed Stochastic Neighbor Embedding (t-SNE), a non-linear and unsupervised method, was applied. This method preserves the essential structure of the data, enabling assumptions on how data are arranged and facilitating the identification of clusters, e.g., patient groups based on their blood analyses results or cytokine profiles [20]. Naïve Bayes, a probability classification algorithm, was used to build the prediction models independently for each set of groups that were compared (A vs. B, B vs. C, and A + B vs. C). Described as one of the most effective and efficient classification algorithms, Naïve Bayes is based on the concept of conditional probability as defined by the Bayes’ theorem [21]. Despite its strong independence assumptions, the algorithm has shown superior performance in applications such as medical diagnosis [21], even when these assumptions are not fully met [22]. Additionally, its applicability in small-sized datasets has been evidenced [23], making it suitable for the present study. Other methods for binary classification offer their own advantages and limitations. For instance, logistic regression usually requires larger datasets for training, assumes linear relationships between independent variables, and is particularly sensitive to outliers. Support Vector Machines (SVMs), while often delivering high performance in models based on clinical data, can be more challenging to implement due to the need to tune multiple hyperparameters. Additionally, SVMs are more susceptible to the influence of outliers, especially when working with small datasets [24].
Prediction models were initially built using all available features from each dataset, namely all 25 cytokines, nine routine blood analyses results, and a combination of these 34 features (hybrid models). Then, the 10 most relevant features from each dataset were selected using an information gain algorithm, a rank based method that measures the reduction in uncertainty or entropy regarding a certain target variable when the added value of a certain feature is known [25]. This makes the algorithm useful for feature selection, as it identifies the most important features for predicting the target (in this case, the need for IMV and mortality in the ICU). These should enhance the model’s performance, providing meaningful information gain and reducing the uncertainty of predictions [26]. In this study, we chose to select the top 10 features, reducing datasets from either 34 or 25 to 10 features (for routine blood analyses all 9 features were used). Given the small dataset, this approach aimed to reduce redundancy in feature selection and overfitting while improving interpretability. Hence, by selecting smaller, more relevant data subsets, the complexity of the data could still be captured effectively without incorporating features with low information gain that would not enhance model performance [26,27]. While there is no fixed cutoff for information gain values, thresholds around 0.05 are often used to exclude features with minimal predictive contributions. Hence, we applied a cutoff of 0.01, considering our small dataset, to minimize the risk of prematurely excluding variables that collectively could contribute to the model’s performance [28]. Based on the 10 feature subsets selected by the algorithm, new prediction models were generated by sequentially removing features with the least information gain. Prediction models including the most relevant variables, as highlighted in the univariate analysis, were also developed for comparative reasons.
To assess the model’s performance, a random sampling approach was applied, with 80% of the samples being used for training and 20% for independent validation. This process was repeated 10 times to ensure more reliable performance estimates by averaging the results across different splits. The average model performance was assessed using the area under the receiver operating characteristics (AUC), classification accuracy, precision, recall (R), and specificity (Sp). Finally, the Friedman test was used to compare the predictive abilities of different models across the three main datasets (cytokines, routine blood analyses, and hybrid data), with Bonferroni correction being applied for multiple comparisons.
Descriptive and inferential statistics, as well as graphic representations of data, were achieved using IBM SPSS Statistics software, version 29 (IBM Corp., Armonk, NY, USA) and RStudio, version 2022.12.0 (PBC, Boston, MA, USA). Statistical significance was set for two-sided p values of less than 0.05 (with some exceptions where the statistical significance was set for 0.10). Multivariate analyses were performed using Orange, version 3.35.0 (University of Ljubljana, Slovenia).

3. Results and Discussion

The 24 male patients admitted to the ICU with COVID-19 were divided into three Groups (A, B and C) with 8 patients each, and the following comparisons were conducted:
  • Group A vs. B. This comparison reflects patients’ severity based on the need for IMV, highlighting the progression in severity from Group A (milder condition, without IMV) to Group B (patients requiring IMV).
  • Group B vs. C. This comparison focuses on mortality in the ICU among patients requiring IMV. It distinguishes patients who survived (Group B) from those who died in the ICU in an average of 7 days after the current analysis (Group C), thereby isolating factors associated to mortality in the ICU.
  • Group A + B vs. C. This analysis is similar to the previous one, except it combined Groups A and B (including both non-IMV and IMV patients), and compared them to Group C, providing a broader control group that included a higher diversity of patients.
When performing the aforementioned comparisons (Table 1), aside from the target variables, i.e., IMV and mortality, there were no statistically significant differences in the demographic and clinical data between patient groups. However, there were exceptions for patients from Group A that spent significantly less time in the ICU (p = 0.002) and required more HFO (p = 0.007) instead of IMV.

3.1. Univariate Data Analysis

Univariate data analysis was conducted for both the serum cytokines, and blood analyses were conducted routinely during ICU admission.

3.1.1. Cytokines

Serum cytokines were compared among groups (Table 2). At a 5% significance level, significant differences were only observed between deceased patients (Group C) and all discharged patients (Groups A and B). Deceased patients exhibited significantly lower levels of IFN-γ (p = 0.019), IL-2R (p = 0.016) and VEGF (p = 0.038) compared to the discharged patients (Figure 3a–c). Interestingly, at a 10% significance level, three additional cytokines displayed significant differences among groups. Specifically, IFN-β was significantly lower (p = 0.081) in deceased patients (Group C) compared to discharged patients (Groups A and B) (Figure 3d). Furthermore, VEGF showed a significant decrease in deceased patients (Group C) compared to discharged patients in Group B (p = 0.083) (Figure 3e). Additionally, within discharged patients, IL-1RN was significantly higher in those under IMV (Group B) compared to those who did not require IMV (Group A) (p = 0.050) (Figure 3f). VEGF was the sole biomarker associated with the prognosis of mortality in both comparisons, i.e., B vs. C and A plus B vs. C.
The decreased IFN-β and IFN-γ as disease severity increased (i.e., from Group A through Group C) was in line with the findings of other authors. Severe cases of SARS-CoV-2 infection have been associated with compromised interferon type I responses, essential for antiviral immunity, characterized by decreased levels of IFN-α and even more reduced IFN-β [29]. Other reports have described lower levels of IFN-β in severe COVID-19 cases compared to milder ones and healthy controls [29,30]. Regarding IFN-γ, besides being reported that the levels of this cytokine are elevated for SARS-CoV-2 infected patients, they are lower for those in severe conditions due to the fact that CD4+ and CD8+ T cells are primarily affected by the virus [31]. This could explain the worse condition of patients with lower levels of this cytokine, considering that IFN-γ plays a fundamental role in the recognition and elimination of pathogens, e.g., macrophage activation in both innate and adaptive immune responses [32,33]. The lower IL-2R levels from patients with more severe conditions could be related to the inhibition of the IL-2 signaling pathway. IL-2, which shares a common structure with, for example, IL-7 and IL-15, is a cytokine responsible for viral inhibition that binds to the IL-2R expressed in lymphocytes to exert its actions. When this pathway is altered, for example in cases of viral infection, patients exhibit lower levels of CD8+ T cells and lymphocytes, contributing to the decline of their condition [32,34]. Regarding VEGF, although high levels have been associated with poor prognosis and death in COVID-19 patients with ARDS, and in severe sepsis [35], other studies have described decreases in VEGF levels in patients presenting with hypoxia when IMV has an early onset [36]. It is also important to note that VEGF plasma changes may not reflect local changes of the biomarker, as VEGF plasma can be sequestered by tissues, since most VEGF isoforms can bind to heparin [35]. Thus, in this case, further research is needed to understand the relation of this biomarker with disease severity.
IL-1RN was the sole biomarker that differed between ventilated and non-ventilated patients. In fact, high levels of this cytokine have been associated to respiratory failure, including in COVID-19 patients [37]. Thus, the higher probability of respiratory failure could be further linked to the need for IMV.

3.1.2. Routine Blood Analyses

From the blood analyses conducted routinely on patients admitted to the ICU, the following were considered: leukocyte profiles (neutrophils, eosinophils and lymphocytes); RBCs and ferritin; markers of the coagulation system, i.e., platelets, fibrinogen, and D-dimers; markers of the inflammatory process, i.e., procalcitonin and CRP; a general marker of tissue damage, i.e., the intracellular enzyme LDH; a marker of kidney function, i.e., creatinine; and a marker of myocardial damage, i.e., hs-cTn I.
Among surviving patients, the ones requiring IVM (Group B) presented significantly higher CRP (p = 0.028) and significantly lower RBCs (p = 0.028) in comparison to less severely ill patients, i.e., patients not requiring IMV (Group A) (Table 3). Accordingly, CRP, a known marker of systemic inflammation, has been independently associated with respiratory impairment, need for IMV in patients with acute respiratory distress syndrome, and lower mortality [38,39]. It was observed that deceased patients (Group C) presented significantly lower RBCs in comparison to all discharged patients (Groups A + B) (p = 0.028). These results could be linked to the fact that, when infected by SARS-CoV-2, RBCs are affected by the virus and the complex inflammatory process that results from the disease, altering their function and capacity for oxygen transportation and contributing to the development of hypoxia [40,41] and the need for IMV [40]. Lymphocyte counts were solely below normality cutoffs for deceased patients (Group C), being significantly decreased when compared to those from Group B (p = 0.015) and from Group A + B (p = 0.003). This is in accordance with studies that considered lymphopenia as a marker of disease severity and mortality [42], including in COVID-19 patients [43]. Notably, interferences that occur in the IL-2/IL-2R pathway due to SARS-CoV-2 infection lead to lower levels of lymphocytes, especially in critical COVID-19 patients [32].
The levels of hs-cTn I were way above normality cutoffs for deceased patients, leading to significant difference when compared to those from Group A (p = 0.026) and Group A + B (p = 0.037). This may be associated to myocardial ischemia/injury (recognized as one of the leading causes of death in SARS-CoV-2 infected patients), which is a result from the hyperinflammatory state triggered by the cytokine storm, subsequently causing vascular inflammation and hypercoagulability [44,45].
Regarding the remaining biomarkers, neutrophil counts, procalcitonin, and LDH were above normality cutoffs for all groups, despite not demonstrating significant differences among them. As in any viral infection, neutrophil levels tend to increase, even leading to neutrophilia, as described for COVID-19 [46]. On the other hand, in the same context, procalcitonin production can be downregulated by mediators like IFN-γ. However, the current patients presented high levels of this biomarker, whose production can be stimulated by TNF-α and IL-6 [47]. LDH, besides being considered an independent predictor of myocardial injury, is also associated with disease severity in COVID-19. Its increases have been related to multiorgan dysfunction, with systemic inflammation and tissue damage/necrosis [48]. Biomarkers related to the coagulation process were not significantly different among groups, although the ferritin, fibrinogen and D-dimer results were above normality cutoffs, a finding which has been systematically reported in COVID-19 patients [49]. High levels of ferritin may be related to the impact of SARS-CoV-2 on hemoglobin, resulting in the release of iron into the bloodstream. This can contribute to complications such as impaired oxygen binding and oxidative damage to organs. Additionally, the excess of iron, stored in proteins like ferritin, increases the blood’s viscosity, contributing to thrombotic mechanisms and increasing the risk of mortality [50,51]. Another marker of increased coagulation activity is high D-dimer levels, helping in the diagnosis of thrombosis and disseminated intravascular coagulation. As reported by other researchers, D-dimer levels above 2 mg/L can be used as mortality indicators with 92% sensitivity and 83% of specificity in COVID-19 [52]. In the context of a viral infection, fibrinogen levels also tend to increase, for example due to the secondary effects of the imposed cytokine storm, which contributes to a hypercoagulable state in patients [53].

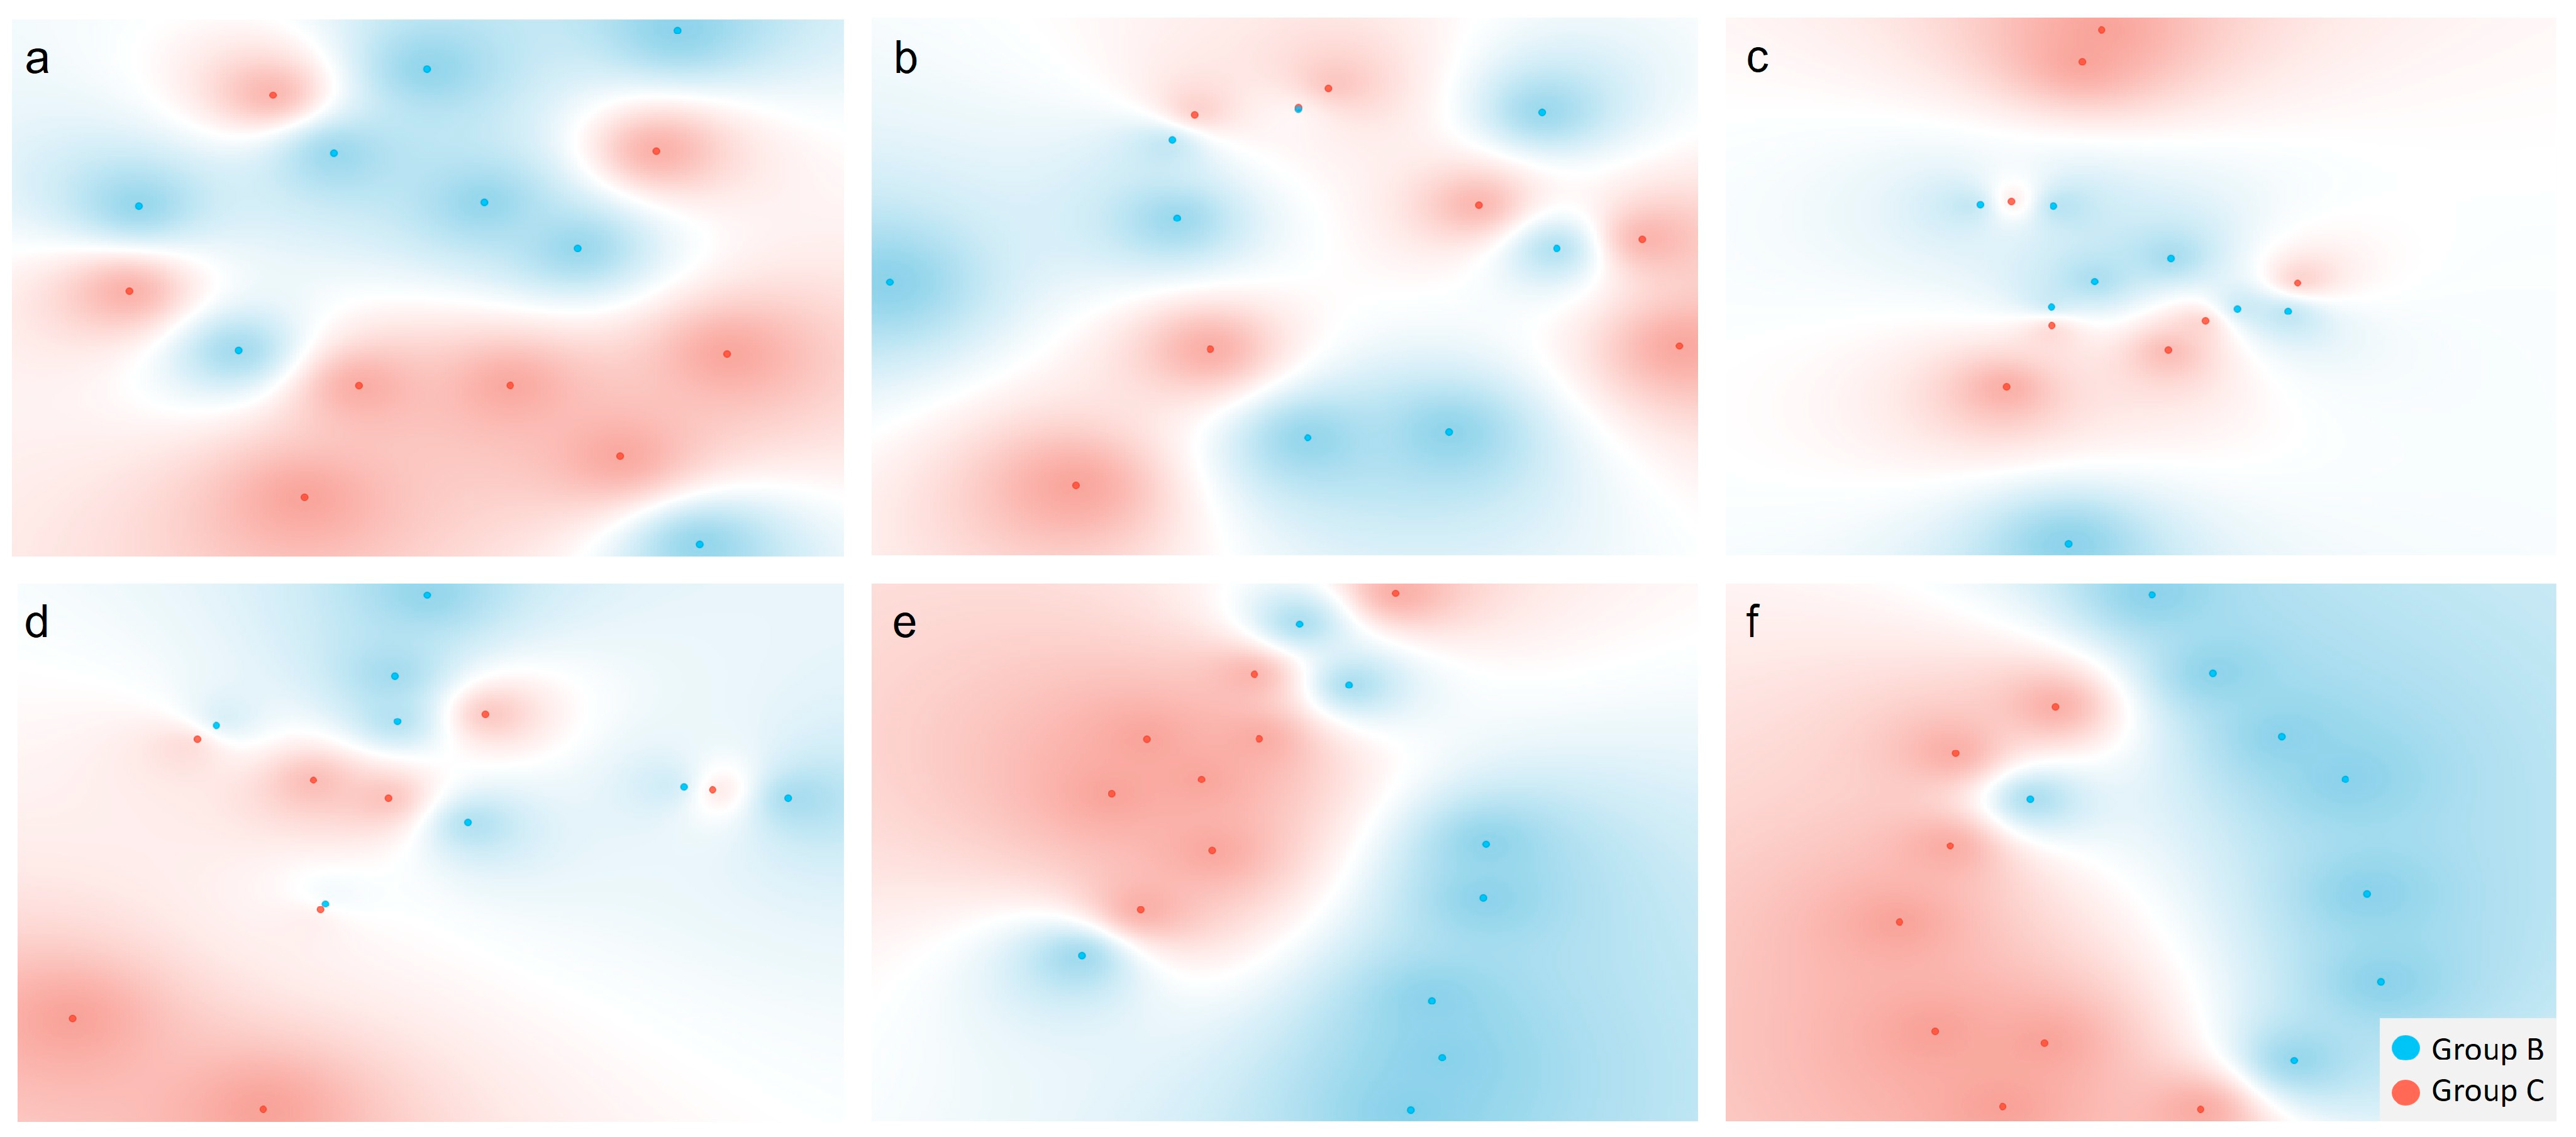
3.2. Multivariate Data Analysis

An initial unsupervised t-SNE analysis was performed with the three datasets, i.e., 25 serum cytokines, nine routine blood analyses, and hybrid data combining cytokines and routine blood analyses (34 features) to evaluate potential data patterns. Then, supervised Naïve Bayes models were built based on these three datasets and subsequently optimized by selecting different feature subsets.

3.2.1. Comparisons Between Groups A and B

Based on all the three datasets, t-SNE plots showed data patterns according to the separation of samples between Groups A and B (Figure 4a–c). This indicates that the used data could potentially be associated with disease severity in the ICU, and in this case, with the need for IMV in Group B. Interestingly, a better separation among groups was achieved when considering all 34 features (Figure 4c). Despite this apparent separation between samples of Groups A and B, the developed Naïve Bayes models with the entire datasets presented poor performance, with AUCs lower than 0.588, independently of being based only on the cytokine results, the routine blood analyses, or both (Table 4).
To improve the performance of these predictive models, an information gain algorithm was implemented to determine the 10 features that contributed most to predicting the outcome. New models were then developed by sequentially removing features with the least information gain. This strategy resulted in much better models (Table 4). For example, a very good model was obtained with the following six cytokines: IL-1RN, CXCL10, CCL3, CXCL9, IL-7, HGF (AUC = 0.810; R = 0.750; Sp = 0.750). IL-1RN was the only cytokine previously indicated by the univariate data analysis as being significantly higher in more severe patients, despite the low significance (p = 0.050). Indeed, the predictive model based only on IL-1RN showed poor prediction performance (AUC = 0.605). This result highlights the relevance of considering a cytokine profile and multivariate data analysis to determine the cytokine subsets that can provide the best predictive models for patient disease severity. The fact that, when evaluating isolated cytokines, no significant differences were observed between Groups A and B, but good predictive models were achieved when considering a set of cytokines, was most probably related to the high variability of the population and the complex inflammatory processes involved in heterogenous critically ill patients.
The same methodology was implemented for the nine routine blood analyses. Again, it was possible to improve the model’s performance; in this case, the AUC increased from 0.396 when considering the nine features to 0.647 when considering the following three features: LDH, RBCs, CRP. Both CRP and RBCs were significantly different between Groups A and B in the univariate analysis (both p < 0.050), but not LDH. Despite this model improvement when using a smaller group of routine blood analyses, the one based on six cytokines resulted in better performance (AUC of 0.647 for routine blood analyses, versus 0.810 for cytokines), again highlighting the relevance of cytokines in predicting disease severity.
The best model based on hybrid data combined the previous best subsets of six cytokines and three routine blood analyses, achieving an AUC of 0.891, with both recall and specificity of 0.850. Therefore, it is possible to conclude that models including cytokines consistently outperformed those relying solely on subsets of routine blood analyses (p = 0.007 when comparing models with routine blood analyses subsets to models including only cytokines, and p = 0.003 when comparing to hybrid models) (Table 5).
When looking at the t-SNE plots using the feature subsets that led to the best Naïve Bayes models, one can observe better cluster formation (Figure 4d–f) in comparison to when all features of each dataset were used (Figure 4a–c). Similarly to the Naïve Bayes models, the best results were also observed when using a feature subset from the hybrid model (Figure 4f). These results show that t-SNE could be a good qualitative tool for preliminary evaluations of this type of data.
Overall, our results were comparable to other predictive models regarding the need for IMV. For example, Patel et al. achieved an AUC of 0.820 for predicting the need for IMV, based on CRP, procalcitonin, D-dimers, respiratory rate and blood oxygen saturation [54]. Osawa et al. achieved an AUC of 0.860 in a model that included the following features: gender, age, obesity, time from symptom onset to hospital admission, blood oxygen saturation, CRP, neutrophil-to-lymphocyte ratio and LDH results at hospital admission [55]. Other researchers developed a risk score known as Ventilation in COVID Estimator (VICE), which integrates key variables—diabetes, CRP, LDH and the ratio between the partial pressure of oxygen in arterial blood and the fraction of inspiratory oxygen concentration. This score demonstrated strong predictive performance for the need for IMV, achieving an AUC of 0.840 [56]. Despite significant advances when it comes to identifying specific sets of variables for predicting the need for IMV, these models included both hospitalized and ICU patients, limiting their applicability as ICU-specific tools. Furthermore, as we demonstrated above, including serum cytokines into the prediction models significantly increased their performance (p = 0.001). These cytokines, selected for their well-established roles in inflammation and disease severity, represent critical components of the immune response, as highlighted in Section 3.1.1. Therefore, focusing on cytokine-based models specifically for ICU patients could offer a more precise and effective approach for predicting the need for IMV, considering the complexity of these patients’ condition in comparison to others that did not require intensive care.

3.2.2. Comparisons Between Groups B and C

When examining the t-SNE plots based on the three datasets (Figure 5a–c), some separation between the two groups was observed, especially when considering all 25 cytokines (Figure 5a). This highlights once again the relevance of cytokines in predicting patient outcomes, in this case, mortality. Despite this, and as observed in the previous section, all three Naïve Bayes models based on entire datasets (25 cytokines, nine routine blood analyses results, and the 34 features together) showed very poor performance (AUC < 0.445; Table 6).
In comparison to what was reported in the previous section, when resorting to the information gain algorithm to select the most informative features, much better predictive models were achieved. The best models reached AUCs of at least 0.708 (Table 6). A reasonable model was developed using two cytokines, HGF and IL-10 (AUC = 0.772; R = 0.775; Sp = 0.775), while a slightly less effective model was developed based on lymphocyte counts alone (AUC = 0.708; R = 0.725; Sp = 0.725). An even greater AUC was achieved with hybrid data, incorporating lymphocyte counts, IL-2R, and HGF (AUC = 0.774). While it may appear that models solely relying on lymphocyte counts and those incorporating cytokine profiles exhibited similar predictive performance, additional statistical analyses (Table 7) revealed that the achieved hybrid models demonstrated a significant improvement in performance compared to those including solely routine blood analyses (p < 0.001). This demonstrates that while lymphocyte counts are strong predictors of patient outcomes, as supported by other authors [43,57,58], incorporating serum cytokine profiles and routine blood analyses significantly improves both the accuracy and robustness of predictions. These hybrid models provide a better reflection of the underlying biological mechanisms influencing patients’ conditions, which may not be fully captured by lymphocyte counts alone. Several studies have accounted for the limitations of using lymphocytes as the sole predictor of mortality in ICU COVID-19 patients, highlighting the importance of a more comprehensive, multifactorial approach [59,60,61].
Another interesting observation was that these predictive models identified lymphocyte counts as relevant, in accordance with the previously univariate data analysis, where lymphocytes were significantly lower for patients that died in the ICU (p = 0.015). In contrast, the cytokines included in the best predictive models were not highlighted as significantly different among groups in the univariate analysis. For example, the VEGF, that was actually significantly different between Groups B and C (p = 0.083), was not included in the best predictive models. In fact, the model obtained using exclusively this cytokine showed poor performance (AUC = 0.541). Regarding the hybrid models including VEGF, the results improved, but most likely due to the relevance of lymphocytes (AUC = 0.636). Thus, tools like those employed in machine learning algorithms can be very useful in the selection of the best features to predict a certain phenotype.
The t-SNE plots using the best model’s features (Figure 5d–f) led to evident separations between patients from Groups B and C. The second best model for the subset including solely routine blood analyses was employed in the t-SNE plot analysis, leading to a better cluster formation (Figure 5e) than when using the entire dataset (Figure 5b). The best separation was achieved when using lymphocyte counts, IL-2R, and HGF (Figure 5f), emphasizing once again the ability of these three biomarkers to differentiate between the two groups of patients. Once more, these results highlight the potential of t-SNE as a screening technique to define precise feature subsets, considering a specific target.

3.2.3. Comparisons Between the Combined Groups A and B and Group C

The t-SNE plot using all features from each dataset did not reveal data separation according to patient groups (Figure 6a–c), in contrast to the previous sections (Figure 4a–c and Figure 5a–c). This was most probably related to the high variability of the population, where the control group (A + B) included surviving patients with and without IMV, and Group C solely included patients under IMV. Despite that, reasonable to good Naïve Bayes models were developed using each of the three datasets (AUCs > 0.717) (Table 8).
The models built using feature subsets showed some improvement in predictive performance. For example, the subset including only five cytokines—CXCL9, IFN-γ, VEGF, IL-2R, and IL-1RN—achieved an AUC of 0.768, compared to 0.717 when using the entire dataset. Univariate data analysis had previously identified IFN-γ, VEGF, and IL-2R as significantly different between the Groups A + B and C. However, models based solely on cytokines identified through univariate analysis demonstrated poorer results (AUCs < 0.675). CXCL9 and IL-1RN were classified as important features through the information gain algorithm, not only within the cytokine dataset but also within the hybrid dataset. For instance, a hybrid model incorporating lymphocytes, CXCL9, RBCs, IFN-γ, VEGF, IL-2R, and IL-1RN achieved an AUC of 0.885. Interestingly, both CXCL9 and IL-1RN had been previously included in the best prediction models when comparing Groups A and B (see Table 4).
As mentioned in Section 3.1.1, IL-1RN has been shown to be significantly elevated in COVID-19 patients with respiratory failure admitted to the ICU. A study by Jørgensen et al. explored this association using ROC analysis, reporting an AUC of 0.737 [37]. Although multivariate analysis was not performed, the authors concluded that the increase in IL-1RN levels, along with elevations in other cytokines, may reflect systemic cytokine activation in patients with respiratory failure, culminating in pulmonary dysfunction and the need for IMV [37]. Supporting this observation, Anderberg et al. identified IL-1RN as one of the cytokines that is most strongly correlated with respiratory failure (r > 0.700, p < 0.001) [62]. This finding highlights its role in the innate immune response, particularly in immune cell infiltration into infected tissues, further underscoring IL-1RN’s contribution to the immunopathology associated with severe COVID-19 and respiratory dysfunction [62]. When it comes to CXCL9, it has been associated with disease severity and mortality in COVID-19. Medeiros et al. reported that CXCL9 was significantly increased in non-surviving patients at ICU admission and revealed adequate performance in predicting mortality (AUC: 0.737, 95%CI 0.609–0.865) [63]. Furthermore, a multivariate logistic regression model was developed that included age, weight, IL-10, CCL2, CCL5, CXCL10, and CXCL9, with internal validation yielding an AUC of 0.838 (p = 0.244) [63]. While the cited studies highlight the potential of IL-1RN and CXCL9 in respectively predicting disease severity and the need for IMV and patient outcomes, their focus was predominantly on cytokine profiles, with some lacking multivariable models. Furthermore, few studies have examined an extensive panel of cytokines specifically in ICU patients or integrated routine blood analyses into their models. By employing hybrid models, our methodology provides a more comprehensive representation of the underlying biological mechanisms, offering insights that may not be fully captured through single-variable analyses—especially in the highly heterogeneous ICU population.
Interestingly, the model predicting mortality based solely on lymphocytes and RBCs demonstrated the best performance (AUC = 0.887, R = 0.820; Sp = 0.847), exhibiting slightly better results than the hybrid model that also incorporated CXCL9 (AUC = 0.875, R = 0.780; Sp = 0.837), though the difference was not statistically significant (p = 0.716). Just like when comparing Groups B and C, lymphocyte and RBC counts once again had a significant impact on model performance. This aligns with the univariate analysis, which had already identified these variables as significant predictors. As a result, models based solely on lymphocytes and RBCs achieved solid predictive performance (AUCs of 0.743 and 0.813, respectively). Furthermore, hybrid models (p < 0.001) and those based solely on routine blood analyses (p = 0.029) significantly outperformed models based solely on cytokines (Table 9). The poorer performance of models relying solely on cytokines likely resulted from the high variability in cytokine levels within the mixed group (A + B), which included patients in different clinical statuses, thereby reducing their reliability in predicting patient outcomes. On the other hand, lymphocyte and RBC counts, being more stable and reflective of broader physiological states [64], were less affected by this variability, leading to better predictive accuracy, even when included in hybrid models. These findings highlight once again the value of hybrid models and their capacity to better reflect patients’ conditions, even in heterogenous populations.
Employing the best variables from the best Naïve Bayes models in the t-SNE analysis led to notable improvements in the separation of data according to patient groups (Figure 6d–f). In these instances, the control Group (A + B) exhibited greater dispersion in the score plot, which could be attributed to its high heterogeneity, since it included both patients with and without IMV, in contrast to Group C that included only patients under IMV.

3.2.4. Comparisons Between Predictive Models

Considering all cytokines included in reasonable models from Table 4, Table 6 and Table 8, across the three comparisons, i.e., A vs. B, B vs. C, and A plus B vs. C, we attempted to establish cytokine sets exclusively associated with the outcomes “need for IMV” and “mortality in the ICU”. Notably, CCL3 and IL-1α were exclusive to models predicting the need for IMV (A vs. B). This is consistent with previous studies reporting a negative correlation between CCL3 levels and lung compliance [65], as well as elevated IL-1α levels in patients undergoing IMV [66]. Regarding the best models for predicting mortality in the ICU (B vs. C and A plus B vs. C), the cytokines exclusively included in these models were IL-10, IL-2R, and VEGF. Unlike IL-10, the association of IL-2R [67] and VEGF with COVID-19 severity and other diseases [35,36,68] has already been highlighted in the univariate analysis section. According to other authors, IL-10 levels have shown a positive correlation with the lung-injury Murray score in patients with severe respiratory failure due to acute respiratory distress syndrome [69], as well as in-hospital mortality [70]. These findings further underscore the relevance of these cytokines in stratifying risks for critical COVID-19 outcomes.
Across all three comparisons, CXCL9 and CXCL10 were consistently included in some of the best models. Both belong to the CXC chemokine family and are often described as interferon inducible chemokines. CXCL9 participates in leukocyte chemotaxis, promoting their differentiation and proliferation, and facilitating tissue extravasation. Meanwhile, CXCL10 acts as an inflammatory mediator, attracting immune cells such as T cells, eosinophils, natural killer cells, and monocytes/macrophages to sites of infection and injury [63,71]. Different studies have demonstrated that both CXCL9 and CXCL10 are elevated in non-survivor COVID-19 patients, with their levels increasing with severity [63]. Notably, CXCL10 has been specifically associated with severe acute respiratory syndrome [63], which may explain why it was exclusively retained in the best models for predicting the need for IMV.
Interestingly, most predictive models did not incorporate IL-6, a potent pro-inflammatory cytokine implicated in the cytokine storm and linked to unfavorable outcomes in severe COVID-19 cases [72]. One potential explanation is that our models focused exclusively on critically ill patients, all admitted to the ICU. In this population, cytokine profiles may be influenced by a range of factors beyond just IL-6, potentially reducing its predictive value. Alternatively, other cytokines that remained in the best models may have shown stronger associations with the specific clinical endpoints considered for these models.
Regarding model performance, Table 10 displays the best performing prediction models considering the three comparisons among groups and the three datasets. Based on different subsets of serum cytokines, it was possible to develop good predictive models (AUCs between 0.768 and 0.810) for IMV need and mortality in the ICU, highlighting the relevance of cytokines in disease progression among critically ill patients. When comparing Groups A vs. B and B vs. C, models based on cytokine sets consistently demonstrated superior predictive performances compared to those based solely on routine blood analyses. However, this difference was statistically significant only in the A vs. B comparison. In contrast, models relying on routine blood analyses showed significantly lower predictive performance in both comparisons when measured against hybrid models, as demonstrated in the previous sections. This is in accordance with a retrospective cohort study that highlighted the limited predictive capability of models based exclusively on routine blood analyses [73].
Indeed, in the present study, hybrid models showed good performance. Even in cases where hybrid models did not outperform the best models, based either on cytokines or routine blood analyses alone, the differences were not statistically significant. When comparing Groups A plus B to Group C, models based solely on cytokines demonstrated the poorest performance, likely due to the high heterogeneity within the control group. This group included patients both with and without IMV and those who died requiring IMV. Hence, the variability in cytokine levels across these subgroups may have diluted the predictive power of the models relying solely on these biomarkers. This further highlights the value of hybrid models which integrate multiple data types to better capture the complex physiological and clinical variations among patients at the ICU, ultimately leading to more accurate predictions.
Hence, our findings underscore the need for further comprehensive modelling approaches based on different biomarker sets, particularly in heterogeneous populations. While our analysis provides a valuable framework for predictive modeling, particularly in the ICU context, where these kinds of approaches are more restricted, some limitations must be addressed. Our goal was to develop predictive models based on a small number of variables to ensure their practical applicability in ICUs and to complement existing scoring systems. Despite the promising results, it is relevant to highlight the small dimension of the studied population (24 patients, equally distributed among three groups) and the fact that only male patients were included, limiting the generalizability of our findings to broader populations. Therefore, future studies involving larger and more diverse ICU cohorts are essential, not only for improving generalizability but also for performing external validation of our results. This is a critical step in assessing the predictive performance of these models in different clinical settings and evaluating their adaptability to varying patient characteristics and disease severities. Due to our small sample size, to minimize confounding factors, we selected patients with no significant differences in demographics, comorbidities, or other relevant characteristics between groups. However, in future studies with larger cohorts, incorporating demographic and clinical variables, such as age, sex, and comorbidities, could further refine the models’ predictive accuracy and enhance their applicability. Another key limitation was the lack of information on other treatments and concomitant infections, which restricted our ability to account for additional confounding variables. Moreover, a database of 2870 sequences covering 25 cytokines (including canonical and isoform variants) was used rather than the entire human proteome. While this approach maximized sensitivity for detecting clinically relevant inflammatory mediators, it did not explore additional proteins potentially involved in disease severity or biological processes underlying each patient’s condition. Future work should adopt a broader proteomic approach to better characterize patients’ immune responses and potentially uncover additional biomarkers. Furthermore, the depletion of high-abundance proteins such as albumin was not tested, which can overshadow low-abundance peptides. Although our FASP-based protocol, high-dynamic-range UHPLC–QTOF setup, and label-free match-between-runs MaxQuant processing partly mitigated this issue, some inflammatory mediators may still have been under-quantified. Lastly, it is also important to acknowledge the lack of validation of the obtained results considering other techniques. Using immunoassays and/or Enzyme-Linked Immunosorbent Assays (ELISA) could complement the results from UHPLC-HRMS by offering specific, sensitive, and quantifiable validation of the cytokines identified in the broader proteomic analysis. This approach could provide a more detailed and accurate understanding of the involved biomarkers.
Despite the mentioned limitations, we believe our current analysis provides a solid framework and serves as a valuable starting point for further investigation. It holds particular relevance in the ICU context, where research specifically targeting this population remains limited. With continued research and development, integrating hybrid predictive models including both cytokine profiles and routine blood analyses could offer significant benefits, enhancing early risk stratification, patient profiling, and management in ICUs. While routine blood tests provide accessible and cost-effective baseline information, cytokines profiling complements this by capturing intricate immune and inflammatory dynamics, enabling a more comprehensive understanding of patient pathophysiology. This hybrid approach could lead to more precise predictions of disease progression and treatment responses. By leveraging blood analyte information from these hybrid models, biosensors could be developed to measure these analytes, facilitating quicker decision-making in the ICU and ultimately enhancing patient outcomes. However, to achieve these benefits, it is essential to standardize cytokine assays, manage costs, and refine thresholds for clinical interpretation, as these steps are crucial for a better integration of such approaches into clinical practice.

4. Conclusions

Developing predictive models for patient severity and disease outcomes is crucial, particularly in highly dynamic and heterogeneous ICU populations. In this study, Naïve Bayes models were developed to predict COVID-19 disease severity, associated with the need for IMV, and mortality at seven days. A total of 25 serum cytokines and nine routine blood analyses were considered, with models being developed using feature subsets selected through an information gain algorithm or univariate data analysis. Unsupervised t-SNE allowed us to conduct a preliminary analysis of the impact of the entire dataset and feature subsets in distinguishing patient groups. The resulting Naïve Bayes models demonstrated good performance, predicting the need for IMV (AUC = 0.891) and mortality in both homogenous (AUC = 0.774) and more heterogenous (AUC = 0.887) populations using two to nine features. Interestingly, most of the best models included features that were not flagged as significant in the univariate analysis, pointing to the importance of multivariate approaches in capturing the complex interplay of diverse metabolic networks underlying ICU patents’ conditions. Furthermore, our findings highlight the potential of hybrid predictive models that integrate cytokine profiling with routine blood tests to enhance risk stratification and patient management in ICUs. However, further research is needed to validate these findings and address key challenges mainly related to cytokine profiling, such as assay standardization and redefinition of thresholds for clinical interpretation. Overcoming these limitations could enable this approach to deliver timely and more precise healthcare interventions, ultimately improving patient outcomes. Nevertheless, the potential to formulate effective prediction models for disease severity and the outcome of critically ill patients using a limited number of variables, which could be applied in the ICU to promote faster decision-making, is promising.

Supplementary Materials

The following supporting information can be downloaded at: https://www.mdpi.com/article/10.3390/app15094823/s1. Figure S1: Quality control of the proteomics analyses performed. Quality control of the proteomics analyses was performed by evaluating the retention time (Figure S1A), chromatographic peak width (Figure S1B), precursor charge (Figure S1C), mass precision (Figure S1D), abundance (Figure S1E), missed cleavages (Figure S1F), and peptide identification per group (Figure S1F), across all identified peptides. The number of peptides identified per sample coming from the target proteome, per sample group, was also analyzed (Figure S1G). A comprehensive file containing the search results for all identified protein groups is also provided (see Supplementary Table S1).

Author Contributions

Conceptualization, C.P.V.R., T.A.H.F., A.M. and C.R.C.C.; Methodology, All authors; Software, C.P.V.R., T.A.H.F., R.A. and G.C.J.; Validation, C.P.V.R., T.A.H.F., R.A., A.M. and I.P.; Formal Analysis, C.P.V.R., A.M., I.P. and C.R.C.C.; Investigation, All authors; Resources, M.C.O., L.B. and C.R.C.C.; Data Curation, C.P.V.R., T.A.H.F., R.A. and G.C.J.; Writing—Original Draft Preparation, C.P.V.R. and C.R.C.C.; Writing—Review & Editing, All authors; Visualization, C.P.V.R. and T.A.H.F.; Supervision, L.B. and C.R.C.C.; Project Administration, L.B. and C.R.C.C.; Funding Acquisition, L.B. and C.R.C.C. All authors have read and agreed to the published version of the manuscript.

Funding

This research was supported by Fundação para a Ciência e a Tecnologia (FCT), grant numbers DSAIPA/DS/0117/2020 and RNEM-LISBOA-01-0145-FEDER-022125 (Portuguese Mass Spectrometry Network). Centro de Química Estrutural is a Research Unit funded by FCT through projects UIDB/00100/2020 and UIDP/00100/2020. Institute of Molecular Sciences is an Associate Laboratory funded by FCT through project LA/P/0056/2020. Cristiana P. Von Rekowski, Tiago A.H. Fonseca, and Rúben Araújo acknowledge the FCT PhD grants 2023.01951.BD, 2024.02043.BD, and 2021.05553.BD, respectively.

Institutional Review Board Statement

This study was conducted in accordance with the principles of the Declaration of Helsinki. Ethical approval was granted by the institutional Ethics Committee of Unidade Local de Saúde São José (ULSSJ), Lisbon, Portugal, specifically Comissão de Ética para a Saúde, on 20 May 2020 (approval number 1043/2021).

Informed Consent Statement

Informed consent was obtained from all subjects involved in the study.

Data Availability Statement

The mass spectrometry data proteomics data have been deposited to the Mendeley data repository (https://data.mendeley.com) (accessed on 12 March 2025) with DOI 10.17632/xd9g443btr.1.

Conflicts of Interest

The authors declare no conflict of interest.

References

  1. Pellathy, T.P.; Pinsky, M.R.; Hravnak, M. ICU Scoring Systems. Crit. Care Nurse 2021, 41, 54–64. [Google Scholar] [CrossRef] [PubMed]
  2. Rapsang, A.G.; Shyam, D.C. Scoring systems in the intensive care unit: A compendium. Indian J. Crit. Care Med. 2014, 18, 220–228. [Google Scholar] [CrossRef] [PubMed]
  3. Yu, Z.; Li, X.; Zhao, J.; Sun, S. Identification of hospitalized mortality of patients with COVID-19 by machine learning models based on blood inflammatory cytokines. Front. Public Health 2022, 10, 1001340. [Google Scholar] [CrossRef]
  4. Luo, Y.; Mao, L.; Yuan, X.; Xue, Y.; Lin, Q.; Tang, G.; Song, H.; Wang, F.; Sun, Z. Prediction Model Based on the Combination of Cytokines and Lymphocyte Subsets for Prognosis of SARS-CoV-2 Infection. J. Clin. Immunol. 2020, 40, 960. [Google Scholar] [CrossRef]
  5. Tulu, T.W.; Wan, T.K.; Chan, C.L.; Wu, C.H.; Woo, P.Y.M.; Tseng, C.Z.S.; Vodencarevic, A.; Menni, C.; Chan, K.H.K. Machine learning-based prediction of COVID-19 mortality using immunological and metabolic biomarkers. BMC Digit. Health 2023, 1, 6. [Google Scholar]
  6. Nguyen, H.T.T.; Le-Quy, V.; Ho, S.V.; Thomsen, J.H.D.; Stoico, M.P.; Tong, H.V.; Nguyen, N.L.; Krarup, H.B.; Nguyen, S.H.; Tran, V.Q.; et al. Outcome prediction model and prognostic biomarkers for COVID-19 patients in Vietnam. ERJ Open Res. 2023, 9, 00481–02022. [Google Scholar] [CrossRef] [PubMed]
  7. Zheng, L.; Wen, L.; Lei, W.; Ning, Z. Added value of systemic inflammation markers in predicting pulmonary infection in stroke patients A retrospective study by machine learning analysis. Medicine 2021, 100, e28439. [Google Scholar] [CrossRef]
  8. Alanazi, A.; Aldakhil, L.; Aldhoayan, M.; Aldosari, B. Machine Learning for Early Prediction of Sepsis in Intensive Care Unit (ICU) Patients. Medicina 2023, 59, 1276. [Google Scholar] [CrossRef]
  9. Zhang, X.; Chen, S.; Lai, K.; Chen, Z.; Wan, J.; Xu, Y. Machine learning for the prediction of acute kidney injury in critical care patients with acute cerebrovascular disease. Ren. Fail. 2022, 44, 43–53. [Google Scholar] [CrossRef]
  10. Andrews, H.S.; Herman, J.D.; Gandhi, R.T. Treatments for COVID-19. Annu. Rev. Med. 2024, 75, 145–157. [Google Scholar] [CrossRef]
  11. Cox, J.; Mann, M. MaxQuant enables high peptide identification rates, individualized p.p.b.-range mass accuracies and proteome-wide protein quantification. Nat. Biotechnol. 2008, 26, 1367–1372. [Google Scholar] [CrossRef] [PubMed]
  12. Tyanova, S.; Temu, T.; Cox, J. The MaxQuant computational platform for mass spectrometry-based shotgun proteomics. Nat. Protoc. 2016, 11, 2301–2319. [Google Scholar] [CrossRef] [PubMed]
  13. Cox, J.; Neuhauser, N.; Michalski, A.; Scheltema, R.A.; Olsen, J.V.; Mann, M. Andromeda: A peptide search engine integrated into the MaxQuant environment. J. Proteome Res. 2011, 10, 1794–1805. [Google Scholar] [CrossRef]
  14. Bateman, A.; Martin, M.J.; Orchard, S.; Magrane, M.; Agivetova, R.; Ahmad, S.; Alpi, E.; Bowler-Barnett, E.H.; Britto, R.; Bursteinas, B.; et al. UniProt: The universal protein knowledgebase in 2021. Nucleic Acids Res. 2021, 49, D480–D489. [Google Scholar]
  15. Wiśniewski, J.R.; Mann, M. A Proteomics Approach to the Protein Normalization Problem: Selection of Unvarying Proteins for MS-Based Proteomics and Western Blotting. J. Proteome Res. 2016, 15, 2321–2326. [Google Scholar] [CrossRef]
  16. Uhlén, M.; Fagerberg, L.; Hallström, B.M.; Lindskog, C.; Oksvold, P.; Mardinoglu, A.; Sivertsson, Å.; Kampf, C.; Sjöstedt, E.; Asplund, A.; et al. Proteomics. Tissue-based map of the human proteome. Science 2015, 347, 1260419. [Google Scholar] [CrossRef]
  17. Cox, J.; Hein, M.Y.; Luber, C.A.; Paron, I.; Nagaraj, N.; Mann, M. Accurate Proteome-wide Label-free Quantification by Delayed Normalization and Maximal Peptide Ratio Extraction, Termed MaxLFQ. Mol. Cell Proteom. 2014, 13, 2526. [Google Scholar] [CrossRef]
  18. Tyanova, S.; Temu, T.; Sinitcyn, P.; Carlson, A.; Hein, M.Y.; Geiger, T.; Mann, M.; Cox, J. The Perseus computational platform for comprehensive analysis of (prote)omics data. Nat. Methods 2016, 13, 731–740. [Google Scholar] [CrossRef]
  19. Mi, H.; Ebert, D.; Muruganujan, A.; Mills, C.; Albou, L.P.; Mushayamaha, T.; Thomas, P.D. PANTHER version 16: A revised family classification, tree-based classification tool, enhancer regions and extensive API. Nucleic Acids Res. 2021, 49, D394–D403. [Google Scholar] [CrossRef]
  20. Anowar, F.; Sadaoui, S.; Selim, B. Conceptual and empirical comparison of dimensionality reduction algorithms (PCA, KPCA, LDA, MDS, SVD, LLE, ISOMAP, LE, ICA, t-SNE). Comput. Sci. Rev. 2021, 40, 100378. [Google Scholar] [CrossRef]
  21. Al-Aidaroos, K.M.; Bakar, A.A.; Othman, Z. Medical data classification with Naive Bayes approach. Inf. Technol. J. 2012, 11, 1166–1174. [Google Scholar] [CrossRef]
  22. Domingos, P.; Pazzani, M. On the Optimality of the Simple Bayesian Classifier under Zero-One Loss. Mach. Learn. 1997, 29, 103–130. [Google Scholar] [CrossRef]
  23. Pohjolainen, V.; Ryynänen, O.P.; Räsänen, P.; Roine, R.P.; Koponen, S.; Karlsson, H. Bayesian prediction of treatment outcome in anorexia nervosa: A preliminary study. Nord. J. Psychiatry 2015, 69, 210–215. [Google Scholar] [CrossRef] [PubMed]
  24. Guido, R.; Ferrisi, S.; Lofaro, D.; Conforti, D. An Overview on the Advancements of Support Vector Machine Models in Healthcare Applications: A Review. Information 2024, 15, 235. [Google Scholar] [CrossRef]
  25. Reddy, G.S.; Chittineni, S. Entropy based C4.5-SHO algorithm with information gain optimization in data mining. PeerJ Comput. Sci. 2021, 7, 1–22. [Google Scholar] [CrossRef]
  26. Chen, Y.; Bai, M.; Zhang, Y.; Liu, J.; Yu, D. Proactively selection of input variables based on information gain factors for deep learning models in short-term solar irradiance forecasting. Energy 2023, 284, 129261. [Google Scholar] [CrossRef]
  27. Odhiambo Omuya, E.; Onyango Okeyo, G.; Waema Kimwele, M. Feature Selection for Classification using Principal Component Analysis and Information Gain. Expert. Syst. Appl. 2021, 174, 114765. [Google Scholar] [CrossRef]
  28. Prasetiyowati, M.I.; Maulidevi, N.U.; Surendro, K. Determining threshold value on information gain feature selection to increase speed and prediction accuracy of random forest. J. Big Data 2021, 8, 84. [Google Scholar] [CrossRef]
  29. Hadjadj, J.; Yatim, N.; Barnabei, L.; Corneau, A.; Boussier, J.; Smith, N.; Péré, H.; Charbit, B.; Bondet, V.; Chenevier-Gobeaux, C.; et al. Impaired type I interferon activity and inflammatory responses in severe COVID-19 patients. Science 2020, 369, 718–724. [Google Scholar] [CrossRef]
  30. Soltani-Zangbar, M.S.; Parhizkar, F.; Ghaedi, E.; Tarbiat, A.; Motavalli, R.; Alizadegan, A.; Aghebati-Maleki, L.; Rostamzadeh, D.; Yousefzadeh, Y.; Jadideslam, G.; et al. A comprehensive evaluation of the immune system response and type-I Interferon signaling pathway in hospitalized COVID-19 patients. Cell Commun. Signal 2022, 20, 106. [Google Scholar] [CrossRef]
  31. Costela-Ruiz, V.J.; Illescas-Montes, R.; Puerta-Puerta, J.M.; Ruiz, C.; Melguizo-Rodríguez, L. SARS-CoV-2 infection: The role of cytokines in COVID-19 disease. Cytokine Growth Factor Rev. 2020, 54, 62–75. [Google Scholar] [CrossRef] [PubMed]
  32. Shi, H.; Wang, W.; Yin, J.; Ouyang, Y.; Pang, L.; Feng, Y.; Qiao, L.; Guo, X.; Shi, H.; Jin, R.; et al. The inhibition of IL-2/IL-2R gives rise to CD8+ T cell and lymphocyte decrease through JAK1-STAT5 in critical patients with COVID-19 pneumonia. Cell Death Dis. 2020, 11, 429. [Google Scholar] [CrossRef] [PubMed]
  33. Ferreira, V.L.; Borba, H.H.L.; Bonetti, A.d.F.; Leonart, L.P.; Pontarolo, R. Cytokines and Interferons: Types and Functions. In Autoantibodies and Cytokines; Khan, W.A., Ed.; IntechOpen: Rijeka, Croatia, 2019. [Google Scholar]
  34. Naeini, L.G.; Abbasi, L.; Karimi, F.; Kokabian, P.; Abdi Abyaneh, F.; Naderi, D. The Important Role of Interleukin-2 in COVID-19. J. Immunol. Res. 2023, 2023, 7097329. [Google Scholar]
  35. Madureira, G.; Soares, R. The misunderstood link between SARS-CoV-2 and angiogenesis. A narrative review. Pulmonology 2023, 29, 323–331. [Google Scholar] [CrossRef]
  36. Sun, Z.Y.; Xia, H.G.; Zhu, D.Q.; Deng, L.M.; Zhu, P.Z.; Wang, D. Bin. Clinical significance of mechanical ventilation on ischemic-reperfusion injury caused by lung chest trauma and VEGF expression levels in peripheral blood. Exp. Ther. Med. 2017, 14, 2531–2535. [Google Scholar] [CrossRef]
  37. Jøntvedt Jørgensen, M.; Holter, J.C.; Christensen, E.E.; Schjalm, C.; Tonby, K.; Pischke, S.E.; Jenum, S.; Skeie, L.G.; Nur, S.; Lind, A.; et al. Increased interleukin-6 and macrophage chemoattractant protein-1 are associated with respiratory failure in COVID-19. Sci. Rep. 2020, 10, 21697. [Google Scholar] [CrossRef]
  38. Mahrous, A.A.; Hassanien, A.A.; Atta, M.S. Predictive value of C-reactive protein in critically ill patients who develop acute lung injury. Egypt. J. Chest Dis. Tuberc. 2015, 64, 225–236. [Google Scholar] [CrossRef]
  39. Bhattacharya, B.; Prashant, A.; Vishwanath, P.; Suma, M.N.; Nataraj, B. Prediction of outcome and prognosis of patients on mechanical ventilation using body mass index, SOFA score, C-Reactive protein, and serum albumin. Indian J. Crit. Care Med. 2011, 15, 87. [Google Scholar]
  40. Russo, A.; Tellone, E.; Barreca, D.; Ficarra, S.; Laganà, G. Implication of COVID-19 on Erythrocytes Functionality: Red Blood Cell Biochemical Implications and Morpho-Functional Aspects. Int. J. Mol. Sci. 2022, 23, 2171. [Google Scholar] [CrossRef]
  41. Lechuga, G.C.; Morel, C.M.; De-Simone, S.G. Hematological alterations associated with long COVID-19. Front. Physiol. 2023, 14, 1203472. [Google Scholar] [CrossRef]
  42. Ceccato, A.; Panagiotarakou, M.; Ranzani, O.T.; Martin-Fernandez, M.; Almansa-Mora, R.; Gabarrus, A.; Bueno, L.; Cilloniz, C.; Liapikou, A.; Ferrer, M.; et al. Lymphocytopenia as a Predictor of Mortality in Patients with ICU-Acquired Pneumonia. J. Clin. Med. 2019, 8, 843. [Google Scholar] [CrossRef] [PubMed]
  43. Toori, K.U.; Qureshi, M.A.; Chaudhry, A. Lymphopenia: A useful predictor of COVID-19 disease severity and mortality. Pak. J. Med. Sci. 2021, 37, 1988. [Google Scholar] [CrossRef]
  44. Deng, Q.; Hu, B.; Zhang, Y.; Wang, H.; Zhou, X.; Hu, W.; Cheng, Y.; Yan, J.; Ping, H.; Zhou, Q. Suspected myocardial injury in patients with COVID-19: Evidence from front-line clinical observation in Wuhan, China. Int. J. Cardiol. 2020, 311, 116–121. [Google Scholar] [CrossRef] [PubMed]
  45. Kang, Y.; Chen, T.; Mui, D.; Ferrari, V.; Jagasia, D.; Scherrer-Crosbie, M.; Chen, Y.; Han, Y. Cardiovascular manifestations and treatment considerations in COVID-19. Heart 2020, 106, 1132–1141. [Google Scholar] [CrossRef]
  46. McKenna, E.; Wubben, R.; Isaza-Correa, J.M.; Melo, A.M.; Mhaonaigh, A.U.; Conlon, N.; O’Donnell, J.S.; Ní Cheallaigh, C.; Hurley, T.; Stevenson, N.J.; et al. Neutrophils in COVID-19: Not Innocent Bystanders. Front. Immunol. 2022, 13, 864387. [Google Scholar] [CrossRef]
  47. Heidari-Beni, F.; Vahedian-Azimi, A.; Shojaei, S.; Rahimi-Bashar, F.; Shahriary, A.; Johnston, T.P.; Sahebkar, A. The Level of Procalcitonin in Severe COVID-19 Patients: A Systematic Review and Meta-Analysis. Adv. Exp. Med. Biol. 2021, 1321, 277–286. [Google Scholar]
  48. Henry, B.M.; Aggarwal, G.; Wong, J.; Benoit, S.; Vikse, J.; Plebani, M.; Lippi, G. Lactate dehydrogenase levels predict coronavirus disease 2019 (COVID-19) severity and mortality: A pooled analysis. Am. J. Emerg. Med. 2020, 38, 1722. [Google Scholar] [CrossRef]
  49. Lopes-Pacheco, M.; Silva, P.L.; Cruz, F.F.; Battaglini, D.; Robba, C.; Pelosi, P.; Morales, M.M.; Caruso Neves, C.; Rocco, P.R.M. Pathogenesis of Multiple Organ Injury in COVID-19 and Potential Therapeutic Strategies. Front. Physiol. 2021, 12, 593223. [Google Scholar] [CrossRef]
  50. Feld, J.; Tremblay, D.; Thibaud, S.; Kessler, A.; Naymagon, L. Ferritin levels in patients with COVID-19: A poor predictor of mortality and hemophagocytic lymphohistiocytosis. Int. J. Lab. Hematol. 2020, 42, 773–779. [Google Scholar] [CrossRef]
  51. Kaushal, K.; Kaur, H.; Sarma, P.; Bhattacharyya, A.; Sharma, D.J.; Prajapat, M.; Pathak, M.; Kothari, A.; Kumar, S.; Rana, S.; et al. Serum ferritin as a predictive biomarker in COVID-19. A systematic review, meta-analysis and meta-regression analysis. J. Crit. Care 2022, 67, 172. [Google Scholar] [CrossRef]
  52. Zhang, L.; Yan, X.; Fan, Q.; Liu, H.; Liu, X.; Liu, Z.; Zhang, Z. D-dimer levels on admission to predict in-hospital mortality in patients with COVID-19. J. Thromb. Haemost. 2020, 18, 1324–1329. [Google Scholar] [CrossRef] [PubMed]
  53. Kangro, K.; Wolberg, A.S.; Flick, M.J. Fibrinogen, Fibrin, and Fibrin Degradation Products in COVID-19. Curr. Drug Targets 2022, 23, 1602. [Google Scholar]
  54. Patel, D.; Kher, V.; Desai, B.; Lei, X.; Cen, S.; Nanda, N.; Gholamrezanezhad, A.; Duddalwar, V.; Varghese, B.; Oberai, A.A. Machine learning based predictors for COVID-19 disease severity. Sci. Rep. 2021, 11, 4673. [Google Scholar] [CrossRef] [PubMed]
  55. Osawa, E.A.; Maciel, A.T. An algorithm to predict the need for invasive mechanical ventilation in hospitalized COVID-19 patients: The experience in Sao Paulo. Acute Crit. Care 2022, 37, 580–591. [Google Scholar] [CrossRef]
  56. Nicholson, C.J.; Wooster, L.; Sigurslid, H.H.; Li, R.H.; Jiang, W.; Tian, W.; Lino Cardenas, C.L.; Malhotra, R. Estimating risk of mechanical ventilation and in-hospital mortality among adult COVID-19 patients admitted to Mass General Brigham: The VICE and DICE scores. eClinicalMedicine 2021, 33, 100765. [Google Scholar] [CrossRef]
  57. Chen, G.; Zhao, X.; Chen, X.; Liu, C. Early decrease in blood lymphocyte count is associated with poor prognosis in COVID-19 patients: A retrospective cohort study. BMC Pulm. Med. 2023, 23, 453. [Google Scholar] [CrossRef]
  58. Yeşilyurt, A.Ö.; Bayrakçi, S.; Ayhan, N.A.; Bulut, Y.; Firat, A.; Saygılı, N.B.; Seydaoğlu, G.; Özyilmaz, E. Prognostic importance of monitoring the lymphocyte count in critically ill COVID-19 patients during the ICU stay. J. Crit. Care 2024, 81, 154673. [Google Scholar] [CrossRef]
  59. Wang, S.; Sheng, Y.; Tu, J.; Zhang, L. Association between peripheral lymphocyte count and the mortality risk of COVID-19 inpatients. BMC Pulm. Med. 2021, 21, 55. [Google Scholar] [CrossRef]
  60. Michels, E.H.A.; Appelman, B.; de Brabander, J.; van Amstel, R.B.E.; van Linge, C.C.A.; Chouchane, O.; Reijnders, T.D.Y.; Schuurman, A.R.; Sulzer, T.A.L.; Klarenbeek, A.M.; et al. Host Response Changes and Their Association with Mortality in COVID-19 Patients with Lymphopenia. Am. J. Respir. Crit. Care Med. 2024, 209, 402–416. [Google Scholar] [CrossRef]
  61. Linssen, J.; Ermens, A.; Berrevoets, M.; Seghezzi, M.; Previtali, G.; Brugge, S.; Russcher, H.; Verbon, A.; Gillis, J.; Riedl, J.; et al. A novel haemocytometric COVID-19 prognostic score developed and validated in an observational multicentre European hospital-based study. eLife 2020, 9, e63195. [Google Scholar] [CrossRef]
  62. Anderberg, S.B.; Luther, T.; Berglund, M.; Larsson, R.; Rubertsson, S.; Lipcsey, M.; Larsson, A.; Frithiof, R.; Hultström, M. Increased levels of plasma cytokines and correlations to organ failure and 30-day mortality in critically ill COVID-19 patients. Cytokine 2021, 138, 155389. [Google Scholar] [CrossRef]
  63. dos Santos Medeiros, S.M.D.F.R.; Sousa Lino, B.M.N.; Perez, V.P.; Sousa, E.S.S.; Campana, E.H.; Miyajima, F.; Carvalho-Silva, W.H.V.; Dejani, N.N.; de Sousa Fernandes, M.S.; Yagin, F.H.; et al. Predictive biomarkers of mortality in patients with severe COVID-19 hospitalized in intensive care unit. Front. Immunol. 2024, 15, 1416715. [Google Scholar] [CrossRef]
  64. Sharma, J.; Rajput, R.; Bhatia, M.; Arora, P.; Sood, V. Clinical Predictors of COVID-19 Severity and Mortality: A Perspective. Front. Cell Infect. Microbiol. 2021, 11, 674277. [Google Scholar] [CrossRef]
  65. Lin, W.C.; Lin, C.F.; Chen, C.L.; Chen, C.W.; Lin, Y.S. Prediction of outcome in patients with acute respiratory distress syndrome by bronchoalveolar lavage inflammatory mediators. Exp. Biol. Med. 2010, 235, 57–65. [Google Scholar] [CrossRef]
  66. Hennus, M.P.; Van Vught, A.J.; Brabander, M.; Brus, F.; Jansen, N.J.; Bont, L.J. Mechanical Ventilation Drives Inflammation in Severe Viral Bronchiolitis. PLoS ONE 2013, 8, e83035. [Google Scholar] [CrossRef]
  67. Jang, H.J.; Leem, A.Y.; Chung, K.S.; Ahn, J.Y.; Jung, J.Y.; Kang, Y.A.; Park, M.S.; Kim, Y.S.; Lee, S.H. Soluble IL-2R Levels Predict in-Hospital Mortality in COVID-19 Patients with Respiratory Failure. J. Clin. Med. 2021, 10, 4242. [Google Scholar] [CrossRef]
  68. Karlsson, S.; Pettilä, V.; Tenhunen, J.; Lund, V.; Hovilehto, S.; Ruokonen, E. Vascular endothelial growth factor in severe sepsis and septic shock. Anesth. Analg. 2008, 106, 1820–1826. [Google Scholar] [CrossRef]
  69. Liu, Y.; Zhang, C.; Huang, F.; Yang, Y.; Wang, F.; Yuan, J.; Zhang, Z.; Qin, Y.; Li, X.; Zhao, D.; et al. Elevated plasma levels of selective cytokines in COVID-19 patients reflect viral load and lung injury. Natl. Sci. Rev. 2020, 7, 1003–1011. [Google Scholar] [CrossRef]
  70. Smail, S.W.; Babaei, E.; Amin, K.; Abdulahad, W.H. Serum IL-23, IL-10, and TNF-α predict in-hospital mortality in COVID-19 patients. Front. Immunol. 2023, 14, 1145840. [Google Scholar] [CrossRef]
  71. Mwangi, V.I.; Netto, R.L.A.; de Morais, C.E.P.; Silva, A.S.; Silva, B.M.; Lima, A.B.; Neves, J.C.F.; Borba, M.G.S.; Val, F.F.A.; de Almeida, A.C.G.; et al. Temporal patterns of cytokine and injury biomarkers in hospitalized COVID-19 patients treated with methylprednisolone. Front. Immunol. 2023, 16, 1229611. [Google Scholar] [CrossRef]
  72. Silva, M.J.A.; Ribeiro, L.R.; Gouveia, M.I.M.; Marcelino, B.d.R.; dos Santos, C.S.; Lima, K.V.B.; Lima, L.N.G.C. Hyperinflammatory Response in COVID-19: A Systematic Review. Viruses 2023, 15, 553. [Google Scholar] [CrossRef] [PubMed]
  73. Sánchez-Montalvá, A.; Álvarez-Sierra, D.; Martínez-Gallo, M.; Perurena-Prieto, J.; Arrese-Muñoz, I.; Ruiz-Rodríguez, J.C.; Espinosa-Pereiro, J.; Bosch-Nicolau, P.; Martínez-Gómez, X.; Antón, A.; et al. Exposing and Overcoming Limitations of Clinical Laboratory Tests in COVID-19 by Adding Immunological Parameters; A Retrospective Cohort Analysis and Pilot Study. Front. Immunol. 2022, 13, 902837. [Google Scholar] [CrossRef] [PubMed]
Figure 1. Schematic overview of the study design and workflow. Serum samples from ICU COVID-19 patients were collected and subjected to filter-assisted sample preparation (FASP). The resulting peptides were analyzed with elute ultra-high performance liquid chromatography coupled to quadrupole time-of-flight mass spectrometry (UHPLC–QTOF), followed by label-free quantification in MaxQuant. Cytokine abundance data were then integrated with routine clinical parameters (following univariate analyses) to develop and validate predictive models for ICU disease severity and mortality (see Section 2.2, Section 2.3, Section 2.4 and Section 2.5).
Applsci 15 04823 g001
Figure 2. Schematic depiction of the proteomic workflow from protein precipitation through data analysis. Serum proteins were precipitated and processed with a filter-assisted sample preparation (FASP) protocol, including denaturation, reduction, alkylation, and trypsin digestion. Peptides were then eluted and analyzed via UHPLC–HRMS in data-dependent acquisition mode. Raw data underwent peptide-spectrum matching, false discovery rate (FDR) control, label-free quantification (LFQ), match-between-runs alignment, protein grouping, and imputation of missing values using MaxQuant and Perseus.
Applsci 15 04823 g002
Figure 3. Boxplots of cytokines showing significant differences between groups at a 10% significance level. Panels (ad) compare Groups A + B vs. C; panel (e) compares Group B vs. Group C; and panel (f) compares Group A vs. Group B. Green boxplots represent discharged patients who did not require IMV (Group A); blue indicates discharged patients who required IMV (Group B); uncolored boxplots represent all discharged patients (Groups A + B); and grey indicates deceased patients who required IMV (Group C). Note: * and ** represent outliers.
Applsci 15 04823 g003
Figure 4. t-SNE representations for Group A (blue) versus Group B (red), considering 25 serum cytokines (a), 9 routine blood analyses (b), and 34 cytokines and routine blood analyses (c); and feature subsets of serum cytokines (d), routine blood analyses (e), and cytokines plus routine blood analyses (f) that led to the best predictive models.
Applsci 15 04823 g004
Figure 5. t-SNE representations for Group B (blue) versus Group C (red), considering 25 serum cytokines (a), 9 routine blood analyses (b), and 34 cytokines and routine blood analyses (c); and feature subsets of serum cytokines (d), routine blood analyses (e), and cytokines plus routine blood analyses (f) that led to the best predictive models. Since the best results from the routine blood analyses’ dataset were achieved using a single variable, the t-SNE (e) was obtained using the features from the second-best model (lymphocyte and platelet counts).
Applsci 15 04823 g005
Figure 6. t-SNE representations from Groups A and B (blue) versus Group C (red), considering 25 serum cytokines (a), 9 routine blood analyses (b), and 34 cytokines and routine blood analyses (c); and feature subsets of serum cytokines (d), routine blood analyses (e), and cytokines plus routine blood analyses (f) that led to the best predictive models.
Applsci 15 04823 g006
Table 1. Patients’ demographic and clinical data by group, and comparisons among them.
Groupsp-Value
A vs. B
p-Value
B vs. C
p-Value
A + B vs. C
VariablesA
Discharged,
no IMV (n = 8)
B
Discharged,
IMV (n = 8)
A + B
All Discharged
(n = 16)
C
Deceased, IMV (n = 8)
Median age (IQR); years52.00
(43.25–62.00)
55.00
(51.00–66.75)
53.50
(50.25–62.25)
65.00
(60.50–67.75)
0.3280.2340.061
Median BMI, kg/m227.68 (26.91–33.95) (n = 6)31.18
(25.44–35.66)
29.08 (26.93–34.95) (n = 14)29.39 (26.12–33.41) (n = 7)0.5870.6100.799
Comorbidities; n (%)6 (75.0)7 (87.5)13 (81.3)5 (62.5)-0.5690.362
Arterial hypertension; n (%)2 (25.0)6 (75.0)8 (50.0)3 (37.5)0.1320.3150.679
Obesity; n (%)2 (25.0)4 (50.0)6 (37.5)2 (25.0)0.6080.6080.667
Diabetes; n (%)2 (25.0)3 (37.5)5 (31.3)3 (37.5)---
Dyslipidemia; n (%)2 (25.0)2 (25.0)4 (25.0)2 (25.0)---
Chronic respiratory disease; n (%)2 (25.0)2 (25.0)4 (25.0)3 (37.5)--0.647
IMV; n (%)0 (100.0)8 (100.0)8 (50.0)8 (100.0)<0.001-0.022
HFO; n (%)8 (100.0)2 (25.0)10 (62.5)2 (25.0)0.007-0.193
Origin --0.631 *
Portugal6 (75.0)6 (75.0)12 (75.0)7 (87.5)
Other European countries 0 (0.0)1 (12.5)1 (6.25)0 (0.0)
Africa1 (12.5)0 (0.0)1 (6.25)1 (12.5)
Asia1 (12.5)1 (12.5)2 (12.5)0 (0.0)
Median time between ICU admission and sample collection; days5.00
(1.50–6.00)
5.50
(3.00–9.75)
5.00
(3.00–7.00)
4.50
(3.25–7.75)
0.3820.7980.834
Median time between sample collection and death (IQR); days---5.00
(4.25–11.50)
---
Median ICU length of stay (IQR); days7.00
(5.00–8.75)
13.50
(10.50–22.00)
10.00
(6.50–14.50)
12.50
(8.00–15.25)
0.0020.3280.490
In case of small frequencies across the different categories, p-values were not calculated. In case of missing values, the utilized n was provided. Statistically significant results at a 5% significance level are highlighted in bold. IQR Interquartile range. * For the variable “Origin”, comparisons were made between individuals originated from Portugal and those from other countries.
Table 2. Patient cytokine profile by group, and comparisons between them.
GroupsOutcome (log2 (LFQ Intensity))p-Value
A vs. B
p-Value
B vs. C
p-Value
A + B
vs. C
Variables A
Discharged, no IMV (n = 8)
B
Discharged, IMV (n = 8)
A + B
All Discharged (n = 16)
C
Deceased, IMV (n = 8)
CCL3 12.82 (12.02–13.33)14.32 (12.39–14.56)13.25 (12.22–14.33)13.68 (12.38–14.08)0.1300.3280.834
CCL416.21 (15.27–17.75)17.14 (15.75–17.57)16.58 (15.70–17.57)17.71 (15.67–18.39)0.5740.5050.264
CCL514.59 (13.00–15.12)13.23 (11.98–14.36)13.68 (12.85–15.05)13.50 (12.33–14.03)0.1950.8780.490
CCL1118.39 (17.49–18.83)17.69 (16.54–18.37)17.84 (17.28–18.65)17.40 (16.70–18.42)0.1950.8780.350
CXCL814.09 (12.95–16.13)14.11 (13.37–15.31)14.11 (13.34–15.71)13.82 (12.81–15.48)1.0000.6450.569
CXCL917.39 (16.87–17.51)16.37 (15.16–17.43)17.06 (15.50–17.51)16.10 (15.58–16.37)0.2790.7210.093
CXCL1018.04 (17.85–18.30)17.56 (17.29–18.22)17.96 (17.52–18.29)17.55 (17.37–17.87)0.1050.9590.136
IFN-α13.29 (12.15–13.79)14.53 (13.01–17.22)13.62 (12.55–15.85)15.82 (13.07–18.76)0.2340.4420.172
IFN-β14.87 (14.40–15.01)13.88 (13.19–14.96)14.67 (13.48–15.01)13.48 (12.38–13.77)0.2790.3280.081
IFN-γ15.44 (14.67–15.97)14.94 (13.86–15.37)15.14 (14.42–15.59)14.26 (14.02–14.81)0.1610.1610.019
IL-1α16.41 (15.40–16.82)15.89 (13.60–16.10)15.96 (15.25–16.73)15.85 (14.29–16.28)0.2790.7210.653
IL-1β12.67 (12.52–13.43)13.02 (12.47–13.89)12.95 (12.52–13.68)12.75 (11.31–13.70)0.4420.5050.569
IL-1RN12.08 (11.42–13.00)13.24 (12.67–13.47)12.77 (12.00–13.35)13.66 (12.13–13.85)0.0500.4420.172
IL-2R12.83 (11.81–13.08)12.73 (11.19–13.74)12.83 (11.79–13.29)11.08 (10.31–12.30)0.8780.1050.016
IL-6 13.21 (10.42–14.25)12.98 (10.69–14.03)13.12 (10.50–14.23)13.34 (12.11–13.49)0.8780.6450.881
IL-715.44 (15.00–16.14)14.41 (12.79–16.38)15.39 (13.77–16.24)15.13 (12.81–15.48)0.3820.8780.610
IL-1014.70 (13.01–14.91)14.92 (14.13–15.58)14.79 (13.96–15.05)14.36 (13.36–16.96)0.3280.7980.881
IL-1313.06 (11.20–16.62)12.29 (11.90–12.97)12.61 (11.38–15.09)14.39 (12.78–15.03)0.5050.1050.238
IL-1517.65 (17.26–17.84)17.35 (16.81–17.83)17.54 (16.97–17.84)17.15 (16.50–17.71)0.3280.5050.238
CSF214.44 (13.38–14.89)13.94 (13.10–14.72)14.20 (13.38–14.80)14.17 (13.28–14.60)0.5740.7980.928
EGF13.01 (12.63–15.71)16.04 (13.38–16.93)14.60 (12.78–16.78)14.48 (12.56–15.85)0.2340.3820.834
HGF14.16 (13.52–15.06)13.47 (11.82–14.07)13.86 (13.26–14.40)14.16 (13.69–14.73)0.1050.1050.383
TNF-α 13.42 (12.74–13.92)13.15 (12.87–13.89)13.27 (12.87–13.91)13.26 (12.42–13.67)0.7210.6450.528
VEGF14.27 (11.81–14.41)14.03 (13.67–14.44)14.14 (13.67–14.41)13.49 (13.38–13.94)0.7210.0830.038
PARK714.81 (14.61–15.60)14.55 (13.24–15.52)14.81 (13.81–15.54)14.35 (14.00–14.77)0.4420.8780.291
Results presented as median (IQR). Statistically significant results at a 10% significance level are highlighted in bold.
Table 3. Routine blood analyses by patient group, and intergroup comparisons.
Normality RangeOutcomep-Value
A vs. B
p-Value
B vs. C
p-Value
A + B vs. C
Variables A
Discharged, no IMV (n = 8)
B
Discharged, IMV (n = 8)
A + B
All Discharged (n = 16)
C
Deceased, IMV (n = 8)
Neutrophil count, ×109/L2.0–8.57.71 (5.99–10.98)7.86 (6.00–18.08)7.71 (6.00–11.40)9.81 (5.77–16.01)0.7211.0000.697
Eosinophil count, ×109/L0.0–0.60.09 (0.02–0.17); n = 70.11 (0.02–0.15)0.09 (0.02–0.15); n = 150.05 (001–0.17); n = 61.0000.5730.470
Lymphocyte count, ×109/L0.9–3.51.26 (1.13–1.41)1.32 (0.74–1.68)1.27 (0.94–1.53)0.61 (0.54–0.75)0.7980.0150.003
RBC count, ×1012/L4.4–5.9 4.39 (4.15–4.85)3.88 (3.79–4.35)4.19 (3.87–4.49)3.71 (2.85–3.94)0.0280.1050.005
Ferritin, ng/mL30–3401221.40 (503.00–6552.75); n = 51591.10 (1111.80–3719.30); n = 51432.45 (849.48–5525.00); n = 101776.60 (1395.40-.); n = 30.6900.5710.573
Platelet count, ×109/L150–450309.50 (220.75–380.75)255.50 (166.25–357.75)290.00 (209.75–360.50)288.00 (253.00–303.50)0.5050.7980.787
Fibrinogen, g/L2.00–4.006.10 (4.80-.); n = 36.20 (4.50–7.33); n = 66.10 (5.10–7.85); n = 94.60 (3.90-.); n = 30.9050.7140.482
D-dimers, µg/L <230 1805.00 (273.00–4043.75); n = 62104.50 (623.25–3123.50)2104.50 (456.75–3089.50); n = 14987.00 (397.00–3019.00); n = 70.7550.6130.636
Procalcitonin, ng/mL<0.060.09 (0.05–0.16); n = 60.30 (0.12–1.54); n = 60.14 (0.05–0.39); n = 120.29 (0.08-.); n = 30.1320.9050.536
CRP, mg/L<546.50 (16.25–116.38)206.65 (97.03–239.73)98.35 (37.65–220.73)154.05 (91.63–274.40)0.0281.0000.238
LDH, U/L125–220518.00 (322.00–615.00); n = 7388.00 (354.00–478.00); n = 7392.50 (346.00–581.25); n = 14422.50 (357.25–526.25); n = 60.5350.6281.000
Creatinine, mg/dL0.72–1.250.73 (0.66–0.84)0.75 (0.63–1.00)0.74 (0.65–0.85)0.96 (0.65–1.42)1.0000.3820.214
hs-cTn I, pg/mL <34.22.15 (1.90–3.35); n = 69.95 (3.30–257.98); n = 63.40 (1.95–12.73); n = 1243.00 (7.55–285.30); n = 50.0260.4290.037
Results presented as median (IQR). In case of missing values, the utilized n was provided. Statistically significant results at a 5% significance level are highlighted in bold. (The underline indicates missing values, with the corresponding “n” provided to distinguish it from instances where no missing data is shown).
Table 4. Naïve Bayes models for disease severity, i.e., discriminating between discharged patients without IMV (Group A) and discharged patients requiring IMV (Group B). Models were based on full datasets or feature subsets of cytokines, routine blood analyses, or hybrid data selected by an information gain algorithm or univariate data analysis.
DatasetFeature Selection ModeFeature SubsetsAUCAccuracyPrecisionRecallSpecificity
CytokinesFull datasetAll 25 cytokines0.5880.7000.7080.7000.700
Information gainIL-1RN, CXCL10, CCL3, CXCL9, IL-7, HGF, IL-15, IL-13, IL-1α, IFN-γ0.7770.7250.7300.7250.725
IL-1RN, CXCL10, CCL3, CXCL9, IL-7, HGF, IL-15, IL-13, IL-1α 0.7900.7000.7080.7000.700
IL-1RN, CXCL10, CCL3, CXCL9, IL-7, HGF, IL-15, IL-130.7950.7250.7560.7250.725
IL-1RN, CXCL10, CCL3, CXCL9, IL-7, HGF, IL-150.8040.7000.7380.7000.700
IL-1RN, CXCL10, CCL3, CXCL9, IL-7, HGF0.8100.7500.7980.7500.750
IL-1RN, CXCL10, CCL3, CXCL9, IL-70.7460.7000.7380.7000.700
IL-1RN, CXCL10, CCL3, CXCL90.7300.6250.6330.6250.625
IL-1RN, CXCL10, CCL3 0.7440.6500.6520.6500.650
IL-1RN, CXCL100.6650.5750.5770.5750.575
IL-1RN0.6050.5500.5510.5500.550
Univariate
Analysis
IL-1RN0.6050.5500.5510.5500.550
Routine blood analysesFull datasetAll 9 laboratory biomarkers 0.3960.3500.3500.3500.350
Information gainLDH, RBCs, CRP, lymphocytes, neutrophils, creatinine, platelets, D-dimers0.4010.4500.4490.4500.450
LDH, RBCs, CRP, lymphocytes, neutrophils, creatinine, platelets0.4140.4000.3990.4000.400
LDH, RBCs, CRP, lymphocytes, neutrophils, creatinine0.5110.4750.4750.4750.475
LDH, RBCs, CRP, lymphocytes, neutrophils0.5610.4750.4750.4750.475
LDH, RBCs, CRP, lymphocytes 0.6280.5000.5000.5000.500
LDH, RBCs, CRP 0.6470.5250.5250.5250.525
LDH, RBCs 0.5650.5750.5800.5750.575
LDH0.4190.5250.5280.5250.525
Univariate
Analysis
CRP0.6240.6750.6990.6750.675
RBC0.7080.6500.6650.6500.650
CRP, RBCs0.7440.5750.5770.5750.575
Cytokines and Routine blood analyses / Hybrid dataFull datasetAll 34 features0.5350.5500.5510.5500.550
Information gainLDH, RBCs, CRP, IL-1RN, CXCL10, CCL3, CXCL9, IL-7, HGF, IL-150.8790.8000.8000.8000.800
LDH, RBCs, CRP, IL-1RN, CXCL10, CCL3, CXCL9, IL-7, HGF 0.8910.8500.8500.8500.850
LDH, RBCs, CRP, IL-1RN, CXCL10, CCL3, CXCL9, IL-70.8510.7500.7500.7500.750
LDH, RBCs, CRP, IL-1RN, CXCL10, CCL3, CXCL90.8270.7000.7000.7000.700
LDH, RBCs, CRP, IL-1RN, CXCL10, CCL3 0.8000.7250.7260.7250.725
LDH, RBCs, CRP, IL-1RN, CXCL100.7640.6500.6520.6500.650
LDH, RBCs, CRP, IL-1RN0.6520.5500.5510.5500.550
LDH, RBCs, CRP 0.6470.5250.5250.5250.525
LDH, RBCs 0.5650.5750.5800.5750.575
LDH0.4190.5250.5280.5250.525
Univariate
Analysis
IL-1RN, RBCs, CRP0.7300.7000.7000.7000.700
The highest results for each column regarding the model’s performances are highlighted in bold for each dataset.
Table 5. Comparisons between prediction models for disease severity (Group A vs. Group B).
Friedman TestOverall p-Values from the
Friedman Test
p-Values Adjusted by the Bonferroni Correction for Multiple Tests
FeaturesCytokines vs.
Routine Blood Analyses
Cytokines vs.
Hybrid Data
Routine Blood Analyses vs. Hybrid Data
Full datasets0.3680.4720.9990.999
Subsets achieved by the information gain algorithm0.0010.0070.9990.003
Statistically significant results at a 5% significance level are highlighted in bold.
Table 6. Naïve Bayes models for mortality in the ICU, i.e., discriminating between discharged patients with IMV (Group B) and deceased patients with IMV (Group C). Models were based on full datasets or feature subsets of cytokines, routine blood analyses, or hybrid data selected by an information gain algorithm or univariate data analysis.
DatasetFeature Selection Mode Feature SubsetsAUCAccuracyPrecisionRecallSpecificity
CytokinesFull datasetAll 25 cytokines 0.4450.4500.4500.4500.450
Information gainHGF, IL-10, IL-2R, IL-13, IL-7, CXCL10, PARK7, CXCL9, IFN-γ, VEGF0.7310.6500.6500.6500.650
HGF, IL-10, IL-2R, IL-13, IL-7, CXCL10, PARK7, CXCL9, IFN-γ0.7440.7000.7080.7000.700
HGF, IL-10, IL-2R, IL-13, IL-7, CXCL10, PARK7, CXCL90.7400.6000.6010.6000.600
HGF, IL-10, IL-2R, IL-13, IL-7, CXCL10, PARK70.7460.7250.7260.7250.725
HGF, IL-10, IL-2R, IL-13, IL-7, CXCL100.7310.6500.6520.6500.650
HGF, IL-10, IL-2R, IL-13, IL-70.7190.6500.6520.6500.650
HGF, IL-10, IL-2R, IL-130.7280.7000.7080.7000.700
HGF, IL-10, IL-2R0.7240.7250.7260.7250.725
HGF, IL-100.7720.7750.8130.7750.775
HGF0.7130.7500.7500.7500.750
Univariate
Analysis
VEGF0.5410.5750.5750.5750.575
Routine blood analysesFull datasetAll 9 laboratory biomarkers 0.4890.4750.4720.4750.475
Information gainLymphocytes, platelets, RBCs, D-dimers, eosinophils, LDH, creatinine, CRP0.6060.5750.5850.5750.575
Lymphocytes, platelets, RBCs, D-dimers, eosinophils, LDH, creatinine0.6340.6500.6560.6500.650
Lymphocytes, platelets, RBCs, D-dimers, eosinophils, LDH0.6130.6000.6100.6000.600
Lymphocytes, platelets, RBCs, D-dimers, eosinophils0.6340.6000.6100.6000.600
Lymphocytes, platelets, RBCs, D-dimers0.5910.5250.5250.5250.525
Lymphocytes, platelets, RBCs0.6900.6250.6330.6250.625
Lymphocytes, platelets0.6840.6500.6790.6500.650
Lymphocytes 0.7080.7250.7300.7250.725
Cytokines and Routine blood analyses/Hybrid dataFull datasetAll 34 variables 0.4480.4500.4500.4500.450
Information gainLymphocytes, IL-2R, HGF, platelets, IL-10, eosinophils, IL-7, CXCL10, PARK7, CXCL90.7680.6500.6560.6500.650
Lymphocytes, IL-2R, HGF, platelets, IL-10, eosinophils, IL-7, CXCL10, PARK70.7650.6750.6750.6750.675
Lymphocytes, IL-2R, HGF, platelets, IL-10, eosinophils, IL-7, CXCL100.7650.6750.6790.6750.675
Lymphocytes, IL-2R, HGF, platelets, IL-10, eosinophils, IL-7 0.7580.7000.7080.7000.700
Lymphocytes, IL-2R, HGF, platelets, IL-10, eosinophils0.7740.6250.6280.6250.625
Lymphocytes, IL-2R, HGF, platelets, IL-100.7700.6750.6790.6750.675
Lymphocytes, IL-2R, HGF, platelets0.7460.6250.6280.6250.625
Lymphocytes, IL-2R, HGF 0.7740.7250.7300.7250.725
Lymphocytes, IL-2R0.7250.6750.6870.6750.675
Lymphocytes0.7080.7250.7300.7250.725
Univariate
Analysis
VEGF; Lymphocytes0.6360.6250.6330.6250.625
The best results for each column regarding the model’s performance are highlighted in bold for each dataset.
Table 7. Comparisons between prediction models for mortality in the ICU (Group B vs. Group C).
Friedman TestOverall p-Values from the
Friedman Test
p-Values Adjusted by the Bonferroni Correction for Multiple Tests
Features Cytokines vs.
Routine Blood Analyses
Cytokines vs.
Hybrid Data
Routine Blood Analyses vs. Hybrid Data
Full datasets0.3680.4720.9990.999
Subsets achieved by the information gain algorithm<0.0010.0550.297<0.001
Statistically significant results at a 5% significance level are highlighted in bold.
Table 8. Naïve Bayes models for mortality in the ICU, i.e., discriminating between all discharged patients with/without IMV (Groups A and B) and deceased patients with IMV (Group C). Models were based full datasets or feature subsets of cytokines, routine blood analyses, or hybrid data selected by an information gain algorithm or univariate data analysis.
DatasetFeature Selection Mode Feature SubsetsAUCAccuracyPrecisionRecallSpecificity
CytokinesFull datasetAll 25 cytokines 0.7170.6600.7770.6600.757
Information gainCXCL9, IFN-γ, VEGF, IL-2R, IL-1RN, CCL5, IL-1β, PARK7, IL-15, IL-100.7270.6400.7680.6400.743
CXCL9, IFN-γ, VEGF, IL-2R, IL-1RN, CCL5, IL-1β, PARK7, IL-150.7130.6000.7140.6000.700
CXCL9, IFN-γ, VEGF, IL-2R, IL-1RN, CCL5, IL-1β, PARK70.7170.6600.7770.6600.757
CXCL9, IFN-γ, VEGF, IL-2R, IL-1RN, CCL5, IL-1β0.7400.6600.7770.6600.757
CXCL9, IFN-γ, VEGF, IL-2R, IL-1RN, CCL50.7770.6200.7590.6200.730
CXCL9, IFN-γ, VEGF, IL-2R, IL-1RN0.7680.6600.7770.6600.757
CXCL9, IFN-γ, VEGF, IL-2R0.6640.6200.6800.6200.680
CXCL9, IFN-γ, VEGF0.6290.6200.7000.6200.697
CXCL9, IFN-γ 0.6970.6000.6500.6000.650
CXCL90.6670.6000.5940.6000.550
Univariate
Analysis
IFN-β0.6420.6000.5940.6000.550
IFN-γ0.6140.5800.5840.5800.553
IL-2R0.6630.6800.6740.6800.680
VEGF0.5320.5000.5040.5000.467
IFN-β; IFN-γ; IL-2R; VEGF0.6750.6400.6650.6400.660
Routine blood analysesFull datasetAll 9 laboratory biomarkers 0.7280.6200.6640.6200.663
Information gainLymphocytes, RBCs, eosinophils, creatinine, LDH, platelets, CRP, neutrophils0.7400.6200.6640.6200.663
Lymphocytes, RBCs, eosinophils, creatinine, LDH, platelets, CRP 0.7450.70007200.7000.717
Lymphocytes, RBCs, eosinophils, creatinine, LDH, platelets0.7870.7600.7660.7600.757
Lymphocytes, RBCs, eosinophils, creatinine, LDH0.8370.8000.8140.8000.817
Lymphocytes, RBCs, eosinophils, creatinine0.8420.7600.7660.7600.757
Lymphocytes, RBCs, eosinophils0.8300.7400.7740.7400.777
Lymphocytes, RBCs0.8870.8200.8400.8200.847
Lymphocytes0.7430.6600.6630.6600.640
Univariate
Analysis
RBCs0.8130.8400.8450.8400.843
Cytokines and Routine blood analyses / Hybrid dataFull datasetAll 34 variables 0.8200.7500.8570.7500.875
Information gainLymphocytes, CXCL9, RBCs, IFN-γ, VEGF, IL-2R, IL-1RN, CCL5, IL-1β, PARK70.8250.6800.7860.6800.770
Lymphocytes, CXCL9, RBCs, IFN-γ, VEGF, IL-2R, IL-1RN, CCL5, IL-1β0.8530.7000.7950.7000.783
Lymphocytes, CXCL9, RBCs, IFN-γ, VEGF, IL-2R, IL-1RN, CCL50.8820.6400.7680.6400.743
Lymphocytes, CXCL9, RBCs, IFN-γ, VEGF, IL-2R, IL-1RN0.8850.6600.7770.6600.757
Lymphocytes, CXCL9, RBCs, IFN-γ, VEGF, IL-2R0.8180.6600.7770.6600.757
Lymphocytes, CXCL9, RBCs, IFN-γ, VEGF0.8590.6000.7500.6000.717
Lymphocytes, CXCL9, RBCs, IFN-γ0.8710.7000.7950.7000.783
Lymphocytes, CXCL9, RBCs0.8750.7800.8330.7800.837
Lymphocytes, CXCL90.7870.7800.8140.7800.820
Univariate
Analysis
IFN-β; IFN-γ; IL-2R; VEGF; lymphocytes; RBCs0.8230.6800.6730.6800.770
The highest results for each column regarding the model’s performances are highlighted in bold for each dataset.
Table 9. Comparisons between prediction models for mortality in the ICU (Groups A + B vs. Group C).
Overall p-Values from the Friedman Testp-Values Adjusted by the Bonferroni Correction for Multiple Tests
Features Cytokines vs.
Routine Blood Analyses
Cytokines vs.
Hybrid Data
Routines Blood Analyses vs. Hybrid Data
Full datasets0.3680.9990.4720.999
Subsets achieved by the information gain algorithm<0.0010.029<0.0010.716
Statistically significant results at a 5% significance level are highlighted in bold.
Table 10. Variables used for the best Naïve Bayes models, considering the three comparisons among groups.
GroupsTargetBest Serum CytokinesBest Routine Blood Analyses Best Hybrid Data
A vs. BNeed for IMVIL-1RN, CXCL10, CCL3, CXCL9, IL-7, HGF
(AUC = 0.810; R = Sp = 0.750)
LDH, RBCs
(AUC = 0.565; R = Sp = 0.575)
LDH, RBCs, CRP, IL-1RN, CXCL10, CCL3, CXCL9, IL-7, HGF
(AUC = 0.891; R = Sp = 0.850)
B vs. CMortality in the ICU, among patients with IMV IL-10, HGF
(AUC = 0.772; R = Sp = 0.775)
Lymphocytes
(AUC = 0.708; R = Sp = 0.725)
Lymphocytes, IL-2R, HGF
(AUC = 0.774; R = Sp = 0.725)
A + B vs. CMortality in the ICU, among patients with/ without IMVCXCL9, IFN-γ, VEGF, IL-2R, IL-1RN
(AUC = 0.768; R = 0.660; Sp = 0.757)
Lymphocytes, RBCs
(AUC = 0.887; R = 0.820; Sp = 0.847)
Lymphocytes, CXCL9, RBCs
(AUC = 0.875; R = 0.780; Sp = 0.837)
The table presents models built using the information gain algorithm. The best model for each comparison is highlighted in bold. R Recall; Sp Specificity.
Disclaimer/Publisher’s Note: The statements, opinions and data contained in all publications are solely those of the individual author(s) and contributor(s) and not of MDPI and/or the editor(s). MDPI and/or the editor(s) disclaim responsibility for any injury to people or property resulting from any ideas, methods, instructions or products referred to in the content.

