


An Empirical Analysis of Crash Injury Severity Among Young Drivers in England: Accounting for Data Imbalance


 ,
,  and
and
Abstract
Featured Application
Abstract
1. Introduction
- How can the severity of crashes involving young drivers (aged 17–24) in England be accurately predicted?
- What are the influential factors affecting crash severity, also considering specific traffic dynamics and behavioral trends observed during the study period?
2. Background
2.1. Driving Experience
2.2. Young Drivers’ Crash Risk
2.3. Research Gap and Objectives
3. Methodology
3.1. Overview
3.2. Model Selection
3.3. Model Evaluation Metrics
3.4. Data
4. Results
5. Discussion
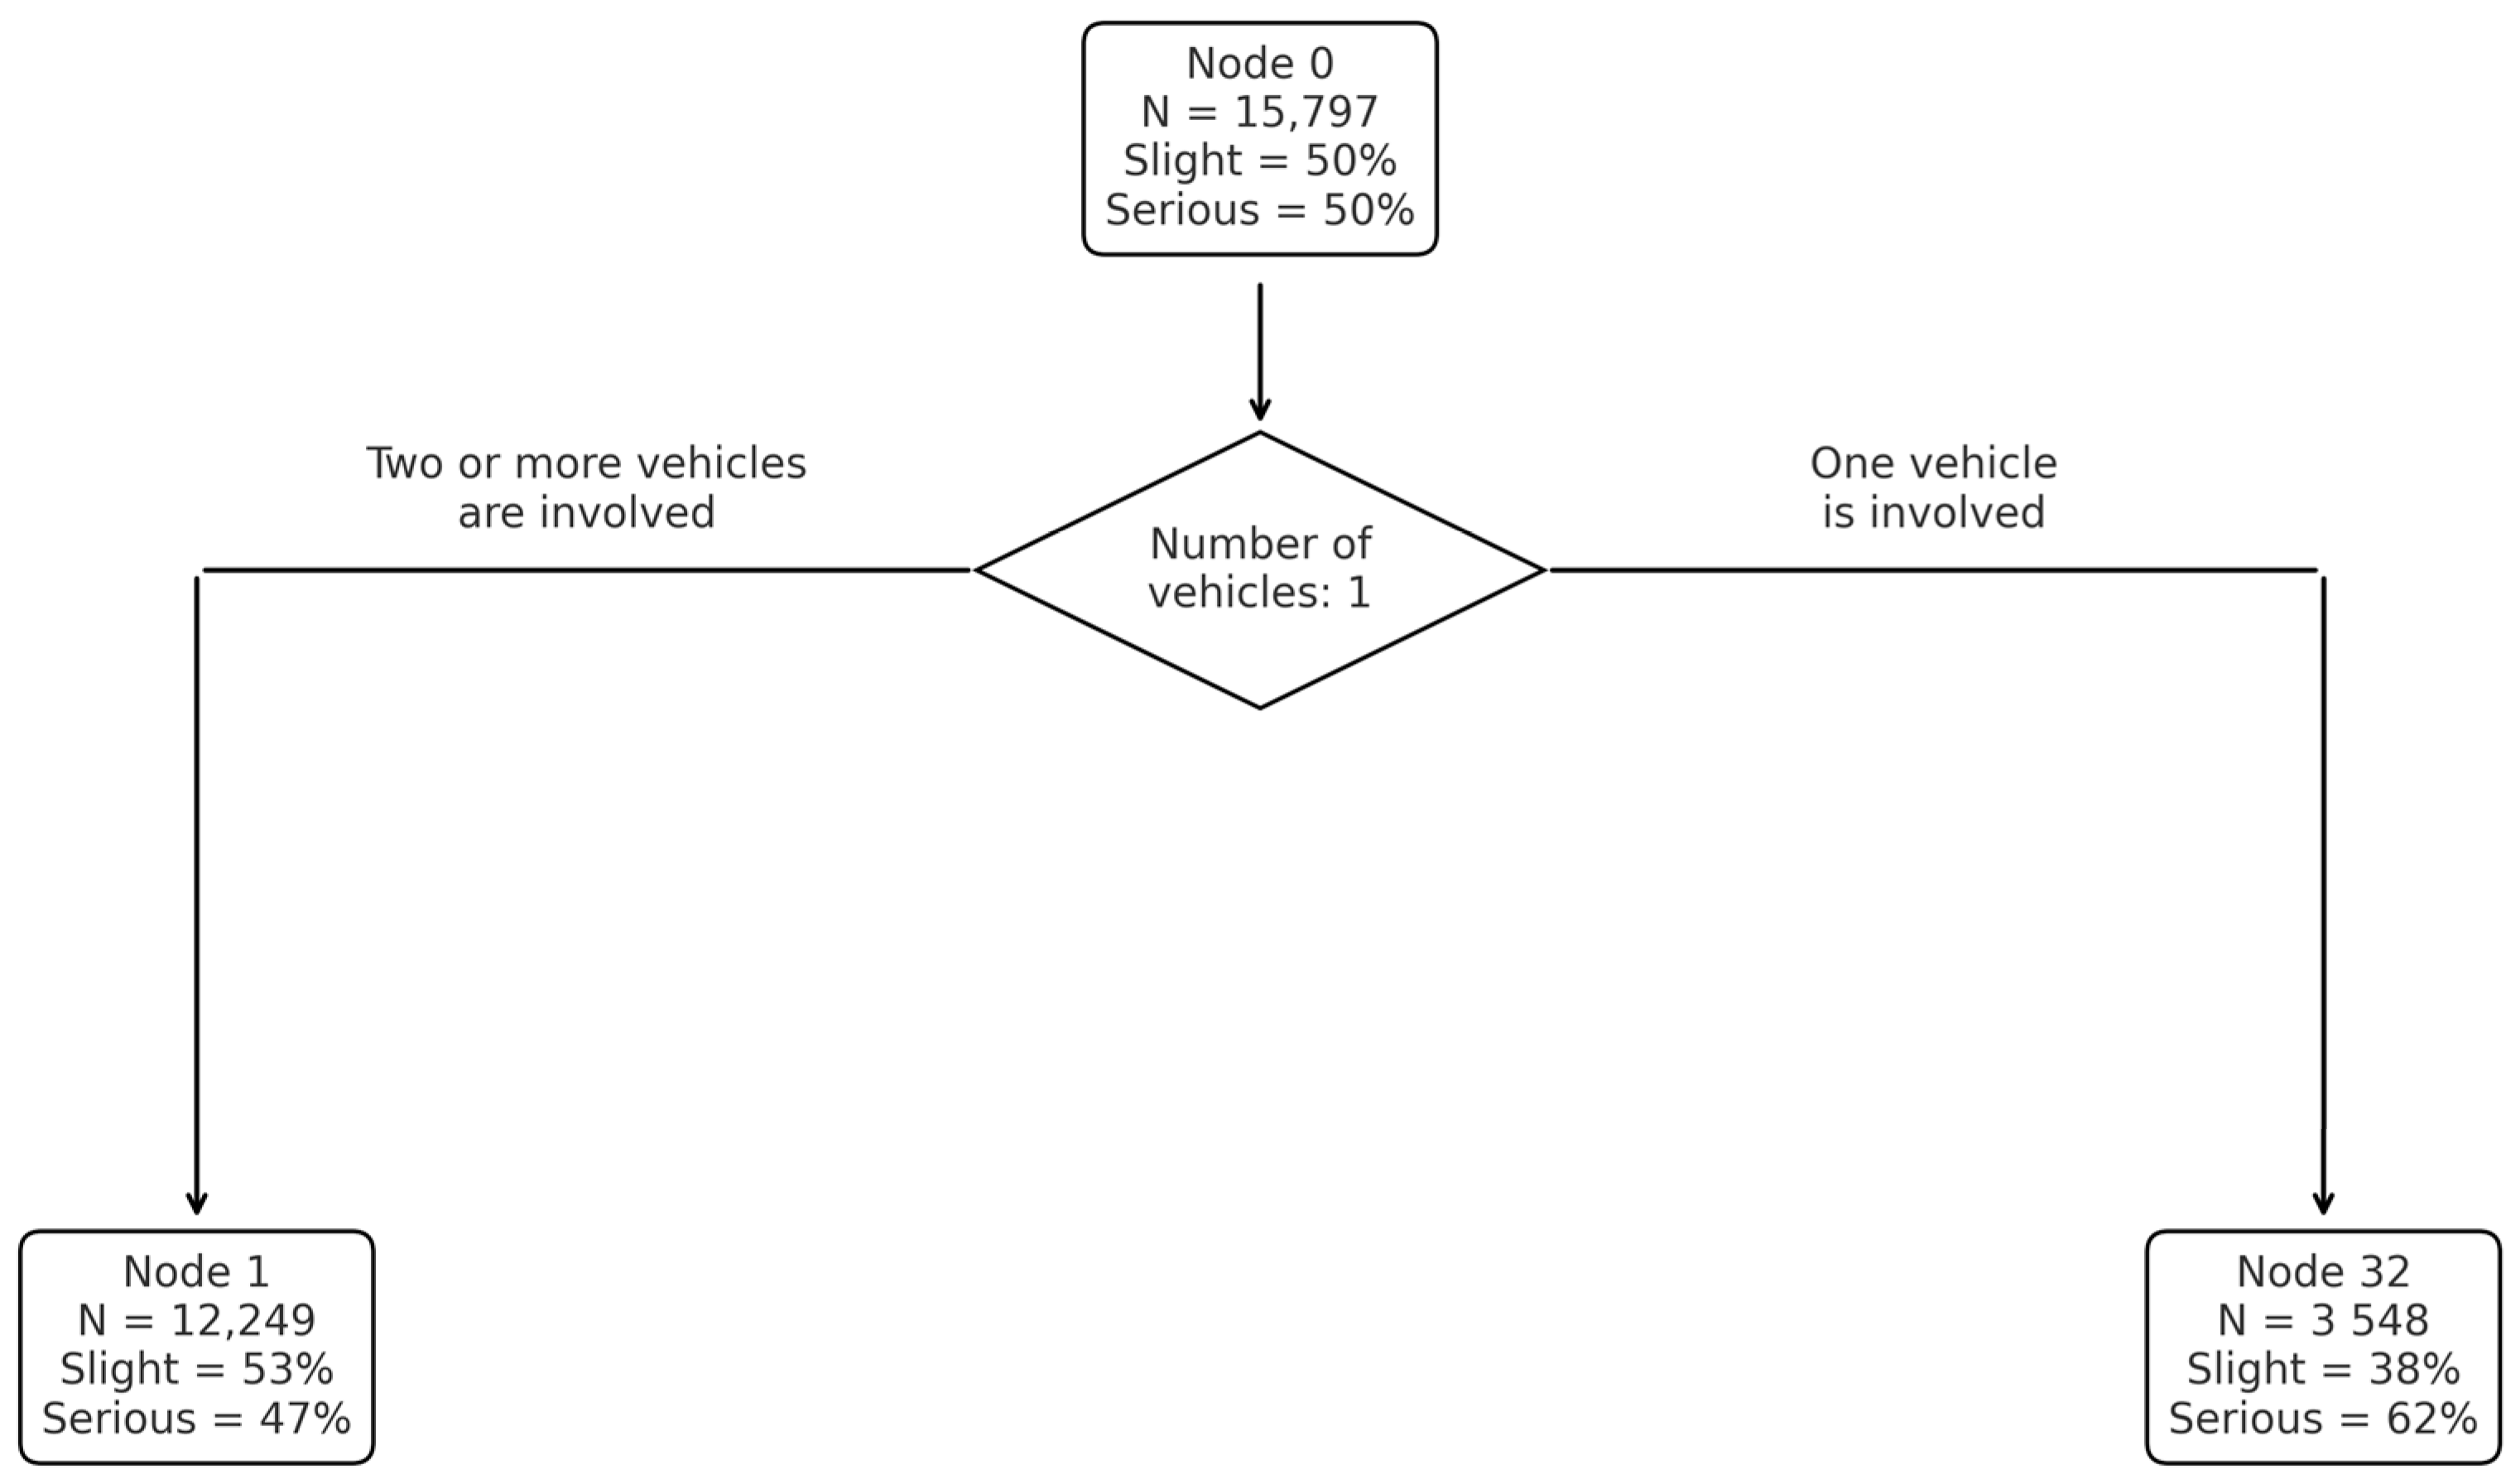
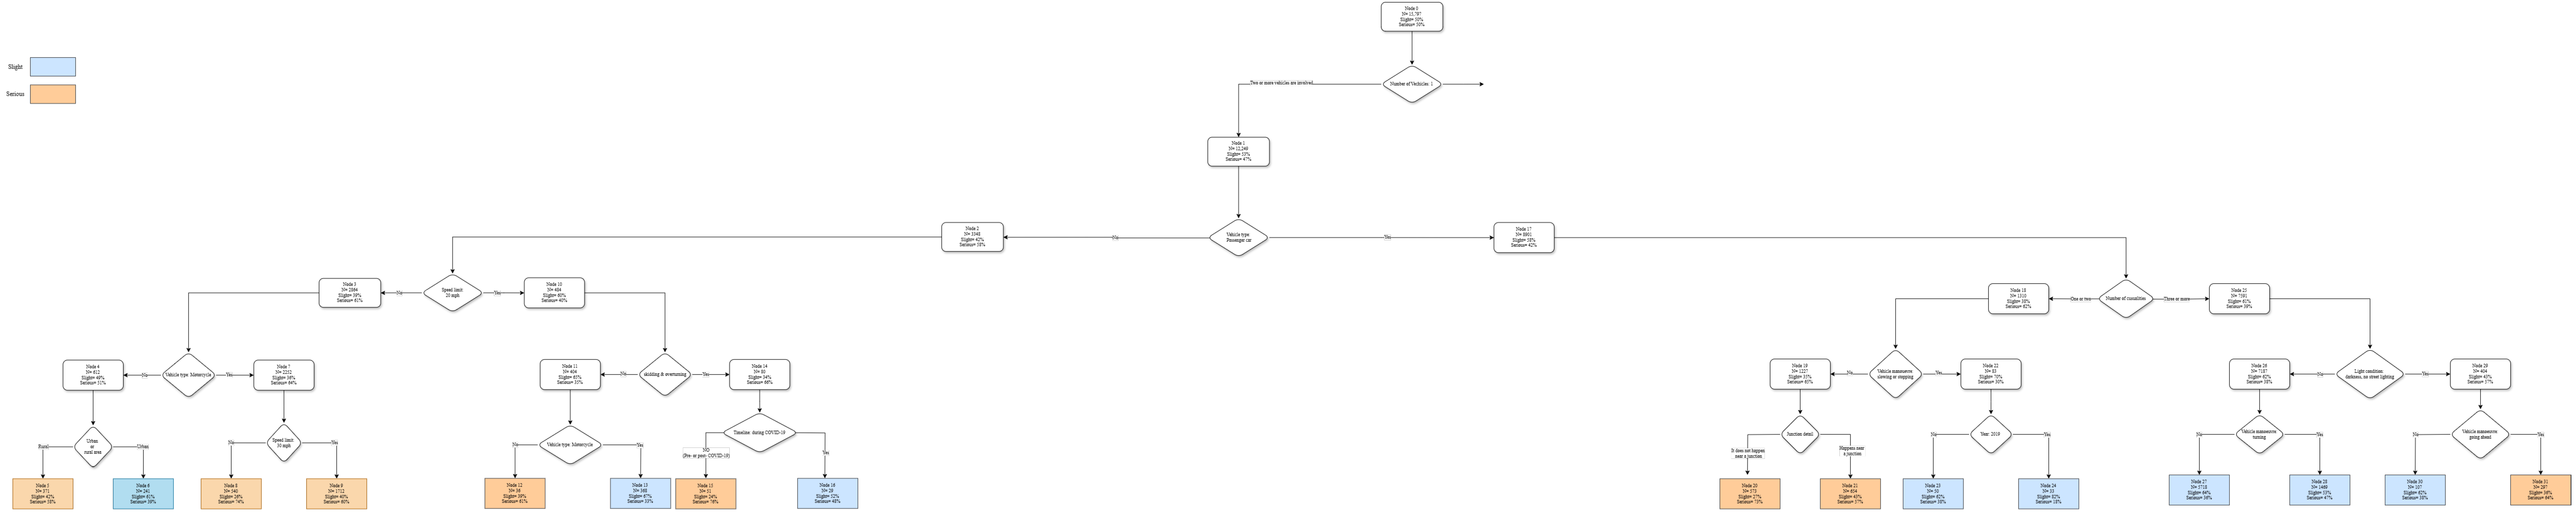
5.1. CART and RUMC-CART Comparison for Young Drivers
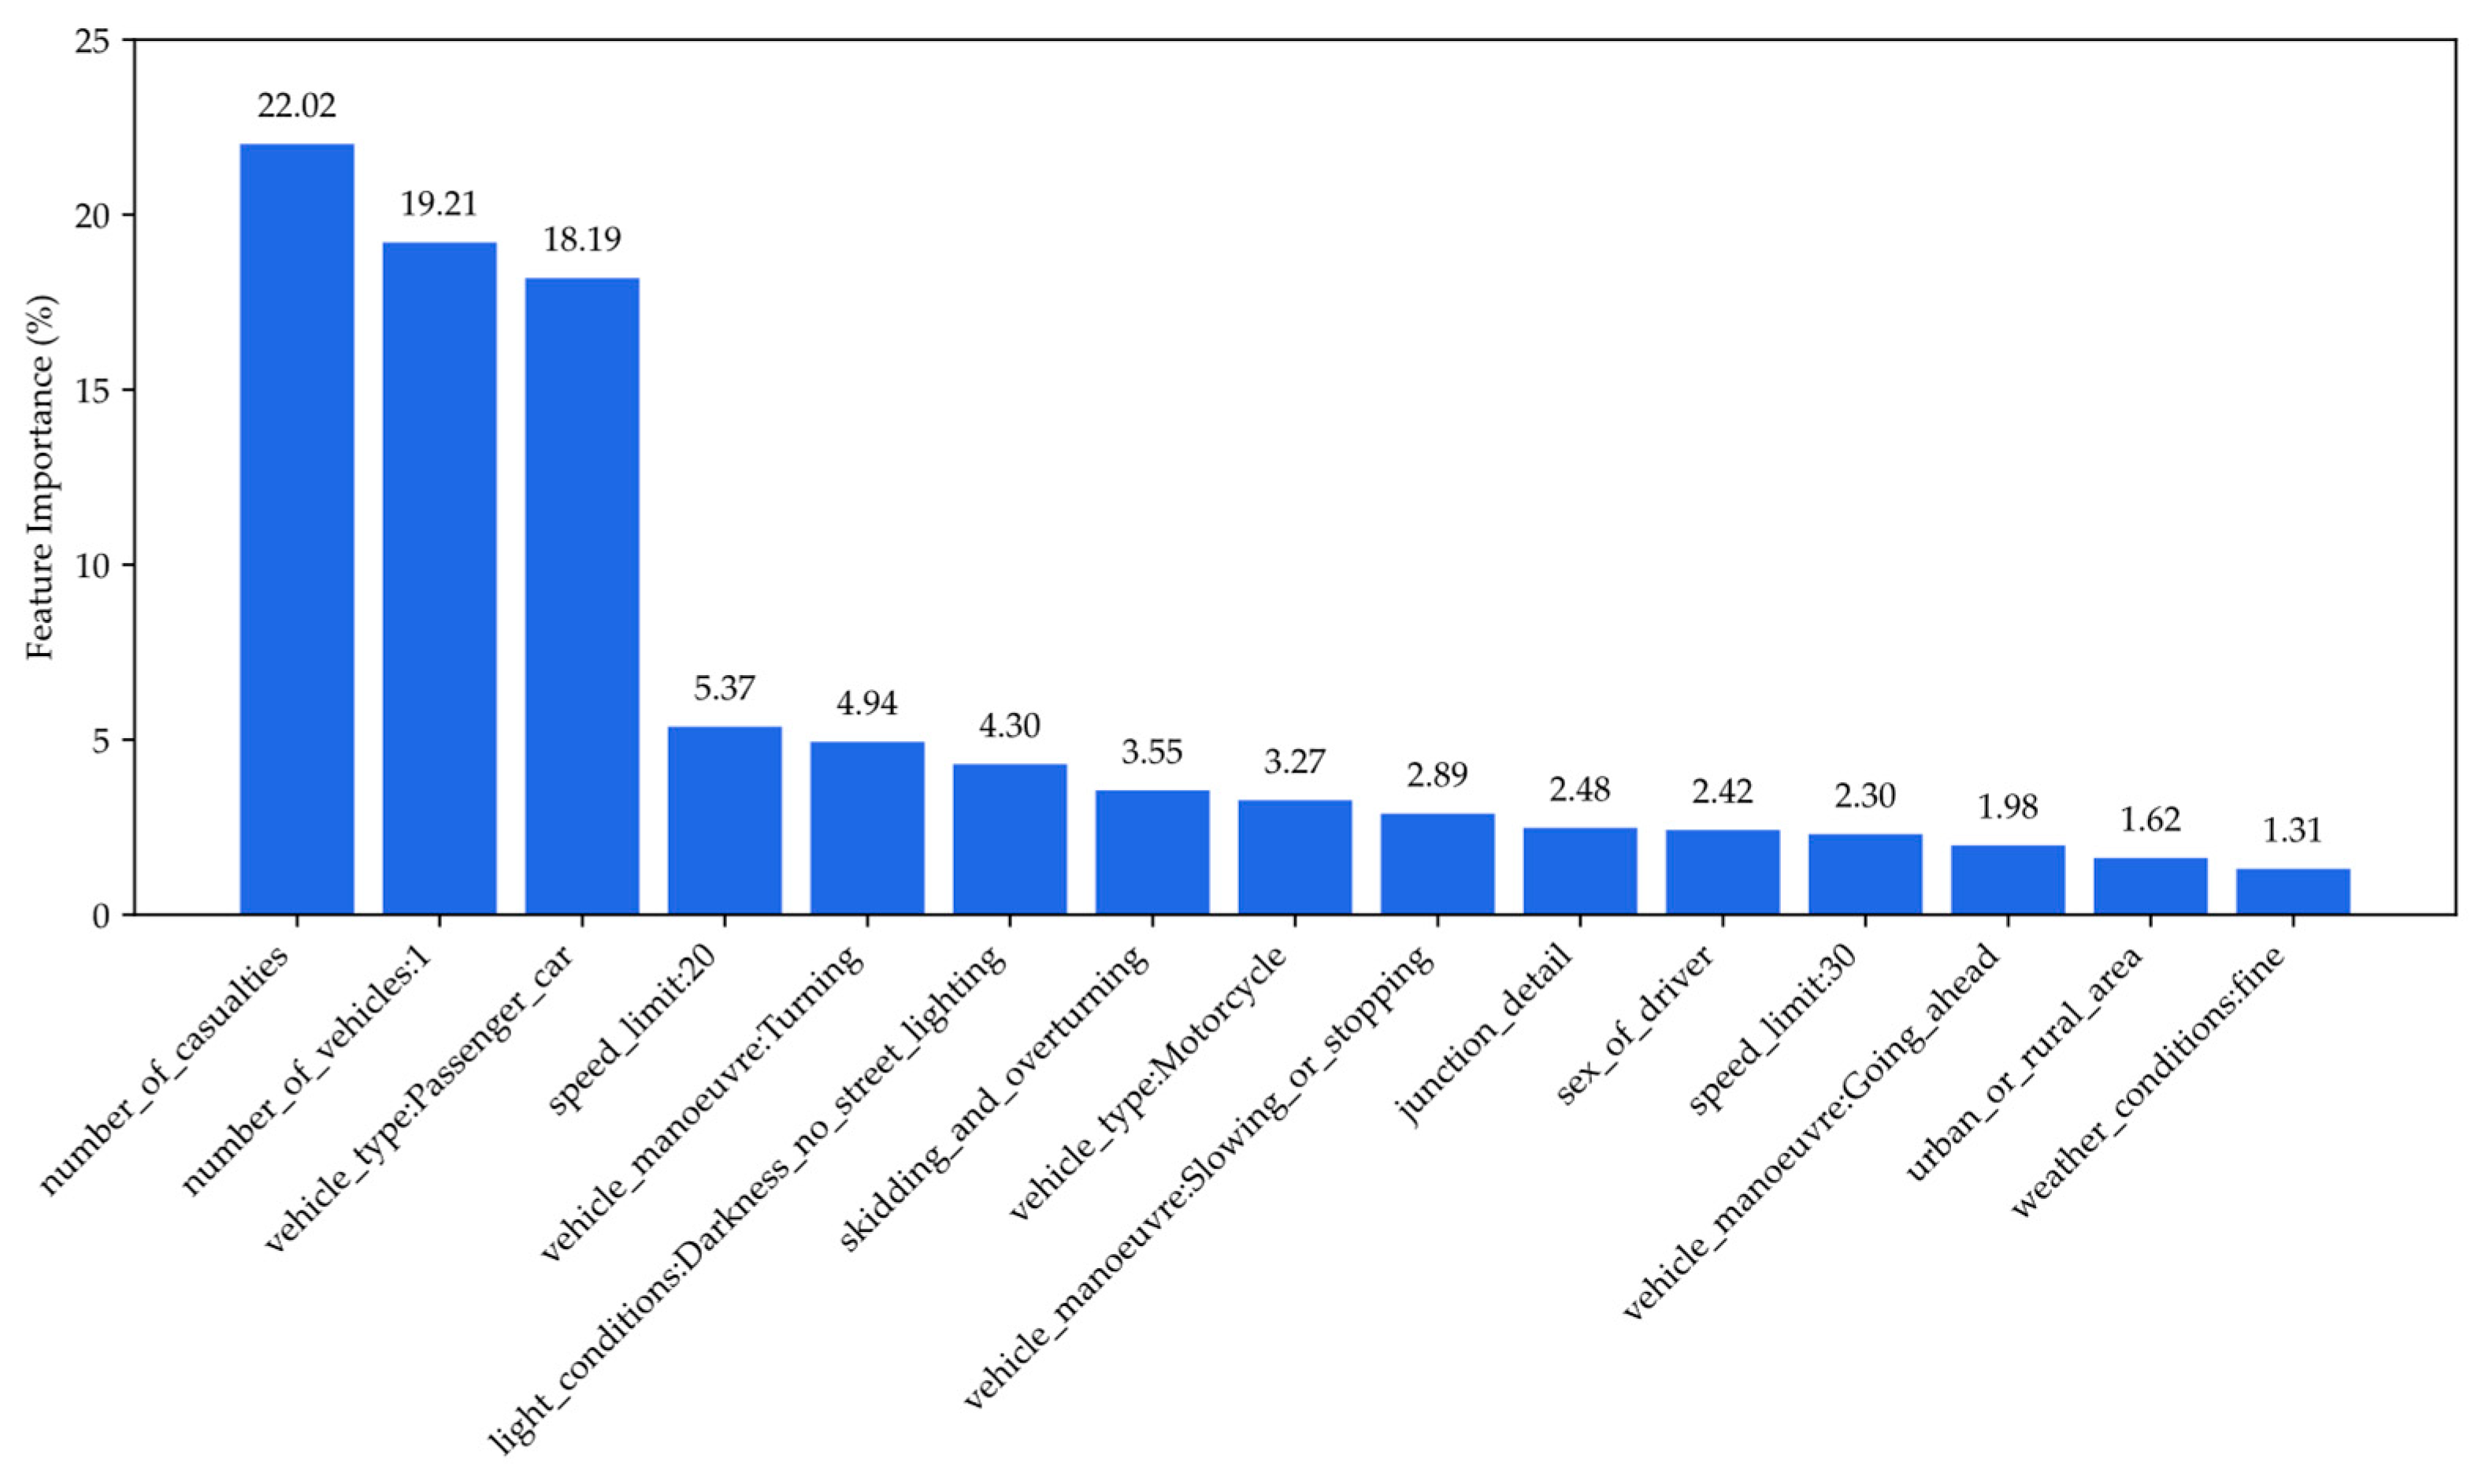
5.2. Feature Importance Analysis for Young Drivers
5.3. Policy Implications
6. Conclusions
Author Contributions
Funding
Institutional Review Board Statement
Informed Consent Statement
Data Availability Statement
Conflicts of Interest
Abbreviations
| CART | Classification and regression trees |
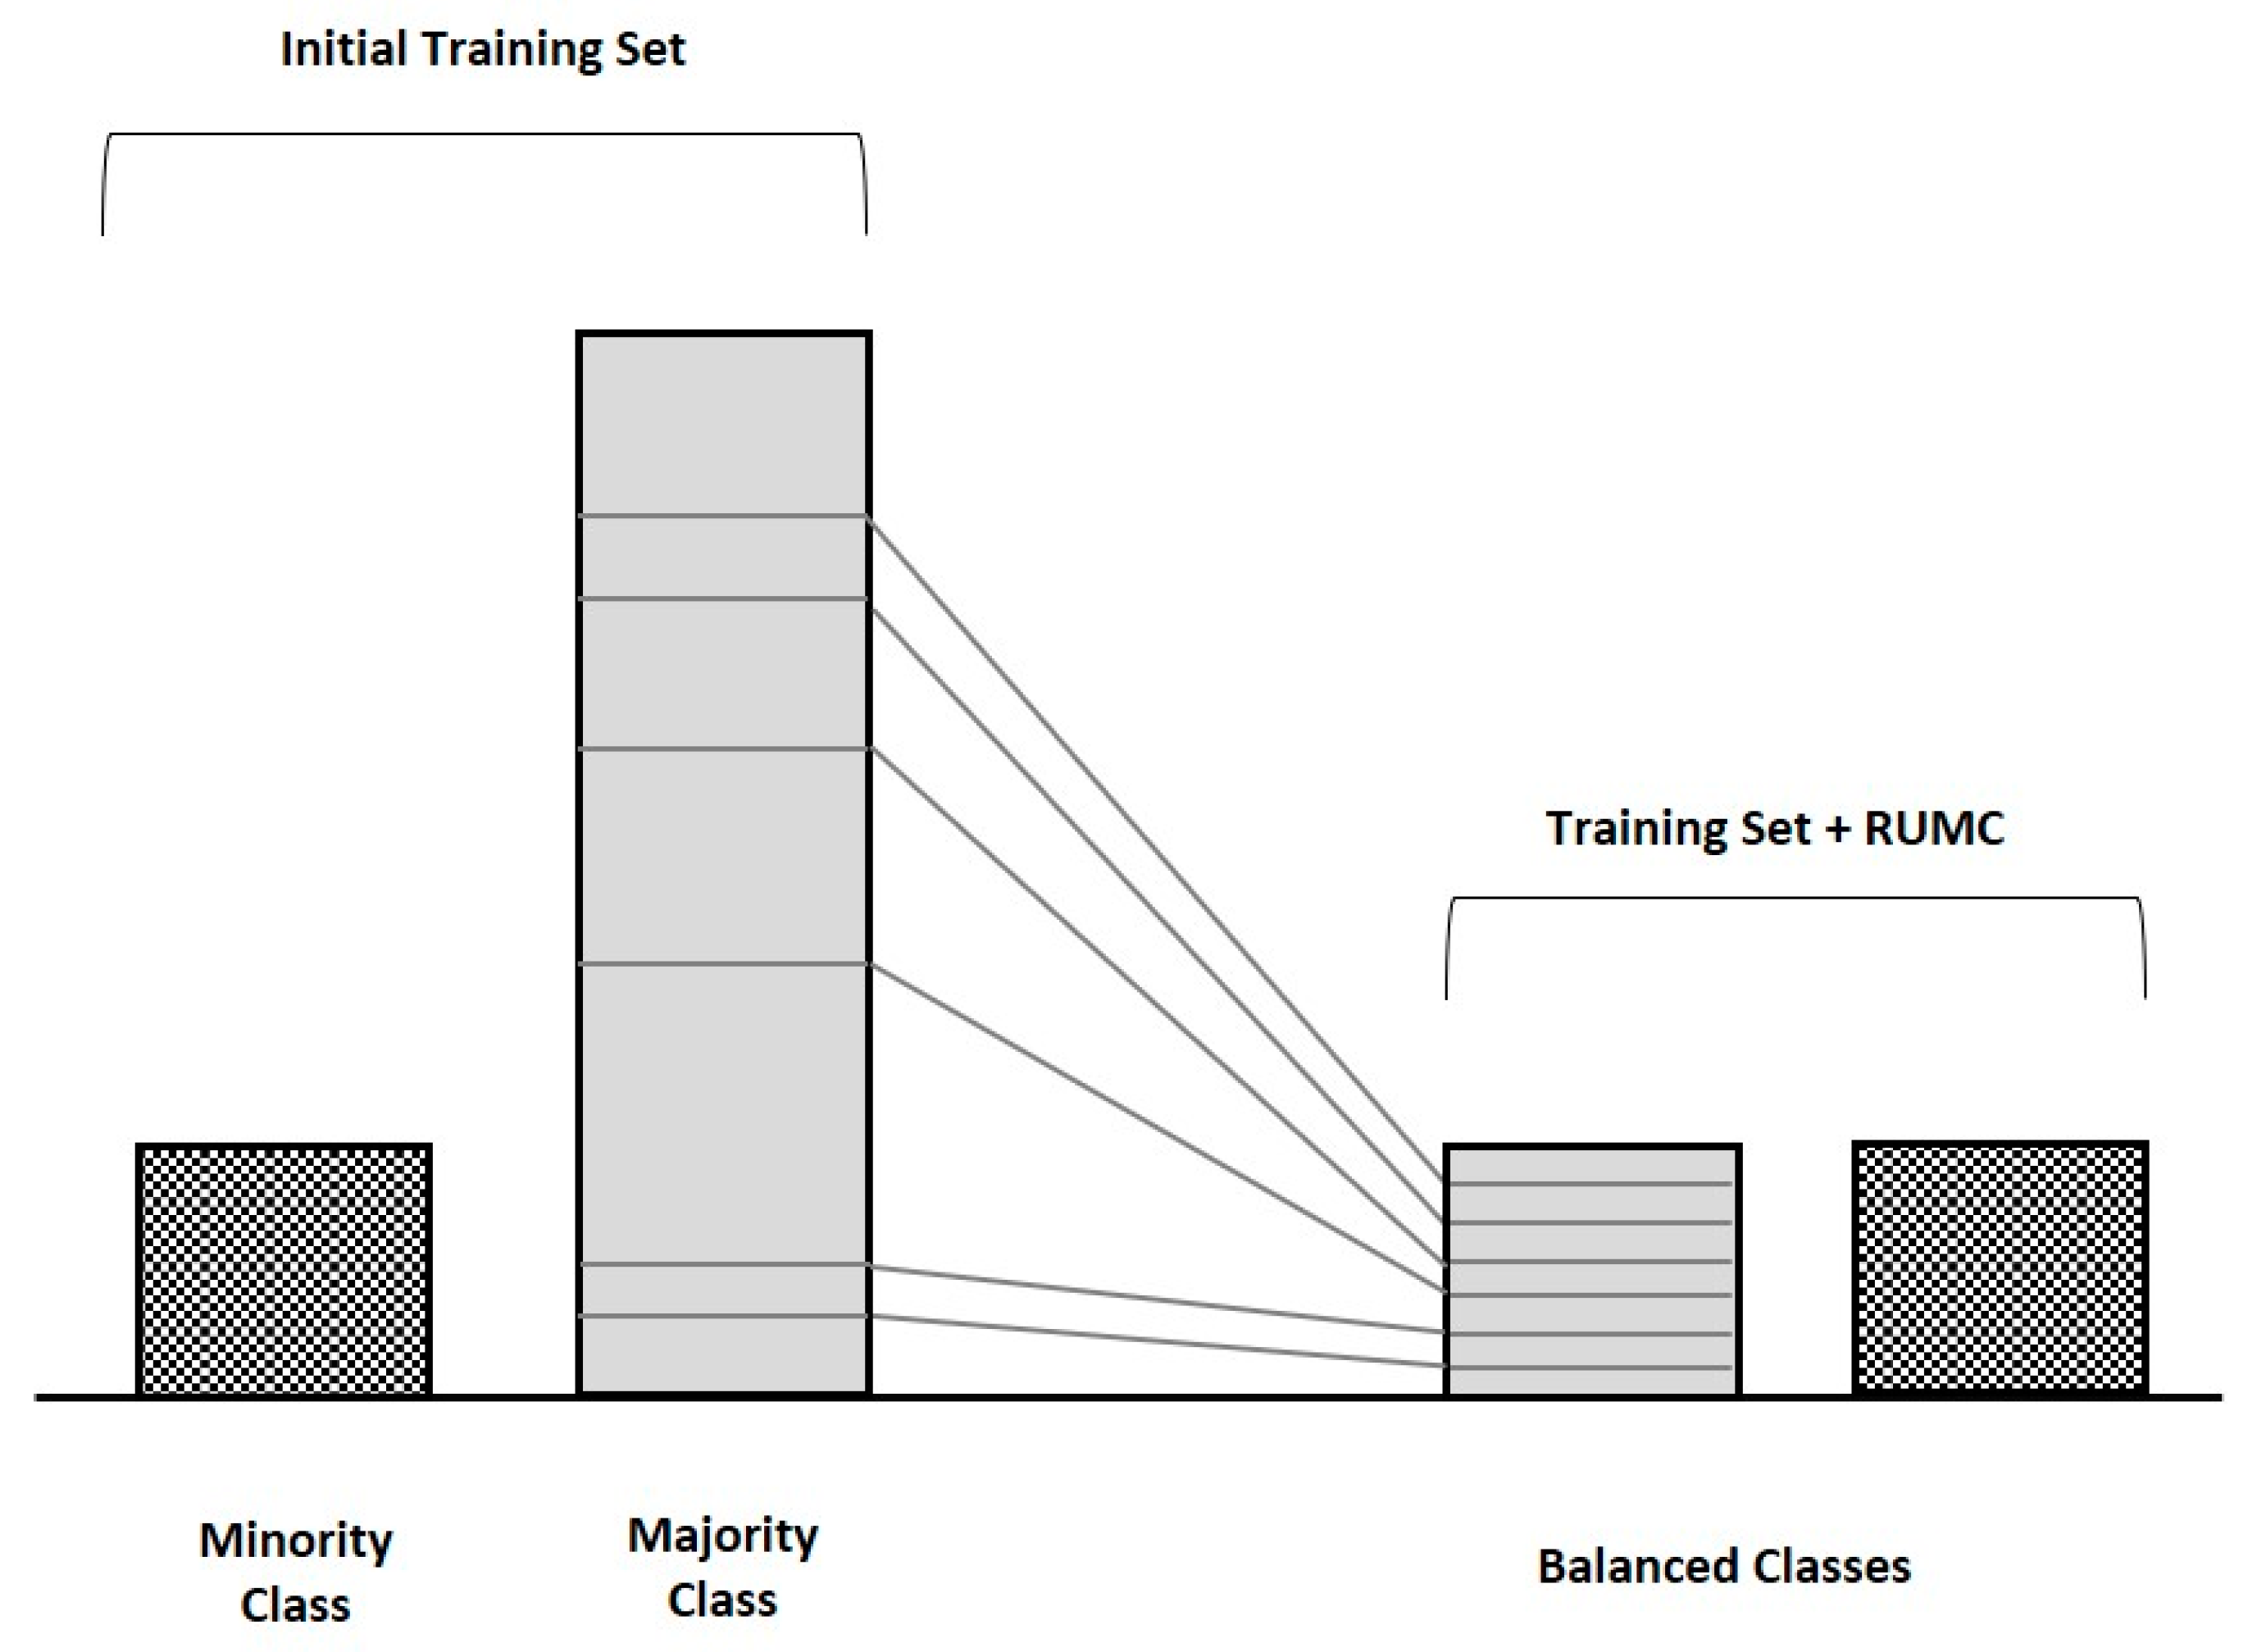
| RUMC | Random undersampling of the majority class |
| WHO | World Health Organization |
| UK | United Kingdom |
| ROC | Receiver operating characteristic |
| TP | True positive |
| TN | True negative |
| TPR | True positive rate |
| FP | False positive |
| FPR | False positive rate |
| AUC | Area under the curve |
| FN | False negative |
Appendix A

| Attribute | Characteristics | Description |
|---|---|---|
| Crash severity | Combined fatal and serious injury | Broken neck or back, fractures etc. Death due to the consequences of the accident |
| Slight injury | All other injuries apart from fatal or serious | |
| Number of casualties | 1–2 | 1–2 people injured |
| >2 | More than 2 people injured | |
| Day of week | Working day | Monday–Friday |
| Weekend | Saturday and Sunday | |
| Junction detail | Junction exists | Near a junction |
| No junction | Not at or within 20 m of a junction | |
| Pedestrian crossing physical facilities | Physical facilities exist | Pedestrian crossing exists |
| No physical facilities | Pedestrian crossing does not exist | |
| Road surface conditions | Dry | Dry conditions |
| Not dry | Wet/damp, snow, frost/ice, flood | |
| Urban or rural area | Urban | Urban areas |
| rural | Rural areas | |
| Towing and articulation | Towing/articulation exists | Articulated vehicle, double or multiple trailer, caravan, single trailer, other tow |
| No towing/articulation | Not existing | |
| Skidding and overturning | Skidding/overturning exists | Skidded, overturned, jack-knifed |
| No skidding/overturning | No skidding, jack-knifing or overturning | |
| Hit object in carriageway | Object hit | Roadworks, bridges, etc. |
| No object hit | No collision with objects in carriageway | |
| Hit object off carriageway | Object hit | Road sign, tree, etc. |
| No object hit | No collision with object off carriageway | |
| Vehicle leaving carriageway | Left carriageway | Nearside, straight, offside |
| Did not leave carriageway | No leaving | |
| Sex of driver | Male | Male driver |
| Female | Female driver | |
| Age of vehicle | 0–9 | Vehicle is 0–9 years old |
| 10–19 | Vehicle is 10–19 years old | |
| 20–96 | Vehicle is 20–96 years old | |
| Number of vehicles | 1 | 1 vehicle involved |
| 2 | 2 vehicles involved | |
| 3+ | 3+ vehicles involved | |
| Speed limit | 20 | Limit: 20 mph (32 km/h) |
| 30 | Limit: 30 mph (48 km/h) | |
| 40 | Limit: 40 mph (64 km/h) | |
| 50+ | Limit: 50+ mph (80+ km/h) | |
| Weather conditions | Fine | Good weather |
| Raining | It is raining | |
| Snowing | It is snowing | |
| Fog or mist | Fog or mist—if hazard | |
| Other | Other than above | |
| Road type | Roundabout | Roundabout (all sizes) |
| One-way street | One-way street | |
| Dual carriageway | Dual carriageway | |
| Single carriageway | Single carriageway | |
| Slip road | Slip road | |
| Vehicle maneuver | Reversing | Reversing |
| Parked | Parked | |
| Waiting | Waiting to go ahead/turn left/right | |
| Slowing or stopping | Slowing or stopping | |
| Moving off | Moving off | |
| Turning | Left/right | |
| Changing lane | To right/left | |
| Overtaking | Moving/stationary vehicle on offside or on nearside | |
| Going ahead | Left hand bend, right hand bend, other | |
| Vehicle type | Motorcycle | All cc-sizes |
| Passenger car | Passenger car | |
| Bus | Bus or coach | |
| Agricultural vehicle | Includes diggers, etc. | |
| Tram/light rail | Tram/light rail | |
| Van/goods | Van/goods of all weights | |
| Lighting conditions | Daylight | Daylight |
| Darkness (streetlights present and lit) | Darkness (streetlights present and lit) | |
| Darkness (streetlights present but unlit) | Darkness (streetlights present but unlit) | |
| Darkness (no street lighting) | Darkness (no street lighting) | |
| Year | 2019 | 7 April 2019–31 December 2019 |
| 2020 | 1 January 2020–31 December 2020 | |
| 2021 | 1 January 2021–31 December 2021 | |
| 2022 | 1 January 2022–1 February 2022 | |
| Hour | Night | 22:00–05:59 |
| Morning | 06:00–09:59 | |
| Noon | 10:00–17:59 | |
| Evening | 18:00–21:59 | |
| Timeline | Pre-COVID-19 | 7 April 2019–15 March 2020 |
| During COVID-19 | 16 March 2020–22 February 2021 | |
| After COVID-19 | 23 February 2021–1 February 2022 |
References
- Daoud, R.; Vechione, M.; Gurbuz, O.; Sundaravadivel, P.; Tian, C. Comparison of machine learning models to predict nighttime crash severity: A case study in Tyler, Texas, USA. Vehicles 2025, 7, 20. [Google Scholar] [CrossRef]
- Ahmed, S.K.; Mohammed, M.G.; Abdulqadir, S.O.; El-Kader, R.G.A.; El-Shall, N.A.; Chandran, D.; Rehman, M.E.U.; Dhama, K. Road traffic accidental injuries and deaths: A neglected global health issue. Health Sci. Rep. 2023, 6, e1240. [Google Scholar] [CrossRef] [PubMed]
- Abdel-Aty, M.; Ugan, J.; Islam, Z. Exploring the influence of drivers’ visual surroundings on speeding behavior. Accid. Anal. Prev. 2024, 198, 107479. [Google Scholar] [CrossRef]
- Feyzollahi, M.; Pineau, P.-O.; Rafizadeh, N. Drivers of Driving: A Review. Sustainability 2024, 16, 2479. [Google Scholar] [CrossRef]
- Zhu, Y.; Qian, Y.; Xu, J.; Hu, W. Young novice drivers’ road crash injuries and contributing factors: A crash data investigation. Traffic Inj. Prev. 2024, 25, 1031–1038. [Google Scholar] [CrossRef] [PubMed]
- Zhu, Y.; Jiang, M.; Yamamoto, T. Does a cautious driving style reduce the crash risk of older drivers? An analysis using a novel driving style recognition method. Transp. Res. Part F Traffic Psychol. Behav. 2024, 104, 72–87. [Google Scholar] [CrossRef]
- Krasniuk, S.; Toxopeus, R.; Knott, M.; McKeown, M.; Crizzle, A.M. The effectiveness of driving simulator training on driving skills and safety in young novice drivers: A systematic review of interventions. J. Saf. Res. 2024, 91, 20–37. [Google Scholar] [CrossRef]
- Faridiaghdam, A.; Mirzahossein, H.; Rassafi, A.A.; Khanpour, A. Exploring the cognitive and behavioral factors impacting novice young drivers: Structural equation modeling of situational awareness, driving skills, reported crash history, and violations, using a driving simulator. Transp. Res. Part F Traffic Psychol. Behav. 2025, 111, 130–144. [Google Scholar] [CrossRef]
- Borowsky, A.; Shinar, D.; Oron-Gilad, T. Age, skill, and hazard perception in driving. Accid. Anal. Prev. 2010, 42, 1240–1249. [Google Scholar] [CrossRef]
- Coyne, R.; Hanlon, M.; Smeaton, A.F.; Corcoran, P.; Walsh, J.C. Understanding drivers’ perspectives on the use of driver monitoring systems during automated driving: Findings from a qualitative focus group study. Transp. Res. Part F Traffic Psychol. Behav. 2024, 105, 321–335. [Google Scholar] [CrossRef]
- Scialfa, C.T.; Deschênes, M.C.; Ference, J.; Boone, J.; Horswill, M.S.; Wetton, M. A hazard perception test for novice drivers. Accid. Anal. Prev. 2011, 43, 204–208. [Google Scholar] [CrossRef] [PubMed]
- Xu, Y.; Li, Y.; Jiang, L. The effects of situational factors and impulsiveness on drivers’ intentions to violate traffic rules: Difference of driving experience. Accid. Anal. Prev. 2014, 62, 54–62. [Google Scholar] [CrossRef] [PubMed]
- Bakhtiari, S.; Zhang, T.; Zafian, T.; Samuel, S.; Knodler, M.; Fitzpatrick, C.; Fisher, D.L. Effect of visual and auditory alerts on older drivers’ glances toward latent hazards while turning left at intersections. Transp. Res. Rec. 2019, 2673, 117–126. [Google Scholar] [CrossRef]
- Shariatmadari, K.; Samuel, S.; Cao, S.; Singh, A. Comparison of Two-Level and Three-Level Graded Collision Warning Systems under Distracted Driving Conditions. IEEE Access 2025, 13, 43818–43829. [Google Scholar] [CrossRef]
- Wright, C.J.; Dietze, P.M.; Crockett, B.; Lim, M.S. Participatory development of MIDY (Mobile Intervention for Drinking in Young people). BMC Public. Health 2016, 16, 184. [Google Scholar] [CrossRef] [PubMed]
- Fountas, G.; Pantangi, S.S.; Hulme, K.F.; Anastasopoulos, P.C. The effects of driver fatigue, gender, and distracted driving on perceived and observed aggressive driving behavior: A correlated grouped random parameters bivariate probit approach. Anal. Methods Accid. Res. 2019, 22, 100091. [Google Scholar] [CrossRef]
- Adavikottu, A.; Velaga, N.R. Modeling the impact of driving aggression on lane change performance measures: Steering compensatory behavior, lane change execution duration and crash probability. Transp. Res. Part F Traffic Psychol. Behav. 2024, 103, 526–553. [Google Scholar] [CrossRef]
- Sadeghi, P.; Goli, A. Investigating the impact of pavement condition and weather characteristics on road accidents. Int. J. Crashworthiness 2024, 29, 973–989. [Google Scholar] [CrossRef]
- Duddu, V.R.; Kukkapalli, V.M.; Pulugurtha, S.S. Crash risk factors associated with injury severity of teen drivers. IATSS Res. 2019, 43, 37–43. [Google Scholar] [CrossRef]
- Rahman, M.A.; Hossain, M.M.; Mitran, E.; Sun, X. Understanding the contributing factors to young driver crashes: A comparison of crash profiles of three age groups. Transp. Eng. 2021, 5, 100076. [Google Scholar] [CrossRef]
- Williams, A.F. Teenage drivers: Patterns of risk. J. Saf. Res. 2003, 34, 5–15. [Google Scholar] [CrossRef] [PubMed]
- Scott-Parker, B.; Oviedo-Trespalacios, O. Young driver risky behaviour and predictors of crash risk in Australia, New Zealand and Colombia: Same but different? Accid. Anal. Prev. 2017, 99, 30–38. [Google Scholar] [CrossRef] [PubMed]
- Islam, M.; Hosseini, P.; Kakhani, A.; Jalayer, M.; Patel, D. Unveiling the risks of speeding behavior by investigating the dynamics of driver injury severity through advanced analytics. Sci. Rep. 2024, 14, 22431. [Google Scholar] [CrossRef]
- Das, A.; Ahmed, M.M.; Ghasemzadeh, A. Using trajectory-level SHRP2 naturalistic driving data for investigating driver lane-keeping ability in fog: An association rules mining approach. Accid. Anal. Prev. 2019, 129, 250–262. [Google Scholar] [CrossRef] [PubMed]
- Hossain, A.; Sun, X.; Islam, S.; Rahman, A.; Das, S. Single-vehicle roadway departure crashes at rural two-lane highway curved segments: A diagnosis using pattern recognition. Int. J. Transp. Sci. Technol. 2024, 15, 298–318. [Google Scholar] [CrossRef]
- Lewis-Evans, B. Crash involvement during the different phases of the New Zealand Graduated Driver Licensing System (GDLS). J. Saf. Res. 2010, 41, 359–365. [Google Scholar] [CrossRef]
- Xue, G.; Liu, L. Real-world crash configurations and traffic violations among newly licensed young drivers with different route familiarity levels. Traffic Inj. Prev. 2024, 25, 673–679. [Google Scholar] [CrossRef]
- French, D.; Gerona, R.R. Alcohol and Drug Testing in Motor Vehicle Crashes. Clin. Lab. Med. 2025. [Google Scholar] [CrossRef]
- Fell, J.C.; Waehrer, G.; Voas, R.B.; Auld-Owens, A.; Carr, K.; Pell, K. Effects of enforcement intensity on alcohol impaired driving crashes. Accid. Anal. Prev. 2014, 73, 181–186. [Google Scholar] [CrossRef]
- Paleti, R.; Eluru, N.; Bhat, C.R. Examining the influence of aggressive driving behavior on driver injury severity in traffic crashes. Accid. Anal. Prev. 2010, 42, 1839–1854. [Google Scholar] [CrossRef]
- Ortmann, N.; Haddad, Y.K.; Beck, L. Special report from the CDC: Provider knowledge and practices around driving safety and fall prevention screening and recommendations for their older adult patients, DocStyles 2019. J. Saf. Res. 2023, 86, 401–408. [Google Scholar] [CrossRef]
- Fiorentini, N.; Losa, M. Handling imbalanced data in road crash severity prediction by machine learning algorithms. Infrastructures 2020, 5, 61. [Google Scholar] [CrossRef]
- Obasi, I.C.; Benson, C. Evaluating the effectiveness of machine learning techniques in forecasting the severity of traffic accidents. Heliyon 2023, 9, e18812. [Google Scholar] [CrossRef] [PubMed]
- Aldred, R. Inequalities in self-report road injury risk in Britain: A new analysis of National Travel Survey data, focusing on pedestrian injuries. J. Transp. Health 2018, 9, 96–104. [Google Scholar] [CrossRef]
- Fountas, G.; Fonzone, A.; Gharavi, N.; Rye, T. The joint effect of weather and lighting conditions on injury severities of single-vehicle accidents. Anal. Methods Accid. Res. 2020, 27, 100124. [Google Scholar] [CrossRef]
- Mehdizadeh, A.; Cai, M.; Hu, Q.; Alamdar Yazdi, M.A.; Mohabbati-Kalejahi, N.; Vinel, A.; Rigdon, S.E.; Davis, K.C.; Megahed, F.M. A review of data analytic applications in road traffic safety. Part 1: Descriptive and predictive modeling. Sensors 2020, 20, 1107. [Google Scholar] [CrossRef]
- Taheri, A.; Azarasa, N.; Iranmanesh, M.; Seyedabrishami, S.; O’Hern, S.; Lord, D. The influences of strict and post-strict lockdowns due to the Covid-19 pandemic on crash severity on rural roads: A case study of Khorasan Razavi, Iran. Transp. Res. Part F Traffic Psychol. Behav. 2023, 97, 231–245. [Google Scholar] [CrossRef]
- Werner de Vargas, V.; Schneider Aranda, J.A.; dos Santos Costa, R.; da Silva Pereira, P.R.; Victória Barbosa, J.L. Imbalanced data preprocessing techniques for machine learning: A systematic mapping study. Knowl. Inf. Syst. 2023, 65, 31–57. [Google Scholar] [CrossRef]
- Semple, T.; Fountas, G.; Fonzone, A. Who is more likely (not) to make home-based work trips during the COVID-19 pandemic? The case of Scotland. Transp. Res. Rec. 2023, 2677, 904–916. [Google Scholar] [CrossRef]
- Hatfield, J.; Fernandes, R. The role of risk-propensity in the risky driving of younger drivers. Accid. Anal. Prev. 2009, 41, 25–35. [Google Scholar] [CrossRef]
- Olszewski, P.; Szagała, P.; Rabczenko, D.; Zielińska, A. Investigating safety of vulnerable road users in selected EU countries. J. Saf. Res. 2019, 68, 49–57. [Google Scholar] [CrossRef] [PubMed]
- Kockelman, K.M.; Kweon, Y.-J. Driver injury severity: An application of ordered probit models. Accid. Anal. Prev. 2002, 34, 313–321. [Google Scholar] [CrossRef] [PubMed]
- Knight, P.J.; Iverson, D.; Harris, M.F. Early driving experience and influence on risk perception in young rural people. Accid. Anal. Prev. 2012, 45, 775–781. [Google Scholar] [CrossRef]
- Gray, R.C.; Quddus, M.A.; Evans, A. Injury severity analysis of accidents involving young male drivers in Great Britain. J. Saf. Res. 2008, 39, 483–495. [Google Scholar] [CrossRef] [PubMed]
- Ehsani, J.P.; Seymour, K.E.; Chirles, T.; Kinnear, N. Developing and testing a hazard prediction task for novice drivers: A novel application of naturalistic driving videos. J. Saf. Res. 2020, 73, 303–309. [Google Scholar] [CrossRef]
- Olowosegun, A.; Fountas, G.; Davis, A. Effective trigger speeds for vehicle activated signs on 20 mph roads in rural areas. Safety 2024, 10, 25. [Google Scholar] [CrossRef]
- Elvik, R. Risk factors as causes of accidents: Criterion of causality, logical structure of relationship to accidents and completeness of explanations. Accid. Anal. Prev. 2024, 197, 107469. [Google Scholar] [CrossRef]
- Department for Transport. Road Accidents and Safety Statistics. data.gov.uk 2025. Available online: https://www.data.gov.uk/dataset/cb7ae6f0-4be6-4935-9277-47e5ce24a11f/road-accidents-safety-data (accessed on 1 April 2025).


| Observed Classes | Predicted Classes | |
|---|---|---|
| 0 | 1 | |
| 0 | True Negative (TN) | False Positive (FP) |
| 1 | False Negative (FN) | True Positive (TP) |
| Severity Level | Slight Injury | Serious Injury | Total | ||
|---|---|---|---|---|---|
| Number of observations | Count | % | Count | % | 52,966 |
| 41,682 | 78.69 | 11,284 | 21.41 | ||
| Models Dataset | Accuracy | Recall | Specificity | Precision | F1-Score | AUC | ||||||
|---|---|---|---|---|---|---|---|---|---|---|---|---|
| CART | RUMC-CART | CART | RUMC-CART | CART | RUMC-CART | CART | RUMC-CART | CART | RUMC-CART | CART | RUMC-CART | |
| Training | 0.79 | 0.63 | 0.06 | 0.58 | 0.99 | 0.68 | 0.58 | 0.64 | 0.11 | 0.61 | 0.66 | 0.66 |
| Validation | 0.78 | 0.61 | 0.04 | 0.59 | 0.99 | 0.65 | 0.45 | 0.63 | 0.07 | 0.61 | 0.64 | 0.64 |
| Testing | 0.79 | 0.62 | 0.05 | 0.58 | 0.99 | 0.67 | 0.52 | 0.63 | 0.10 | 0.60 | 0.66 | 0.65 |
| Observed Classes | CART Predicted Classes | |||||
|---|---|---|---|---|---|---|
| Training Dataset | Validation Dataset | Testing Dataset | ||||
| 0 | 1 | 0 | 1 | 0 | 1 | |
| 0 | 28,205 (99%) * | 339 (1%) | 6151 (99%) | 86 (1%) | 6219 (99%) | 82 (1%) |
| 1 | 7462 (94%) | 470 (6%) | 1639 (82%) | 369 (18%) | 1554 (95%) | 90 (5%) |
| Observed Classes | RUMC-CART Predicted Classes | |||||
| Training Dataset | Validation Dataset | Testing Dataset | ||||
| 0 | 1 | 0 | 1 | 0 | 1 | |
| 0 | 5372 (68%) | 2523 (32%) | 1099 (65%) | 590 (35%) | 1140 (67%) | 560 (33%) |
| 1 | 3336 (42%) | 4566 (58%) | 700 (41%) | 997 (59%) | 715 (42%) | 970 (58%) |
Disclaimer/Publisher’s Note: The statements, opinions and data contained in all publications are solely those of the individual author(s) and contributor(s) and not of MDPI and/or the editor(s). MDPI and/or the editor(s) disclaim responsibility for any injury to people or property resulting from any ideas, methods, instructions or products referred to in the content. |
© 2025 by the authors. Licensee MDPI, Basel, Switzerland. This article is an open access article distributed under the terms and conditions of the Creative Commons Attribution (CC BY) license (https://creativecommons.org/licenses/by/4.0/).
Share and Cite
Taheri, A.; Switala, K.; Fountas, G.; Sheykhfard, A.; Dadashzadeh, N.; Müller, S. An Empirical Analysis of Crash Injury Severity Among Young Drivers in England: Accounting for Data Imbalance. Appl. Sci. 2025, 15, 4793. https://doi.org/10.3390/app15094793
Taheri A, Switala K, Fountas G, Sheykhfard A, Dadashzadeh N, Müller S. An Empirical Analysis of Crash Injury Severity Among Young Drivers in England: Accounting for Data Imbalance. Applied Sciences. 2025; 15(9):4793. https://doi.org/10.3390/app15094793
Chicago/Turabian StyleTaheri, Amirhossein, Kevin Switala, Grigorios Fountas, Abbas Sheykhfard, Nima Dadashzadeh, and Steffen Müller. 2025. "An Empirical Analysis of Crash Injury Severity Among Young Drivers in England: Accounting for Data Imbalance" Applied Sciences 15, no. 9: 4793. https://doi.org/10.3390/app15094793
APA StyleTaheri, A., Switala, K., Fountas, G., Sheykhfard, A., Dadashzadeh, N., & Müller, S. (2025). An Empirical Analysis of Crash Injury Severity Among Young Drivers in England: Accounting for Data Imbalance. Applied Sciences, 15(9), 4793. https://doi.org/10.3390/app15094793