1. Introduction
Football is a multifactorial sport that combines technical, tactical and physical demands, all performed in a dynamic and unpredictable environment. Players are frequently required to execute high-intensity actions (e.g., sprints, rapid directional changes and jumps), which place substantial demands on their neuromuscular systems and energy stores [
1,
2]. The intermittent nature of these movements, occurring approximately every 4–6 s during gameplay, further increases the complexity of the sport’s physical demands. Players must sustain explosive capacity under variable and ever-changing conditions, requiring both physical endurance and neuromuscular efficiency [
2,
3]. In addition, football is of a multidirectional nature (combined with its inherent technical challenges), requiring players to process and respond rapidly to dynamic stimuli. This interplay between cognitive and physical demands highlights the importance of tailored performance optimization strategies. Given these complexities, optimizing physical performance (particularly explosive capabilities) is critical for enhancing athletic outcomes and achieving competitive success in football [
1,
4].
Explosive movements (e.g., jumps and sprints) are determined by the interplay between force, velocity and power, which are key factors in athletic performance [
5,
6]. The force–velocity (F–V) profile serves as a critical tool for assessing these attributes by quantifying an athlete’s capacity to produce force and velocity under varying loading conditions [
6,
7]. Imbalances in the F–V profile, whether due to deficits in force or velocity, can hinder an athlete’s capacity to perform ballistic actions (e.g., accelerations, changes of direction and vertical jumps) [
8,
9]. These imbalances are particularly significant in football, where specific positions demand distinct physical profiles. For instance, defenders typically demonstrate force-oriented profiles that enhance performance in physical confrontations and aerial duels, whereas forwards rely on velocity-oriented profiles to excel in rapid offensive transitions [
4]. Addressing these imbalances through tailored training interventions can significantly enhance physical performance in football players.
Among the various tools used to evaluate explosive performance, the countermovement jump is one of the most reliable and widely utilized assessments for profiling the F–V characteristics of sports practitioners in general [
6,
10]. The countermovement jump is particularly valued for its simplicity, reproducibility and relevance to dynamic athletic actions, making it a preferred choice in both research and applied settings [
6,
11]. Compared to sprint-based assessments, which primarily capture horizontal force application, countermovement jump-based F–V profiling provides a direct measure of lower limb ballistic capabilities and can be performed with minimal equipment, making it more practical for standardized assessments in football settings [
5,
8]. In addition, while isometric strength tests such as the mid-thigh pull provide insights into maximal force production, they do not capture the dynamic nature of ballistic actions, making countermovement jump-based F–V profiling a more practical and sport-specific alternative for football players [
9]. However, while the countermovement jump effectively quantifies vertical force production, it does not fully account for the horizontal acceleration, deceleration and change-of-direction demands crucial in football [
12].
By performing the countermovement jump under different loading conditions (ranging from bodyweight to progressively added external loads), researchers can derive detailed variables of the F–V profile, including maximal force (F
0), velocity (v
0) and power output (P
max). These data provide critical insights into an athlete’s neuromuscular function and allow for the identification of specific deficits in their explosive capabilities [
5,
6]. In addition, the countermovement jump offers a practical method to monitor fatigue and recovery [
13], further highlighting its versatility as a diagnostic tool in both individual and team settings. When used systematically, this assessment effectively guides individualized training programs and addresses specific performance deficits [
5,
9].
Studies investigating the F–V profile in senior football teams highlight players’ positional differences, reflecting the specific physical demands of each role [
6,
14]. For instance, defenders demonstrate higher F
0 values compared to midfielders and forwards, as reported by a study comparing sprint mechanical properties in football players [
4]. In contrast, forwards exhibit higher v
0 and P
max values, which are essential for explosive accelerations and sprints during offensive transitions [
14]. In addition, elite midfielders often display balanced F–V profiles, emphasizing their hybrid roles that combine high-intensity running with technical skills [
15]. These findings emphasize how F–V profiles vary not only by position but also by competitive level, underlining the importance of tailored training programs to address specific neuromuscular and tactical demands [
6,
14].
Despite the extensive application of the F–V profile in athletic populations [
16], several studies have already examined F–V profiles in football players at different levels and positions [
14,
17,
18]. However, most of this research has been conducted on adult or elite-level athletes, with limited attention to young football players, particularly regarding the interaction between competitive levels and positional roles [
6,
14]. This gap in the literature is critical, as it limits the development of evidence-based training programs tailored to the specific neuromuscular and physical demands of young players [
12]. Developmental stages greatly influence F–V characteristics, with variations in force and velocity capacities potentially impacting performance and increasing the risk of imbalances if not adequately addressed [
12,
14]. Moreover, positional demands in football require distinct physical profiles, yet the interplay between these demands and developmental factors in young players remains poorly understood [
14,
16]. Previous studies have demonstrated the relevance of the F–V profile in optimizing performance and addressing imbalances in adult athletes, but limited research has explored its application in younger populations [
3,
8]. Investigating how competitive levels and positional roles shape F–V profiles in young players while also providing direct training applications is essential for bridging this gap.
The purpose of the current study was to analyze the F–V profiles of young football players competing in the national championships, investigating how competitive levels and positional roles influence key F–V variables (including F0, v0, Pmax and the players’ jumping ability). It was hypothesized that players at higher competitive levels would exhibit more balanced F–V profiles due to increased exposure to structured training regimens and advanced neuromuscular development. Furthermore, positional differences were expected to result in specific F–V characteristics, with forwards demonstrating higher velocity capacities and defenders excelling in force production.
2. Materials and Methods
2.1. Experimental Design
In this cross-sectional study, all players were assessed under standardized environmental conditions (20 °C temperature, 60% humidity and between 9:00 and 12:00). All assessments were carried out in the same laboratory facilities to ensure consistency and were supervised by an experienced researcher to maintain methodological accuracy. Players were subjected to a series of standardized assessments to determine their body composition and anthropometric profile. Prior to the experimental procedures, body mass and stature were recorded using a bioelectrical impedance device (InBody 120, Biospace, Seoul, Republic of Korea) and a stadiometer (Model 220, SECA, Hamburg, Germany), respectively. The body mass index was computed as the ratio of body mass to height squared. All measurements were conducted in accordance with the guidelines set forth by the International Society for the Advancement of Kinanthropometry. To determine the components of the vertical F–V profile, participants performed countermovement jumps under four loading conditions: bodyweight (no additional load) and three external loads corresponding to 30, 50 and 70% of their body mass.
2.2. Participants
Thirty-eight male football players (age: 17.08 ± 0.94 years; height: 1.77 ± 0.06 m; body mass: 69.08 ± 7.02 kg) from a team affiliated with the National Football Federation voluntarily participated in this study. Among them, 22 players were in the U-17 category, while 16 belonged to the U-19 category, actively competing in the 1st and 2nd divisions of the national championships (respectively). To analyze and compare the F–V profile variables, players were categorized based on their positional roles: goalkeeper, defender, midfielder and forward. Players were recruited based on the following eligibility criteria: (i) active competitive football players registered with the National Football Federation, with a minimum of two consecutive years of structured training and competition; (ii) medical clearance obtained through the Physical Activity Readiness Questionnaire (PAR-Q); (iii) absence of musculoskeletal injuries or diagnosed medical conditions; and (iv) no history of performance-enhancing substance use. Players were instructed to maintain their habitual dietary intake, abstain from caffeine, and avoid high-intensity physical activity for at least 48 h prior to the testing session. All experimental procedures, including associated risks and potential benefits, were clearly explained, and written informed consent was obtained from each participant. The study was conducted in accordance with the ethical standards set forth in the Declaration of Helsinki and approved by the institutional Ethics Committee (CEFADE_34_2024).
2.3. Methodology
Players were evaluated during the competitive season, as the F–V profile variables can be affected both during the preseason and at the end of the competitive period [
19]. Before the assessment, all players completed a standardized specific warm-up protocol, which included multiple attempts of unloaded countermovement jumps, dynamic stretches targeting the lower limbs and a low-intensity run [
19]. To determine the vertical F–V profile of each player, two countermovement jumps were performed and jump height was estimated based on the flight time recorded by the Ergo Jump (Globus Ergotester
®, Codognè, Italy). Players were instructed to remain stationary at the center of the platform, with their hands placed on their hips for unloaded conditions or on the bar for loaded jumps, maintaining this position throughout the movement [
6]. From this position, they initiated a downward motion until reaching a squat with a knee angle of approximately 90°, followed by a jump for maximal height [
20]. Although knee angulation was individualized, strict verbal instructions were provided to ensure participants maintained precise control over the squat depth. The assessment began with a load of 0% (body mass only), followed by loads corresponding to approximately 30, 50 and 70% of body mass [
19]. Each load condition required two valid attempts, with a 2-min rest interval between attempts and a 4–5-min rest between different load conditions [
8]. Each jump was supervised by a trained researcher to ensure proper execution and the protocol was deemed successfully completed when participants reached a jump height of at least 20 cm with the final load [
3].
Force, velocity and power were calculated using three equations, considering only simple input variables: body mass, jump height and impulse distance [
6,
7]. The latter represents the distance traveled by the center of mass during the impulse, defined as the range of lower limb extension from the initial position to take-off [
6,
7]. Impulse distance was measured a priori for each player as the difference between the length of the extended lower limb (from the iliac crest to the toes, with the ankle in plantar flexion) and the height in the standardized initial position (vertical distance from the iliac crest to the ground) [
6,
7]. The individual F–V profile (F
0, V
0, F–V slope and P
max) was obtained as described in the literature [
7,
19]. Variables of the F–V relationship were calculated using a linear regression model: F(V) = F
0 − aV, where F
0 represents the maximal force, V
0 is the maximal velocity and a is the relationship slope of the linear force–velocity relationship. In addition, the velocity intercept (V
0 = F
0/a) and maximal power (P
max = F
0 · V
0/4) were determined [
7]. To assess the percentage of imbalance in the F–V profile, players were classified into five categories according to optimal threshold ranges: high force deficit (<60%), low force deficit (60–90%), optimal balance (90–110%), low velocity deficit (>110–140%) and high velocity deficit (>140%) [
8].
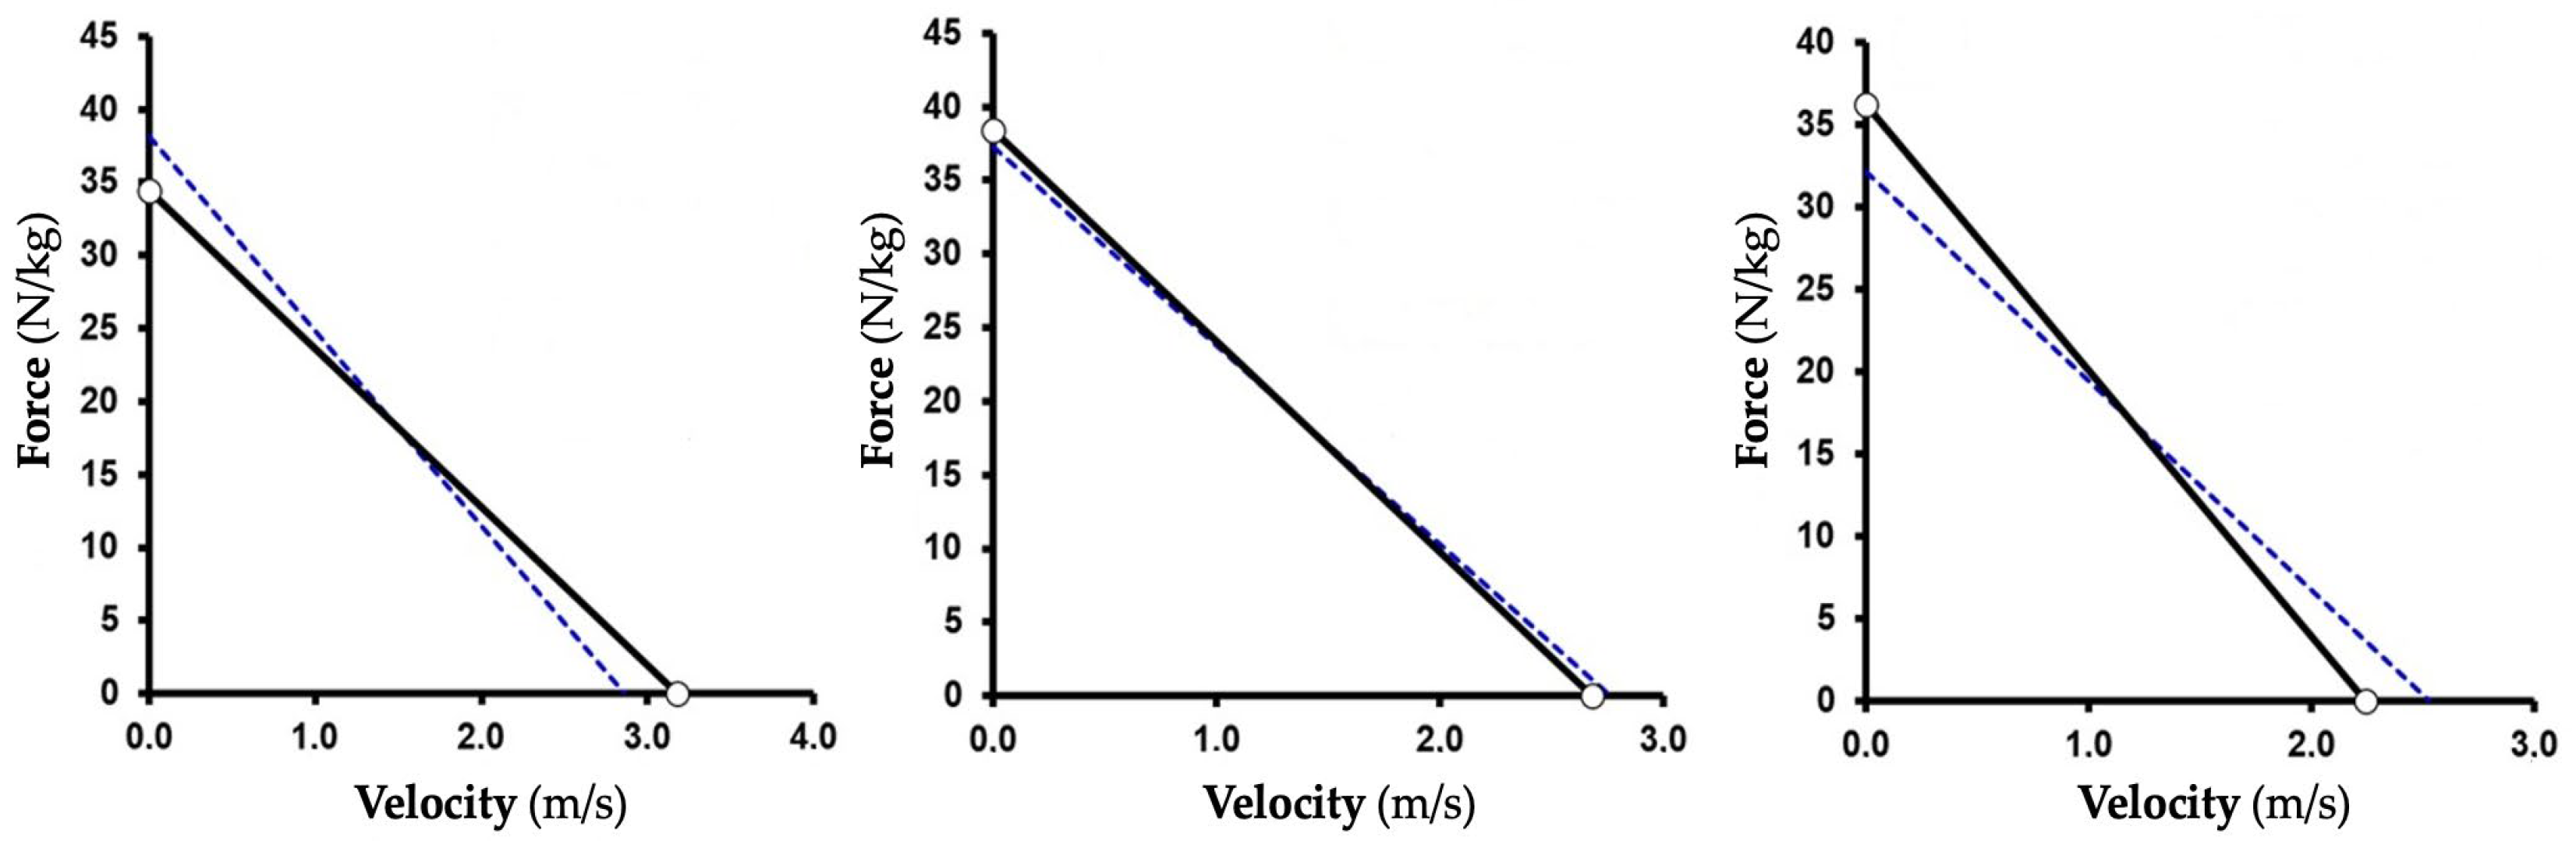
Figure 1 presents an example of the F–V profile assessment under different conditions (strength deficit, balanced profile and velocity deficit) based on actual participant data.
2.4. Statistical Analysis
Based on a post hoc power analysis, a sample size of 38 football players was deemed sufficient to detect a large effect size (0.9) with a significance level of 5% and 85% power in a between-groups design (G*Power 3.1.9.7; Heinrich Heine University Düsseldorf, Germany). All statistical analyses were conducted using SPSS® software (version 29.0.1, Chicago, IL, USA). Descriptive statistics, including mean and standard deviation (SD), were calculated for all variables. Data normality was assessed with the Shapiro–Wilk test and homogeneity of variances was verified using Levene’s test. An independent samples t-test was performed to compare the means of F–Vimb, Pmax, F0, V0 and jump height across competitive levels. One-way ANOVA was conducted to assess the effect of player position on these variables (with Tukey’s post hoc test applied for multiple comparisons when a significant F-value was observed). Effect sizes for ANOVA were calculated using eta-squared and classified as small (>0.01), moderate (>0.06) or large (>0.15). In addtion, Cohen’s d was used to determine effect sizes for pairwise comparisons between competitive levels and player positions, categorized as trivial (<0.2), small (0.2–0.49), moderate (0.5–0.79) or large (>0.8). Statistical significance was set at p < 0.05.
3. Results
Table 1 provides the characterization of the players based on position, competitive level and classification of the deficit relative to mechanical capacity, as well as the values for F–V
imb, P
max, F
0, V
0 and jump height. Among the players, 26% exhibited a high force deficit, 50% displayed a low force deficit, 3% presented a low velocity deficit and 21% achieved a balanced F–V profile. In addition, when analyzing the total number of players at each competitive level, it was found that 94% of the players assessed in the 2nd national division exhibited a force deficit, compared to 64% in the 1st national division. These results underscore the diversity in neuromuscular performance and the prevalence of mechanical imbalances within the cohort.
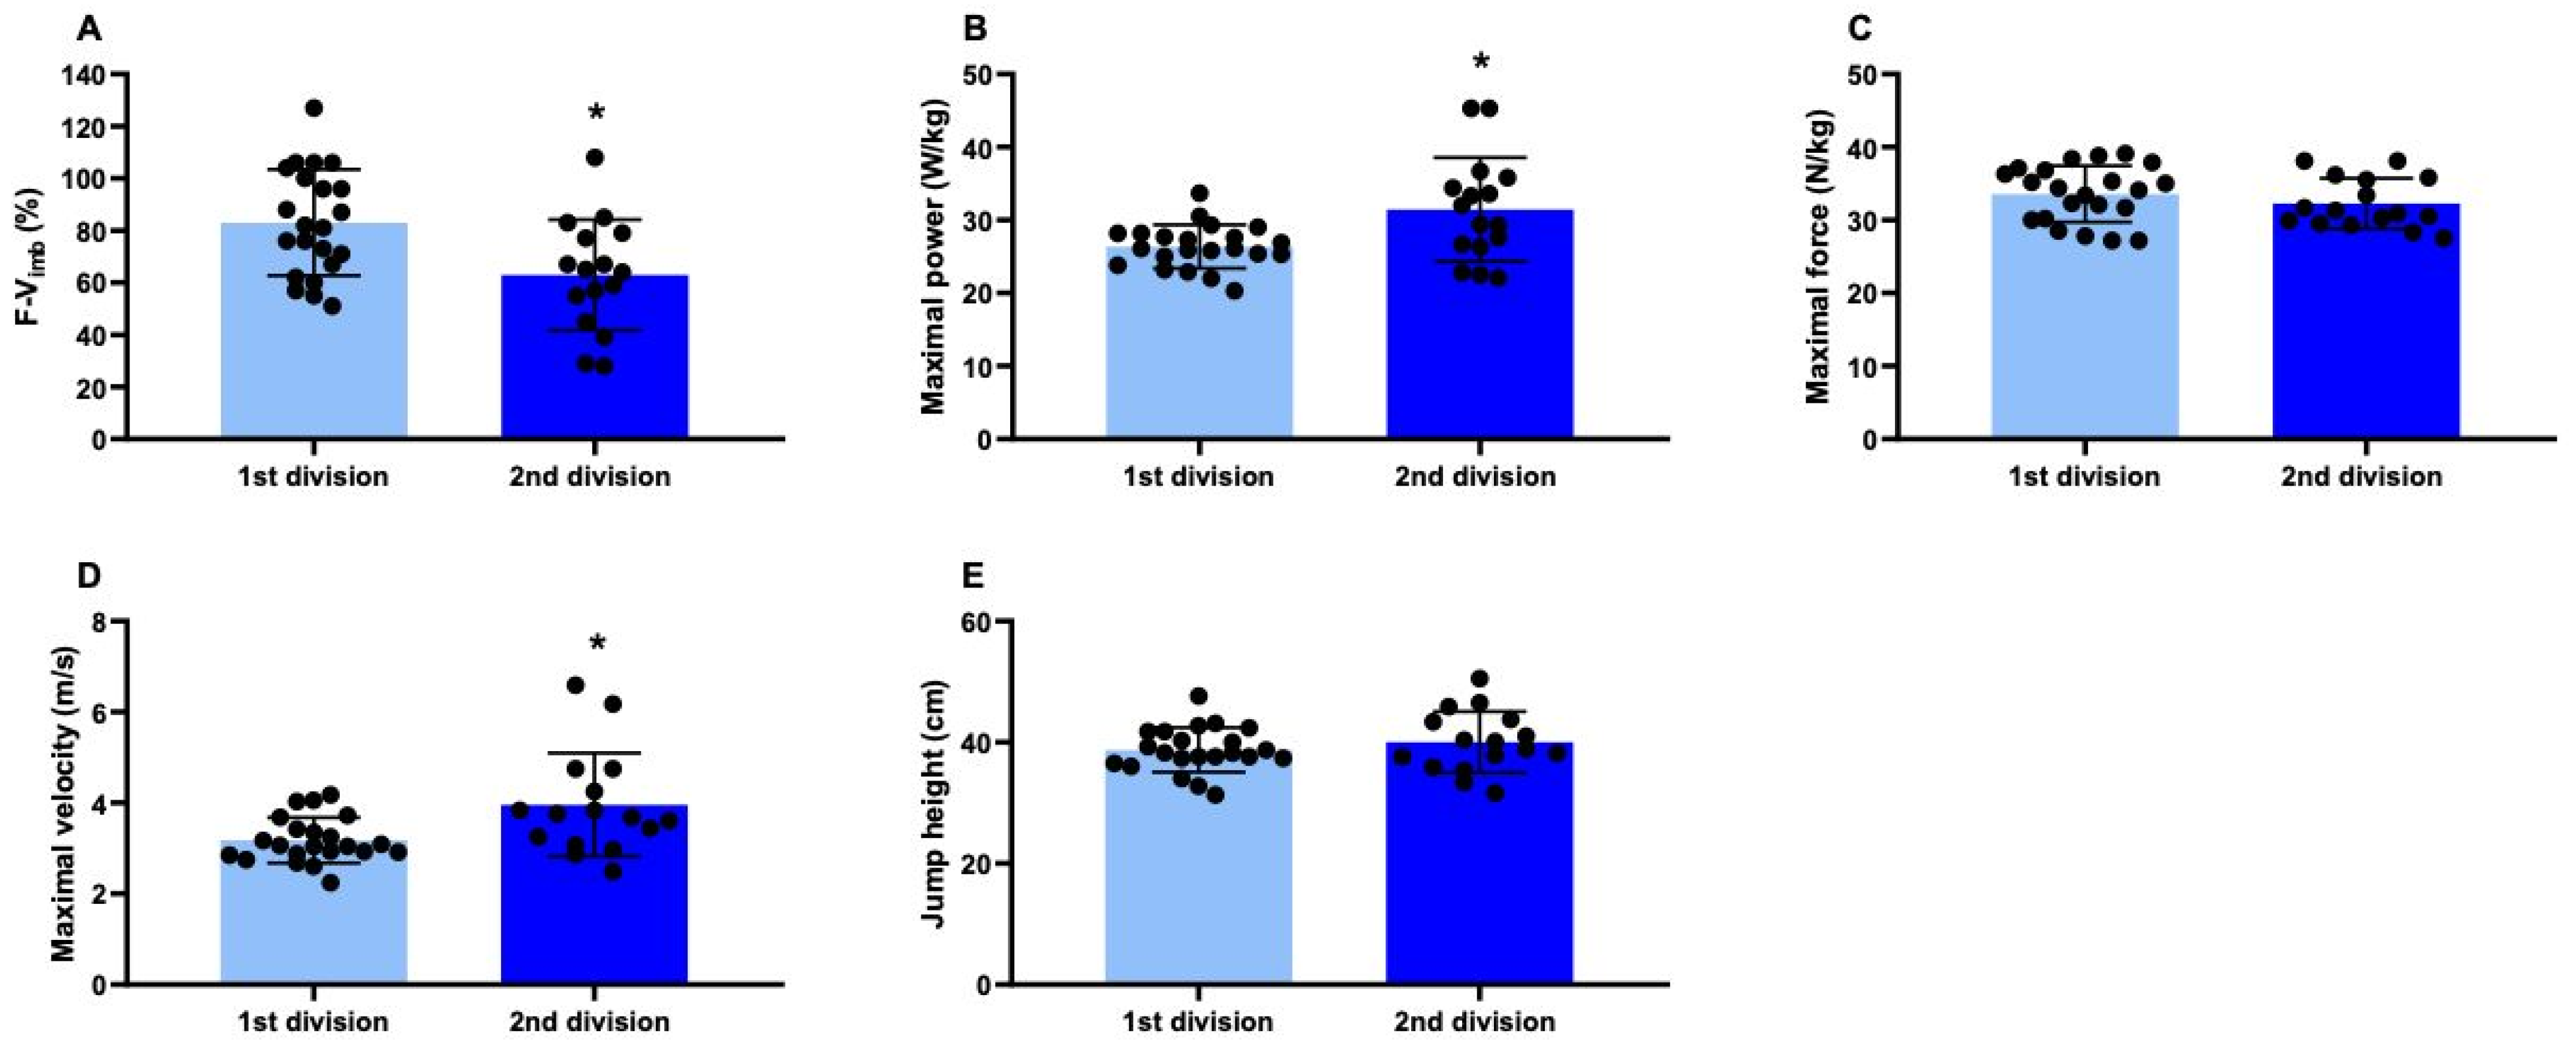
The comparison of F–V profile variables and performance metrics between players in the 1st and 2nd divisions is presented in
Table 2. The independent samples
t-test revealed that players in the 1st division exhibited more balanced F–V
imb values compared to those in the 2nd division, with a large effect size (d = 0.97,
p < 0.05). Conversely, players in the 2nd division demonstrated higher P
max values (d = 0.88) and V
0 values (d = 0.88). No differences were observed between divisions for F
0 and jump height. These differences are further shown in
Figure 2, which presents individual and mean values of F–V profile variables by competitive level.
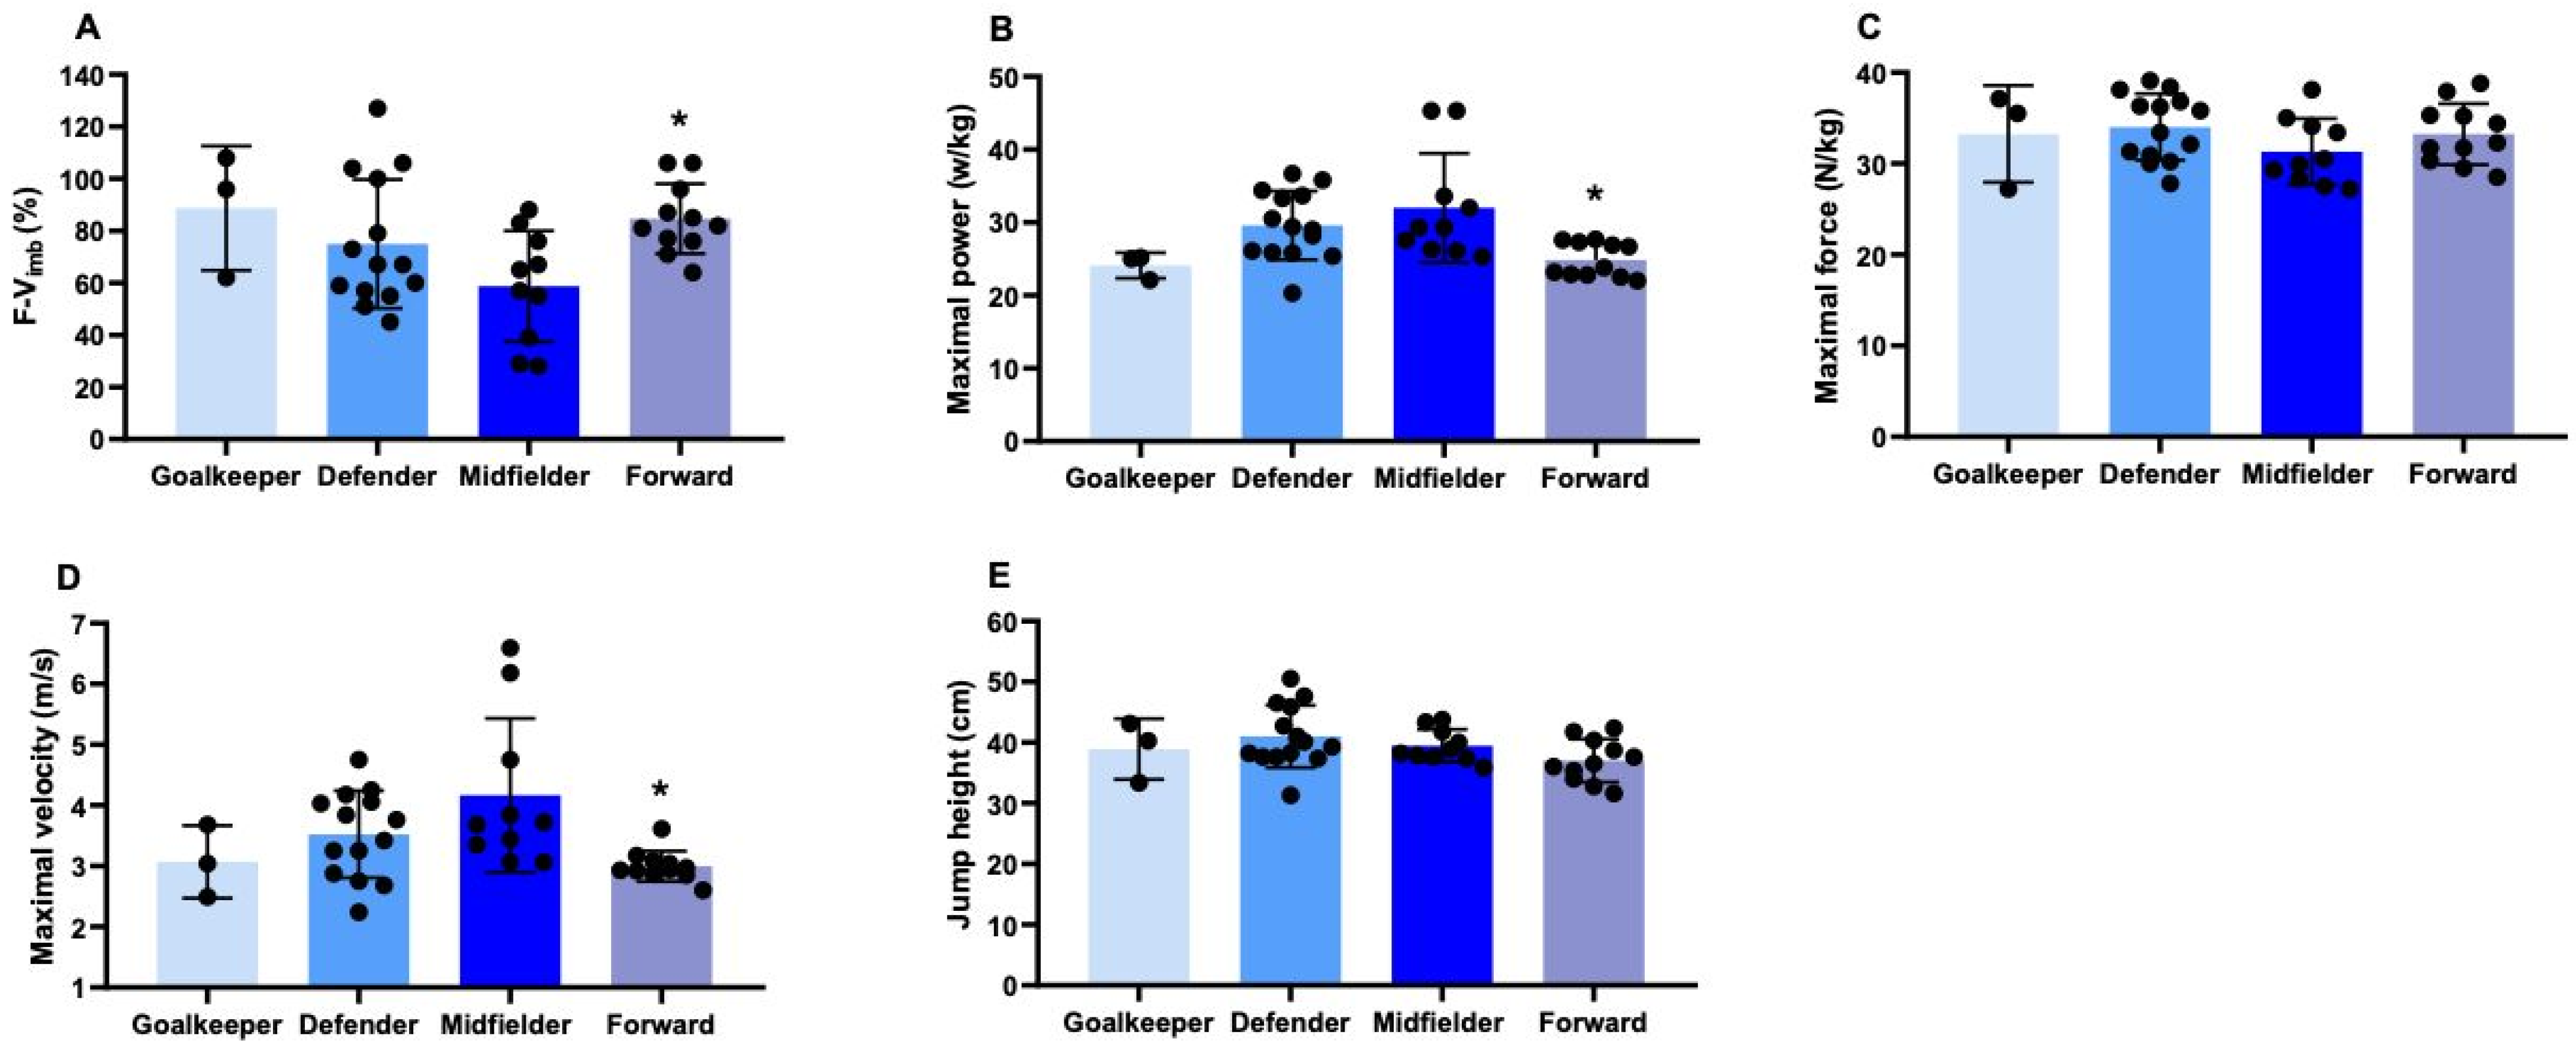
Table 3 shows the effect of position on the F–V profile variables, with large effect sizes for F–V
imb, P
max and V
0 (η
2 = 0.22, 0.28 and 0.26, respectively). Tukey’s post hoc test revealed that forwards had more balanced F–V
imb values compared to midfielders (d = 1.47). Conversely, midfielders demonstrated higher P
max (d = 1.50) and V
0 (d = 1.27) compared to forwards. No differences were observed for F
0 and jump height across positions.
Figure 3 illustrates positional differences in F–V variables, depicting both group-level trends and individual variability among goalkeepers, defenders, midfielders and forwards.
4. Discussion
The purpose of the current study was to analyze the F–V profiles of young football players competing in the Portuguese national championships, with a focus on how positional roles and competitive levels influence key performance variables. The majority of the players analyzed exhibited significant imbalances in their mechanical capacities, with 76% showing a force deficit, 21% being balanced and only 3% exhibiting a velocity deficit. Through profiling, it was revealed that defenders exhibited force-oriented profiles with higher F0 (~33 N/kg), while forwards demonstrated velocity-oriented profiles with higher v0 (~3.9 m/s). In contrast, midfielders demonstrated balanced profiles, reflecting their hybrid physical demands that combine both offensive and defensive responsibilities on the field. In addition, 1st division players displayed more balanced F–V profiles compared to 2nd division athletes (~83 vs. 62%), indicating superior neuromuscular conditioning at higher competitive levels. These findings underscore the importance of individualized training approaches tailored to both positional and competitive demands to enhance neuromuscular performance and ballistic capabilities in young football players.
Players from the 1st division showed more balanced F–V profiles compared to those in the 2nd division (indicating greater neuromuscular development). Balanced profiles are associated with superior ballistic performances (like sprints and jumps) due to the ability to optimize the interaction between force and velocity in game-specific actions [
5,
12]. These findings reflect more structured and comprehensive training practices (characteristic of elite environments) that prioritize the balance between different physical capacities [
4]. Conversely, the higher prevalence of force deficits among 2nd division players suggests limitations in training or reduced access to effective neuromuscular development strategies [
6,
12]. These constraints may restrict performance in high-intensity actions frequently required in football [
4,
5].
The higher P
max values observed in 2nd division players may be attributed to a disproportionate emphasis on explosive actions during training, often at the expense of achieving balanced development between force and velocity. This approach reflects compensatory strategies to address technical or tactical gaps common in lower competitive levels [
4,
12]. For example, lower-division players may prioritize plyometric and high-velocity drills while neglecting maximal strength training, leading to elevated P
max values without corresponding force development [
6]. In contrast, 1st division players typically follow more structured and periodized training programs, optimizing neuromuscular performance across different movement patterns and contributing to a more balanced F–V profile [
4]. In addition, differences in weekly training loads and conditioning strategies may contribute to variations in neuromuscular profiles, as studies suggest that structured high-frequency training enhances long-term physical performance in football players [
12]. Studies suggest that players at lower competitive levels often lack diversified and structured training programs, leading to neuromuscular deficits that impact long-term performance [
6]. Furthermore, an overemphasis on explosive actions without addressing underlying force deficits can limit the transferability of these gains to multidirectional or endurance-based activities, which are critical in football [
21,
22]. These findings emphasize the need for specific training interventions that correct imbalances and promote integrated improvements in physical capacities.
Forwards demonstrated more balanced F–V profiles compared to other positions, emphasizing the importance of integrating strength and velocity to perform rapid offensive actions (e.g., counterattacks and finishing plays). This is corroborated by evidence from studies indicating that forwards and offensive players generally exhibit velocity-dominated profiles, specifically adapted to meet the demands of high acceleration and rapid directional changes during offensive transitions [
15,
18]. In fact, balanced profiles are critical for optimizing efficiency in ballistic and transitional movements, which are fundamental for this position [
23,
24]. Conversely, midfielders exhibited the greatest F–V imbalances, although showing the highest P
max. This can be attributed to the hybrid demands of their role, requiring a combination of anaerobic endurance, strength and velocity to manage intense and multidirectional actions [
6,
25]. These results highlight the importance of specific training programs for midfielders that address both the physical and tactical demands of their roles on the field [
4,
6].
Defenders displayed the highest F
0 values, reflecting the necessity for strength in physical confrontations and aerial duels, which are common to this specific field position [
14]. However, the V
0 demonstrated in this role was lower than that of forwards, suggesting that agility and acceleration are not as prioritized for their defensive functions [
12,
14]. These findings align with the literature emphasizing the need for positional training programs tailored to meet the diverse neuromuscular demands of each role in football [
4,
26]. Strength development is essential for defenders, whereas velocity and agility are more critical for forwards, underscoring the specificity of each role within the game context [
6,
7].
Despite variations in F–V
imb, P
max and V
0 variables, similar values were observed in jump height across competitive levels and positions. This result aligns with the existing literature suggesting that jump height is influenced by a complex interplay of factors (including force production, neuromuscular coordination and biomechanical technique) [
27,
28]. The consistently high prevalence of force deficits (~76%) across both groups likely contributes to the stability of this variable, as force is a key determinant of vertical performance. However, evidence suggests that football players may adopt compensatory neuromuscular strategies to maintain jump performance, even in the presence of mechanical imbalances. For example, football players with a history of injuries have been shown to modify their jump technique, using compensatory strategies to maintain jump height despite limitations in force production [
29]. Similarly, basketball players experiencing neuromuscular fatigue altered their movement strategies, optimizing intermuscular coordination and stretch-shortening cycle efficiency to minimize the decline in jump performance [
30]. These findings underscore the importance of using more precise metrics (e.g., individualized F–V profiles) to better understand the specific mechanical and neuromuscular demands that influence athletic performance. In addition, the insensitivity of jump height to changes in F–V
imb highlights its limited ability to capture nuanced functional performance differences (particularly in athletes with varying F–V imbalances) [
4,
6].
The current study presents certain limitations, particularly as its exclusive focus on vertical F–V profiling overlooks the horizontal F–V characteristics that are crucial for sprinting and directional changes, which are dominant in football actions. As a result, the analysis of vertical F–V profiles alone may not fully capture the demands of football, where horizontal force production plays a critical role in sprinting and directional changes. Secondly, the cross-sectional design restricts causal inferences, and longitudinal research exploring the effects of tailored interventions on F–V profiles could provide clearer insights. Finally, the relatively small sample size, especially within positional subgroups, may limit generalizability and while our sample was adequate for detecting large effect sizes, smaller positional and competition-level differences may not have been fully captured. Expanding the sample and including multi-national cohorts would enhance the broader applicability of these findings. Furthermore, future research should consider incorporating landing mechanics to further refine the assessment of neuromuscular control in young football players. Also, future research should incorporate biochemical markers and advanced analytical techniques (e.g., motion capture) to delve deeper into the interplay between physiological, mechanical and metabolic factors influencing F–V profiles. In addition, investigating gender-specific variations in F–V profiles and training adaptations could significantly expand the relevance and applicability of these findings across diverse athletic populations.


