1. Introduction
The cardiovascular system consists of the heart and blood vessels. Cardiovascular disease (CVD) is a general term used to describe a wide array of issues that can arise in the cardiovascular system, including strokes, peripheral arterial disease, and coronary heart disease, which can lead to myocardial infarction and heart failure [
1,
2]. According to the World Health Organization, CVD is the leading cause of death worldwide, causing an estimated 17.9 million deaths in 2019, or 32% of all global deaths [
3]. The average annual cost associated with CVD is estimated to be USD 378 billion in the US and EUR 210 billion in the European Union [
4,
5]. Cardiac arrhythmia is a type of CVD characterized by an abnormal heart rate or rhythm that is not physiologically justified [
6]. Cardiac arrhythmia can involve a slow heartbeat (bradycardia) or a fast heartbeat (tachycardia). Atrial fibrillation (AF) is the most common type of cardiac arrhythmia, which involves irregular and often abnormally rapid heartbeats caused by the dysfunctional activity of electrical impulses in the atria [
3,
7]. It can lead to cardiovascular complications, such as blood clots, stroke, and heart failure, and is responsible for one-third of ischemic strokes [
8]. The mortality risk in patients with AF is 4 times higher than in the general population and 1.5 to 1.9 times higher when adjusted for preexisting cardiovascular conditions related to AF [
7,
9]. The timely detection of AF is vital in order to initiate adequate treatment and prevent the risk of strokes, which are often the first manifestation of the disease [
8].
The most common test used to diagnose cardiac arrhythmia is an electrocardiogram (ECG), which measures the heart’s electrical activity using skin-level electrodes with built-in sensors [
10]. ECGs detect irregular heartbeats, blocked or narrowed arteries, and other cardiovascular abnormalities. With the emergence of deep learning as an effective method for medical prediction and diagnosis, several models have been proposed for ECG signal classification using neural networks [
11,
12,
13,
14]. However, most ECG devices currently available are expensive and are typically used in limited hospital or ambulatory settings. Newer home-monitoring devices have recently been integrated with ECGs, but they remain considerably more expensive than the alternative of photoplethysmography (PPG). Additionally, the materials used for high-quality equipment may cause skin irritation and discomfort during extended use, limiting the devices’ long-term use [
15]. PPG is a vascular optical measurement technique that detects variations in the blood volume of skin tissue and can be used for heart rate monitoring and cardiovascular abnormality detection [
16]. PPG sensors are non-invasive, unobtrusive, and inexpensive, making PPG an appropriate alternative to ECG, although only as a supplementary approach for screening and not for definitive diagnosis. PPG sensors are available in various devices, including smartphones, smartwatches, and fitness trackers, making them more widely available to the general population [
16]. Some limitations of PPG include sensitivity to motion artifacts caused by hand movements and vulnerability to environmental noise [
17,
18].
The data obtained from ECG and PPG signals can be temporal or morphological [
19]. Temporal features offer data based on time, such as the duration between heartbeats, while morphological features describe the appearance of the curve. Despite certain morphological differences, ECG- and PPG-based signals have been shown to have a high degree of correlation [
20,
21]. These two signals do indeed reflect different physical essences; however, the correlation is in terms of peak-to-peak variability. Heart rate variability (HRV) measures the variation in time between consecutive cardiac cycles obtained from ECG signals. PPG signals offer similar information through pulse rate variability (PRV), which represents the variation in time between pulse signals [
22]. The similarity in the properties between HRV and PRV is higher when PPG signals are not excessively affected by motion artifacts and noise. In the temporal domain, AF irregularities follow similar statistical patterns in both modalities because they originate from the same arrhythmic cardiac activity. In the frequency domain, the chaotic frequency patterns characteristic of AF are preserved across both signals. Here, transfer learning (TL) is a paradigm that is leveraged to adapt knowledge mined on a specific task to another closely related secondary task. While absolute values may differ between HRV and PRV due to physiological transit time and vascular compliance factors, the relative patterns and feature relationships critical for AF classification remain consistent, making learned feature hierarchies transferable.
Some of the limitations we face when developing PPG-based analytical models that make TL appealing include the scarcity of publicly available, universally reviewed benchmark databases and the degradation of model performance due to low signal quality [
23]. There are also many influencing factors such as skin tone, motion artifacts and signal crossover, body temperature, and ambient light, as well as sensor design characteristics and positioning [
24]. The process of manually annotating datasets is complex and suffers from inter-rater variability, which occurs when multiple experts working on a dataset assign different labels to the same data instance [
25]. Reaching a consensus among experts is difficult if the data are not optimally preprocessed, which is an issue present in the majority of PPG signal annotation efforts in the literature. Furthermore, most of the previously developed algorithms are only applicable in controlled clinical settings, making early prognosis inaccessible to the general population. Another limitation in the usage of large deep learning models with complex architectures for medical screening is their high requirements for memory, computational power, and storage space, making them inappropriate for deployment in real-world applications. Knowledge distillation (KD) is a method that compresses a complex model into a smaller and faster model without significant performance loss [
26]. This method employs a larger network (called the
teacher) to train a smaller network (called the
student) to help the latter with improved generalization by virtue of the knowledge gained by the complex
teacher model. This knowledge is transferred to the simplified
student model and used for supervision of its training. KD can be used to introduce complementary information from additional modalities during training while avoiding their computation during testing [
27]. Research has shown that the usage of KD results in greater generalization capabilities and faster training [
28]. KD has previously been used to create small and robust models for tasks such as arrhythmia detection, sleep staging, and emotion recognition using ECG signals [
28,
29,
30,
31,
32,
33]. Essentially, within the scope of our experiments, the
teacher model is trained on an ECG dataset, while the
student model is the smaller variant that is fine-tuned with the PPG dataset and trained using the soft labels generated by the
teacher. Hence, in accordance with the literature, we will be using the synonymous terms
teacher and
student to refer to these models throughout this work.
This work focuses on classifying normal sinus rhythm (NSR) and AF. NSR represents the rhythm of the healthy human heart, which originates from the sinus node [
34]. In order to address the lack of large-scale annotated PPG datasets, our work proposes the usage of a deep learning model trained on a large ECG dataset to assist in enhancing the PPG-based model, as ECG datasets are relatively better annotated and compiled [
35]. The knowledge representation learned from ECG signals is transferred to the PPG-based model using transfer learning along with KD, resulting in a smaller, less computationally expensive, and more robust PPG-based model with enhanced performance.
The objectives of this work are as follows:
To implement a deep learning model trained on gold-standard raw ECG signals and derived HRV features for AF detection to approximate a relationship with raw PPG signals and derived PRV features.
To investigate the effectiveness of transfer learning and KD using an upstream ECG dataset for an AF classification model across two downstream PPG datasets.
To provide a notion of interpretability using multiple techniques to elucidate the inner workings of black-box models and promote clinical acceptance.
This paper is organized as follows.
Section 2 reviews the existing literature.
Section 3 details the proposed approach.
Section 4 reports the results obtained by the model.
Section 5 discusses the results.
Section 6 presents the conclusions and future work.
3. Proposed Approach
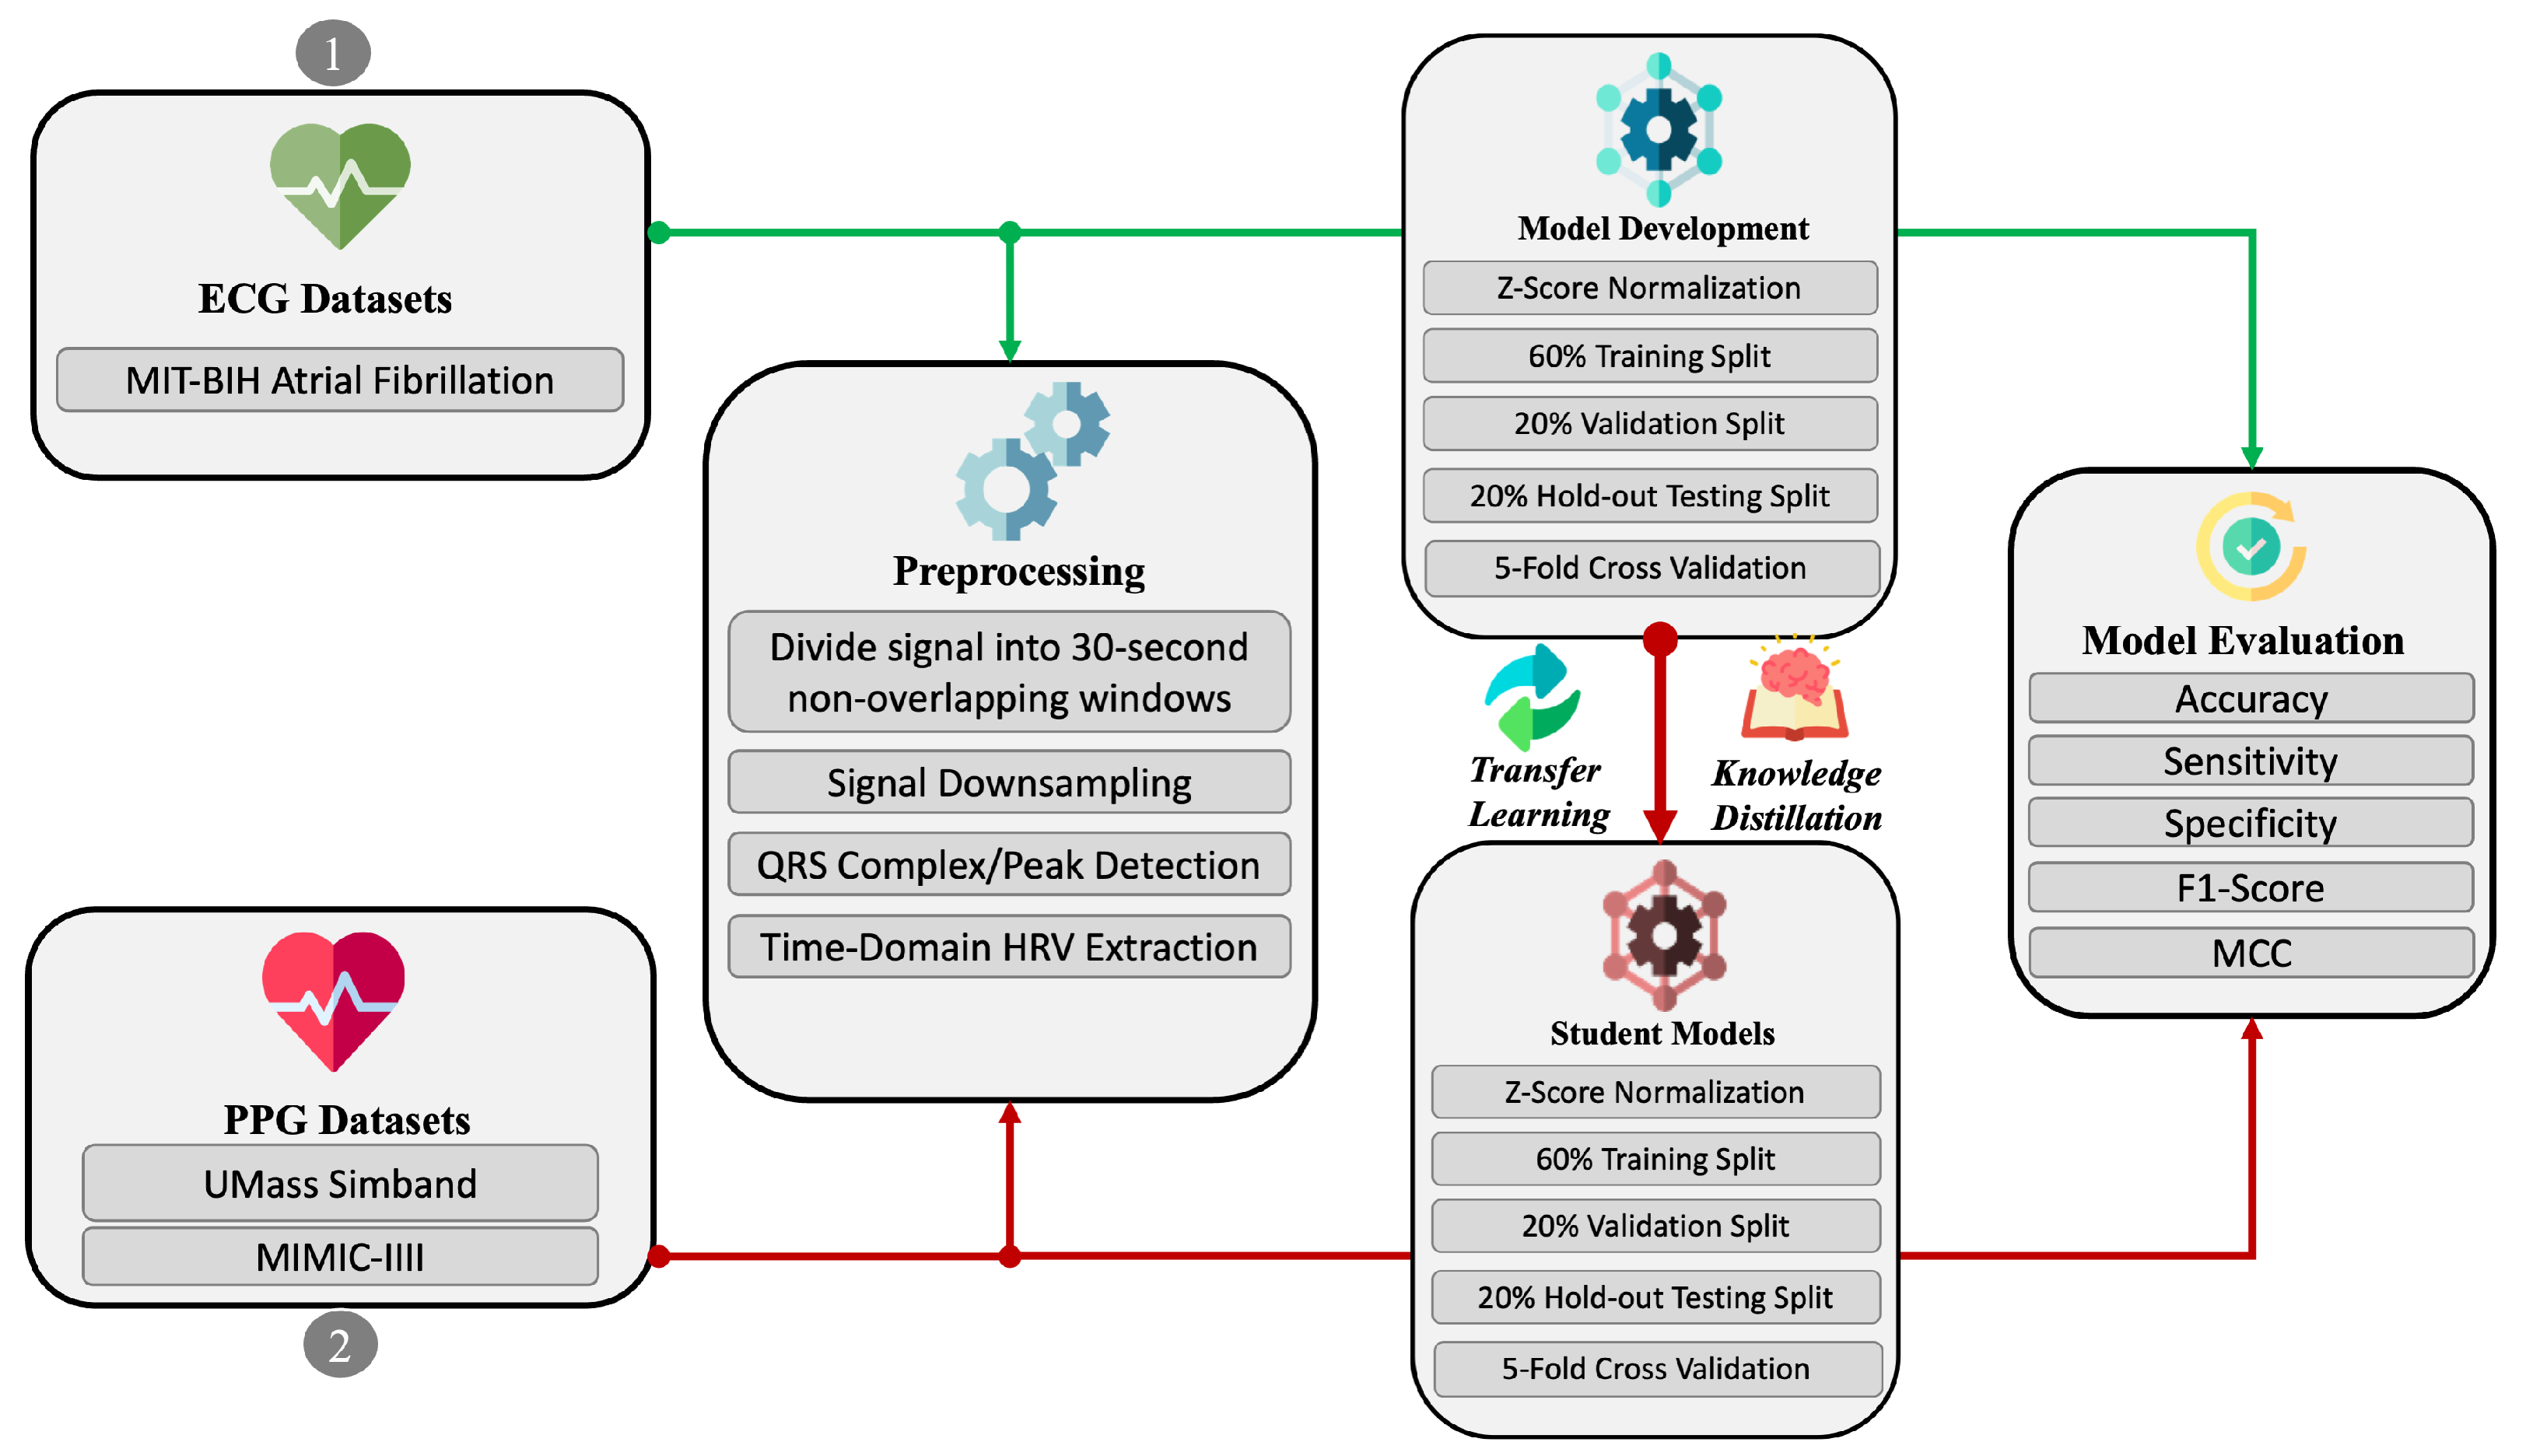
The end-to-end sequential pipeline, illustrated in
Figure 1, consists of five primary steps: (i) dataset preprocessing, (ii) model training, (iii) transfer learning, (iv) knowledge distillation, and (v) evaluation. These steps are briefly described as follows, with further details provided in the relevant subsequent sections:
The dataset preprocessing step involves window-based segmentation, signal quality assessment, peak detection, and HRV/PRV feature extraction.
The model training step involves the implementation of multiple neural network architectures and hyperparameter selection.
The transfer learning step involves adapting the learned representation of the ECG signals to fine-tune the PPG-based model.
The knowledge distillation step involves the utilization of the teacher–student learning paradigm to compress the fine-tuned PPG-based model for lower resource consumption.
Finally, in the evaluation step, we assess the performance of the implemented models using standard measures and interpretability techniques.
While ECGs and PPG represent different physiological processes, a reliable sensor captures heart rhythm patterns similarly, even if their magnitudes differ. A peak in an ECG correlates with a peak in PPG, and rhythmic abnormalities manifest in both modalities. The underlying patterns, i.e., an irregular rhythm and the absence of distinct P-waves in ECGs, translate to comparable irregularities in pulse intervals detected by PPG. In atrial fibrillation specifically, the fundamental irregularity in cardiac rhythm manifests in both signals through a common underlying pathophysiology. ECGs directly measure the electrical activity of the heart, while PPG captures blood volume changes in peripheral vessels. The electrical impulses detected by ECGs trigger mechanical contraction of the heart, which then generates pressure waves that propagate through the arterial system and are detected by PPG with a small, predictable time delay. Our transfer learning approach focuses on these shared pattern characteristics rather than intricate modality-specific details. This physiological correspondence provides the foundation for our teacher–student model’s effectiveness, as the network learns to recognize these rhythm patterns regardless of the specific signal characteristics.
3.1. Datasets
ECG Dataset for Supervised Pre-Training: The Massachusetts Institute of Technology–Beth Israel Hospital Atrial Fibrillation Database (MIT-BIH AF-DB) consists of 25 long-term two-channel ambulatory ECG recordings of human subjects with mostly paroxysmal atrial fibrillation [
47]. Each recording is up to 10 h in duration and was sampled at 250 Hz by the associated recorders, with a typical bandwidth of approximately 0.1 to 40 Hz. This publicly available dataset is accessible through the PhysioBank repository, an online archive of well-characterized biomedical signals initiated by the United States National Institutes of Health [
48]. The signals in the MIT-BIH AF-DB dataset have rhythm labels primarily corresponding to AF and NSR, but also include annotated instances of atrial flutter and AV junctional rhythm. The labels define the period of the signal between the start and end of a specific cardiac event. We considered the Lead 1 channel ECG, associated with the right ventricle and right atrium, and the labels for NSR and AF only. We extracted 30 s long non-overlapping segments from each individual recording, after downsampling to 50 Hz to match the sampling rate of the provided PPG dataset [
49,
50]. The rationale for selecting the 30 s duration is twofold. First, it is ideal for rapid AF episode detection in a wearable monitoring context [
51] and has shown considerably high accuracy in recent works. Second, a general arbitrary consensus among the electrophysiology community asserts that at least 30 s of an ECG signal is required to justifiably define brief episodes of isolated AF, even if it may not always correlate to prevailing longer or recurring AF arrhythmia [
52]. Stationary signal check, heart rate check, and the signal-to-noise ratio check algorithms were utilized, as formulated in [
53], to ascertain the signal quality of the ECG lead. All signals in the MIT-BIH AF-DB dataset passed the signal quality acceptance checks and were in agreement across the three algorithms. No additional filtering, replication, or augmentation procedures were applied to the raw signals at this point. In total, there were 11,737 and 5151 window segments belonging to the NSR and AF classes, respectively.
PPG Datasets for Downstream Classification: For further analysis, we were granted access to a private database of PPG signals (UMass-DB), held by the authors of [
50]. The work was conducted at the University of Massachusetts Medical School with 37 human subjects who were instructed to perform several kinds of movements replicating free-living conditions in the clinic [
49]. The smart wrist-worn wearable Samsung Simband recorded the PPG signals at an original sampling frequency of 128 Hz. The PPG signals in the database version we were provided with were already preprocessed into 30 s labeled segments with a downsampled frequency of 50 Hz. As discussed in [
43], the signal-to-noise ratios of signals acquired from wearable PPG are not always consistent and depend on a number of external factors. In the interest of keeping the noise within the data input so that the model could learn while accounting for this natural variance in raw sensor values, we did not perform filtering and replication augmentations for this modality. After considering the original authors’ annotations regarding signal quality and estimating the perfusion and skewness indices as per [
54], we removed the poorest-quality PPG signals. In total, there were 192 and 54 window segments belonging to the NSR and AF classes, respectively.
The second dataset was obtained from the AF subset of the MIMIC III database and made available through [
55]. This dataset contained data from 34 critically ill adults in routine clinical care. Data were recorded using a bedside monitor at 125 Hz, which was then downsampled to 50 Hz to match the previous dataset. The data did not require additional preprocessing or filtering as previously performed [
55]. Manual labels for AF and non-AF subjects were obtained from 34 patients (18 in AF, 16 not in AF). In total, there were 1280 and 152 window segments belonging to the NSR and AF classes, respectively.
Finally, a single window segment in either modality contained a raw ECG/PPG signal lasting 30 s and containing 50 Hz × 30 = 1500 sampling points.
Figure 2a,e represent NSR rhythms for ECG and PPG, respectively, where NSR is observed as a rhythm maintaining a steady rate with no abnormalities.
Figure 2b,f represent AF rhythms for ECG and PPG, respectively, where AF is observed as an irregular rhythm exhibiting unsteadiness and rapid fluctuations.
We further leveraged the ability of HRV/PRV to non-invasively assess the functioning of the cardiovascular autonomic nervous system (ANS). Multiple studies have reported the utility of HRV/PRV in reflecting the sympathetic and parasympathetic activity of the ANS in response to stressors and abnormalities [
56]. It is worth mentioning that the primary criterion considered for almost all HRV/PRV indices is the interval between two successive heartbeats. This interval is known as the NN interval or the RR interval. For ease of reference, we use the term NN interval synonymously with RR interval when mentioning HRV/PRV indices throughout this work. We employed the peak detection method, as outlined in [
57] with respect to QRS complexes for 30 s ECG signals and [
58] with respect to the pulsatile components for 30 s PPG signals to extract the NN intervals from both modalities. We ensured the use of dynamic peak detection algorithms with relatively low computational demand to yield good accuracy, and we used the series of NN intervals detected to derive the six HRV/PRV features mentioned previously.
HRV/PRV indices belong to the time-domain, frequency-domain, and non-linear categories [
59]. Time-domain indices quantify the statistical properties relating to the intervals between successive heartbeats over a period of time. Frequency-domain indices estimate the absolute or relative amounts of signal energy within the component bands. Finally, non-linear indices capture the unpredictability, fractality, and complexity associated with a series of heartbeat intervals [
60]. In this work, we considered only six HRV/PRV indices in total from the time domain and non-linear domain, as relatively longer signal segments (≤1 min) are required for reliable frequency-domain outcomes [
61]. Although longer signals can be extracted from MIT-BIH AF-DB, this limitation is introduced by the UMass-DB signals. As the available PPG dataset consisted mostly of labeled non-contiguous 30 s segments, there was insufficient energy content for accurate power spectrum analysis. For the time-domain indices, we chose the recommended robust median absolute deviation of the NN intervals (madNN), the madNN divided by the median of the absolute differences of their successive differences (mcvNN), the count of pairs of adjacent NN intervals differing by more than 20 ms over the window (pNN20), and the count of pairs of adjacent NN intervals differing by more than 50 ms over the window (pNN50) [
62,
63]. For the non-linear indices, we opted for the suggested Shannon entropy (SHAN) and Correlation Dimension (CD). SHAN quantifies the complexity of the NN interval series distribution based on information theory, and CD relates to chaos theory to measure the number of correlations present in the signal [
64].
We hypothesize that combining the raw signals with a holistic semantic representation of a series of consecutive heartbeats/NN intervals allows for a more robust transferable approach. To observe initial differences in the HRV and PRV metrics between the NSR and AF instances, hypothesis testing was conducted. The Shapiro–Wilk test of normality revealed deviations from the Gaussian distribution across all HRV metrics from both classes and the PRV metrics for the NSR class. Therefore, we applied the non-parametric, distribution-agnostic Mann–Whitney U-Test to compare the distributions for both classes in both modalities. All p-values were <0.05, which is typically taken as the cut-off. Hence, the null hypothesis can be rejected, denoting statistical significance in the differences between the respective indices for both classes. Additionally, we selected the common top HRV/PRV features across all datasets using mutual information feature selection with respect to the target variable. Cut-offs of >0.5 (MIT-BIH AF-DB), >0.2 (UMass-DB), and >0.3 (MIMIC III) were applied to mitigate multicollinearity and overfitting by reducing the total number of auxiliary features.
3.2. Neural Networks
We experimented with various configurations and specifications, leveraging studies that have achieved state-of-the-art performance in heart disease detection [
43,
65,
66,
67].
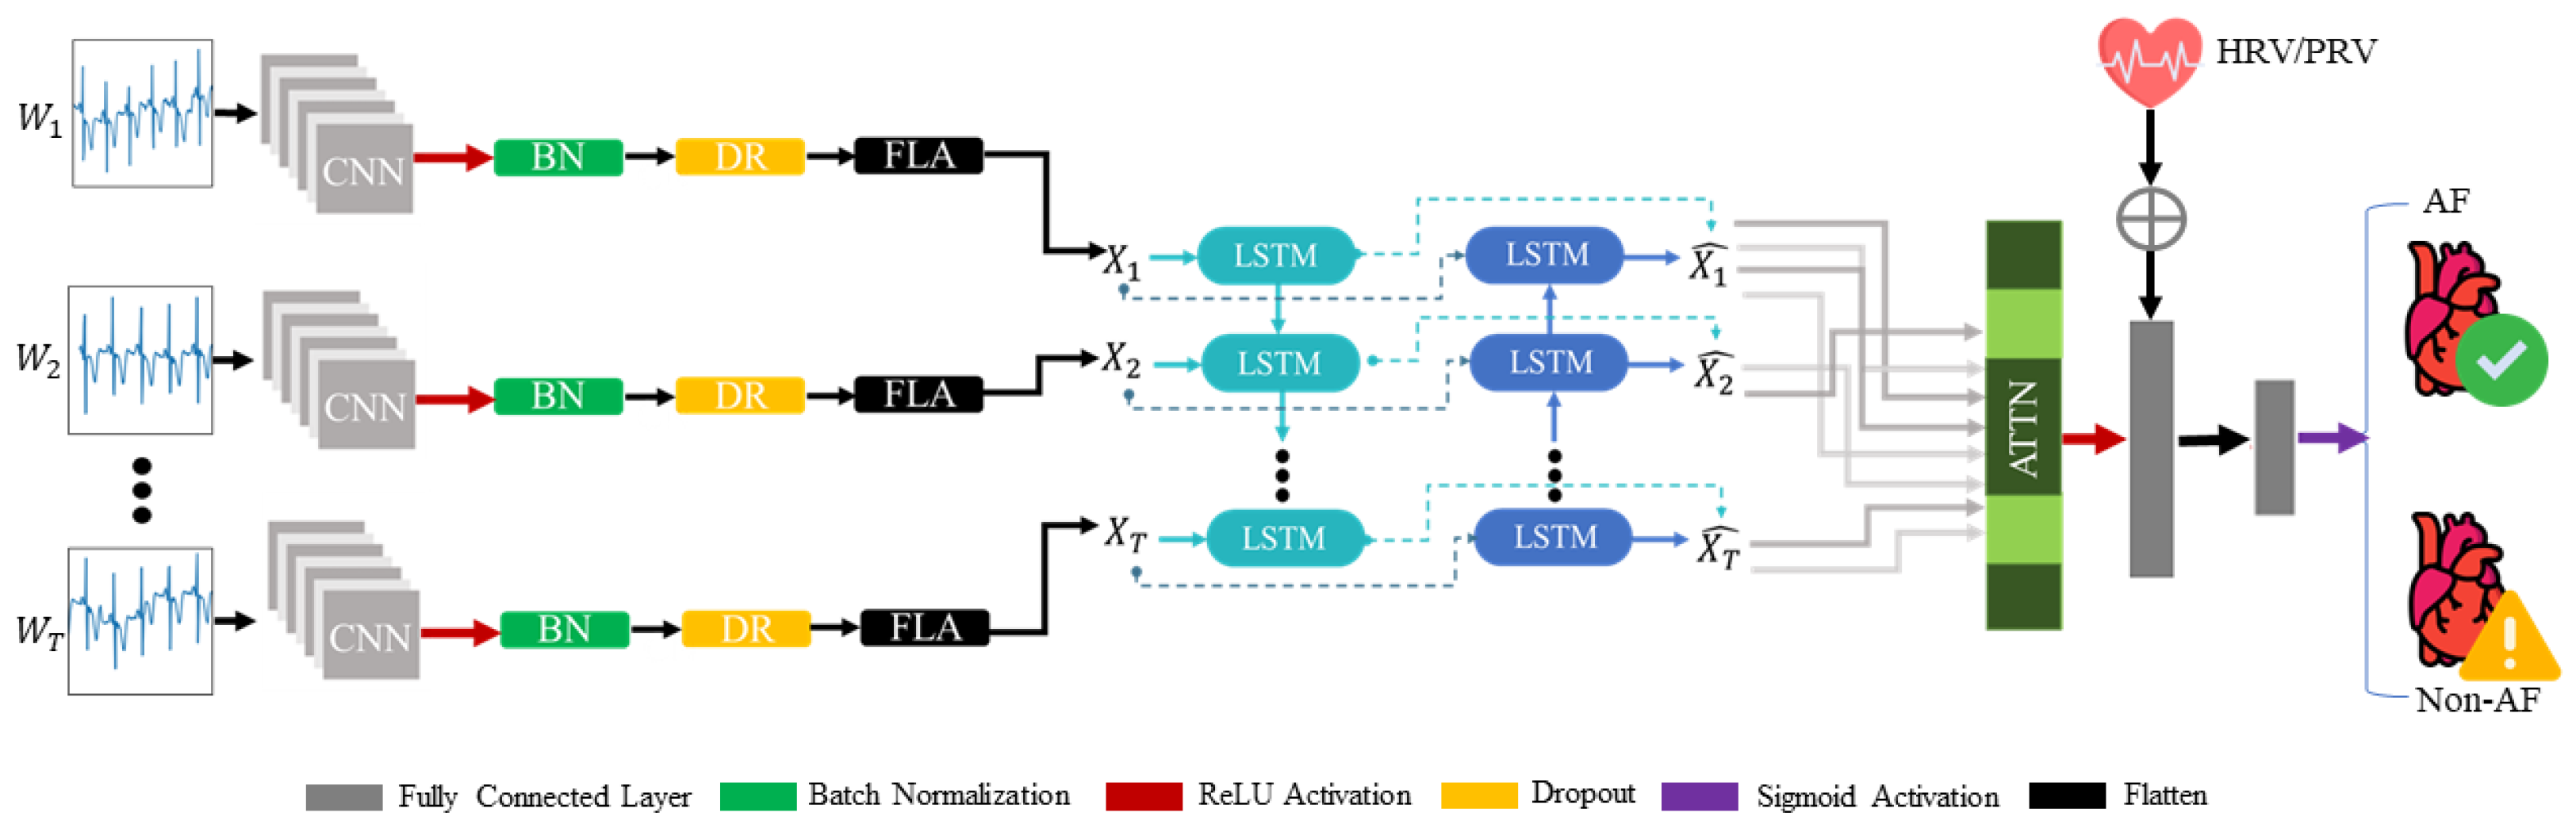
This entire process is illustrated in
Figure 3. After combining the architectural components, the final proposed model consisted of a single dilated convolutional layer with a rectified linear unit (ReLU) applied across a time-distributed wrapper, a BiLSTM layer, and an attention mechanism, followed by two fully connected layers with ReLU and sigmoid activations, respectively. With regard to regularization, batch normalization was added after the convolutional layer reduced the covariance shift, and a dropout layer preceded and succeeded the BiLSTM-Attn block to mitigate overfitting. The model accepts the first input with a dimensionality of
, indicating timesteps of 10(≈3 s), with features representing 150 signal sampling points. The output of the CNN is an
X-dimensional feature vector summarizing the spatial irregularities and patterns found in the raw input signal. This output is propagated into the BiLSTM network, where the temporal patterns are captured and fed into the attention mechanism to highlight the integral aspects of the input. The model then accepts the second auxiliary input of HRV/PRV metrics with a dimensionality of
, and concatenates this to the output of the attention mechanism to aid in a better representation of the input. Finally, this concatenated vector passes through a sigmoid activation function for binary classification of NSR and AF classes.
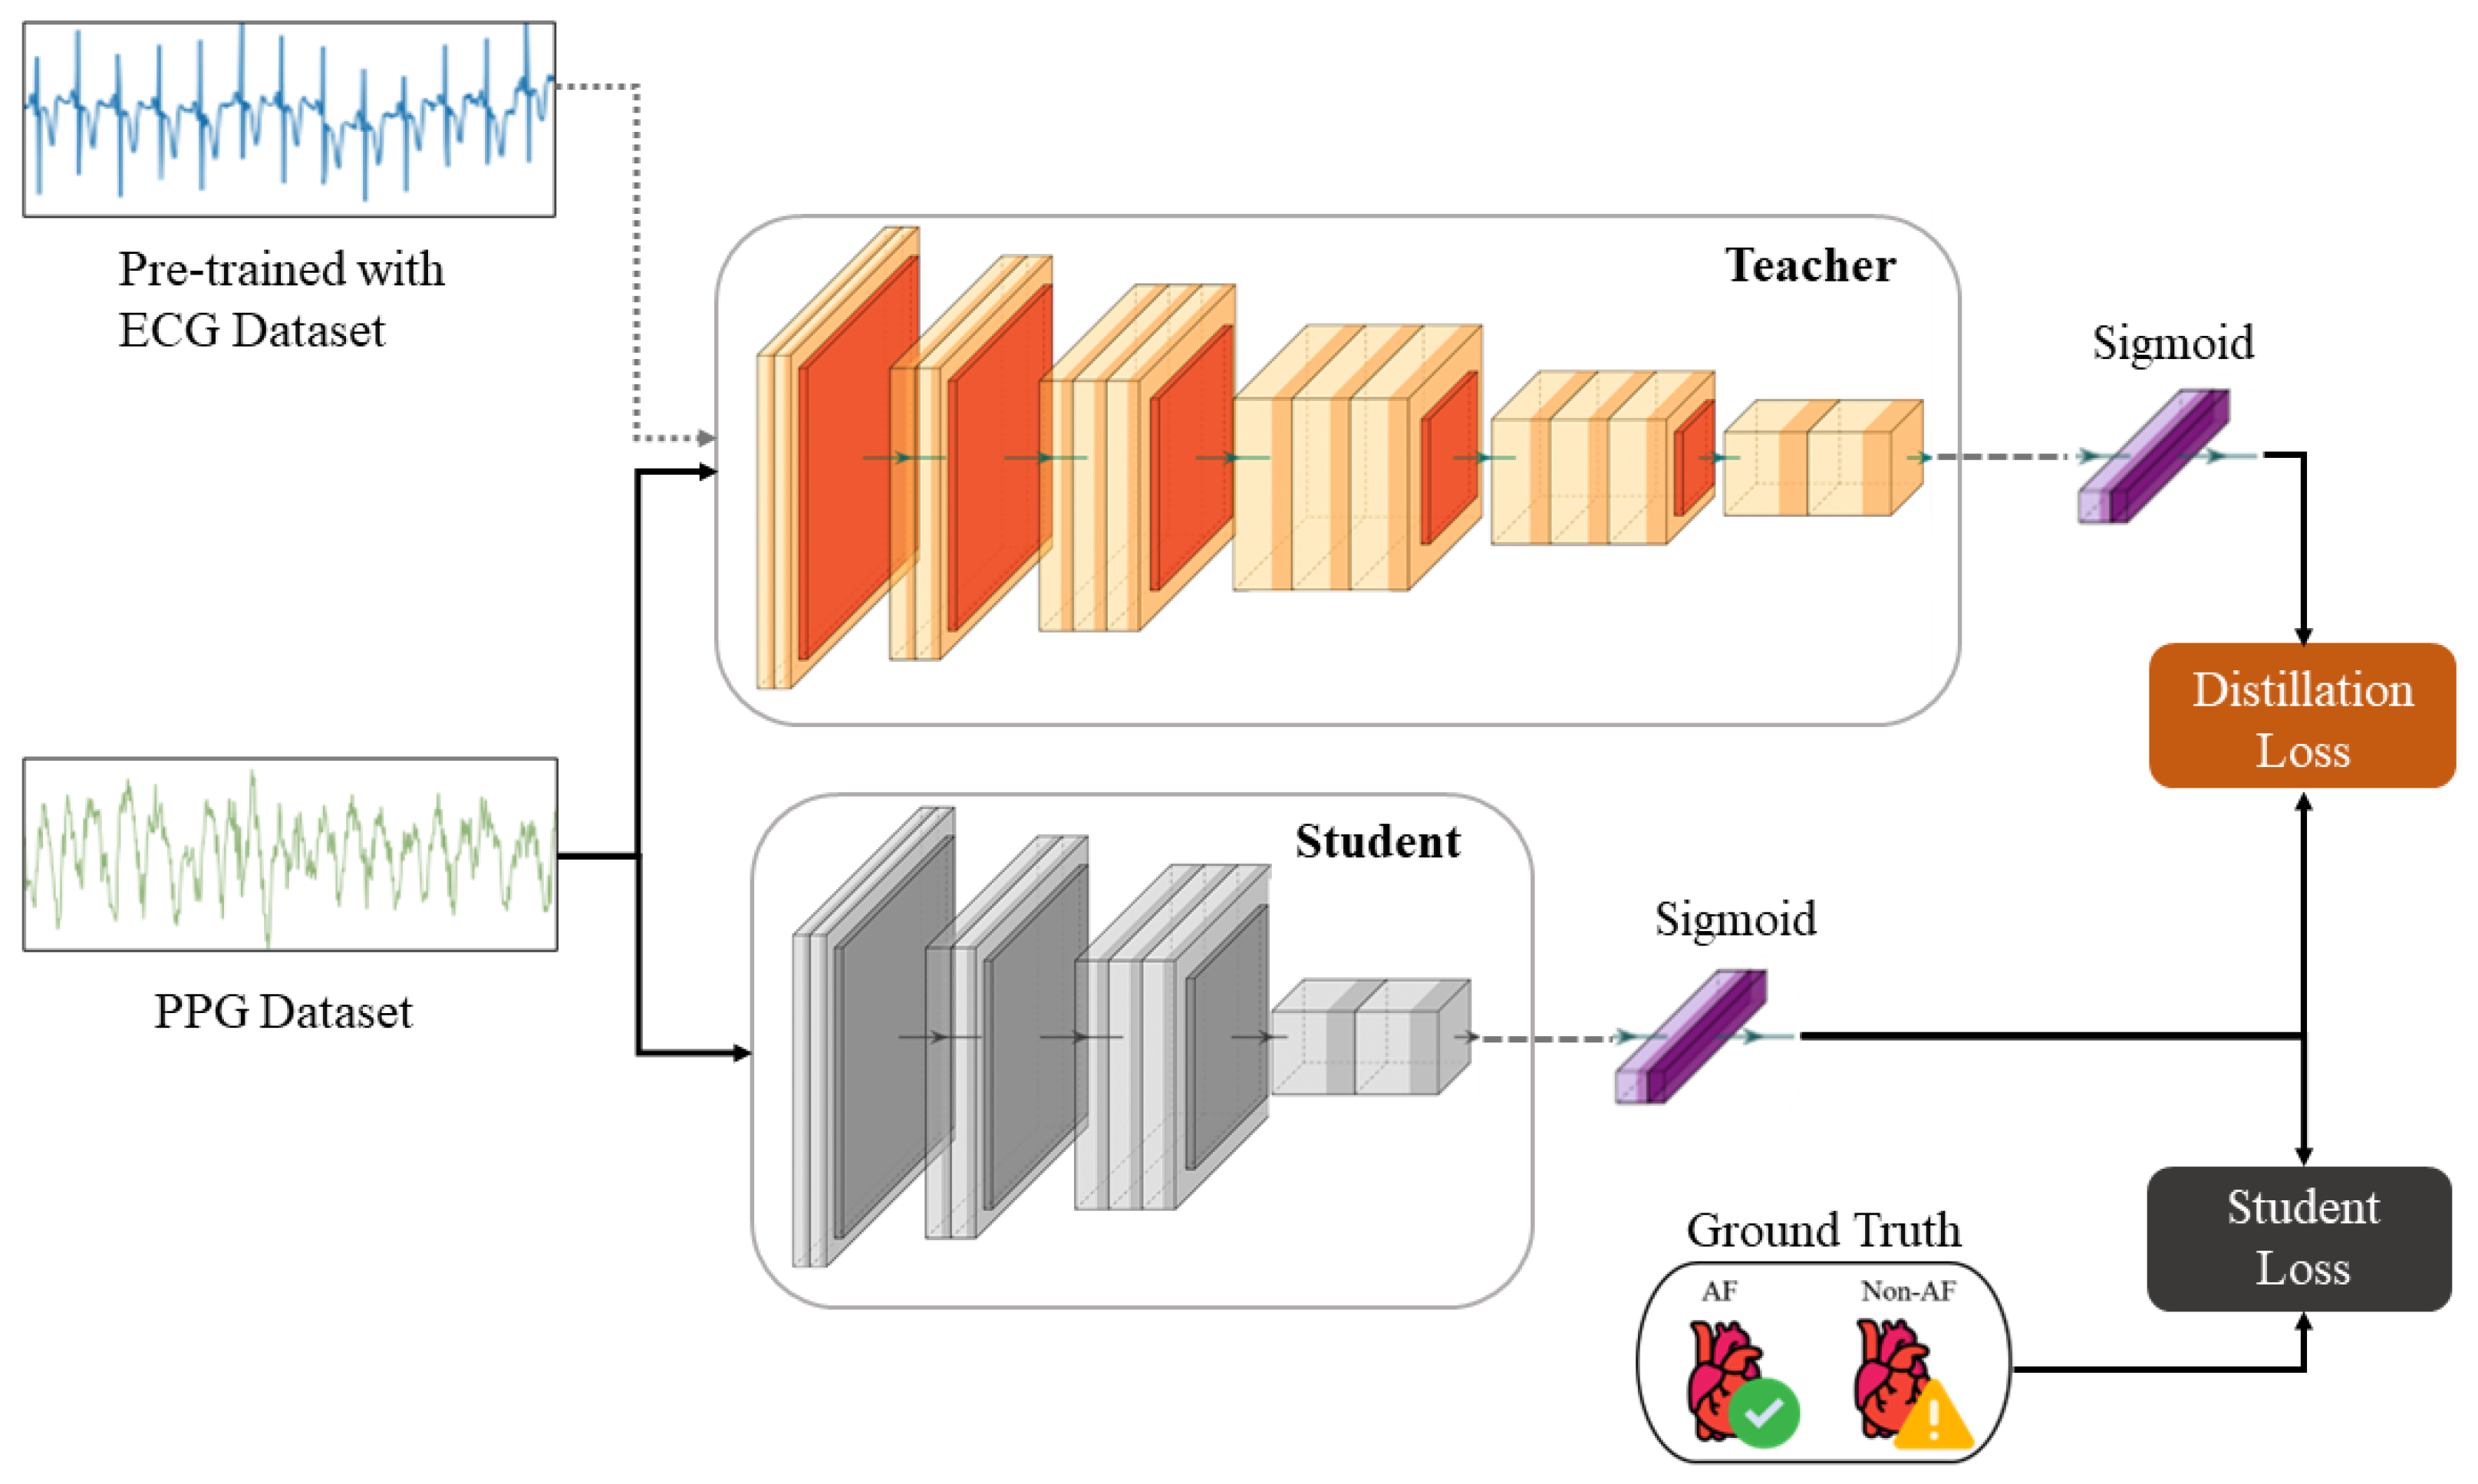
The KD procedure results in a compressed
student model, whereby the knowledge is transferred from the
teacher by minimizing a loss function that attempts to match the softened
teacher logits and the ground-truth labels [
26]. The logits are softened by applying a temperature scaling parameter, which serves to smooth the underlying probability distribution representative of inter-class relationships. We also account for the optimality of the knowledge procedure in terms of consistent teaching and patience, as described in [
68]. The overall loss function incorporating both distillation and
student losses modified for binary classification is defined as
In Equation (
1),
x is the input;
W represents the
student model’s parameters;
y is the ground-truth label;
is the binary cross-entropy loss function;
and
are the logits of the
student and
teacher, respectively;
is the sigmoid function parameterized by the temperature
T; and
is a weighting factor for the
student and distillation losses.
As per the findings of [
26], lower temperatures work better when the
student model is much smaller than the
teacher model, as the latter’s softened labels carry more information that the
student model may not be able to capture. Experimentally, this makes sense, as when we used temperatures ranging from 1 to 10, we found 5 to be the optimal value for our implementation. The process of KD for this work is depicted in
Figure 4. The original
teacher model, as shown in
Figure 3, is trained on the MIT-BIH AF-DB ECG dataset. This model is then fine-tuned on the UMass-DB PPG dataset using TL, where only the last three layers are retrained. This preserves the coarse- and medium-granularity representations of the ECG signals. The fine-tuned model now effectively “teaches” the smaller
student model its internalized knowledge during concurrent supervised training with softened labels. During this last stage, the model’s output logits, not the binary labels, and the sigmoid function are applied during the loss calculation, as shown in Equation (
1).
While our approach of combining CNN and BiLSTM with attention and HRV/PRV features yields improved performance, this architectural complexity introduces notable trade-offs. The concatenated representation increases computational overhead and inference time, which can be particularly challenging for real-time monitoring on resource-constrained wearable devices. This approach also requires the successful extraction of HRV/PRV features, which may fail in cases of severe motion artifacts or poor signal quality.
4. Results
4.1. Experimental Settings
All analyses were conducted using Python 3.8.0 on a workstation running Linux OS with 48 GB of RAM, an Intel Quad-Core Xeon CPU (2.3 GHz), and a Tesla K80 GPU (4 GB VRAM). Data were processed with NumPy 1.19.5 [
69] and pandas 1.1.5 [
70]. Statistical methods and correlation tests were performed using SciPy 1.4.1 [
71], and other data-wrangling tasks were carried out with scikit-learn 1.0.0 [
72]. Visualizations were prepared using Matplotlib 3.2.2 [
73] and UMAP-learn 0.5.3 [
74]. Additionally, for the deep learning models and Grad-CAM pipeline, Keras 2.7.0 [
75] and TensorFlow 2.8.0 [
76] were used. HRV and PRV indices were calculated using NeuroKit 0.2.0 [
77].
The dataset instances were divided into a standard 60-20-20 training–validation–hold-out testing split at the patient level (so that there was no overlap in the data samples in each split), using a five-fold cross-validation approach. To mitigate sampling bias, 5-fold cross-validation was repeated three times and averaged.
Before the signals and HRV indices were fed into the model, Z-score normalization was performed, wherein all ECG and PPG datasets’ signals were fixed with zero mean () and unit standard deviation . This sped up convergence and reduced the amplitude scaling and drastic variability caused by outlier values.
4.2. Evaluation
Classification metrics, including accuracy, sensitivity, specificity, F1 score, and Matthews correlation coefficient (MCC), were used for the quantitative evaluation of the algorithms. Accuracy is the proportion of correct predictions across the total test dataset. Sensitivity is the proportion of AF-deficient students correctly identified as positive, and specificity is the proportion of non-AF patients correctly identified as negative. The F1 score measures the harmonic mean of the precision and recall, i.e., it denotes the balance between the rates of type-1 and type-2 errors. Recent findings show that the MCC can be a more reliable metric, as its score is dependent on all four quadrants of the confusion matrix, i.e., true positives, false negatives, true negatives, and false positives, proportional to both classes [
78].
The final properties of the model for the purpose of replication by the research community are provided in
Table 3. In addition to the proposed model, we also implemented convolution-focused and LSTM-focused variants, and the results are elucidated in
Table 4. A random search algorithm was the hyperparameter selection method used for deciding an appropriate number of convolutional filters, LSTM units, and fully connected layer neurons for the range [4, 8, 16, 32, 64, 128, 256]. After the value of ≈32, noticeably, the tendency to overfit dramatically increased for all models and did not yield a significant increase in performance (less than 1%). It is worth mentioning that our proposed model for ECG classification appeared to take full advantage of the attention mechanism and the HRV features to elicit an average ≈6% improvement across all metrics.
For the ECG model, the batch size used for training was 32, and the number of epochs was 25. For the same larger ECG model (teacher) fine-tuned on the PPG dataset, the batch size used for training was 16 with 40 epochs.
When applying TL, the teacher only ever sees the ECG data in a pre-training context and only one signal type at a time. To provide a fair comparison, a model of the same size as the teacher was trained from scratch using the PPG datasets as well, with a batch size of 16 and 40 epochs. Finally, the student model that was reduced by a factor of 32 was trained with a batch size of 16 for 30 epochs using KD and from scratch. Early stopping and automated reduction of the learning rate by a factor of 0.5 upon a plateau in the validation loss were implemented as callbacks during training for all aforementioned processes.
We rationalize the CNN-BiLSTM architecture performance as follows: CNNs capture spatial features such as shapes, patterns, peaks, and troughs (i.e., low level), whereas LSTM captures temporal dependencies and sequential information (i.e., high level), so there is better representation capability.
Table 5 and
Table 6 report the metrics for the TL and KD experiments on the UMass-DB and MIMIC-III PPG datasets, respectively. The application of TL resulted in an average ≈48% improvement across all metrics on the small PPG dataset compared to the baseline
teacher, indicating that the AF versus NSR representation is indeed transferable to some degree. After using TL and KD in conjunction, the student model that was 32x smaller than the
teacher achieved average performance boosts of ≈13.6% and ≈1.38% across all metrics on each dataset. Note that the accuracy and specificity were higher than the other metrics due to the class imbalance in favor of the NSR majority. High specificity indicates a high true negative rate, making the model efficient in correctly identifying NSR rhythms. We observed that the average standard deviation across both PPG datasets also decreased by ≈4% and 1%, respectively.
4.3. Interpretability
We used two techniques to confer a sense of interpretability to the classification decisions made by the model to aid clinicians’ diagnoses. Inspired by the practicality of Gradient-weighted Class Activation Maps (Grad-CAM) [
79] in ECG analysis presented in [
80,
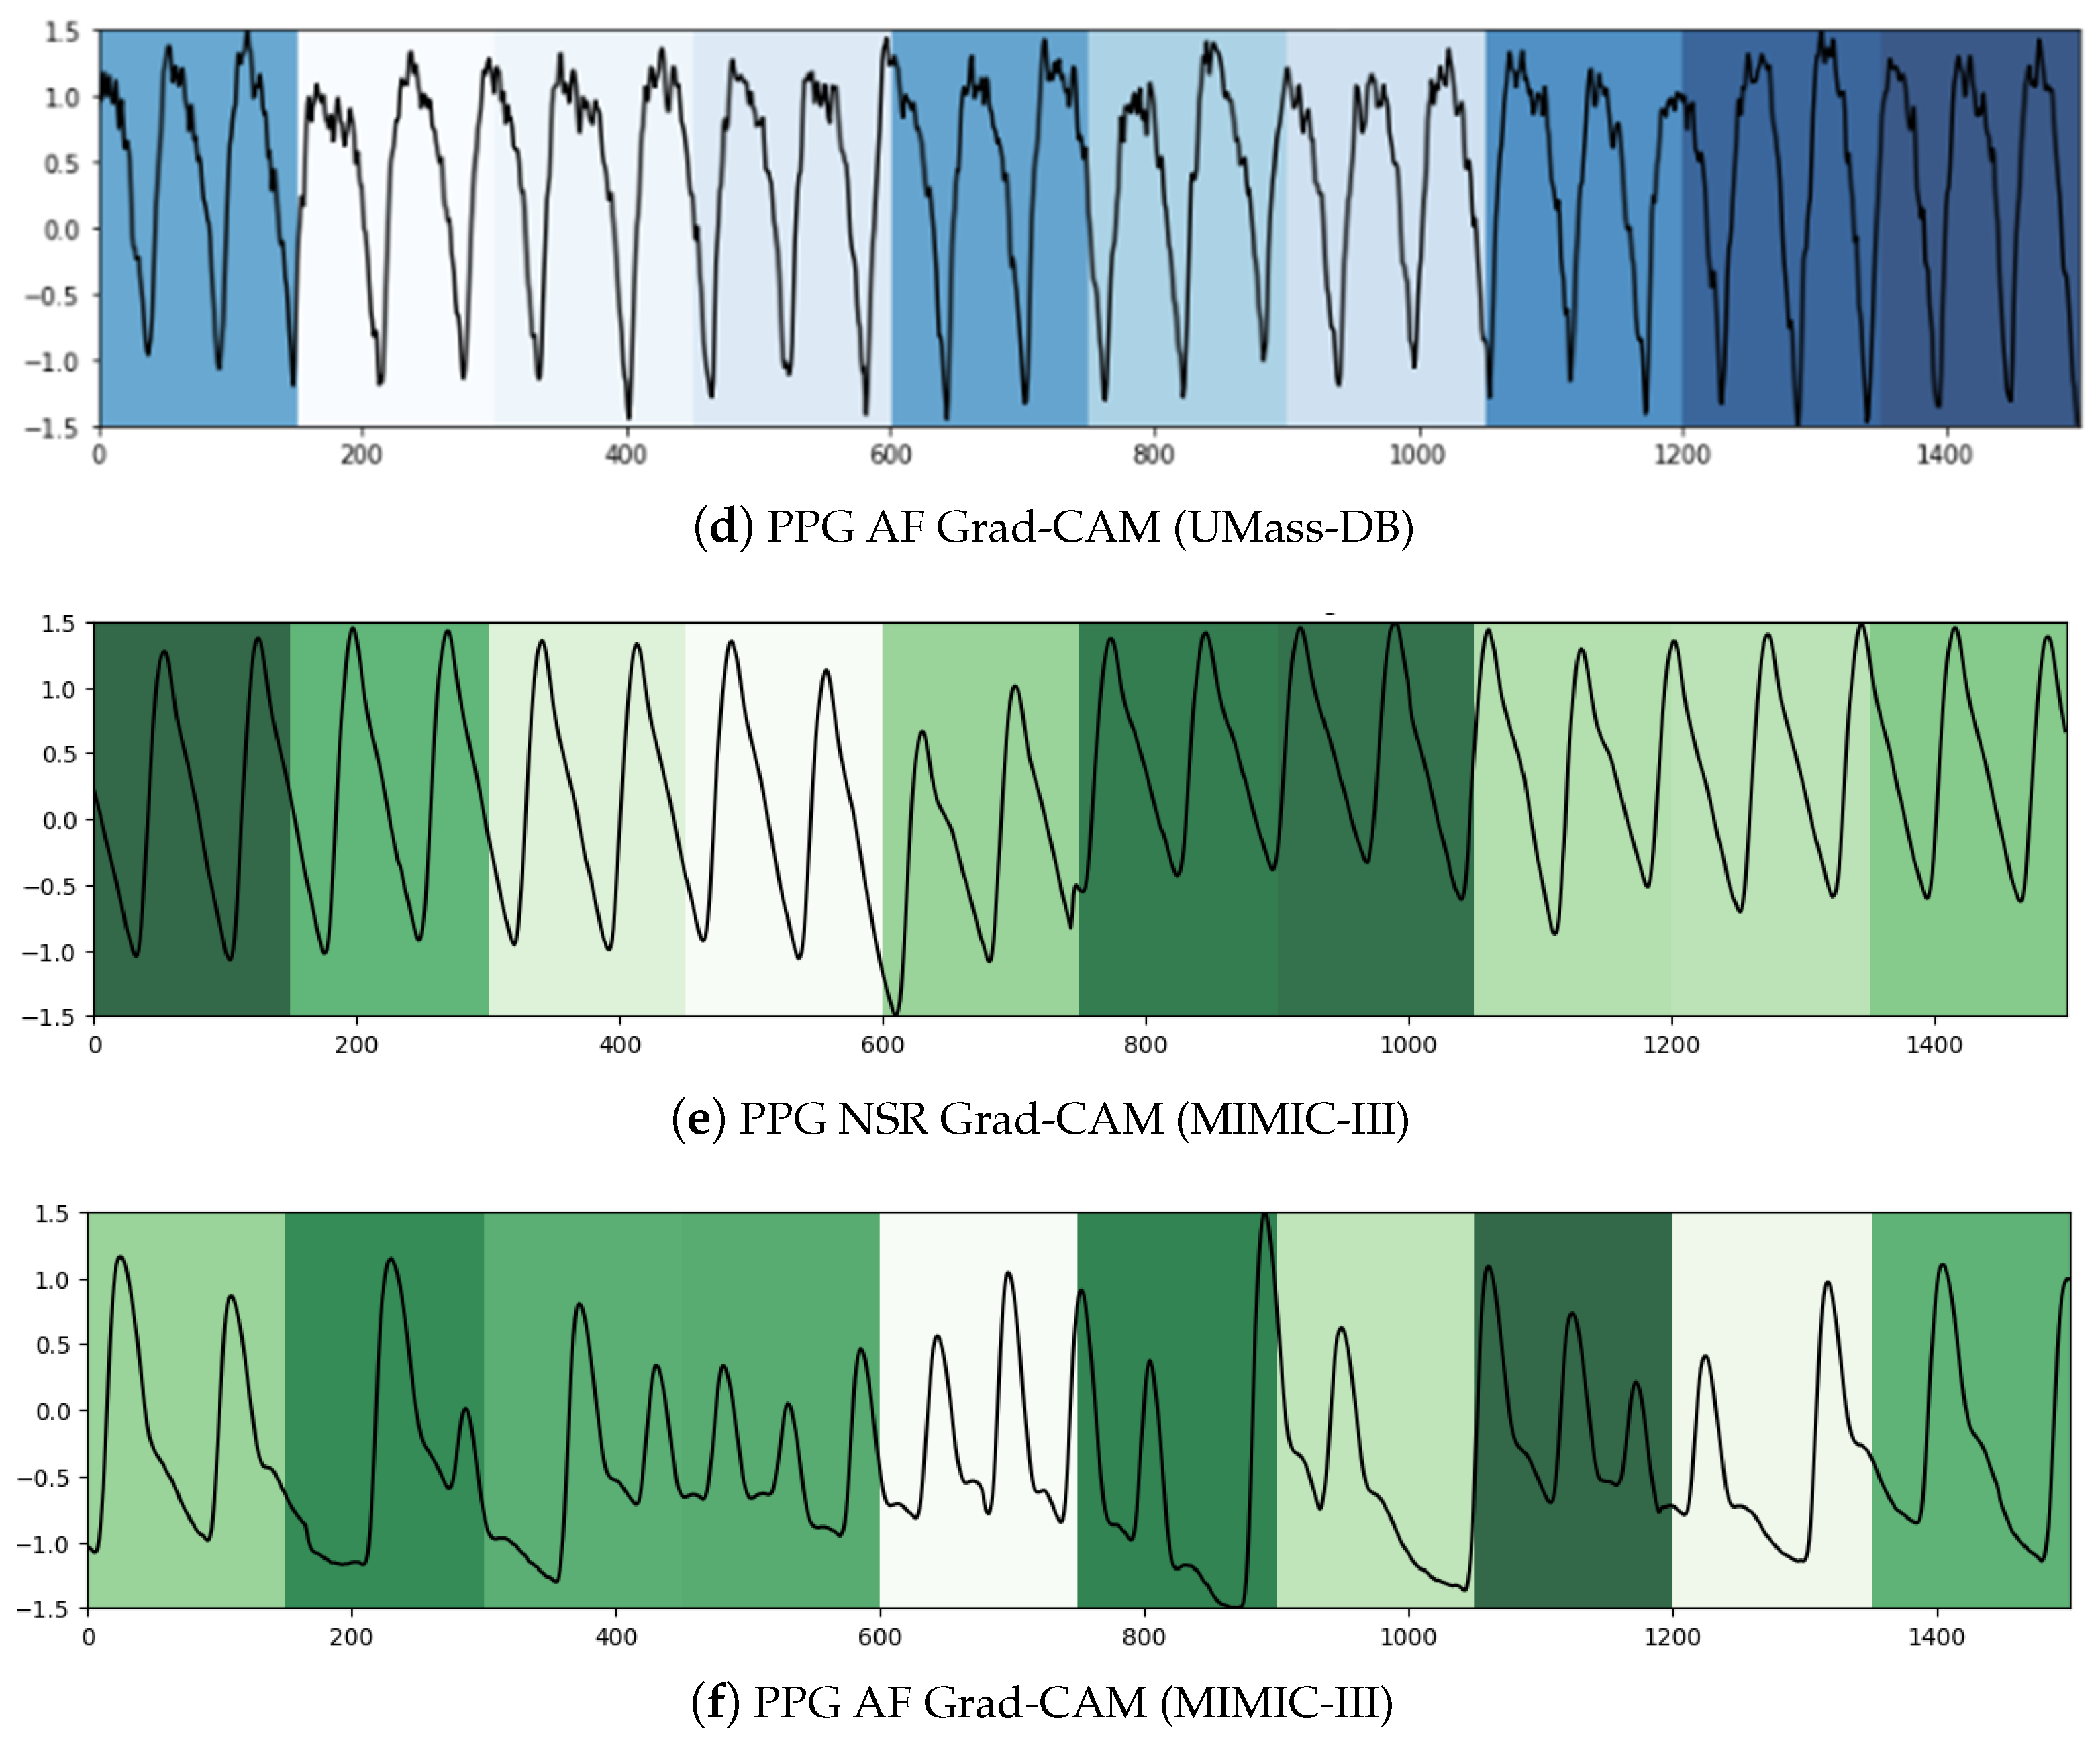
81], it was the first technique we leveraged to shed light on the black-box operations of DL algorithms. Grad-CAM uses the gradients of a target class in terms of either logits or labels propagating to the final convolutional layer to generate a comprehensible localization map highlighting the features of the input pertinent to predicting the target class. This method allowed us to visualize the activation regions of the input that the model deemed indicative of class-discriminative patterns. As can be seen in
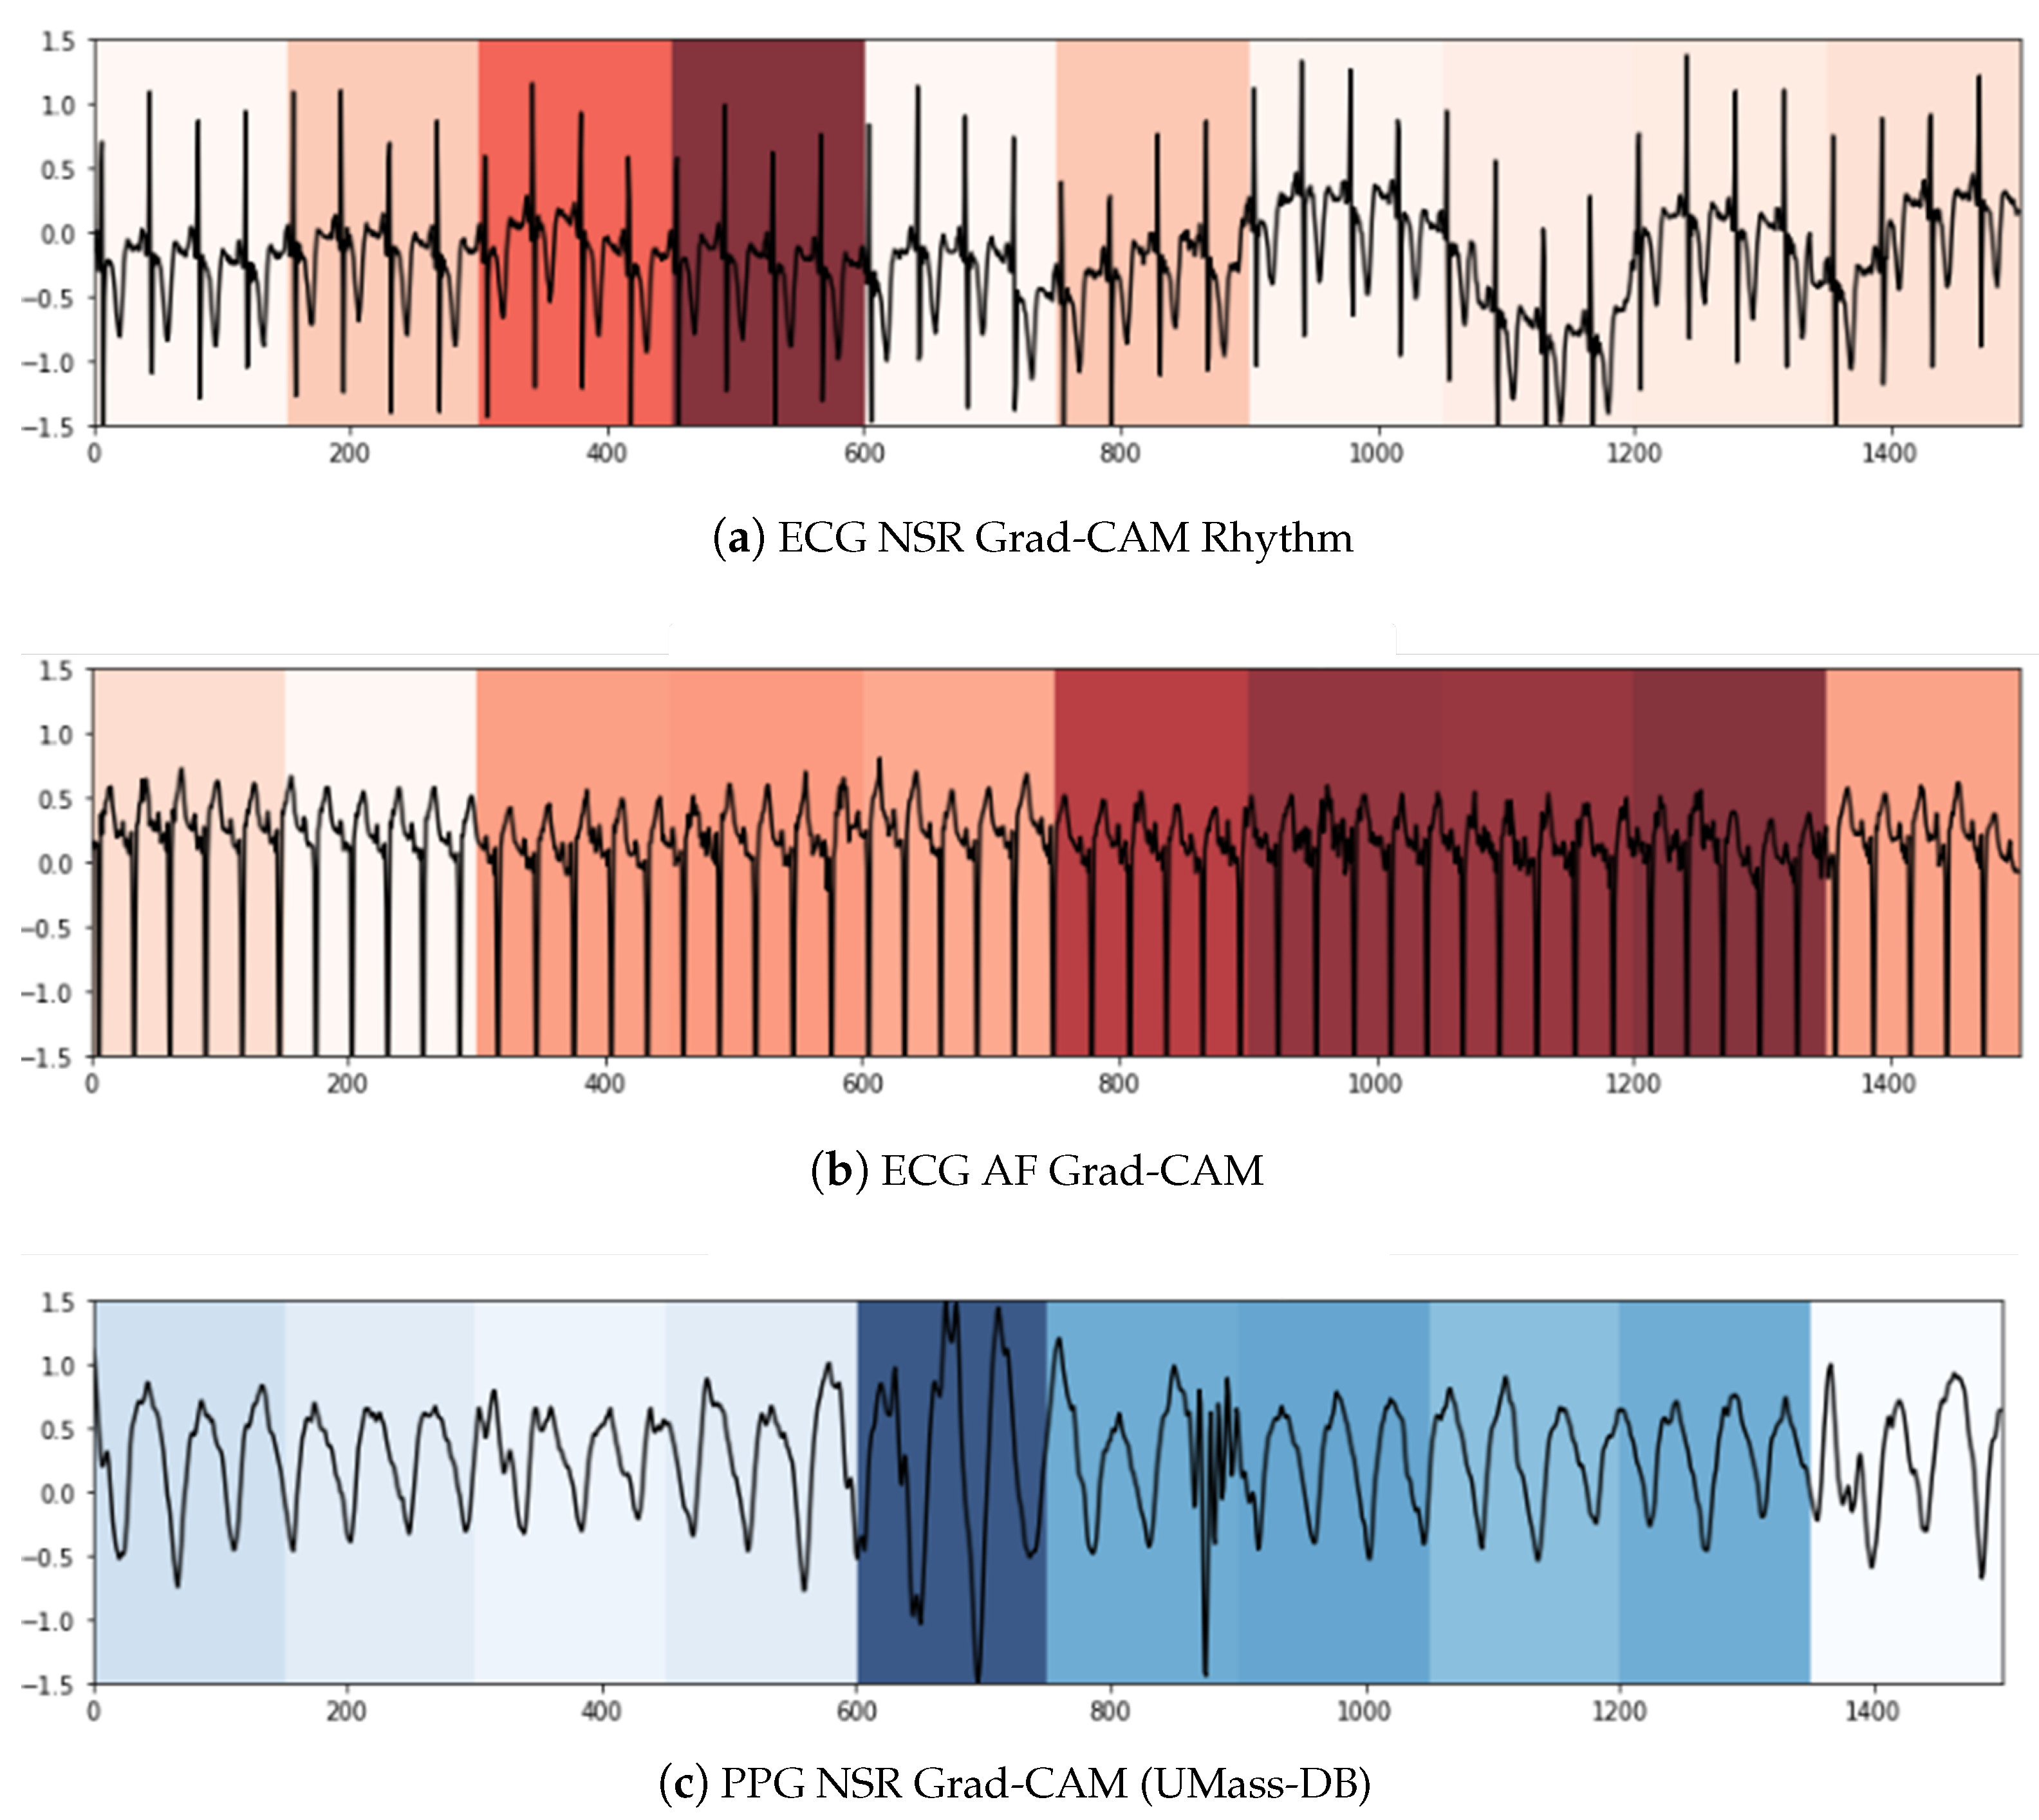
Figure 5a,c, the NSR rhythm for ECG and PPG, respectively, has periodic intervals, and these normal regions are indicated in the heat map with similar color intensities. In
Figure 5b,d, the regions with specific intensities of interest, as detected by the CNN component to make the classification decision of AF, can be observed for the ECG and PPG segments, respectively.
To summarize, within the purview of interpretability, we note that the Grad-CAM highlighted areas can be further examined by a clinician to ascertain the validity of the model’s internal functioning and reiterate the latter’s role as a clinical support framework. For longer signal durations, measures of complexity and correlations may hold additional utility.
5. Discussion
This study explored the utility of TL and KD in aiding the performance of downstream AF classification across two different one-dimensional signal representations reflecting cardiac activity. During the initial phase of experimentation on the MIT-BIH AF-DB ECG dataset, we observed that convolutions or LSTMs alone were not able to completely capture the underlying patterns. By combining these components, we obtained a model that was essentially greater than the sum of its parts, especially when augmented by attention and auxiliary indices. It can be surmised that the spatio-temporal nature and complexity of the signal data validate the need for larger, complex structures to capture the intricacies in the latent space for larger datasets. The positive results of fine-tuning this representation on a smaller dataset and then applying KD imply that condensing the learned information is more beneficial than random initialization for the same problem.
Downstream performance: With regard to UMass-DB, we note that the variance in performance was quite disparate, likely owing to the presence of greater-than-anticipated noise elements in the student models. This was less persistent for the teacher model, where TL reduced the variance in cross-fold performance, particularly for sensitivity and the MCC. This was likely due to the larger fine-tuned model being able to distinguish between the NSR and AF samples in the PPG dataset, which it was unable to do before TL. While TL and KD did in fact elevate the performance of a much smaller student model as opposed to training from scratch, larger models may be preferred if more accurate predictions are desired. However, smaller models have the benefit of being able to be deployed on edge devices, where, based on the trade-off between false positives and false negatives, their classifications can be meaningful for a clinician remotely. Ultimately, it depends on the priority of accuracy or frequency, i.e., seldom but accurate versus often but less accurate.
However, we observed that for the MIMIC-III dataset, where the signals were acquired at the bedside in a clinical setting, the baseline performance was already considerably high. In this context, both TL and KD did not offer much additional value (i.e., 1%). We hypothesize that this was due to two primary reasons: data size and quality. First, the dataset was 10× the size of the UMass-DB dataset and contained more representative and diverse samples for both of the predicted classes. Second, the signals had low saturated noise and were consistent in terms of morphology owing to standardized acquisition. We have seen the arguments in [
82] and agree that with smaller datasets, fine-tuning approaches yield better performances when looking at single-channel ECG signals. The authors emphasized that transferring knowledge may not always necessarily or consistently improve performance. Moreover, as the number of data samples increases, the student predictions naturally move closer to those of the teacher, provided that the capacity and architecture are sufficient for the scale of the dataset and the complexity of the data [
83]. Therefore, we can summarize that sharing initialization (with TL) increases alignment in the activation space, but KD does not offer additional advantages for the MIMIC-III dataset.
Complementary findings: Compared to similar studies focusing on efficient TL or KD paradigms for AF detection [
32,
43,
67], our models achieved comparable results, with the added advantage of a greater model compression ratio with respect to the scores obtained. More recent studies used a pipeline similar to our work to estimate systolic and diastolic blood pressure [
84] and for sleep staging [
85]. The latter involved combining PPG and wrist-worn actigraphy as input to the student model, whereas the teacher model was pre-trained on ECG data acquired during sleep. The results mirrored ours (in the context of AF) for sleep analysis, as it appears empirically that single-channel sensors collected from different populations, captured at different sampling rates, can be adapted for other types of sensors. Specifically, the electric field-based modality of ECG is indeed comparable to the light absorption mechanisms of PPG.
Research implications: There is an increasing presence of foundational models across different domains, with architectures that are pre-trained on large-scale unlabeled data using representation learning, making them adaptable to a variety of tasks while accommodating increased complexity [
86]. Our proposed work considered supervised pre-training on a related modality for better representations due to the scarcity of large, diverse public datasets in this field and tangentially aligns, in principle, with the new paradigms of foundational models. The work by [
87] leveraged the Apple Health and Movement study (AHMS) involving 140,000 participants and 3 years of wearable ECG signals to implement a foundational model. This involved self-supervised pre-training with participant-level positive pair selection, a stochastic augmentation module, and a regularized contrastive loss optimized using momentum training. The downstream tasks involved the classification and regression of age, body mass index, and biological gender.
Alternatively, [
88] proposed a foundational model for general PPG signal analysis with self-supervised contrastive learning using a large semi-private dataset. The premise was that representations of PPG signals from similar physiological states should be similar, and bad-quality PPG signals in the temporal vicinity of a good-quality one from the same person are likely to be from a similar physiological state. Downstream performance was reported for AF detection, blood pressure, heart rate, and respiration rate estimations.
Interestingly, [
87] advocated for the future use of HRV/PRV indices to infer valuable insights from pre-trained embeddings, which is a direction we have explored. Additionally, [
88] achieved generalization across different qualities of data with certain robustness to artifacts and noise but reported limitations in successfully detecting conditions due to the scarcity of annotated PPG signals for diseases. Our work exhibits promise in transferring ECG representations to downstream PPG tasks with high fidelity and contributes to bridging similar gaps in the aforementioned line of research regarding foundational models.
Limitations: We refer to the findings of [
83,
89], who argued that although KD can indeed improve
student generalization, there can be discrepancies between the predictive distributions of the
teacher and the
student, even when they match closely, due to the inductive and implicit biases of the dataset considered, the nature of the domain, and the augmentation strategies. For instance, some of the information gained by the
teacher is lost during the distillation process, resulting in a slight drop in performance in the
student model. We suspect that this is because the morphological characteristics of the signals are not preserved independently during distillation, leading to some misclassifications for borderline instances, where AF and NSR signals have similar temporal features and/or higher signal-to-noise ratios. However, the top-level hierarchical features common to both ECG and PPG, such as the intervals between peaks, the periodic behavior, and the general fluctuations of the waves, appear to be captured. Additionally, measuring biological signals is inherently challenging because of the low quality of data (in naturalistic settings), saturated noise, and artifacts (patient movement and/or sensor displacement), as well as individual physiological variations and inter-device differences [
90].
Future work may look at the determination of clinically meaningful thresholds through collaborative efforts with cardiologists and the consideration of specific demographics, as well as regulatory requirements.
We therefore envision our work as an initial study emphasizing the utility of different training approaches in the form of TL and KD to develop uniform knowledge representation-based models to enable continuous detection of cardiac arrhythmia. This supports the creation of enhanced foundational models that utilize both ECG and PPG to capture more relevant patterns and improve representation learning for more varied downstream tasks.
6. Conclusions
This work proposes the use of TL and KD with deep neural networks trained on large-scale ECG datasets for the purpose of AF classification in smaller PPG datasets. The objectives are to investigate the feasibility of a unified, modality-agnostic knowledge representation for AF classification and to validate performance measures during distillation and subsequent compression.
We purport that using both raw signals and derived HRV/PRV features can increase the robustness of model behavior in free-living conditions. This can be particularly beneficial when adapting learned representations across modalities due to the implicit translation invariance to noise and motion artifacts.
Empirically, we find that TL and KD enabled a much smaller model (32× smaller) to achieve performance boosts of approximately 13.6% and 1.38% in terms of accuracy, specificity, sensitivity, F1 score, and MCC across two very different types of PPG datasets by leveraging and condensing innate information from training on a large ECG dataset. Additionally, we employ interpretability methods using Grad-CAM to elucidate the inner workings of the convolutional layers and estimate the contribution of HRV/PRV-derived features. We highlight that KD may not offer much additional utility if the available data quality and size are sufficiently high.
Future research could involve the acquisition and testing of the proposed method with additional PPG datasets using foundational model architectures, performing quantization for edge device employment, and conducting longitudinal studies with a controlled cohort of patients to attain qualitative evidence of low-cost wearable monitoring.


