Article

Digital Twin-Driven Stability Optimization Framework for Large Underground Caverns

by
Abubakar Sharafat
1,*,†,
Waqas Arshad Tanoli
2,*,†,
Muhammad Umer Zubair
2 and
Khwaja Mateen Mazher
3
1
Department of Civil & Environmental Engineering, Hanyang University, Seoul 04763, Republic of Korea
2
Department of Civil and Environmental Engineering, College of Engineering, King Faisal University, Al-Ahsa 31982, Saudi Arabia
3
Department of Architectural Engineering and Construction Management, King Fahd University of Petroleum and Minerals, Dhahran 31261, Saudi Arabia
*
Authors to whom correspondence should be addressed.
These authors contributed equally to this work.
Appl. Sci. 2025, 15(8), 4481; https://doi.org/10.3390/app15084481
Submission received: 26 March 2025 / Revised: 8 April 2025 / Accepted: 15 April 2025 / Published: 18 April 2025
(This article belongs to the Special Issue Advances in Tunnel and Underground Engineering—2nd Edition)

Abstract

:
With rapid urbanization, the utilization of underground space has become an important part of infrastructure. However, the stability of underground spaces such as large caverns remains a key challenge in civil engineering throughout the lifecycle of a project. Traditional methods of stability assessment rely on static models and periodic monitoring and often fail to capture real-time changes in rock behavior, leading to potential safety risks and, in severe cases, even the collapse of underground infrastructure. To address this challenge, this study introduces a digital twin (DT) framework to improve stability assessments and monitor deformations in underground structures. The framework enables the continuous monitoring and adaptive optimization of rock support systems by combining real-time sensor data with virtual simulations. A five-dimensional DT framework comprises physical objects, virtual objects, service systems, DT data, and their interconnections. It incorporates six key modules, which are structure, geology, material, behavior, performance, and environment, to enhance the understanding of cavern stability. The framework is based on Industry Foundation Classes standards to ensure seamless data exchange, interoperability, and the standardized representation of geotechnical and structural data. A seven-step methodology is developed for this framework, encompassing geological assessment, virtual modeling, Building Information Modeling (BIM)-based design, construction processes, real-time monitoring, and optimization strategies. To evaluate its effectiveness, the framework is applied to a case study, demonstrating improvements in deformation monitoring and rock support efficiency. The findings highlight the potential of integrating DT with BIM to enhance safety, reliability, and long-term stability in underground construction projects.

1. Introduction

Building and maintaining large underground caverns is an important part of modern infrastructure, especially for projects like hydroelectric power plants, storage facilities, and transportation tunnels [1]. These caverns face challenging conditions, such as changes in rock properties, ground stress, and water pressure, which can affect their stability and long-term safety [2]. Geological investigations play a critical role in the design of underground caverns, as they provide essential insights into the rock mass conditions that influence stability and excavation performance [3,4]. These investigations typically involve a combination of field and laboratory techniques, such as geological mapping, core drilling, logging, geophysical surveys, and the testing of rock samples to evaluate properties like uniaxial compressive strength, tensile strength, and elastic modulus [5,6]. Understanding features such as discontinuities, in situ stress regimes, and groundwater behavior is also vital to assessing construction feasibility and selecting suitable support systems [7,8]. Ensuring the stability of these structures is essential because any failure can lead to serious problems, like loss of life, economic damage, and harm to the environment [9,10]. Traditionally, engineers have used static models and regular monitoring to assess stability during the design, construction, and operation phases [11]. These methods may not detect real-time changes in rock behavior during or after construction [12]. To overcome similar problems in other infrastructure projects, new technologies like DT and BIM are being adopted [13,14]. These tools can also improve the accuracy and efficiency of stability management in underground projects [15].
Digital twin technology, which involves creating a dynamic virtual model of a physical system continuously updated with real-time data, has emerged as a powerful tool in recent years [16,17]. It holds significant potential for enhancing decision making and predictive analysis across various engineering disciplines [18,19]. Recently, there has been a lot of effort in the use of DT in civil engineering and its application across a range of infrastructure projects, such as bridges, buildings, and transportation systems [20,21]. It plays a crucial role in managing construction projects by creating a dynamic and interactive model that reflects the actual physical structure [22]. This allows engineers to continuously monitor conditions and optimize the stability of infrastructure projects in real time [23]. When combined with BIM, it provides a detailed digital overview of a facility’s physical and functional elements; the integration forms a comprehensive framework [24,25]. This approach enhances the ability to simulate, monitor, and optimize the construction projects throughout their entire lifecycle [26]. The use of DT in underground engineering, especially for large caverns, is still in its early stages [27]. A major challenge in this field is effectively integrating real-time data from various sources, including geological surveys, laboratory experiments, and construction site sensors, into a unified virtual model [28]. This model must be capable of accurately predicting and responding to changes in rock mass behavior [29]. This challenge becomes even more complex due to the necessity for interoperability among various underground construction activities and data formats [30]. Ensuring smooth data exchange and effective collaboration among project stakeholders is essential to addressing this issue.
Recent developments in information technology and data analytics have made it more practical to adopt digital twin-based frameworks in underground engineering [31,32]. However, traditionally, underground construction projects rely heavily on hardcopy records, paper-based reports, and flat-file storage systems (e.g., spreadsheets, PDFs, and basic CAD drawings) [33]. Currently, BIM is primarily used for design and construction, offering benefits such as 3D visualization, clash detection, and improved coordination among stakeholders [34]. Some projects have adopted 4D (time) and 5D (cost) BIM for scheduling and cost estimation, but the lack of real-time data integration limits its full potential [35]. Unlike above-ground structures, underground environments present unique challenges, including difficulty in deploying Internet of Things (IoT) sensors for real-time monitoring, the absence of standardized frameworks for merging BIM with DTs, and the computational demands of processing large-scale geotechnical and sensor data [36]. There has been an effort to design optimization and simulation of Tunnel Boring Machines (TBMs) by integrating DT with Virtual Reality (VR) to streamline the assembly process and performance evaluation of Tunnel Boring Machine (TBM) tunnelling operations [37,38]. Recent research has introduced a digital twin-driven blast-induced vibration optimization method aimed at enhancing blasting operation [39]. A digital twin-enabled decision support method for the proactive maintenance of Tunnel Electro-Mechanical Equipment (TEE), integrating BIM, IoT, and Semantic Web technologies to enhance real-time fault detection and predictive maintenance was developed [40]. However, typical large underground cavern construction projects that use drill-and-blast tunnelling methods still need attention.
With the current advancements in real-time sensor networks, AI-driven analytics, and high-performance computing, there is great potential for adopting DT in underground cavern construction [41,42]. It can provide significant benefits for optimizing the construction and stability of underground structures [43]. One major advantage is the ability to develop a virtual model that simulates rock mass behavior under different conditions, offering valuable insights into potential risks and challenges during construction and operation [44]. Additionally, continuously updating the real-time information from the construction site enables proactive decision making and risk management, helping to prevent unexpected failures or project delays [45]. Despite the increasing adoption of BIM in underground construction, its integration with DT technology remains largely unexplored [46]. Existing research has primarily focused on BIM applications in design and construction, with limited studies addressing its transition into an operational digital twin capable of continuous monitoring, analysis, and optimization. Furthermore, the lack of standardized methodologies for integrating sensor networks, geotechnical monitoring, and real-time performance data with BIM models presents a significant challenge. Additionally, underground construction has fewer case studies demonstrating successful BIM-enabled DT, further slowing adoption. Addressing these limitations is crucial to advancing underground construction towards data-driven, real-time decision making. Furthermore, the introduction of Industry Foundation Classes (IFC) standards in underground engineering has been under the process of development for data exchange and improving interoperability [47,48,49]. It is necessary to explore the potential of DT integration and key challenges for a structured approach for seamless data connectivity in underground cavern construction.
This research study develops a novel DT-driven framework that provides real-time feedback from the real world to a virtual BIM-based environment, enabling real-time decision making for optimizing stability assessment and rock support strategies. The proposed approach follows a seven-step DT-driven framework to integrate BIM, sensor-driven feedback loops, and predictive modeling, enabling real-time excavation progress tracking, as-built information management, and convergence monitoring based on an IFC-based data structure. It begins with geological assessments and laboratory testing, followed by BIM-based virtual modeling and numerical analysis for excavation and rock support design. Real-time sensor deformation data are continuously integrated to update the digital twin. The proposed DT framework is validated through a real case study of the Neelum Jhelum Hydropower Project powerhouse cavern construction, demonstrating its effectiveness in real-world underground construction. This research study advances data-driven decision making in underground infrastructure, contributing to the development of intelligent, resilient, and sustainable underground spaces. This approach will ultimately enhance underground cavern construction management and lifecycle stability.
This research study contributes to be existing body of knowledge by developing a comprehensive DT framework tailored for the unique challenges of large underground cavern construction, particularly focusing on real-time stability optimization. The innovation can be highlighted in the following aspects:
  • This study introduces a novel five-dimensional digital twin (DT) framework specifically designed for the stability optimization of large underground caverns, addressing the limitations of traditional static assessment methods.
  • The proposed framework integrates real-time sensor data with virtual simulations and Building Information Modeling (BIM), enabling the continuous monitoring and adaptive optimization of rock support systems throughout the project lifecycle.
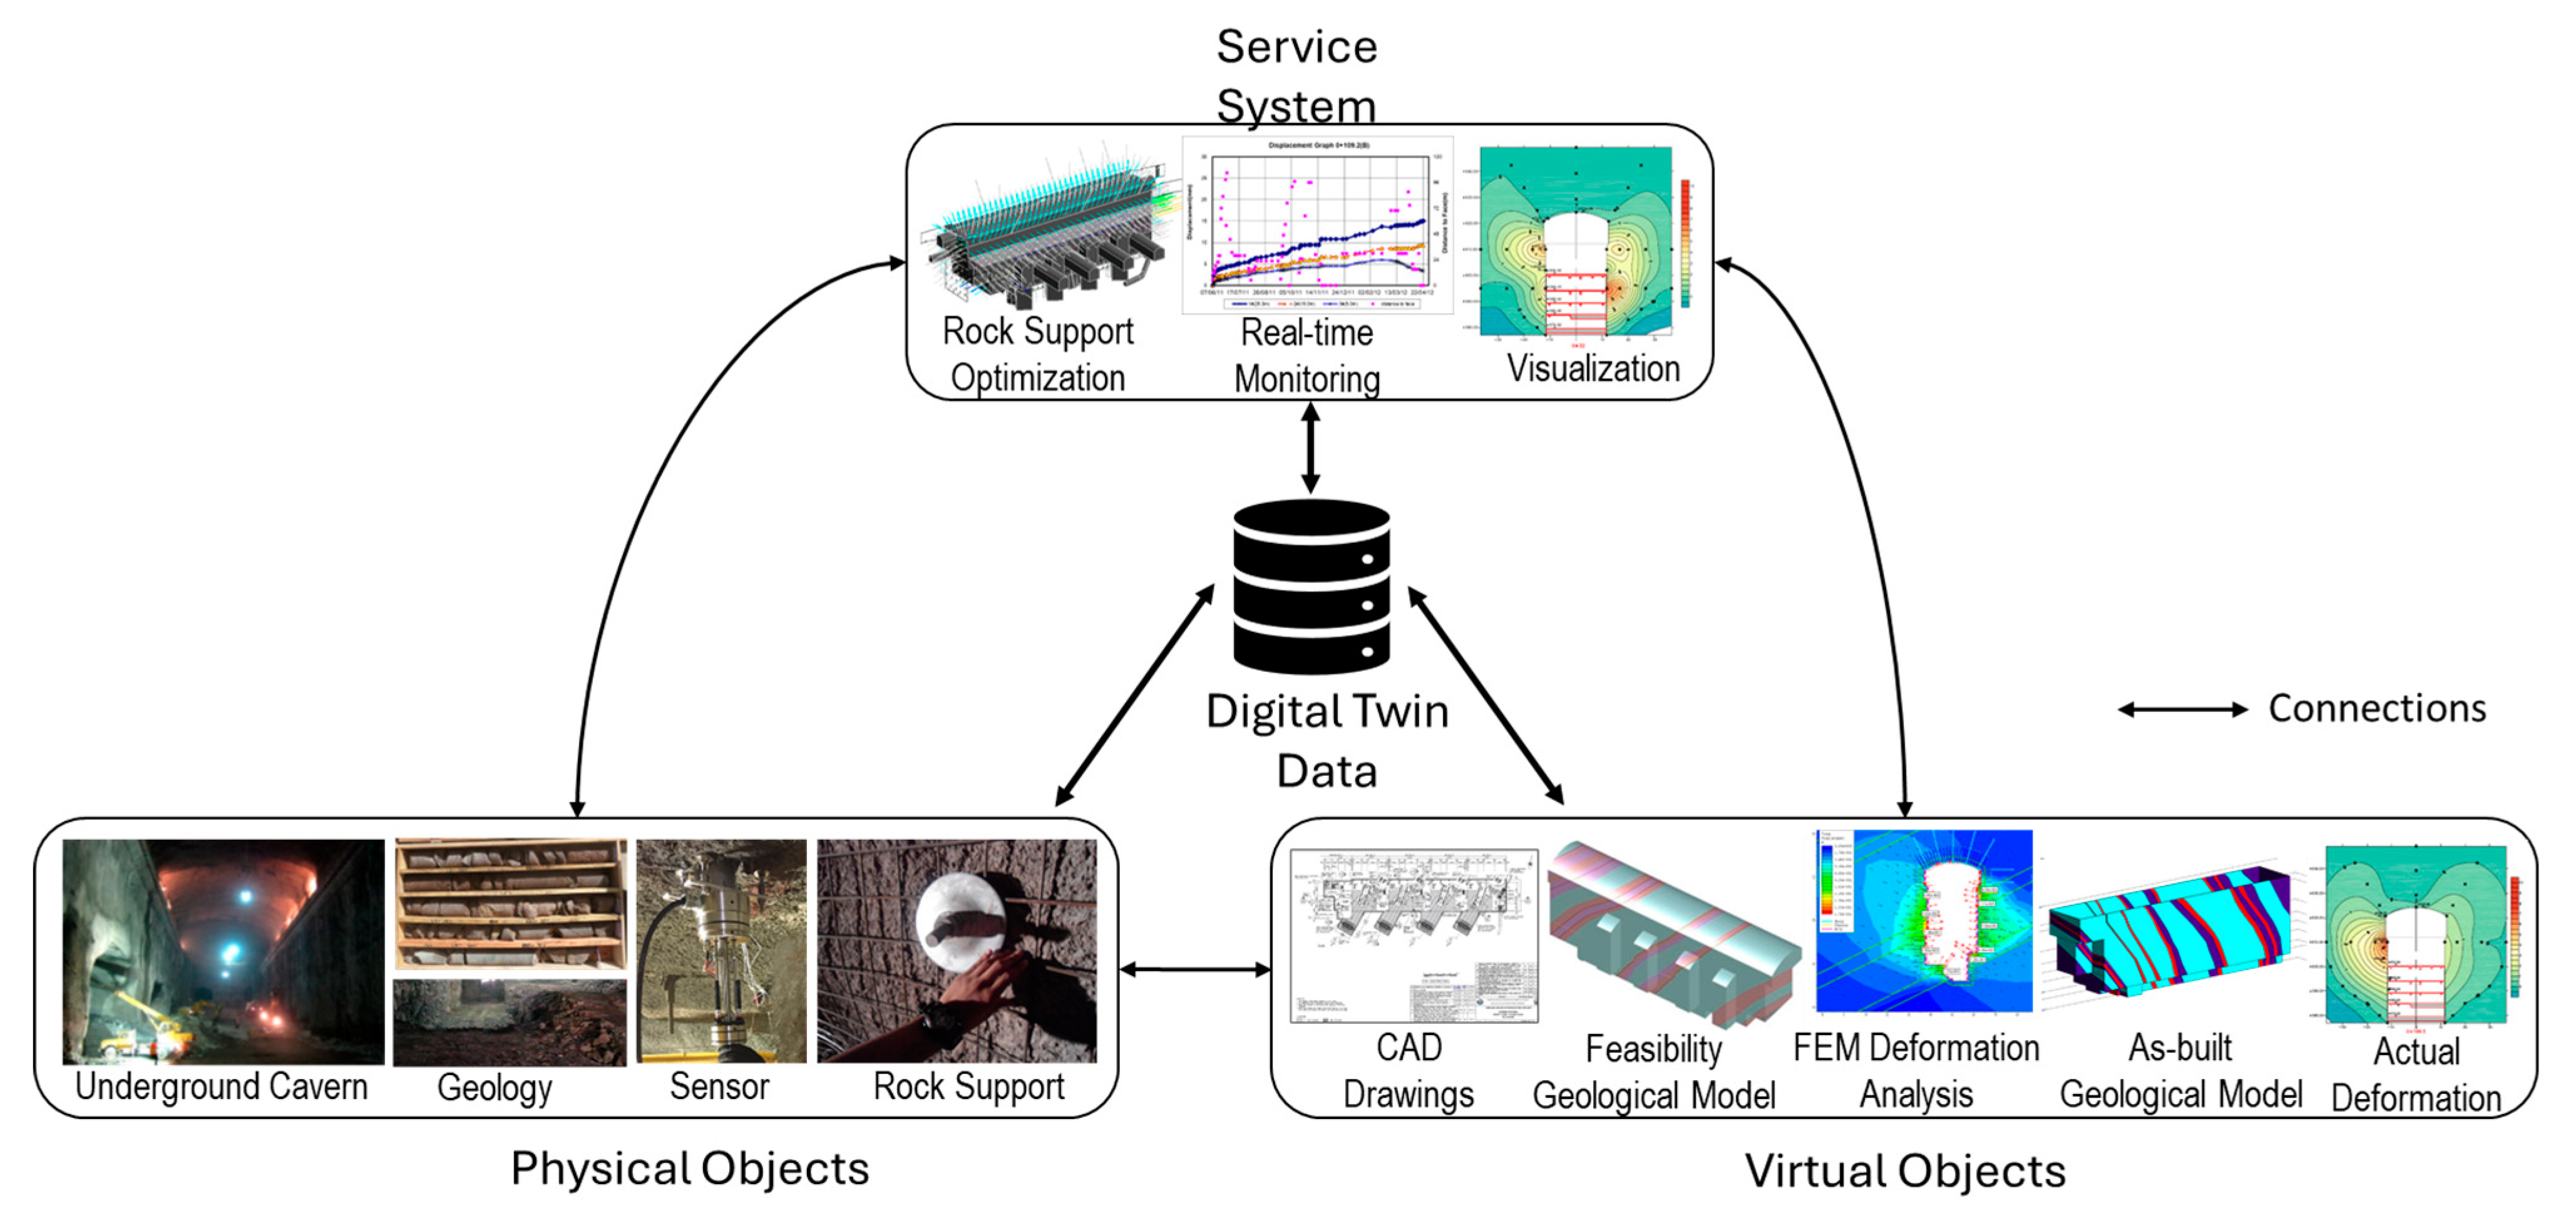
  • The five dimensions of the DT framework encompass physical objects, virtual objects, service systems, DT data, and their interconnections, facilitating comprehensive deformation analysis and rock support optimization.
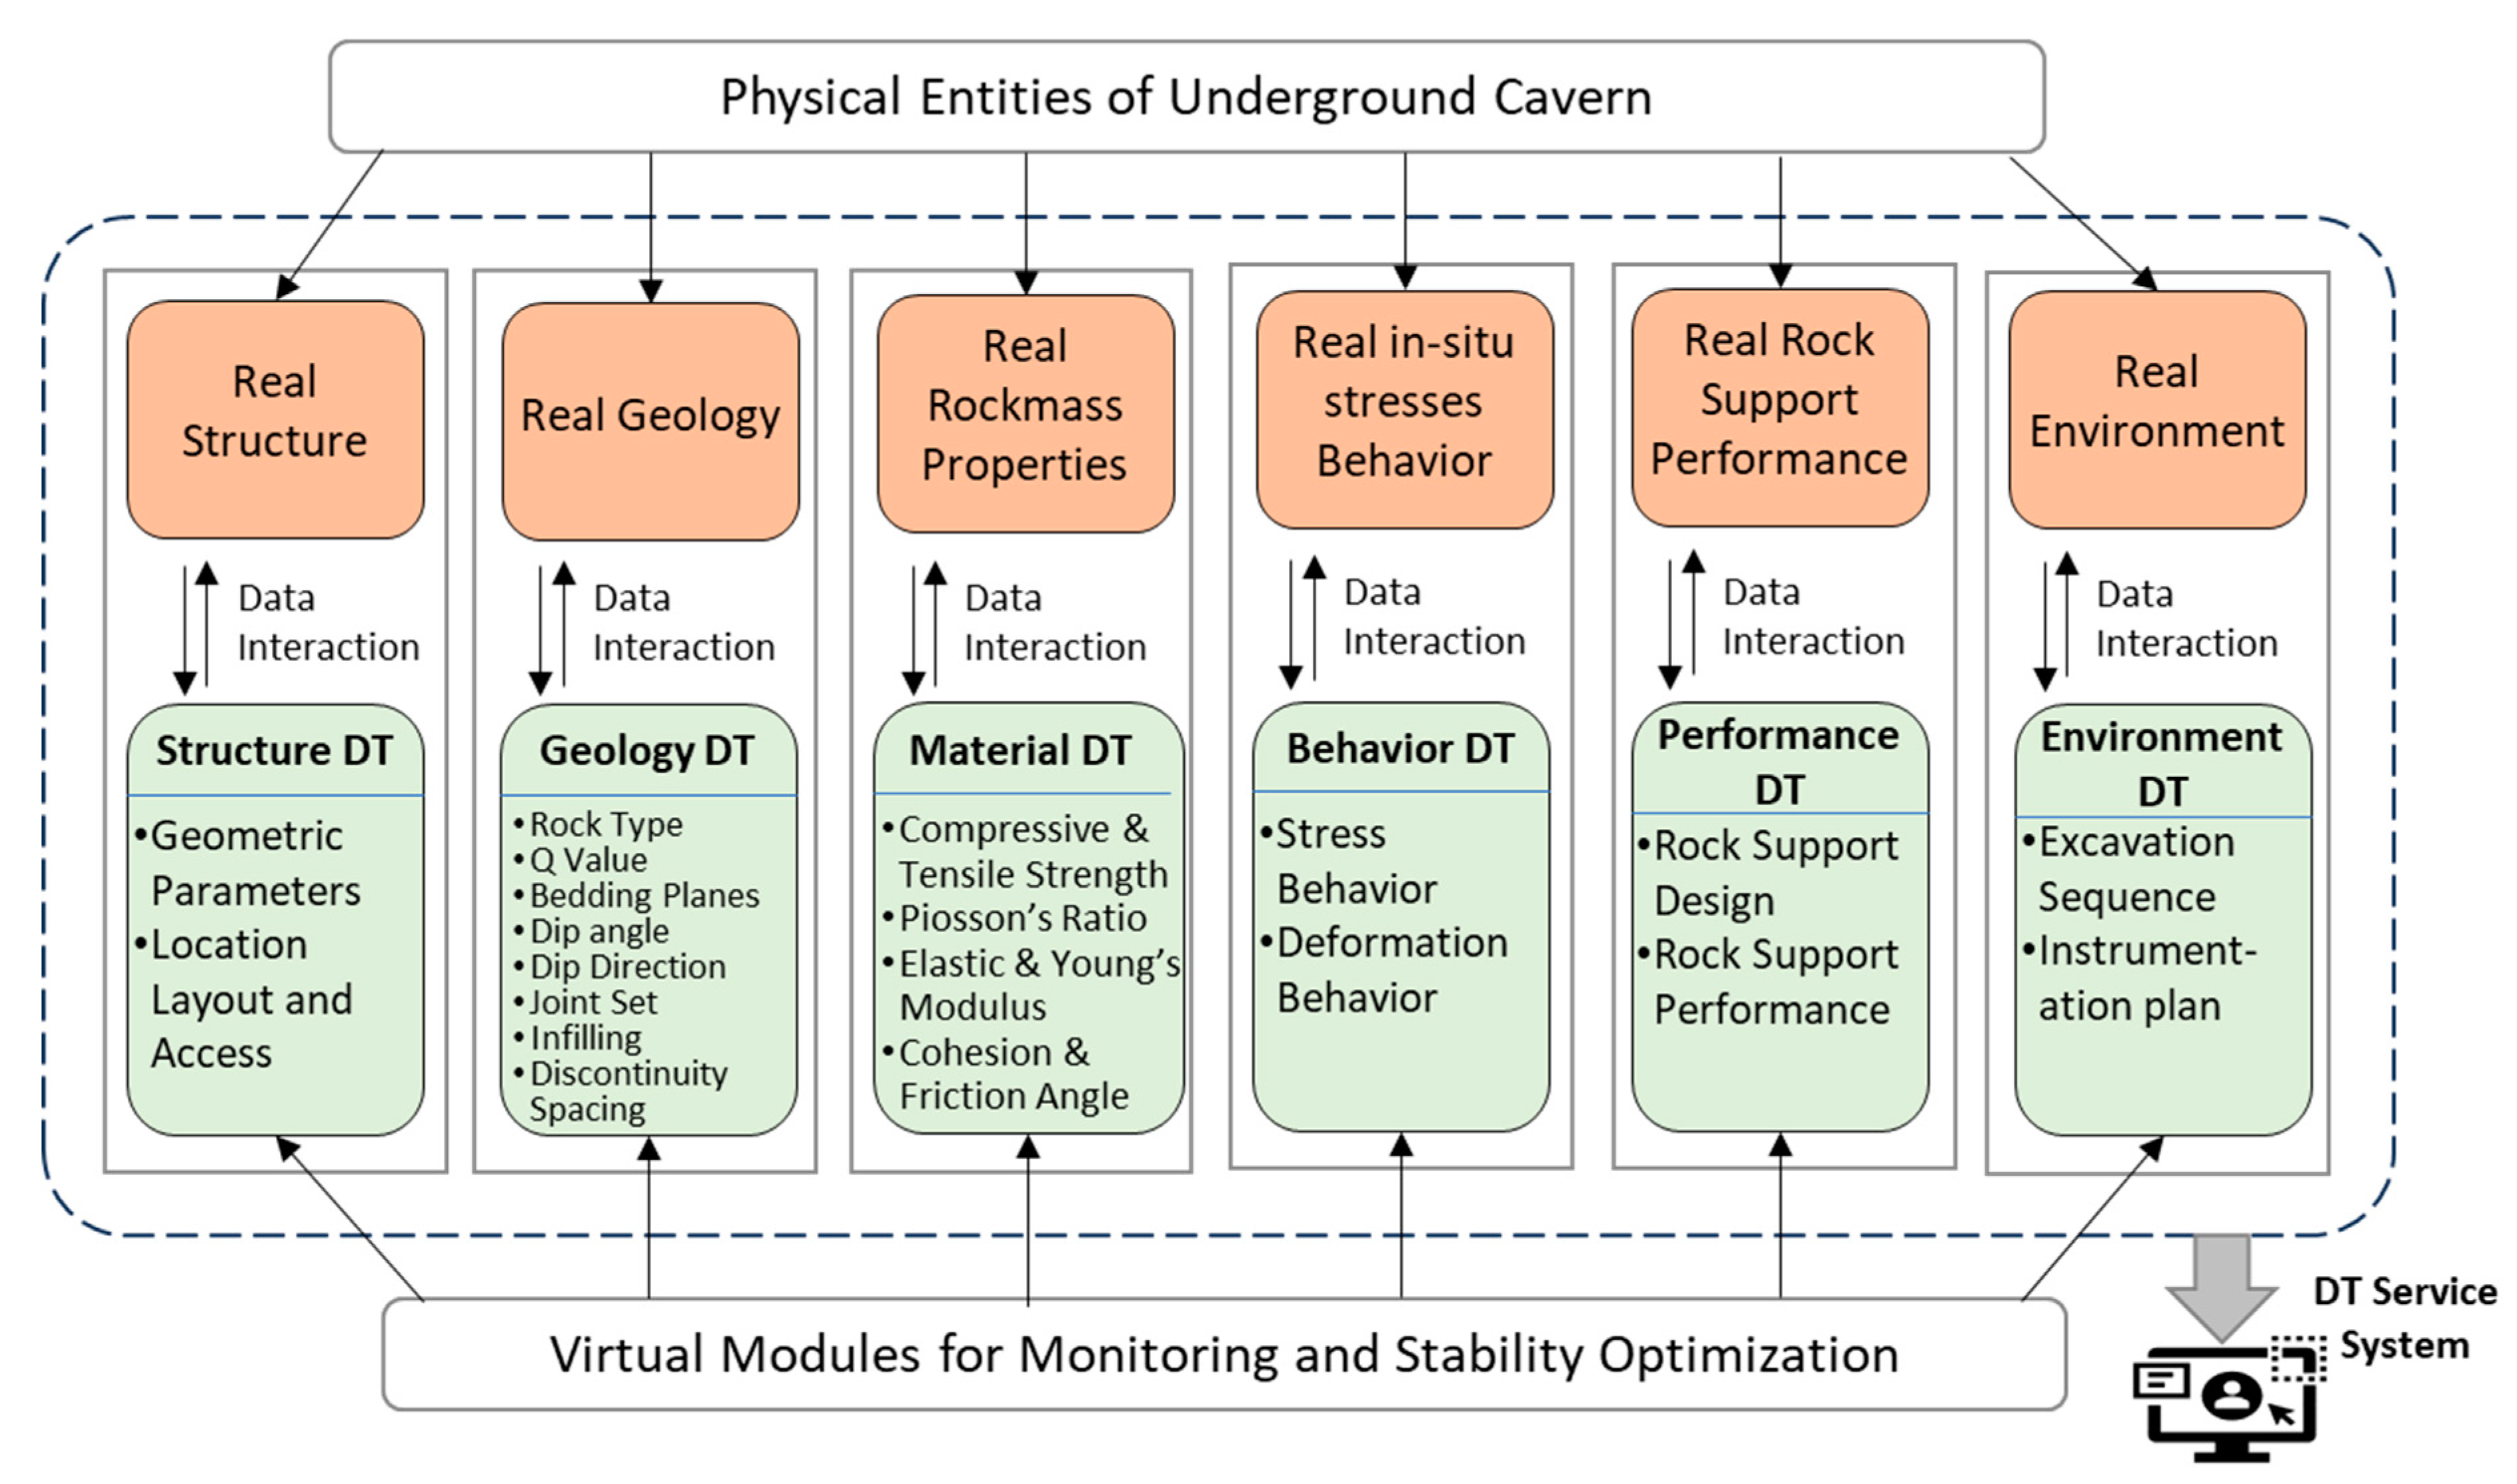
  • The framework incorporates six key modules—structure, geology, material, behavior, performance, and environment—specifically chosen to enhance the understanding of the complex factors influencing underground cavern stability.
  • A seven-step DT-driven methodology is developed, starting from geological assessment to real-time monitoring and optimization, emphasizing a continuous feedback loop between the physical and virtual worlds.
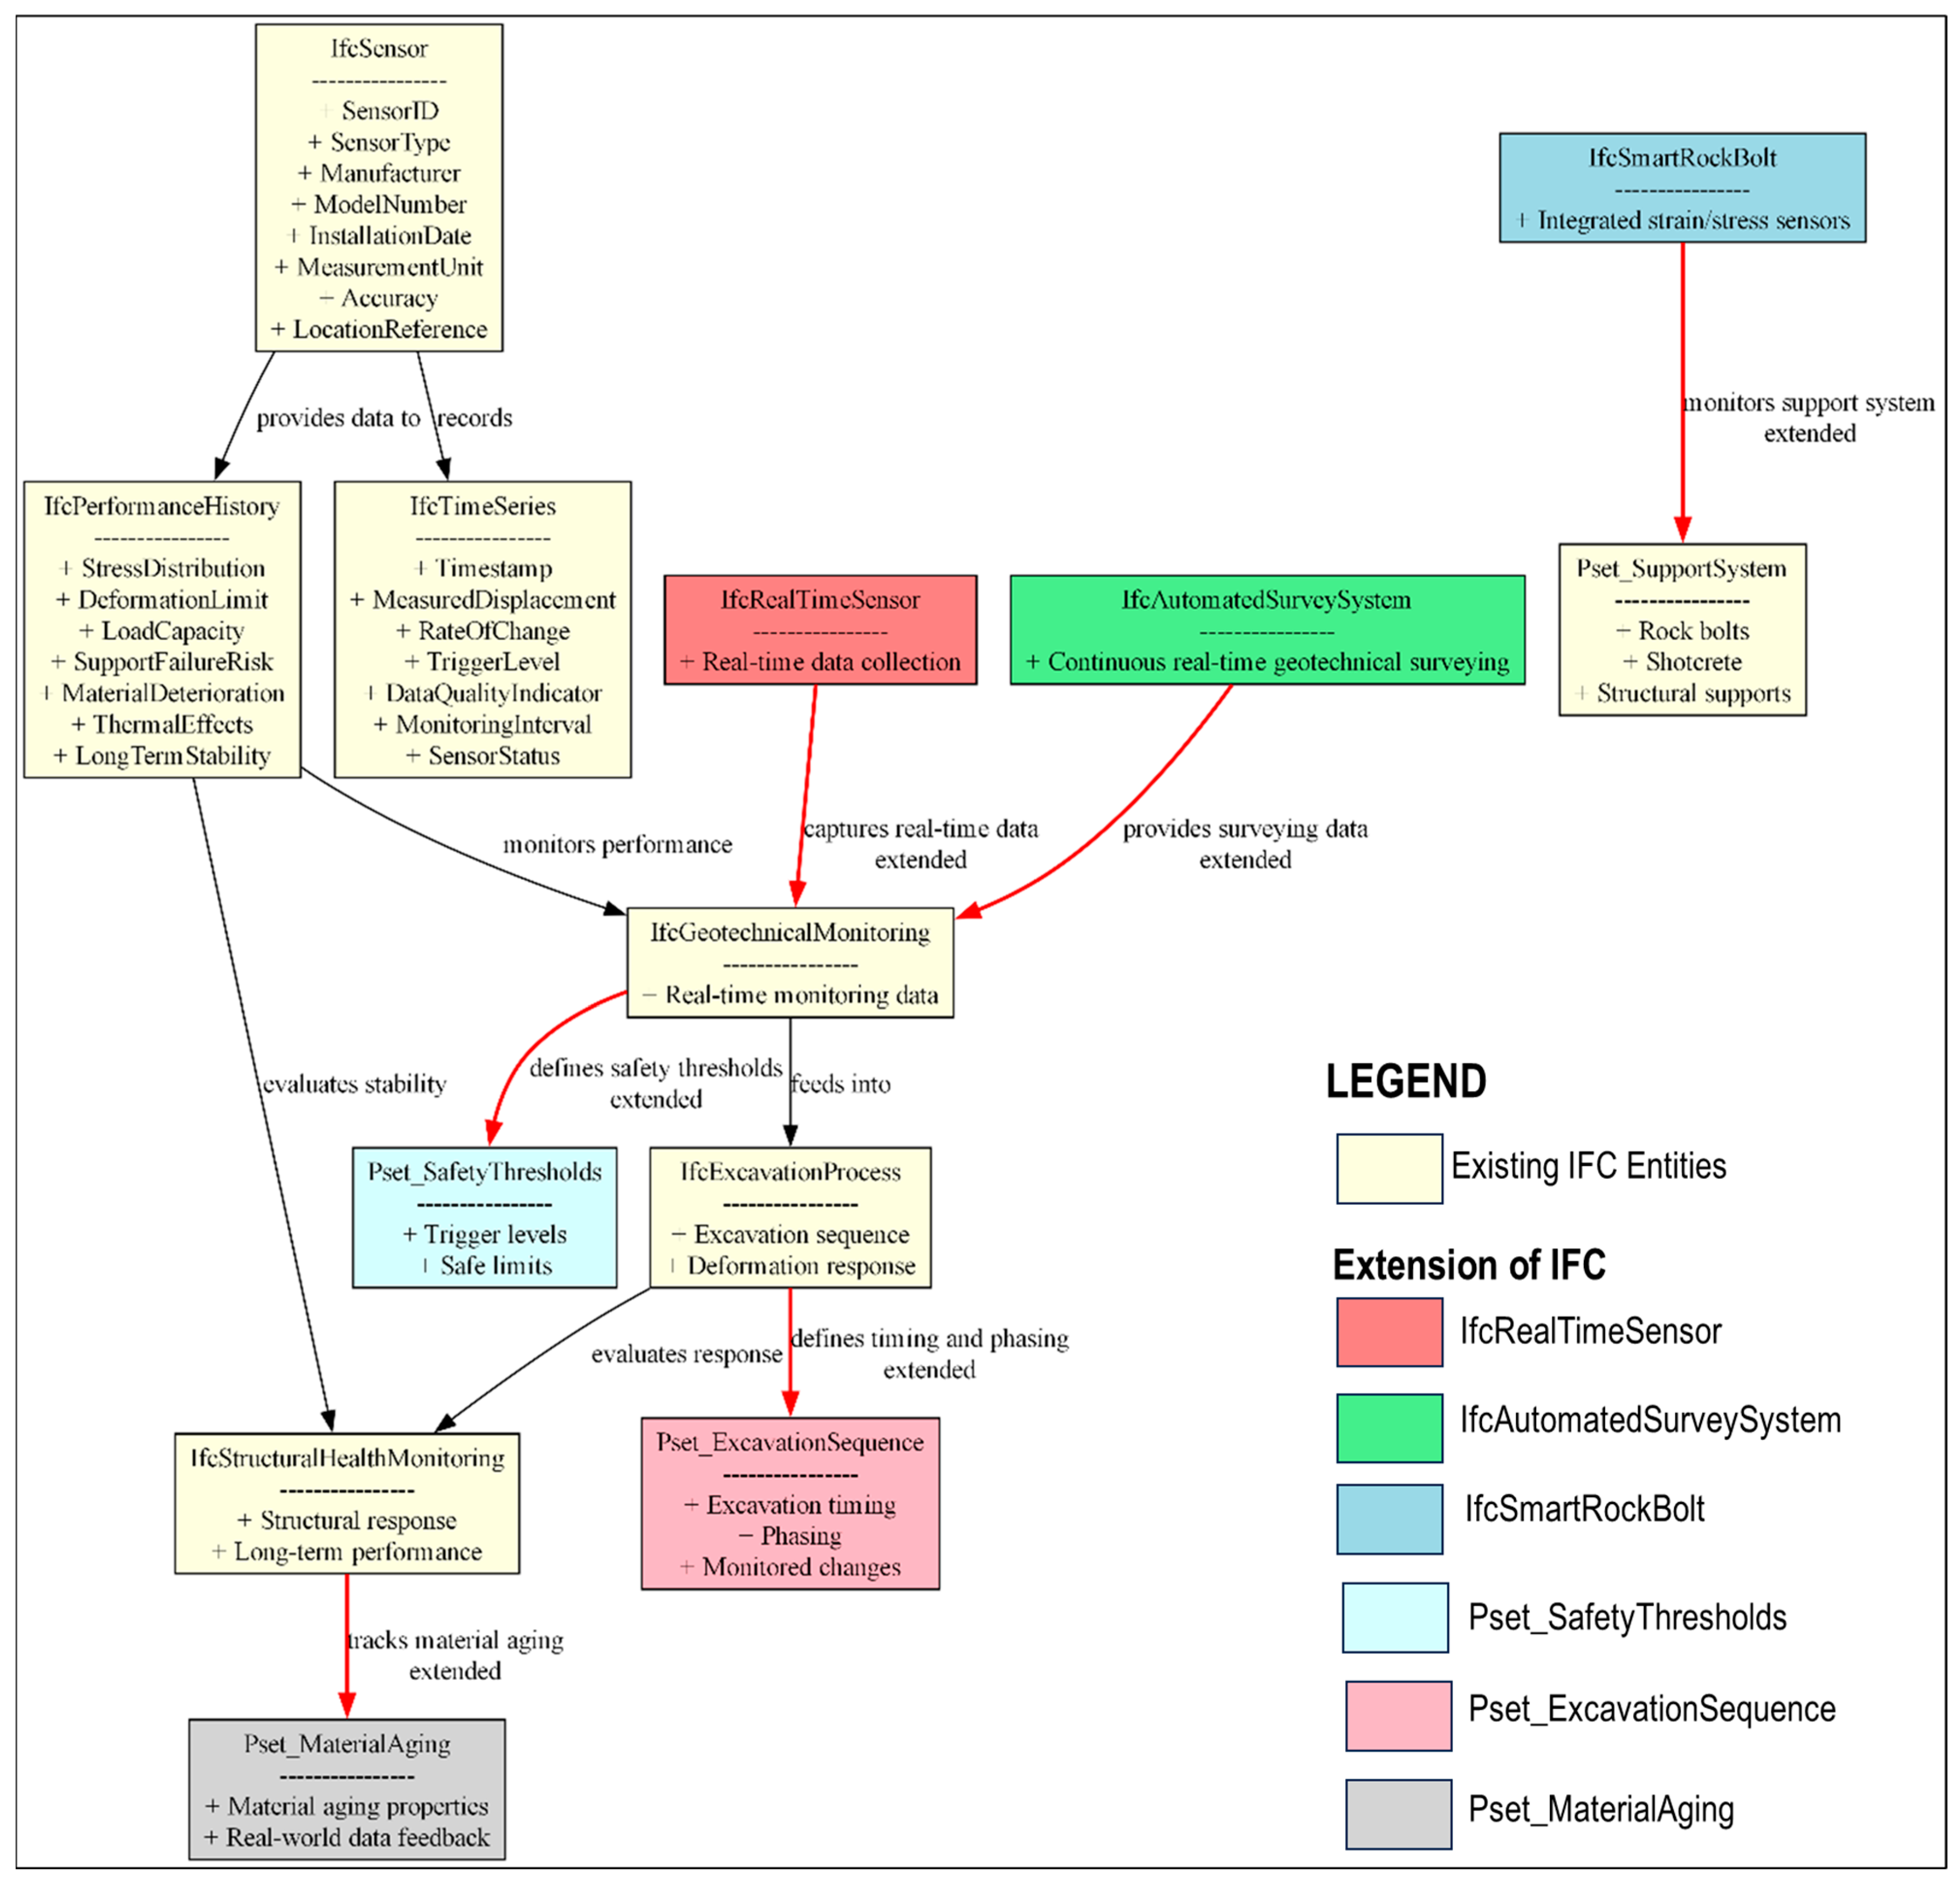
  • This research study leverages Industry Foundation Classes (IFC) standards for seamless data exchange and interoperability and proposes new IFC entities and property sets tailored for underground engineering and convergence monitoring.
  • The framework emphasizes the real-time integration of sensor data for the deformation monitoring and adaptive optimization of rock support systems, leading to improved safety, reliability, and long-term stability compared with traditional methods.

2. Digital Twin Framework for Real-Time Monitoring and Optimization of Underground Caverns

2.1. Structure of Digital Twin

Based on the number of data that are generated throughout the lifecycle of underground cavern construction projects, a five-dimensional digital twin framework is put forward for deformation analysis and rock support optimization. The five-dimensional components are physical objects, virtual objects, service system, DT data, and their connections, as shown in Figure 1. Among them, physical entities are the real-world underground caverns, borehole logs, and geology encountered, as well as sensors for recording real-time deformation data, geological mapping, and rock support elements that stabilize the underground caverns. The virtual part provides the virtual understanding of geology, project design, deformation simulation, and actual deformation from the design to the operation phase of the project. The behavior of physical entities is controlled or reduced within the allowable limit by carrying out optimization and deformation analysis in the virtual world. The virtual part should be a digital mirror and structured strictly similarly to physical entities to enhance the understanding of behavior in the real world. In this proposed DT, the developed DT virtual modules involve construction-related aspects, which are geology, rock support, and excavation, and structure monitoring-related aspects, which are behavior and stability. It integrates Industry Foundation Classes (IFC) to ensure standardized data exchange, real-time monitoring, and interoperability within BIM-based underground cavern stability optimization. IFC extensions support geotechnical monitoring, excavation sequencing, deformation tracking, and rock support assessment, enabling dynamic updates and data-driven decision making for enhanced structural stability.
The DT service system documents the data and information of physical and virtual parts with reference to the construction process, deformation monitoring, design information, and its optimization. It also provides real-time information to all project stakeholders, enabling them to understand and make decisions on time. DT data include all the data and information from physical entities, virtual entities, and service systems. The type of data in the proposed DT consists of deformation sensor data, survey data, semantic information, geological data, and analysis data. These data are continuously updated depending upon the data update requirements and generated in real-time to provide feedback for the continuous efficient iterative optimization of the design and stability of underground infrastructure.

2.2. Digital Twin Modules

Figure 2 shows the digital twin modules applied in the proposed real-time monitoring of convergence and stability optimization of underground caverns. These features and functions in the virtual and real worlds are necessary to simulate and replicate the behavior in the real world.
The structure DT simulates the location, geometry, and design layout with all the salient features of an underground cavern. The geometric design and location are based on the virtual iterative numerical analysis. It assists the guide for real structure construction for the desired underground cavern facility and corrects itself with feedback from the physical identities during construction.
The geology DT replicates detailed geological information and records its physical attributes. It provides structural geological information including rock type, Q-value, bedding planes, dip angle, dip direction, joint set, infilling, and discontinuity spacing. The geological information is updated throughout the construction process. It begins with borehole data, where the geological model is developed by interpolation, and later, during construction, geological information is updated with feedback. This information from this module influences stress distribution, deformation behavior, failure mechanisms, and support system design, enabling accurate predictive modeling and real-time adjustments for enhanced structural stability. The recorded information is the key to optimizing the convergence of an underground structure to enhance real-time monitoring, enabling proactive adjustments for stability and efficiency.
The material DT simulates the records of the actual rock mass properties integrated into the geological model and replicates the mechanical behavior and structural response of the rock. This information is gathered through an extensive laboratory testing program to have the material properties of natural intact rock and rock mass parameters. The values were obtained from tests conducted in the laboratory on small specimens of rock. They must be adjusted to full-scale conditions to represent the overall rock mass conditions. This module plays a crucial role in realistic deformation modeling, predictive accuracy, and adaptive stability control in digital twins by defining the mechanical behavior of rock.
The behavior DT is a set of simulation models used to evaluate and simulate the rock’s response to all kinds of excavation activities and rock support systems. FEM analysis is used to estimate stresses and deformations. In the DT module, convergence simulation models are developed based on pre-excavation information in the initial design phase. During the excavation phase, more detailed simulation models are updated on actual excavation, and actual convergence information and feedback are provided to the DT system for the optimization process. The feedback during excavation explains the changing states of stress while excavating the parts as the excavation is deepened or different sections of underground space are excavated.
The performance DT provides analysis and duplicates the performance of the rock support system to replicate the excavation stress in a virtual environment. Stress analysis is carried out in the design stage to design the rock to keep the convergence and deformation within the design limit. The sequence of support installation is also matched with the sequence of excavation to provide adequate support without the risk of overstressing the support elements. During construction, performance is analyzed for additional support measures based on the actual condition and feedback from the behavior DT module.
The real-environment DT simulates the whole construction process and its elements. It not only replicates the real external environment of the geometric data with construction sequences but also integrates the instrumentation installation plans. The measured real-environment data provide feedback to other modules, especially behavior and performance DT, to update the behavior and performance of underground caverns.

2.3. Structured Data Representation

It is essential that data storage in the digital world for civil and underground engineering are based on the Industry Foundation Classes (IFC) standard. This provides the standard universal data exchange format, ensuring interoperability, data consistency, and collaboration across software platforms and project stakeholders for BIM-based applications. Similarly, IFC should be adopted for DT-driven BIM applications for underground caverns. Structured and standardized data representation is crucial to real-time monitoring, stability optimization, and deformation analysis. Some underground space IFC schemas are available and have been proposed by several authors [49]. However, there is a current lack of a dedicated IFC schema that explicitly defines convergence monitoring, where real-time feedback loops between physical and virtual entities rely on the well-structured information model. There is the necessity for the extension and definition of new attribute sets to ensure that both static hardware information and dynamic real-time monitoring data are systematically recorded.
For effective convergence monitoring, it is necessary to define three dynamic attribute sets, Pset_SensorCommonFeature, Pset_SensorMonitoringData, and Pset_PerformanceData, which are attached to the IfcSensor and IfcPerformanceHistory entities. These attribute sets ensure that static hardware information, dynamic real-time monitoring data, and performance evaluation are systematically recorded. Some of the common features already defined in existing IFC schemas are adopted as they are. However, some of the new features need to be extended. Table 1 shows the existing and extended standard features of the three Pset for this digital twin. To ensure a well-structured and standardized data exchange framework for digital twin-based convergence monitoring, an IFC schema extension has been proposed, as shown in Table 2. The Unified Modeling Language (UML) class diagram represents the structure and relationships of entities for the proposed digital twin with explicit schema for efficient, reliable, and scalable real-time data transfer between different modules in the virtual and physical world (Figure 3).

2.4. Digital Twin Methodology

A seven-step DT-driven methodology based on the above-mentioned six modules is developed for deformation monitoring and optimizing rock support design to ensure the stability of underground caverns during the construction and post-construction phases. Figure 4 shows the proposed seven-step process in the virtual environment and physical world driven by continuous real-time data generated for monitoring deformation and the iterative optimization of rock support measures needed.
Step 1: A comprehensive feasibility study is carried out to collect rock samples, and extensive laboratory testing is performed to determine geological conditions. The cylindrical rock samples are collected by using drilling and coring techniques. These samples are securely preserved in durable core boxes with partitioned compartments, and unique identification sample numbers are assigned to provide the location and depth from where these samples were collected. The core samples provide structural geological information about the rock formation and important geological parameters such as rock quality designation (RQD), hardness, and orientation of joints/beddings. Laboratory testing is performed to determine the properties of natural intact rock, which are specific gravity, comprehensive strength, tensile strength, elastic modulus, slake durability test, Poisson’s ratio, triaxial test, and direct shear test. This step is crucial and provides the information to decide the location and orientation of the underground cavern based on geological information.
Step 2: The location and geometric design of the underground cavern is one of the most critical aspects of its long-term stability and deformation behavior. The underground cavern should be located in the best available rock masses and be orientated as favorably as possible with respect to geological structure and the assumed orientation of principal stresses. The optimum position of the underground cavern, detailed geometric design, and rock support design strongly depend on actual ground conditions. In this stage, only general information on actual ground conditions is available from Step 1, and it is difficult and impractical to have detailed information at this stage of this project due to the nature of the underground construction environment. In all deep underground structures, detailed actual information is available during actual construction. It leads to a risk in finalizing the design’s critical aspects, especially related to deformation problems posing a threat to long-term stability. In this developed DT, based on the information available, BIM-based design and geological models are developed, providing not only geometric information but also non-geometric information, providing a better understanding of geological information and underground cavern design.
Step 3: For the optimization of underground cavern design, virtual numerical analysis is performed to carry out design optimization and iterative calculations to simulate the real construction deformation. This step is a core part of optimizing the design strategy, because it not only guides the designers to understand the deformation behavior but also verifies the deformation during the actual construction and post-construction stages. The accuracy of this optimization process is ensured through a continuous verification process that integrates real-time monitoring data from installed sensors with the virtual model. During construction, the measured deformations are constantly compared against FEM/FDM predictions through the digital twin framework. As excavation progresses and new geological data become available, the system automatically evaluates whether actual convergence remains within the predefined trigger levels (Section 2.5). When thresholds are approached or exceeded, the DT initiates the iterative recalibration of support parameters—including bolt spacing, shotcrete thickness, and anchor configurations—to maintain structural safety. Based on structural geology, rock support design and excavation stages are virtually analyzed to understand the deformation behavior and long-term stability. In the rock support design virtual simulation, the type of rock support, dimensions, material, the thickness of shotcrete, and the angle and pattern of rock anchors are finalized based on simulation results, providing better stability. This process creates a closed feedback loop where field measurements continuously validate and refine the virtual model, ensuring that the digital twin remains an accurate representation of physical conditions throughout the project lifecycle. This step also reviews and verifies the location and geometric design layout, and if any necessary modifications are required, the feedback is input back into Step 2. During construction, as-built information is provided to re-evaluate the structure’s stability and deformation behavior. If any necessary action needs to be taken to redesign the rock support, it provides the rock support design update. After excavation and rock support or in the operation phase, the sensors provide real-time feedback on the actual deformation behavior of the underground facility. This feedback is compared with the virtual design, simulations are corrected in accordance with the real deformation, and rock support is re-evaluated.
Step 4: BIM-based detailed design and construction simulation provide detailed digital geometric and semantic descriptions of construction details, along with virtual construction sequences. This step facilitates effective information storage, meaningful data sharing, and collaborative design for multiple experts from different domains in complex and huge underground complexes. The parametric geometric model provides a detailed design visualization of geometric data of all the components in a three-dimensional space. It provides the detailed information of excavation, rock support, and monitoring instrumentation detailed design. It includes excavation geometry, phased excavation plans, and geotechnical data. The rock support design specifies systems like rock bolts, shotcrete, and steel ribs, integrated with stress analysis and material properties. Monitoring instrumentation plans detail device locations.
Step 5: After the detailed design is completed, the actual construction of the underground cavern is commenced in the physical world based on all the current information from the virtual world. In the actual construction process, the excavation commences with the widening of the pilot tunnel constructed for the feasibility study in Step 1, which is later widened to achieve the full width of the crown. The rock mass information is collected and mapped on geological sheets to prepare as-built geological details as excavation progresses. The excavation should be carried out in benches to ensure safety, stability, and the efficient management of the construction process. Excavating in benches allows for the controlled removal of material in stages, reducing the risk of collapse by maintaining the stability of the surrounding rock. This method also provided better access for installing rock support systems. During excavation, extensive rock support measures are to be implemented, including fully cement-grouted rock bolts, layers of steel fiber-reinforced and plain shotcrete, steel straps, wire mesh, and bar and strand anchors.
To monitor the deformation during construction and post-construction, two kinds of instruments are used to monitor the rock mass deformation in terms of relative and absolute displacement. First, convergence arrays are utilized to measure the relative displacement between two points at designated convergence stations. Convergence measurement is carried out using reflective targets that are installed as close as possible to an advancing face or a deepening invert. All measured convergences are relative, in that the distance between two targets is monitored. It is relatively easier to install and cheaper to monitor convergence targets during the excavation period. For absolute displacement, extensometers and load cells are generally installed for long-term convergence monitoring and are the permanent monitoring system for both excavation and operation. Extensometers measure absolute displacement, providing critical data on the deformation behavior of the rock mass over time. Anchor load cells monitor the force buildup in anchor bars or cable anchors. These load cells play a crucial role in understanding load distribution and the effectiveness of the rock support systems, ensuring that the rock mass remains stable under the applied forces. Together, these instruments form a comprehensive monitoring system that is essential to maintaining safety and stability throughout the construction process.
Step 6: The convergence monitoring data are collected on a regular basis, depending on the deformation behavior. The data monitoring of convergence arrays is relatively straightforward and cost-effective, making them a practical choice for monitoring during the excavation phase. Reflective targets are positioned as close as possible to the excavation face to capture real-time deformation data. Measurements are typically recorded manually by using surveying total stations, though automated systems with data loggers can also be used for continuous monitoring. Data acquisition with extensometers and load cells is typically continuous, with sensors transmitting real-time data to a centralized monitoring system, depending on the project requirements. Automated systems with data loggers collect and transmit data in real time, enabling continuous monitoring. The measurements provide information about the absolute displacement of the rock mass, helping engineers identify zones of instability and assess the effectiveness of support systems. Data from convergence arrays, extensometers, and load cells are integrated into a centralized monitoring system, enabling continuous monitoring and rapid response to changes.
Step 7: The final step achieves the virtual monitoring and optimization of rock support based on deformation behavior. This BIM-based module provides semantic and non-semantic information of actual deformation, as built rock and geological support information. It provides the analysis of existing deformation monitoring data and observations with its current condition and its additional capacity to withstand potential long-term loads from creep and reduction in rock mass strength. This geological mapping information in a BIM-based 3D model provides a detailed and interactive representation of rock types, lithology, geological structure, weak and fault zones, and stratigraphy. This step provides actual deformation feedback to optimize the virtual design and construction process.

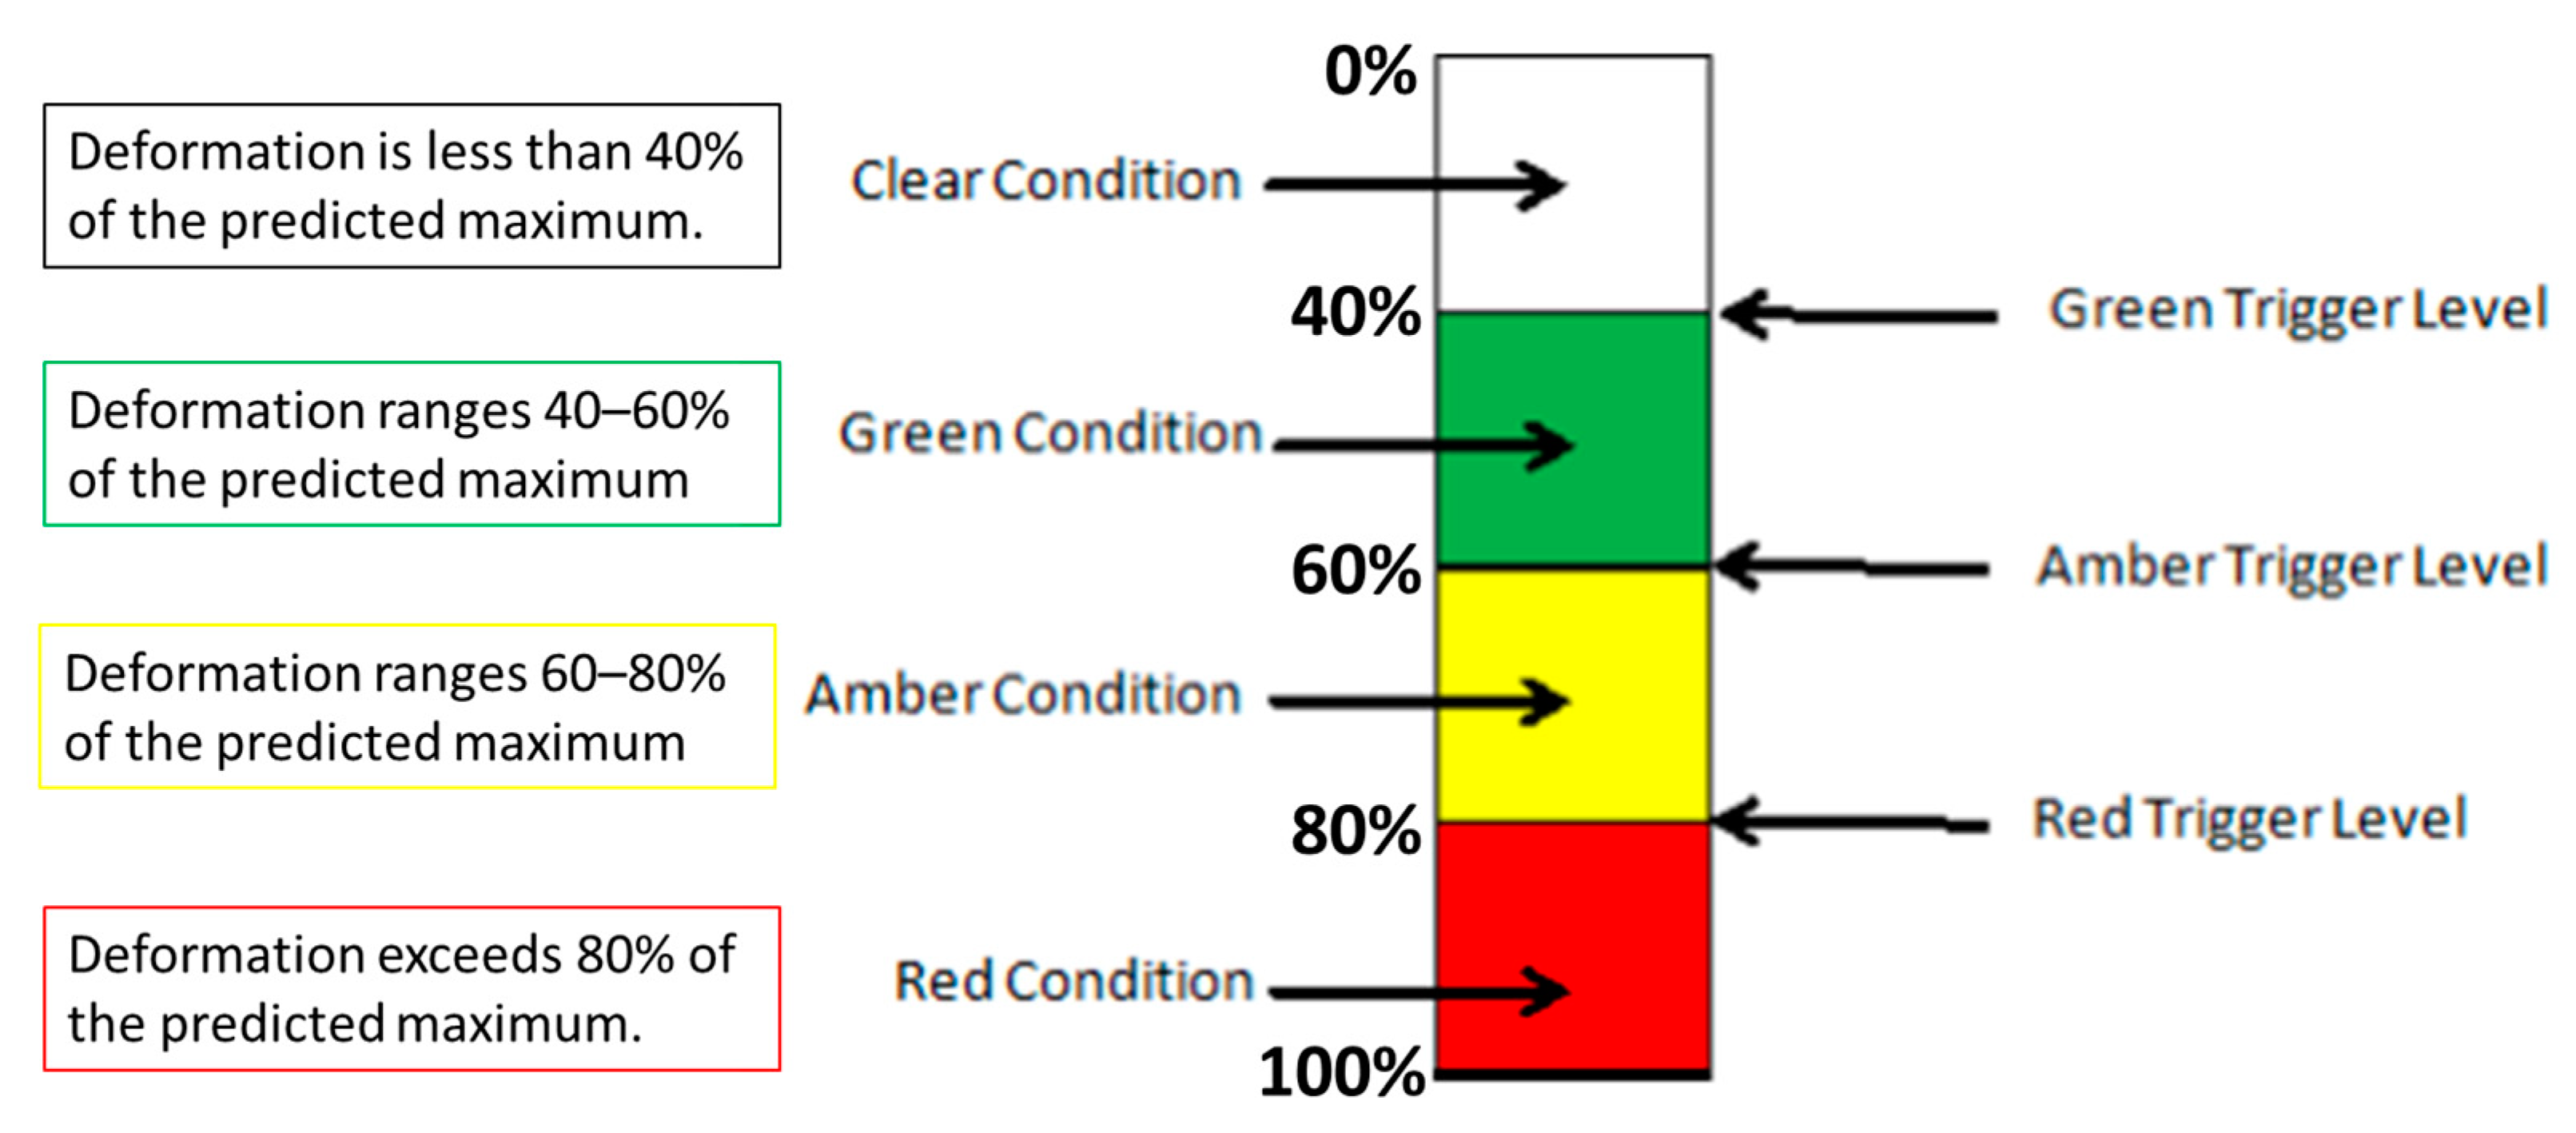
2.5. Deformation Trigger Levels

The digital twin framework implements a four-tier trigger system for deformation monitoring based on industry standards of monitoring and control in tunnel construction published by the International Tunnelling and Underground Space Association (ITA) and European Standard [50,51]. The trigger levels for the construction of the underground cavern are defined under a system of Green, Amber, and Red Trigger Levels for movements during and after construction, as shown in Figure 5. The convergence trigger level in underground construction is based on predicted effects obtained from the appropriate detailed design calculations and relate to crown and wall movements and stresses and strains within support systems.
The Clear Condition corresponds to deformation remaining below 40% of the maximum predicted value. At this level, behavior is considered stable and consistent with numerical simulations, and routine construction can proceed with monthly monitoring cycles. Construction activities proceed as planned, taking into account the design, the agreed-upon method of working, and any limitations imposed in the design documentation. Regular pre-planned reviews of excavation progress and monitoring shall be undertaken.
The Green Trigger Level is defined as a threshold of 40–60% of the maximum predicted deformation. Upon breaching this level, construction may continue but with biweekly monitoring to track any deviations more closely. Additionally, the adequacy of the support system should be verified against DT model checks to ensure consistency with projected structural behavior. A review of measurements and trends should also be undertaken to confirm stability.
The Amber Trigger Level is a threshold that aligns with a DT-based range of 60–80% of maximum predicted deformation. It serves as a limit upon which action must be taken to ensure that the allowable value is not exceeded. In this stage, daily monitoring is initiated along with a FEM reanalysis to understand structural responses better. A thorough inspection of the affected vicinity should be conducted at the earliest feasible opportunity to identify any signs of unexpected structural behavior. This assessment should include a comprehensive review to evaluate potential risks, determine the presence of imminent danger, and delineate the extent of the hazardous zone [11]. Additionally, a detailed examination of installed support measures, such as shotcrete, anchors, and bolts, should be carried out to assess their integrity and effectiveness in maintaining stability. This also includes a global analysis and the evaluation of monitoring data to evaluate the status, trends, and causes of movements and assess if further movement is likely to occur.
The Red Trigger Level is typically triggered when deformation exceeds 80% of the predicted maximum, indicating a critical risk of structural compromise. It serves as the final threshold, above which construction activities must be suspended to safeguard both personnel and structural integrity. Emergency protocols must be executed, which may include shotcrete reinforcement, structural support installations, or site evacuation. On breaching this level—or if monitoring data suggest that the Red Trigger Level is likely to be reached—the structure must be immediately inspected, and emergency response and contingency plans should be instigated without delay. Additionally, a comprehensive risk assessment must be conducted to address any further movement or adverse trends resulting from ongoing construction activity.

3. Practical Implementation and Case Study

3.1. Project Overview

For the implementation case study, a large underground powerhouse was selected. Situated in a geologically challenging region, the cavern is subjected to high overburden stresses, requiring advanced stability monitoring and rock support strategies. The excavation process involved sequential benching and the installation of shotcrete, rock bolts, and steel ribs to ensure structural integrity. For DT implementation, the powerhouse cavern serves as an ideal case study for integrating real-time geotechnical monitoring, predictive deformation modeling, and BIM-driven stability optimization. The DT framework enables continuous synchronization between physical site conditions and virtual simulations, improving deformation prediction, excavation sequencing, and adaptive rock support design. By leveraging sensor data, numerical analysis, and IFC-based BIM integration, the DT-driven approach enhances risk assessment, decision-making efficiency, and the long-term structural stability of the underground powerhouse cavern.

3.2. Digital Twin Application for Monitoring and Stability Assessment

3.2.1. Feasibility Investigation and Laboratory Testing Reports

The feasibility investigation included extensive geological assessments and laboratory testing to characterize the rock mass conditions for underground powerhouse cavern construction. First, a comprehensive geological survey and site investigation were conducted to understand the regional and site-specific geological conditions. Field mapping identified rock types, stratigraphy, fault zones, and structural discontinuities, while borehole drilling and core logging provided subsurface data, including lithology and rock quality designation (RQD). It established that the underground cavern consists of two kinds of sandstone (SS-1 and SS-2), siltstone, and mudstone. Second, the laboratory testing of rock samples determined key physical and mechanical properties, including uniaxial compressive strength, tensile strength, elastic modulus, Poisson’s ratio, cohesion, friction angle, slake durability, and shear strength parameters. The properties of intact rock and the parameters for powerhouse were determined as shown in Table 3. This foundational step ensures accurate deformation monitoring and optimization of rock support design for underground cavern stability during and after construction.

3.2.2. Location and Geometric Design of Underground Cavern

The location/layout of the power house complex was chosen on the basis of the large caverns being located in the best available rock masses and orientated as favorably as possible with respect to the geological structure and the assumed orientation of principal stresses. At the time of tender design, very little information on ground conditions was available to the designers. Based on the geological data from the detailed feasibility investigation, a BIM-based 3D geological model is developed to provide the first basis for the location and geometric design of the underground cavern based on the most favorable conditions. The BIM-based geological model is shown in Figure 6a. Considering the rock mass properties and parameters, it is decided to place the main part of the cavern within the competent SS-1 sandstone. So, based on a BIM-based geological model, the optimization of location and orientation of the underground powerhouse cavern was performed; see Figure 6b. It was conducted by moving the powerhouse 92 m eastwards to place the main part of the cavern within the competent SS-1 sandstone and rotating the orientation of the cavern axis by 10° counter-clockwise from the tender design for an optimal cavern axis orientation of 080°.

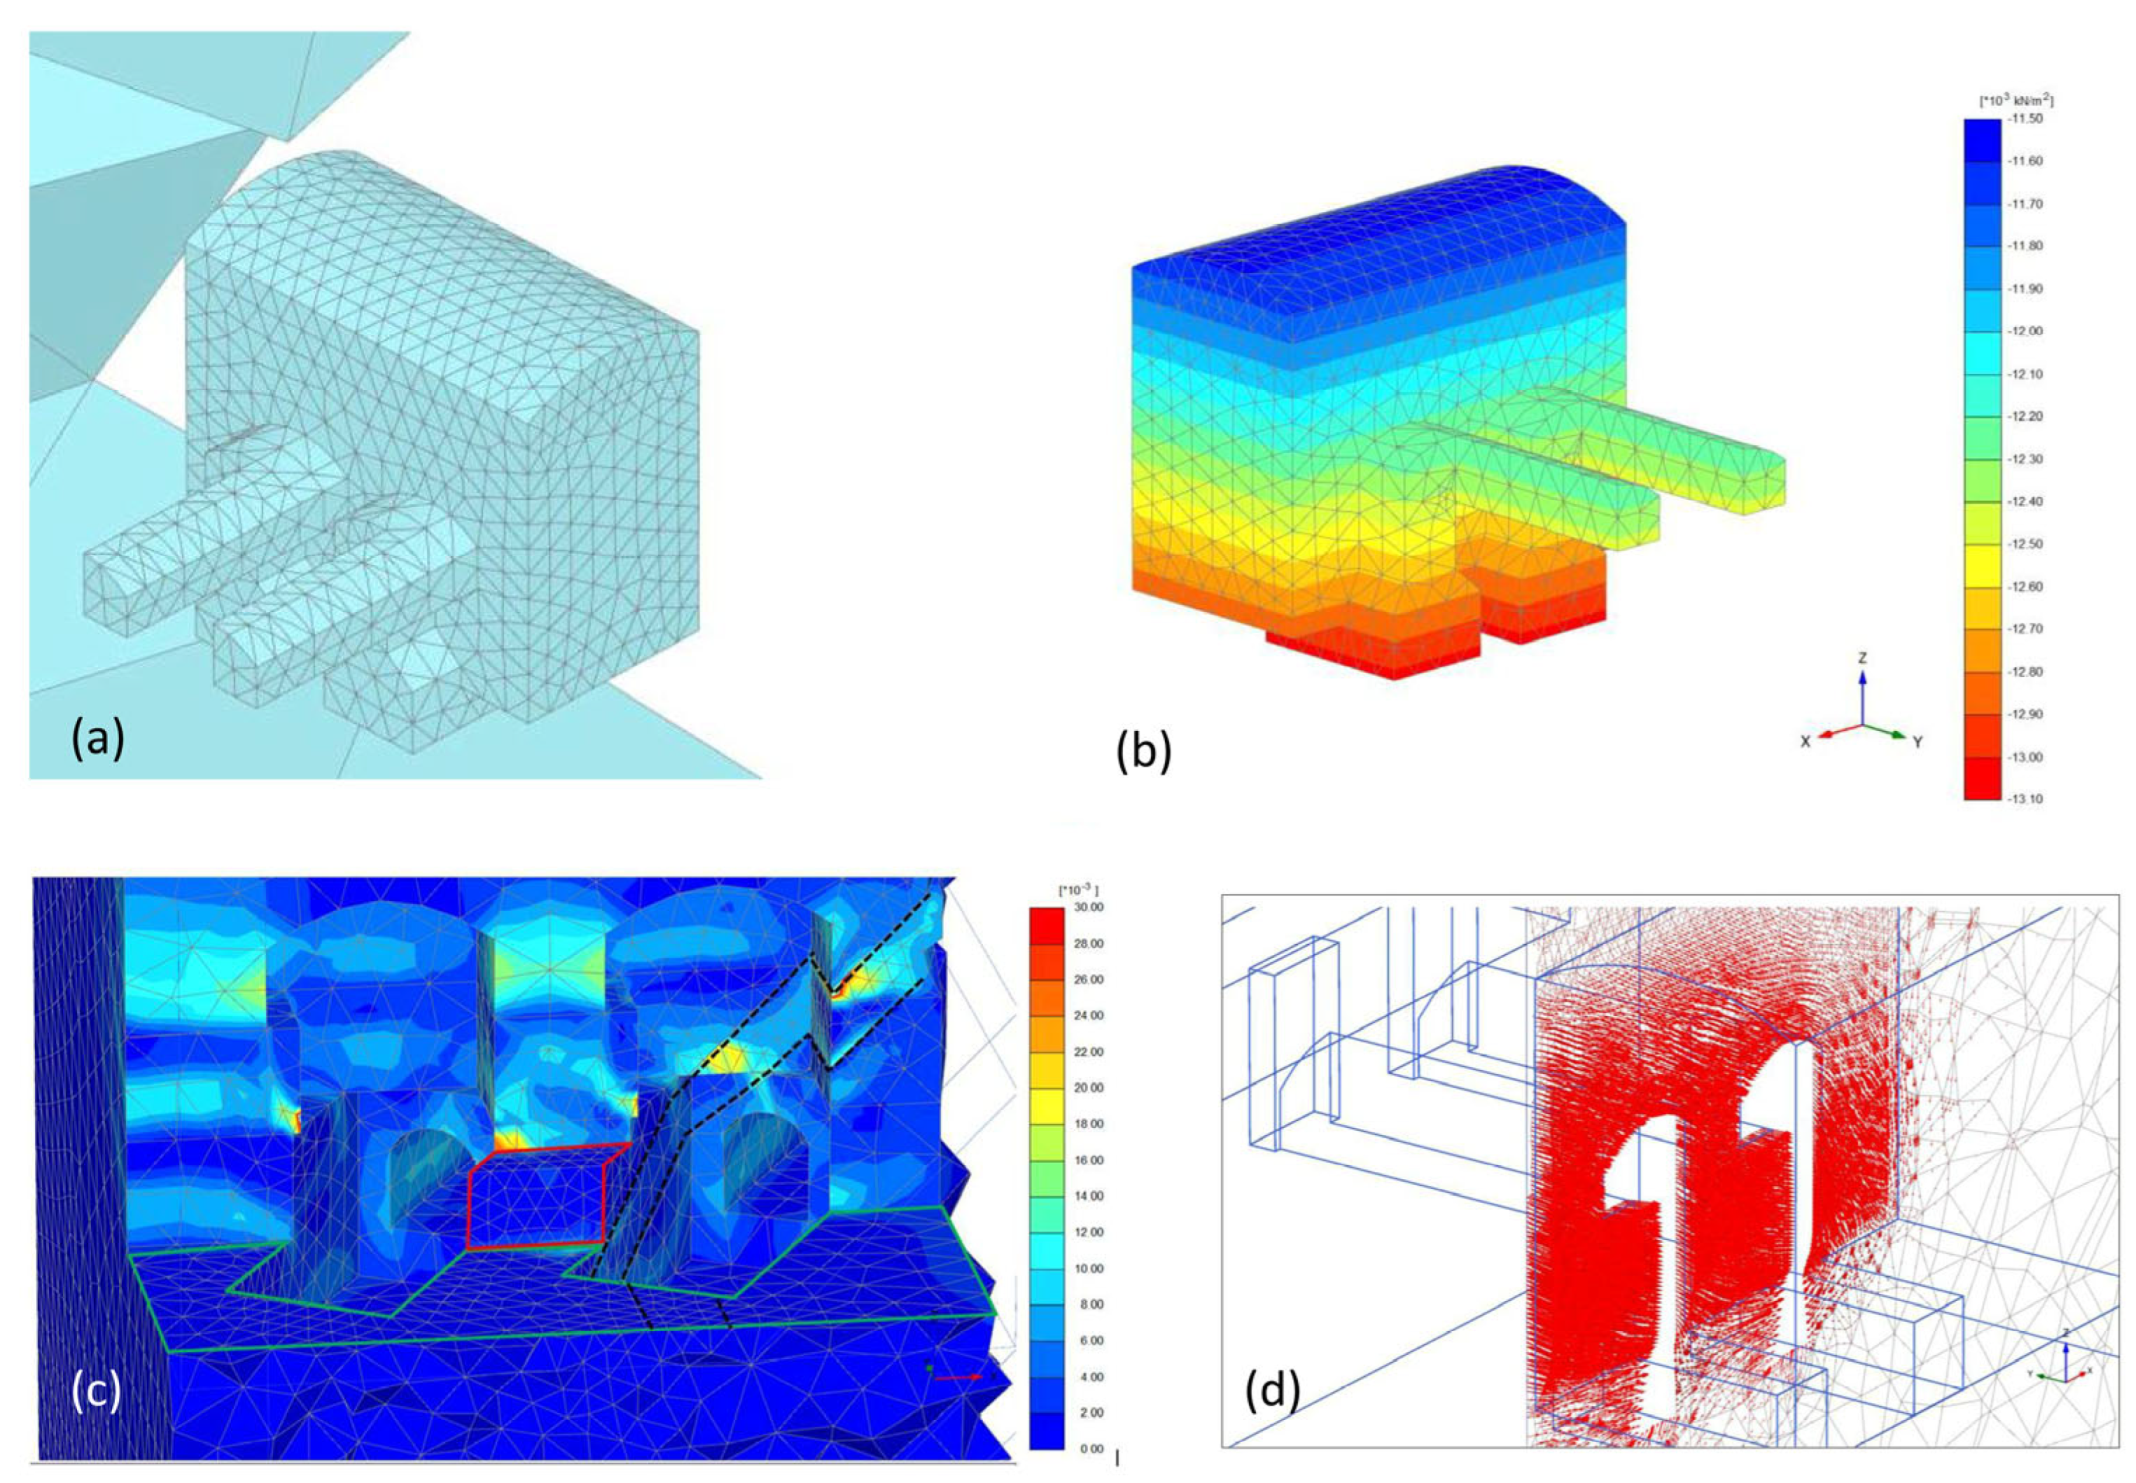
3.2.3. Virtual Design Optimization (Stress and Convergence Analysis)

This is the core of the proposed digital twin, which provides 3D numerical modeling in underground cavern design. It provides a comprehensive understanding of stress behavior, failure mechanisms, and reinforcement strategies. Several existing numerical modeling software packages can be integrated into the proposed framework through IFC-based interoperability [52]. For 2D FEM, tools such as RS2, Plaxis 2D, and FLAC2D can be utilized, while for 3D geomechanical and stress analysis, RS3, Plaxis 3D, and FLAC3D offer robust capabilities [53,54]. These tools support the simulation of rock deformation, support performance, and dynamic ground response, aligning well with the digital twin’s objective of real-time structural behavior representation. The findings reinforce the importance of integrating numerical simulations, field monitoring, and adaptive support measures to achieve optimal stability in underground caverns.
For the optimization of the case study powerhouse complex, a numerical analysis of the underground powerhouse cavern was conducted by using advanced computational tools, finite element modeling (FEM), and finite difference methods (FDMs) to assess stress distribution, deformation patterns, structural stability, and reinforcement requirements. The geological information was integrated from borehole logs and site investigations, providing a detailed understanding of rock discontinuities, weak zones, and stress distribution from Step 2. The analysis incorporated key parameters, including rock mass properties, initial stress conditions, staged excavation sequences, and groundwater influence, to simulate real-world conditions accurately. By systematically examining stress concentration zones, this study identified potential failure mechanisms and provided insights into optimizing excavation strategies and support systems. The proposed digital twin used a two-phase approach to numerical modeling and stability assessment, by transitioning from 2D finite element analysis (FEA) to 3D numerical modeling as excavation progressed, incorporating feedback from actual construction information. In the case study, 2D FEA was initially employed during the pre-excavation phase to facilitate preliminary support design, leveraging its efficiency for planar stress analysis in uniform tunnel sections. As construction advanced and more detailed geometrical and geotechnical data became available, the model was upgraded to a 3D finite difference model (FDM). This enabled the digital twin to capture complex interactions, such as cavern intersections, non-uniform geometries, and the effects of sequential excavation, thereby improving the reliability of stability assessments and support optimization in real time.
In the first phase (pre-excavation), initial numerical modeling was carried out by using 2D finite element analysis (FEA). The objective was to determine the support requirements necessary to maintain cavern stability throughout its operational life. In this stage, the 2D analysis primarily considered overall stress distribution and wedge stability, employing a simplified representation of the excavation geometry. The results guided preliminary support recommendations, including the use of rock bolts, shotcrete linings, and initial anchor placements. Figure 7 shows one of the 2D FEA analyses for a Geological Strength Index (GSI) of 32, the strength factor analysis for K = 1.75 in plane and K = 2.25 out of plane indicates that the Factor of Safety (FoS) is 1.2 or above in the pillar without rock support. The yielded elements are marked with X for shear failure and O for tensile failure, highlighting areas of structural weakness (Figure 7a). With maximum rock support, the Factor of Safety remains at 1.2, but the failure zones are better controlled, ensuring improved overall stability (Figure 7b). The deformation analysis under the same conditions shows that without rock support, the maximum representative deformation of 425 mm occurs in the powerhouse in the mudstone layer, with deformation vectors indicating the most critical areas (Figure 7c). When maximum rock support is applied, the deformation reduces to 280 mm, demonstrating the effectiveness of reinforcement in controlling displacement (Figure 7d). The stress analysis further provides insights into the stability of the cavern. The σ1 stress plot reveals that the maximum induced stress ranges between 9 and 12 MPa in the center pillar with maximum rock support, while the stress trajectories illustrate the horizontal and vertical stress distributions (Figure 7e). The σ3 stress plot (tensile stress) shows that the minimum stress is zero around the cavern periphery, with negative tensile stress zones (σ3 < 0) marked in red indicating potential failure regions (Figure 7f).
In the second phase (during construction), the feedback from the physical world is provided through the proposed digital twin framework. The behavior of the actual stress required a shift from 2D to 3D numerical modeling, capturing the powerhouse cavern’s complex stress interactions more accurately. The transition to 3D modeling was essential due to the irregular niche geometries, excavation-induced stress redistribution, and the interaction between the powerhouse cavern and adjacent structures. The numerical simulation example is shown in Figure 8, where the mesh overview of the powerhouse cavern generated from BIM-based model (Figure 8a) provides a detailed representation of element discretization, ensuring the accurate modeling of stress and deformation responses. The initial stress condition (σ1) at the powerhouse (Figure 8b) highlights pre-existing stress magnitudes and orientations, guiding stability assessments. The total shear strain distribution (Figure 8c) indicates that high-strain zones are concentrated in the buttress and the pillar between draft tube niches 3 and 4, with red zones representing critical strain accumulation. Finally, the deformation pattern in excavation stage 4 (Figure 8d) demonstrates the progressive displacement of the cavern walls and floor, emphasizing the influence of the excavation sequence on stability. The numerical simulations revealed that the pillars between the bonneted gate niches experienced excessive vertical stresses (>40 MPa), leading to cracking and deformation. Furthermore, tensile failure was detected in busbar tunnels and cavern walls, necessitating additional reinforcement. The stress redistribution pattern also indicated that deeper excavation would reduce pillar stresses while increasing stress on the main powerhouse–transformer hall pillar, requiring further stabilization.
Due to the digital twin-enabled design optimization, these findings from 3D numerical modeling were implemented, and multiple engineering interventions were implemented. Concrete jackets reinforced with 130 t post-tensioned tie anchors were installed to stabilize niche pillars, while strand anchors (15 m–26 m in length) were strategically placed in the downstream and upstream powerhouse walls to counteract deformation. Additionally, the excavation geometry was optimized, modifying niche layouts and excavation angles to minimize excessive stress concentrations. Drainage and grouting systems were also incorporated to control pore pressure effects, ensuring long-term stability.

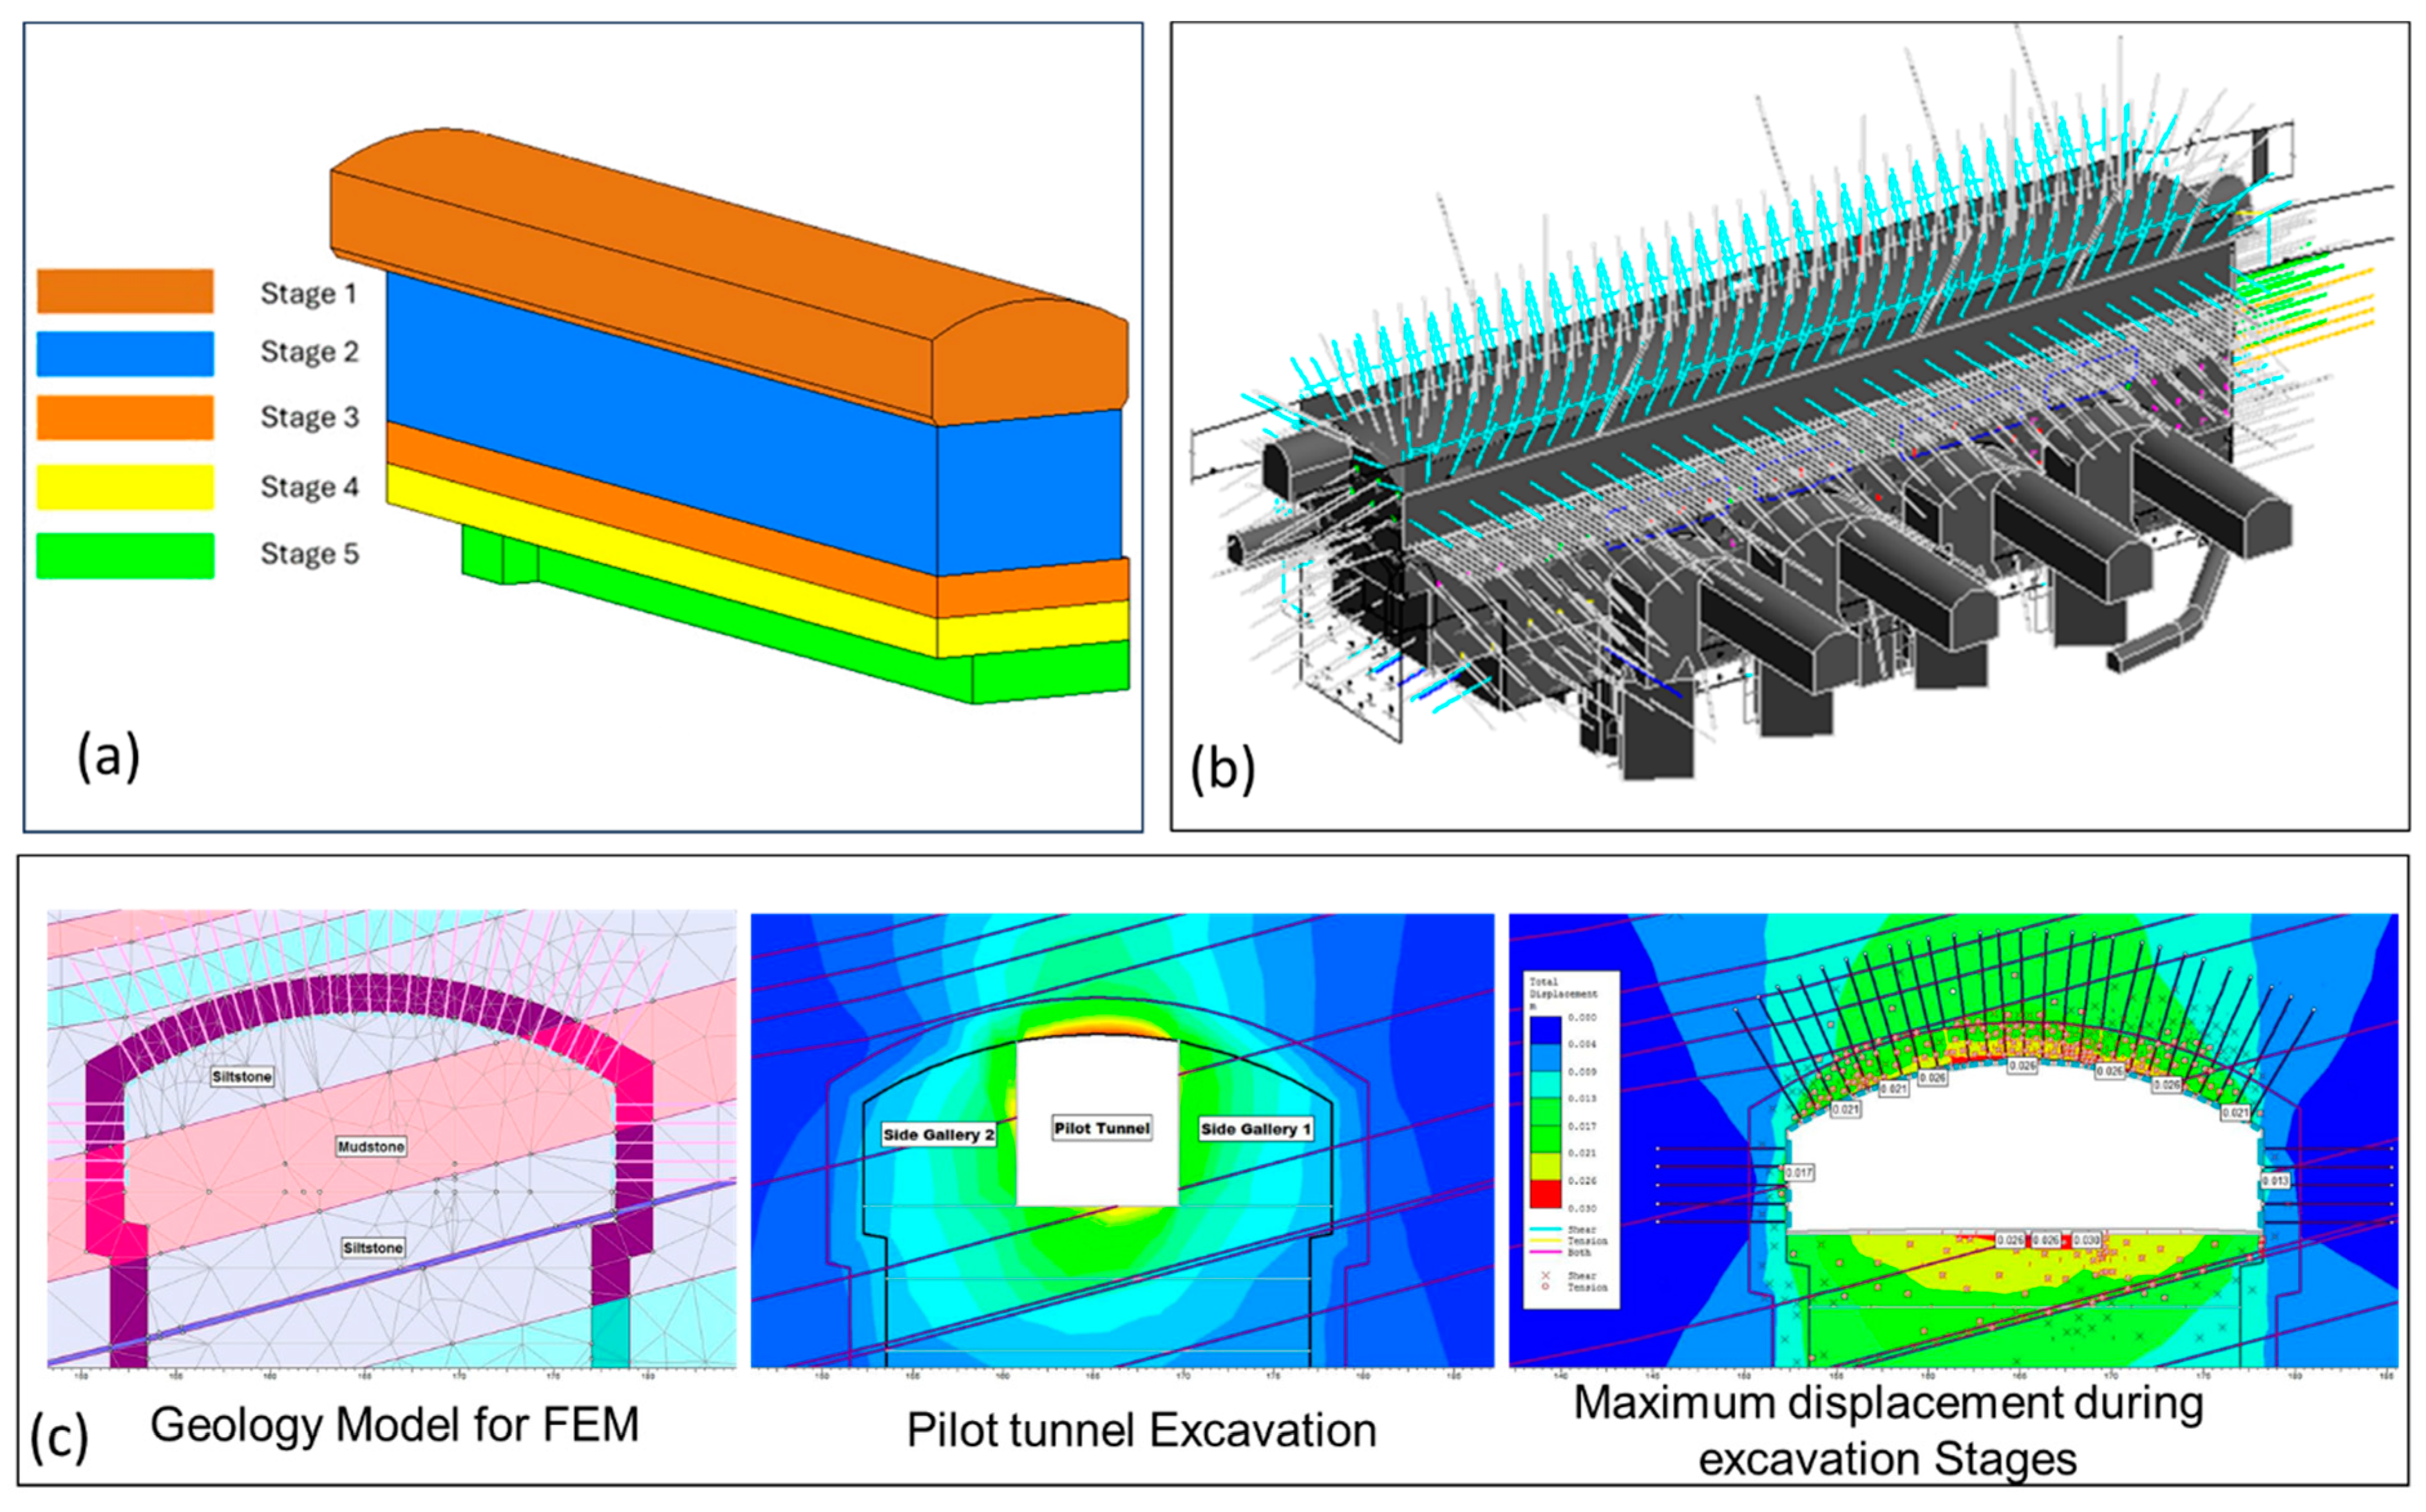
3.2.4. BIM-Based Design and Construction Simulation

The BIM-based design and construction simulation are critical components of the DT framework, enabling the detailed digital representation of the underground cavern’s geometric and semantic attributes. A BIM-driven digital framework was developed to simulate the structural behavior, excavation process, and rock support system, ensuring that all construction phases were optimized for safety and efficiency. The development of BIM-based digital design starts from Step 2 in the BIM-based virtual environment. Then, in this step, as the design goes towards finalization, the creation of a parametric geometric model, which provides a comprehensive three-dimensional visualization of all structural components, including excavation geometry, phased excavation plans, and geotechnical data, is performed. These models are updated in case of any changes required during the construction phase based on any necessary changes for the optimal stability of the underground cavern.
The BIM model was designed by using Industry Foundation Classes (IFC)-compliant data structures, ensuring interoperability across different software platforms. Figure 9a illustrates a Building Information Modeling (BIM)-based excavation plan, detailing the sequential excavation process using a heading and benching approach. The model incorporated key components such as the geometric representation of the cavern, rock mass classification, and excavation sequencing as already defined in the Methodology section. Structural components, including shotcrete layers, rock bolts, and anchors were embedded in the model (Figure 9b). Additionally, the model included the layout of monitoring instruments, allowing real-time deformation data from sensors such as extensometers, load cells, and convergence arrays to be linked directly with the digital model for real-time deformation monitoring and feedback during construction and operational phases.
A BIM-based construction simulation was carried out to analyze and optimize the excavation and rock support installation sequence. The virtual construction process, including sequential excavation modeling, was then used for the FEM simulation to simulate the excavation stages, helping us to understand stress redistribution and deformation patterns. Figure 9c showcases the finite element method (FEM) simulation of the excavation sequence, demonstrating how stress redistribution and deformation occur as different excavation stages progress. During the construction phase, the BIM model is continuously updated with as-built information, ensuring that the virtual model remains an accurate reflection of the physical structure. This real-time synchronization between the virtual and physical worlds allows for the continuous necessary adjustments to the rock support design or construction sequences to be made promptly based on the feedback from the monitoring instruments, ensuring that the underground cavern remains stable and safe throughout its lifecycle.

3.2.5. Actual Construction

The excavation was carried out primarily by using the drill and blast method, with smooth blasting techniques incorporated to minimize overbreak and maintain an optimal excavation profile. The excavation sequence followed the heading and benching methods, with adjustments made based on real-time geological feedback from the DT-integrated monitoring system. The DT model continuously updated excavation progress, linking blast sequencing, stress redistribution, and deformation trends, ensuring that modifications to the excavation approach were data-driven and proactive. In actual construction based on the proposed digital twin, the as-built geology, excavation sequence, and support measures were implemented along with the installation of convergence equipment replicating the virtual world (Figure 10).
Geological mapping was conducted through continuous face mapping after each blast, ensuring the real-time documentation of rock mass quality and geomechanical properties. The DT team utilized Q-system classification, categorizing the exposed rock into Q2 to Q5 classes, which dictated the intensity and type of support measures required. This allowed the engineers to simulate different support configurations before implementation, ensuring stability and safety. Support systems were applied immediately after excavation, with reinforcement strategies dynamically adjusted based on DT-driven predictions of stress and deformation behavior.
A total of 42 sets of three-point extensometers were installed throughout the powerhouse cavern to monitor deformation and convergence. In addition, 17 anchor load cells were installed to measure the load buildup in cable anchors and bolt anchors. Therefore, the combined total of measurement units installed for deformation and load monitoring in the powerhouse section amounted to 59 units. In addition, during the construction phase of the powerhouse cavern, several convergence stations were established by using reflective targets placed at various locations to monitor deformation across the cavern openings. The installation of convergence monitoring instruments during the actual construction was a fundamental aspect of the real-world application of the DT framework, facilitating the continuous deformation monitoring and stability assessment of the underground powerhouse cavern. Reflective targets were employed at designated convergence stations to monitor the relative displacement between two fixed points. This method proved to be highly effective in detecting ground convergence around excavation zones, offering reliable insights into the stability of the surrounding rock mass. A total of eight convergence arrays were installed along the 137 m length of the powerhouse cavern. These arrays were strategically positioned around the cavern’s periphery—including the crown, sidewalls, and invert—ensuring the comprehensive capture of displacement data from all critical structural zones. The installation process was executed in a phased manner, synchronized with the excavation progress. Targets were fixed as close as possible to the advancing excavation face or the deepening invert, enabling the early detection of deformation trends and enhancing the responsiveness of support measures. In the post-construction phase, convergence stations were replaced with a 3D prism target system; the original reflective target-based convergence stations became largely ineffective due to the obstruction of lines of sight caused by the installation of electro-mechanical equipment and false walls. A total of 24 prism targets were planned across six sections, with two additional fixed reference targets at the end wall. Measurements were taken by using a total station, enabling precise 3D displacement tracking throughout the underground complex.
The installation methodology offered several practical advantages on site. It was relatively simple and cost-effective, allowing for efficient deployment even under constrained working conditions. The ease of installation also made it feasible to reposition or adjust targets in response to changes in the excavation geometry, such as the presence of construction niches, cable galleries, or support system elements. These adaptive modifications ensured uninterrupted monitoring coverage throughout the construction process. The integration of geological mapping, excavation, support measures, and convergence equipment, which replicates the virtual environment in the physical world in the DT environment, facilitated a responsive and adaptive construction approach, enhancing safety, reducing uncertainties, and improving the long-term stability of the powerhouse cavern.

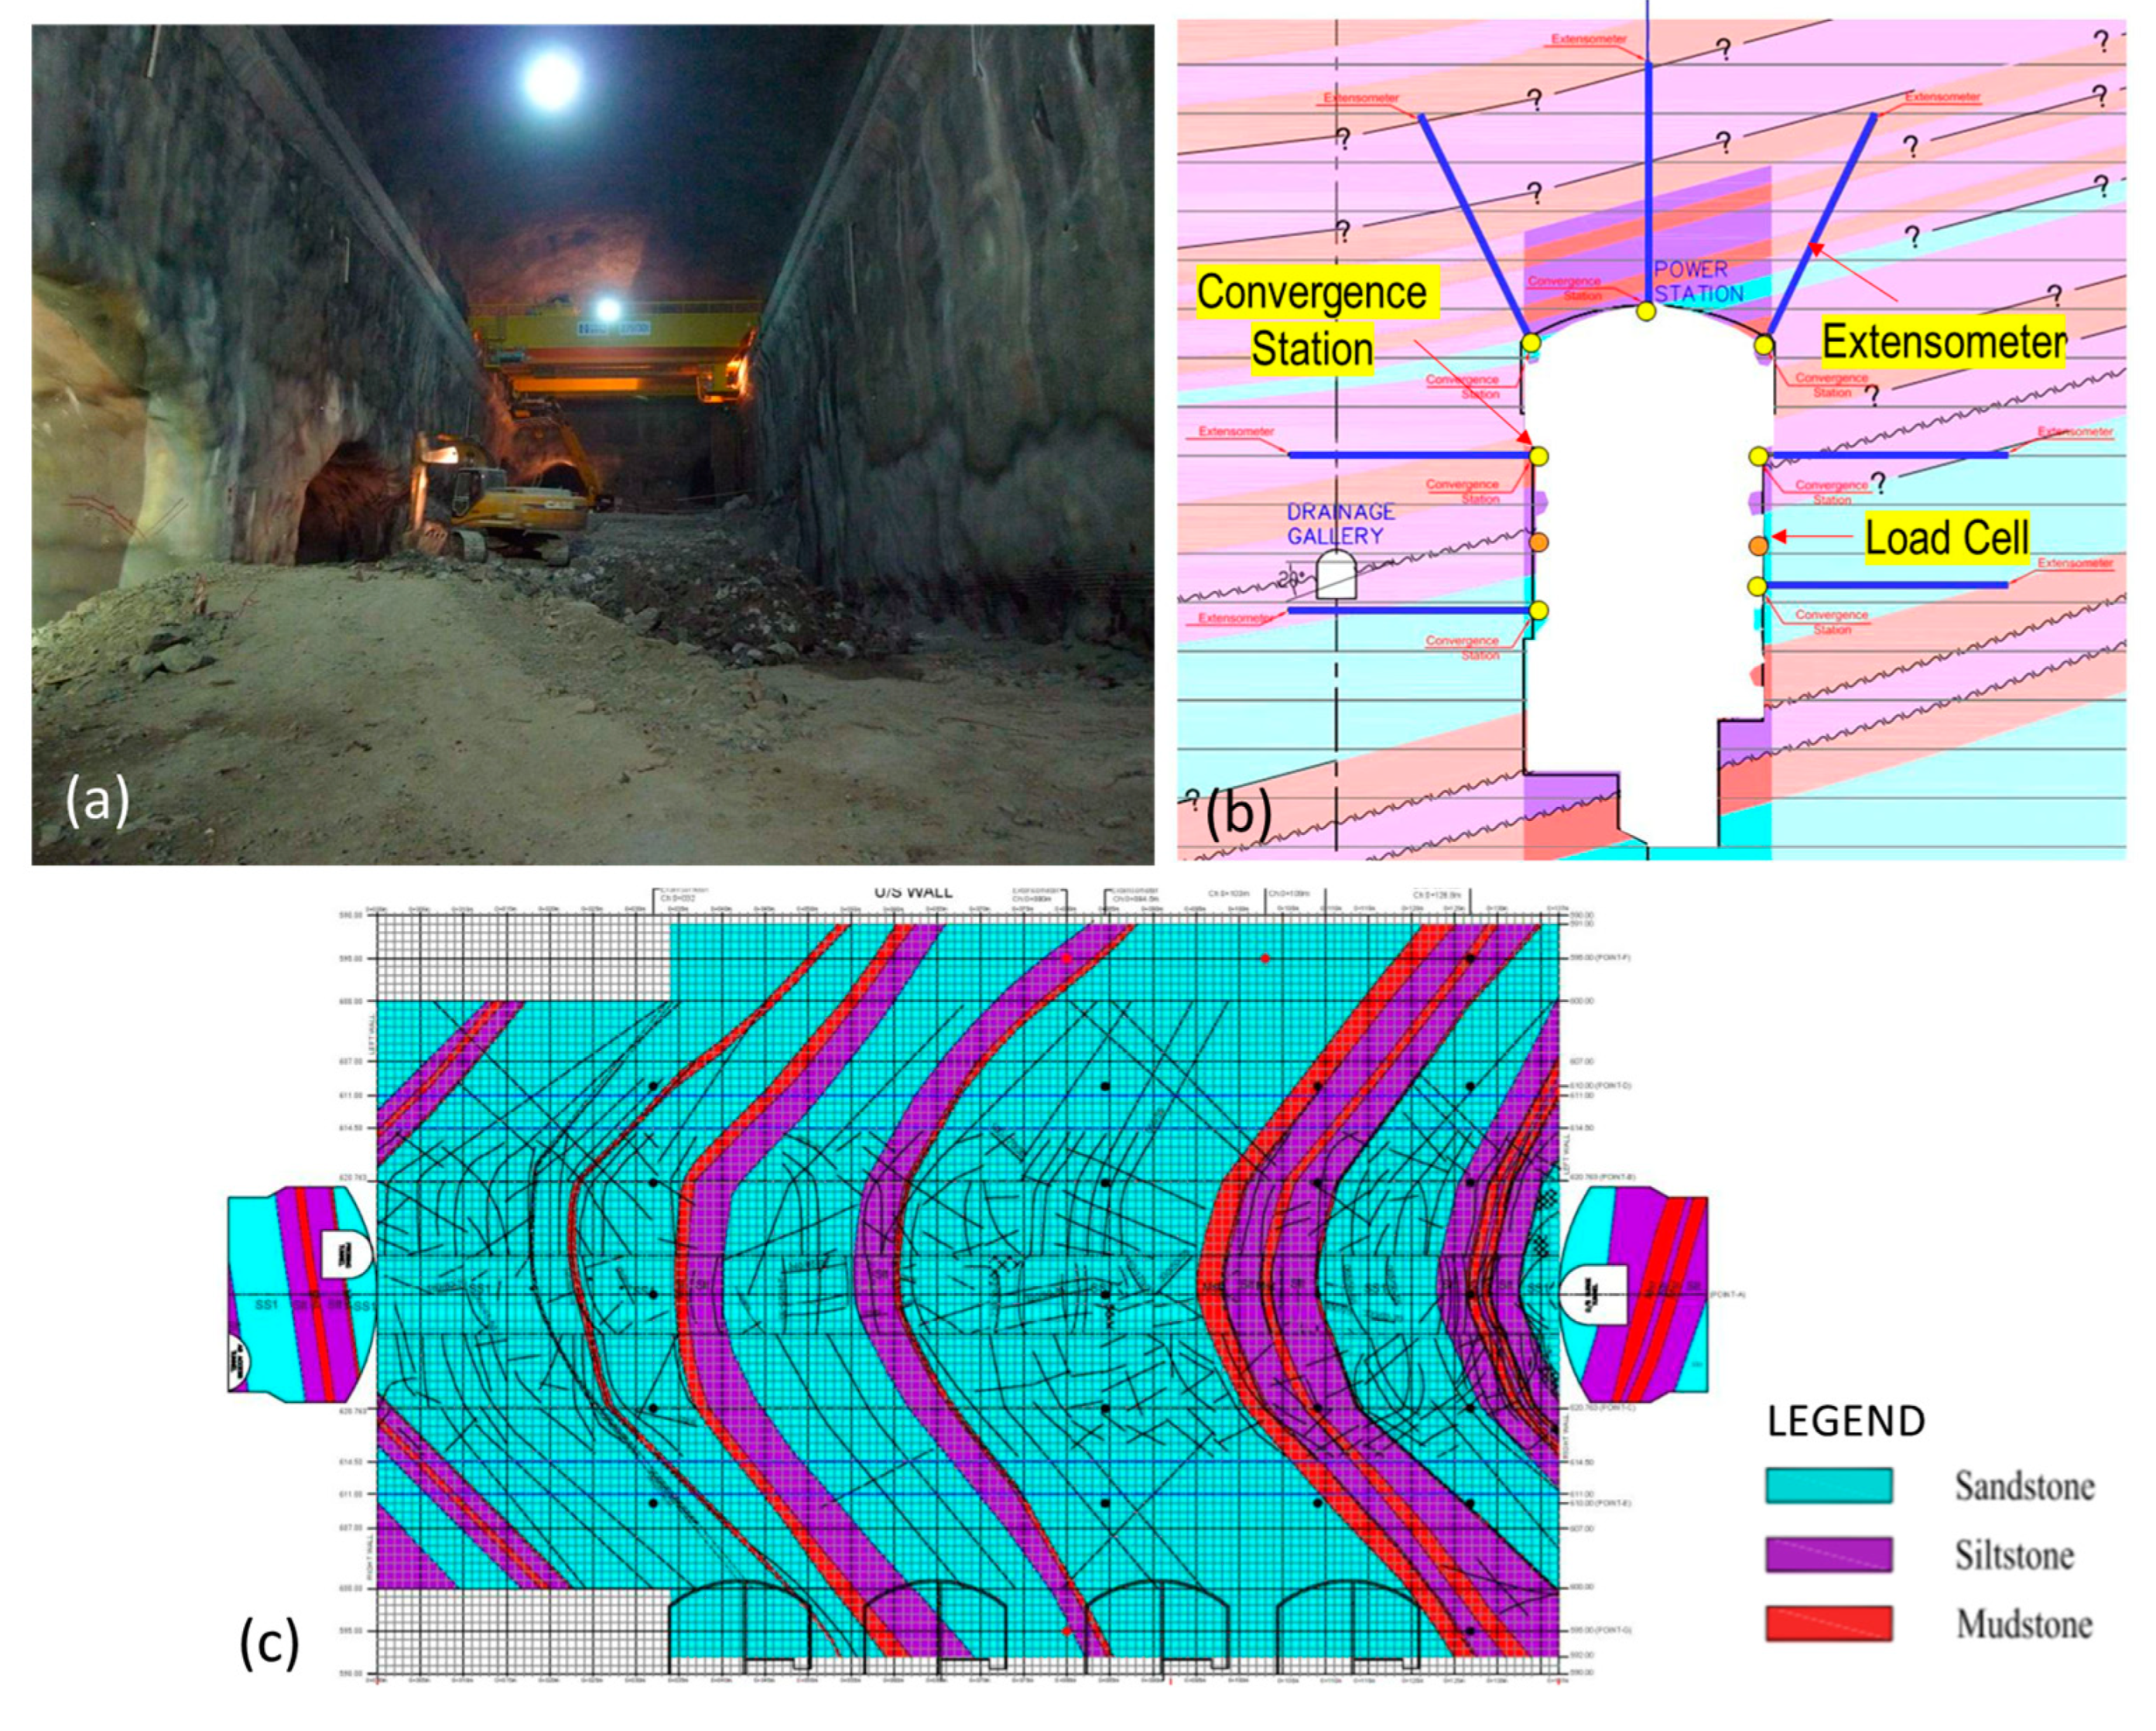
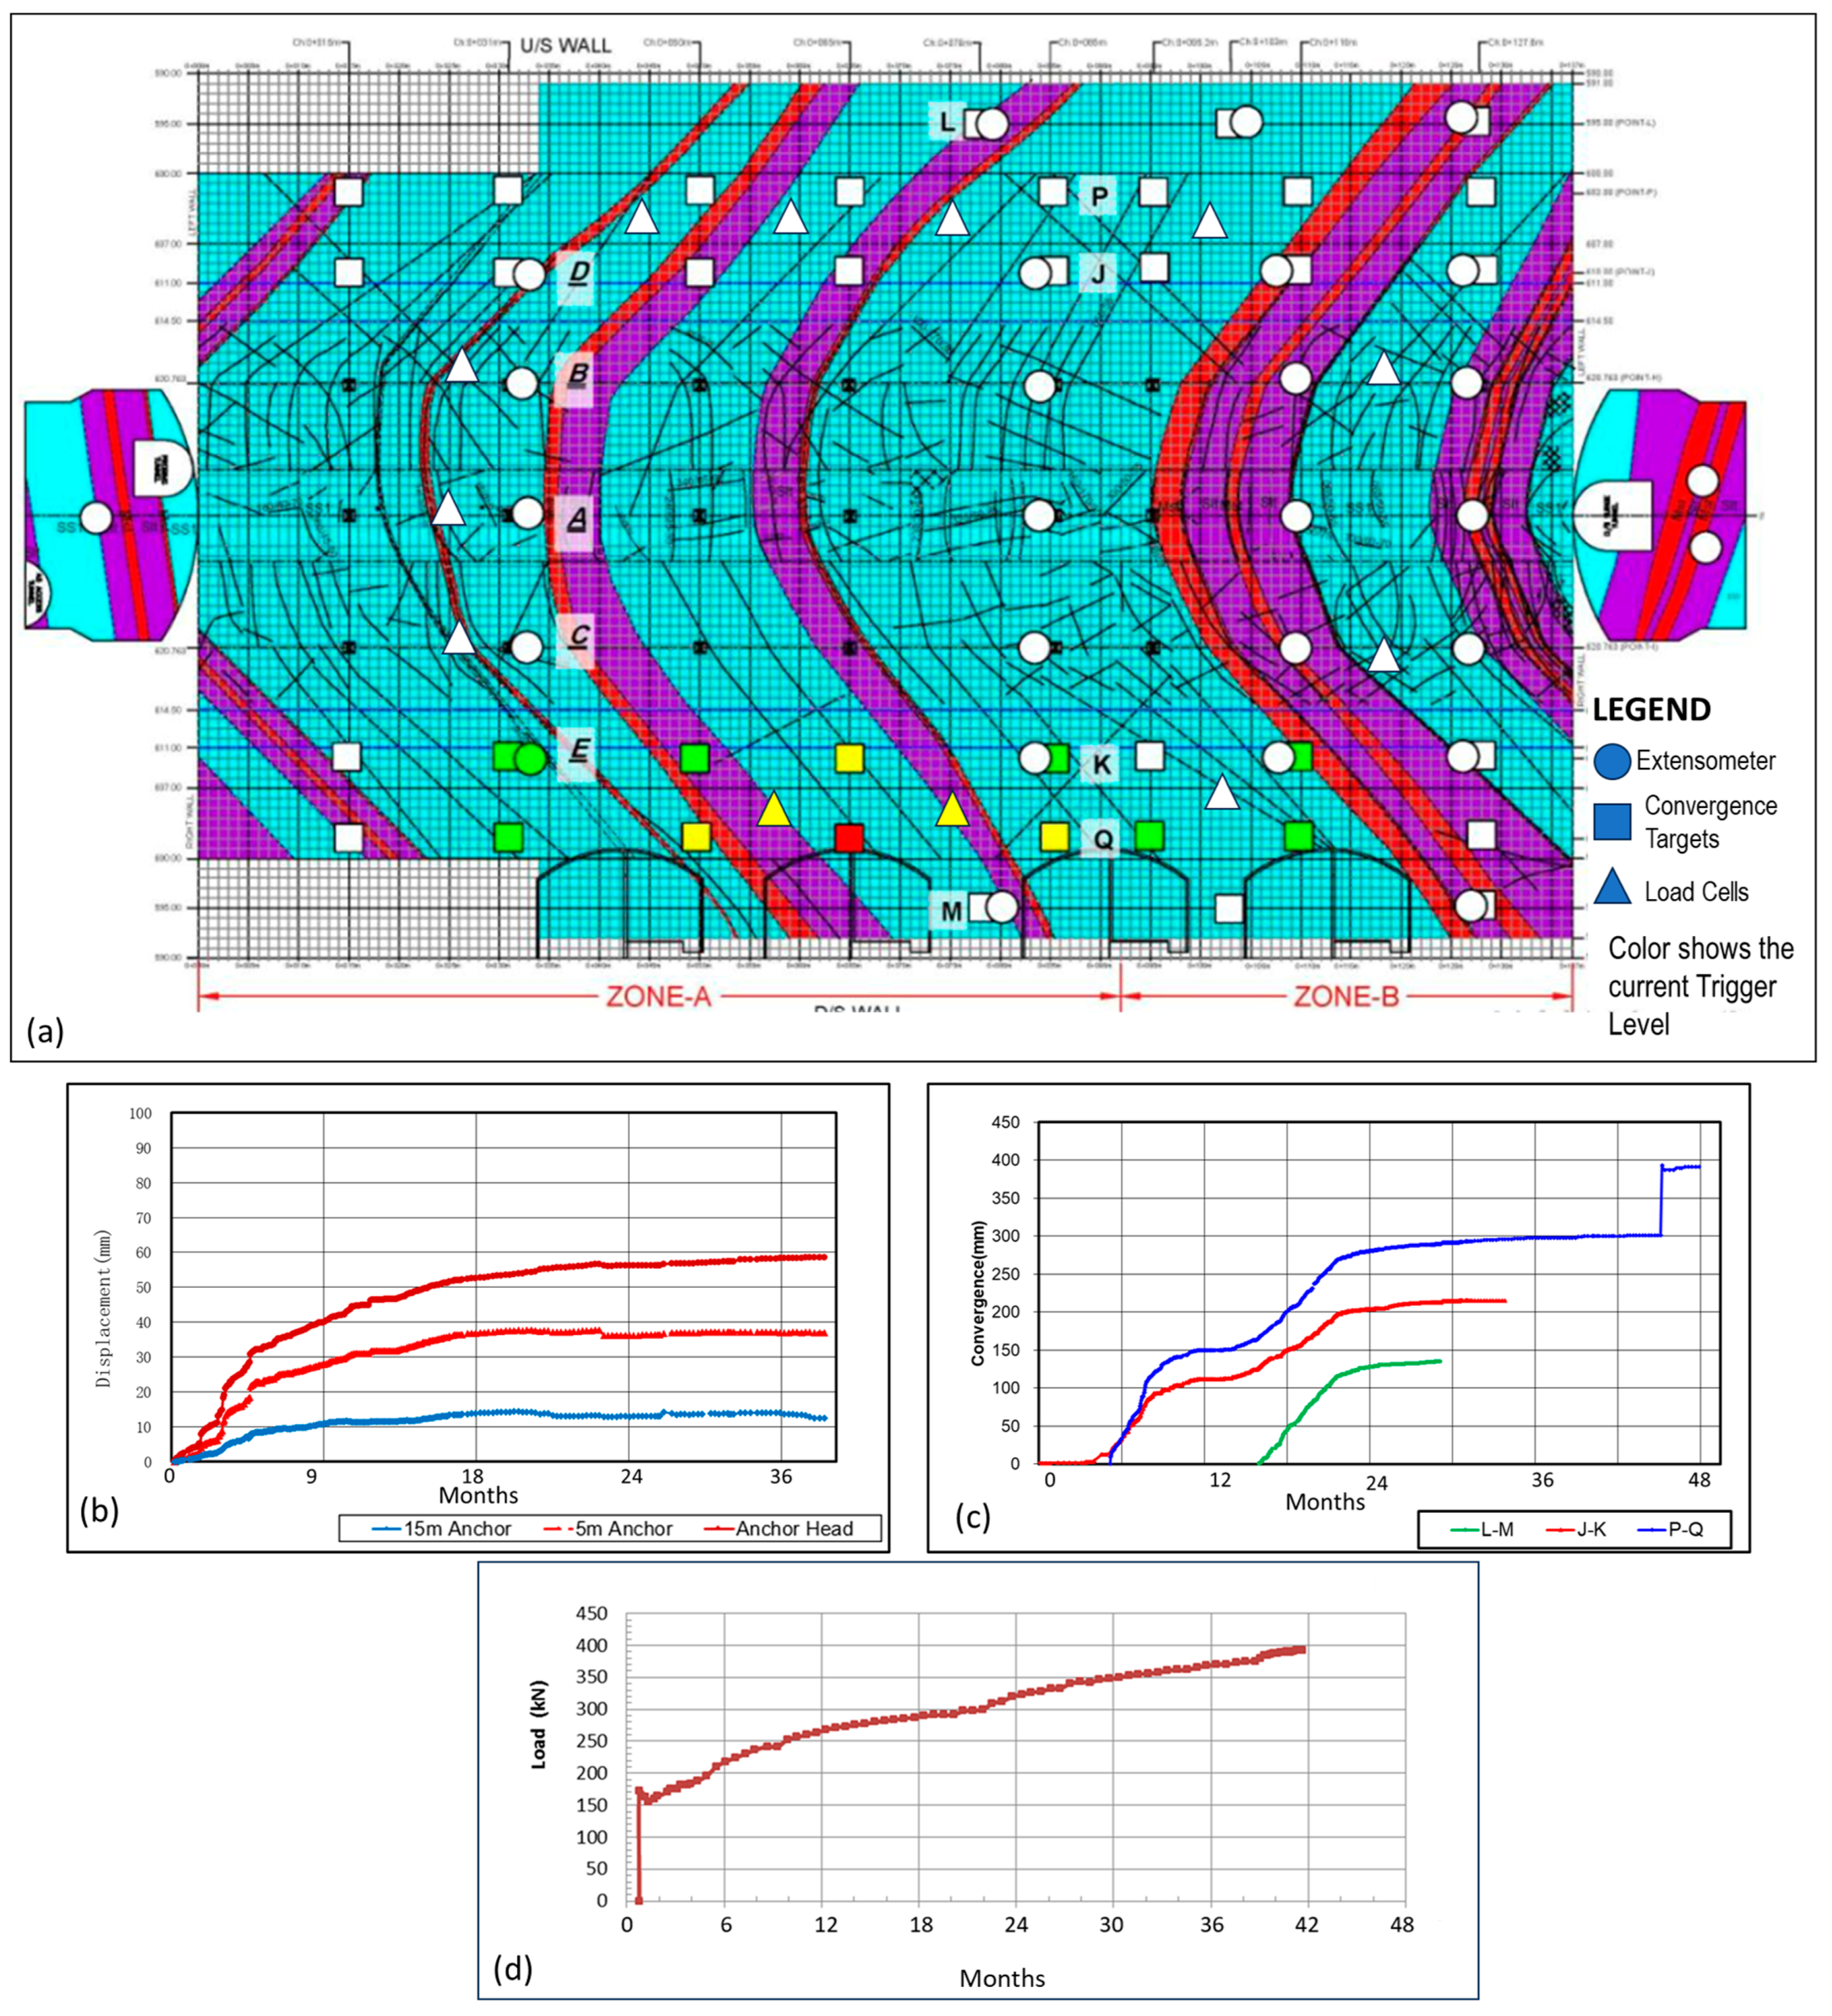
3.2.6. Deformation Data Acquisition

During construction and post-construction data acquisition, deformation monitoring in the underground powerhouse complex was carried out by using a combination of extensometers, load cells, and reflective targets (Figure 11). A total of 52 three-point vibrating wire extensometers were installed to measure rock mass deformations, and vibrating wire load cells (two in the powerhouse cavern, eight in the bus bar tunnels, and two in bonneted gate niches) were used to monitor anchor load development. For the data collection of these extensometers and load cells, a structured and centralized data acquisition system was implemented to enhance monitoring efficiency. All instrument cables from extensometers and load cells were routed to dedicated panel boards located in the powerhouse control room and transformer hall access gallery. Data collection was conducted by using digital vibrating wire readout units (e.g., BGK-405), which allowed for the direct connection to panel sockets without the need to access individual instruments manually. These readout units featured internal data logging capabilities, enabling the automatic recording of measurements with corresponding timestamps and instrument IDs. Once collected, the data were transferred to central computing systems via USB or Bluetooth, where they were further processed and analyzed by using Excel spreadsheets and specialized monitoring software. This centralized and semi-automated approach ensured the accurate, efficient, and secure handling of deformation monitoring data, facilitating long-term structural performance assessment. Figure 11d shows the sudden increase in load cell readings after a period of zero load in the beginning due to the installation configuration, as these load cells were installed without applying pre-tension or pre-load. In cases where load cells are installed without pre-tension, they do not record any load until the surrounding ground movement or convergence becomes sufficient to mobilize the support system. This behavior is commonly observed in underground monitoring setups and aligns with standard field conditions.
Convergence stations with reflective targets were installed across the cavern to measure lateral displacements by using a total station. Data were collected by using a total station, which measured the distance between opposing reflective targets with high precision. These measurements were carried out manually at regular intervals, typically once per week, depending on the excavation progress and the observed rock behavior. The recorded measurements were then manually entered into Excel spreadsheets for analysis, enabling the engineers to monitor convergence trends and assess the effectiveness of the installed support systems. However, as structural and electro-mechanical installations progressed, the visibility between targets was obstructed, limiting the effectiveness of this method. Post-construction data acquisition addressed the limitations of the initial reflective targets system. The reflective targets were replaced with a high-precision 3D prism monitoring system, comprising 24 prism targets installed in six sections and two fixed reference targets at the powerhouse end wall. These values are read by an automated total station and linked with the existing data-logging systems of load cells and extensometers.

3.2.7. BIM-Based As-Built Information

As the construction and excavation progressed, the real-world construction data of actual deformation, as-built rock support, and geological model data within the DT framework were integrated in real time to ensure continuous updates and refinements (Figure 12). A multi-BIM model was developed to replicate actual construction conditions, dynamically updating the excavation and support processes in Steps 2, 3, and 4 based on real-world feedback. The BIM-based visualization deformation monitoring system enabled engineers to track convergence trends in the powerhouse cavern, identifying zones of excessive deformation and assessing the effectiveness of installed support systems. Instrumentation data from extensometers, load cells, and convergence arrays were fed into the FEM models, allowing for the real-time assessment of deformation behavior and the triggering of necessary modifications to the rock support strategy based on defined trigger levels. As-built support elements, including rock bolts, shotcrete layers, and anchors, were continuously updated in the model to reflect field adjustments. Additionally, a BIM-based as-built geological model was developed, incorporating detailed lithology, geological structures, and weak zones, ensuring that excavation and support strategies remained data-driven.
This feedback loop informed earlier DT phases, particularly geological modeling, numerical analysis, and construction sequencing, optimizing safety and stability. The BIM-DT integration improved excavation efficiency, enhanced rock support effectiveness, and ensured long-term structural resilience, offering a scalable framework for future underground construction.

3.3. Evaluation Metrics

Table 4 shows the evaluation metrics for the Neelum Jhelum Hydropower Project powerhouse cavern construction case study to assess the effectiveness of the proposed DT framework. These metrics provide a quantitative and qualitative basis for evaluating the framework’s performance in real-world underground construction scenarios. The traditional method lacks real-time monitoring and relies on static design assumptions without continuous feedback on site conditions. Therefore, in our evaluation metrics, we considered the traditional method only until the design reached a stable state and no further input was provided, which is general industry practice. We then compared it with the proposed framework, which integrates real-time sensor data and adaptive optimization, demonstrating superior performance in stability assessment, deformation control, and rock support efficiency. Comparative benchmarking against traditional methods indicates significant improvements in deformation control, risk mitigation, and the decision-making process throughout the lifecycle.

4. Conclusions

This study addresses the limitations of traditional stability assessment methods for large underground caverns, which often fail to capture real-time changes in rock behavior, leading to potential safety risks and inefficiencies in rock support systems. It integrates DT with BIM and IFC standards to develop a structured framework to enhance stability monitoring and optimization in underground construction. It incorporates real-time sensor data into virtual models to monitor structural performance continuously and respond proactively to changes in rock mass behavior. This approach enhances both safety and long-term stability during the design, construction, and operational phases.
The practical implementation of this study demonstrates that the integration of DT, BIM, and IFC significantly improves deformation monitoring, optimizes rock support systems, and enhances risk management practices in near-real time. It highlighted the framework’s ability to dynamically update virtual models with real-time data, ensuring accurate predictions and timely interventions during construction and operational phases. The implications of this study are substantial for the field of underground engineering. The framework offers a pathway toward safer, more efficient, and data-driven construction practices by providing a scalable and adaptable solution. It bridges the gap among design, construction, and operational phases, enabling a holistic approach to stability management in complex underground environments. One of the key strengths of this study lies in its comprehensive methodology, which integrates geological assessments, virtual modeling, real-time monitoring, and optimization strategies into a unified framework. Although the study has successfully demonstrated its effectiveness in real-world applications, it has certain limitations in terms of computational demands for processing large-scale geotechnical and sensor data in real time, requiring high-performance computing resources that may not be readily available in all project settings. Furthermore, the case study presented is limited to a specific geological and construction context, and further validation across diverse environments is necessary to generalize the findings.
This significantly contributes to the body of knowledge by demonstrating the potential of DT, BIM, and IFC integration in underground construction. The framework’s ability to provide real-time feedback and optimize rock support systems represents a notable advancement in the field. For future research, it is recommended to explore ways to enhance the framework’s automation and predictive analytic capabilities. Additionally, further studies should focus on applying this methodology to a wider range of underground environments, including those with varying geological conditions and construction methods.

Author Contributions

Conceptualization, A.S., W.A.T. and K.M.M.; Methodology, A.S.; Software, A.S.; Validation, A.S. and M.U.Z.; Formal analysis, A.S. and M.U.Z.; Investigation, A.S.; Resources, W.A.T.; Data curation, A.S. and K.M.M.; Writing—original draft, A.S. and K.M.M.; Writing—review & editing, A.S. and W.A.T.; Visualization, M.U.Z.; Supervision, W.A.T.; Project administration, K.M.M.; Funding acquisition, W.A.T. and M.U.Z. All authors contributed equally to manuscript preparation. All authors have read and agreed to the published version of the manuscript.

Funding

This work was funded by the Deanship of Scientific Research, Vice Presidency for Graduate Studies and Scientific Research, King Faisal University, Saudi Arabia. Grant No. KFU251479.

Data Availability Statement

The data set used/or analyzed during the current study available from the corresponding authors upon reasonable request.

Acknowledgments

The authors acknowledge the Deanship of Scientific Research, Vice Presidency for Graduate Studies and Scientific Research, King Faisal University, Saudi Arabia (Grant No. KFU251479).

Conflicts of Interest

The authors declare that they have no conflicts of interest.

References

  1. Li, H.; Chen, W.; Tan, X.; Chen, E. Digital Design and Stability Simulation for Large Underground Powerhouse Caverns with Parametric Model Based on BIM-Based Framework. Tunn. Undergr. Space Technol. 2022, 123, 104375. [Google Scholar] [CrossRef]
  2. Li, L.; Jiang, Q.; Huang, Q.; Xiang, T.; Liu, J. Advances in Stability Analysis and Optimization Design of Large Underground Caverns under High Geostress Condition. Deep Resour. Eng. 2024, 1, 100113. [Google Scholar] [CrossRef]
  3. Gattinoni, P.; Pizzarotti, E.M.; Scesi, L. Engineering Geology for Underground Works; Springer: Berlin/Heidelberg, Germany, 2014; ISBN 9400778503. [Google Scholar]
  4. Behnia, M.; Seifabad, M.C. Stability Analysis and Optimization of the Support System of an Underground Powerhouse Cavern Considering Rock Mass Variability. Environ. Earth Sci. 2018, 77, 645. [Google Scholar] [CrossRef]
  5. Xie, W.-Q.; Liu, X.-L.; Zhang, X.-P.; Liu, Q.-S.; Wang, E.-Z. A Review of Test Methods for Uniaxial Compressive Strength of Rocks: Theory, Apparatus and Data Processing. J. Rock Mech. Geotech. Eng. 2024, 17, 1889–1905. [Google Scholar] [CrossRef]
  6. Ghorbani, M.; Shahriar, K.; Sharifzadeh, M.; Masoudi, R. A Critical Review on the Developments of Rock Support Systems in High Stress Ground Conditions. Int. J. Min. Sci. Technol. 2020, 30, 555–572. [Google Scholar] [CrossRef]
  7. Zhang, L. Engineering Properties of Rocks; Butterworth-Heinemann: Oxford, UK, 2016; ISBN 0128028769. [Google Scholar]
  8. Zhu, W.S.; Sui, B.; Li, X.J.; Li, S.C.; Wang, W.T. A Methodology for Studying the High Wall Displacement of Large Scale Underground Cavern Complexes and It’s Applications. Tunn. Undergr. Space Technol. 2008, 23, 651–664. [Google Scholar] [CrossRef]
  9. Zou, L.; Meng, G.; Wu, J.; Fu, W.; Chu, W.; Xu, W. A Case Study on the Stability of a Big Underground Powerhouse Cavern Cut by an Interlayer Shear Zone in the China Baihetan Hydropower Plant. Deep Undergr. Sci. Eng. 2024. Early View. [Google Scholar] [CrossRef]
  10. Bulatov, D.; Solbrig, P.; Gross, H.; Wernerus, P.; Repasi, E.; Heipke, C. Context-Based Urban Terrain Reconstruction from Uav-Videos for Geoinformation Applications. Int. Arch. Photogramm. Remote Sens. Spat. Inf. Sci. 2012, XXXVIII-1/C22, 75–80. [Google Scholar] [CrossRef]
  11. Xiao, X.; Xiao, P.; Dai, F.; Li, H.; Zhang, X.; Zhou, J. Large Deformation Characteristics and Reinforcement Measures for a Rock Pillar in the Houziyan Underground Powerhouse. Rock Mech. Rock Eng. 2018, 51, 561–578. [Google Scholar] [CrossRef]
  12. Ma, H.-P.; Daud, N.N.N.; Yusof, Z.M.; Yaacob, W.Z.; He, H.-J. Stability Analysis of Surrounding Rock of an Underground Cavern Group and Excavation Scheme Optimization: Based on an Optimized DDARF Method. Appl. Sci. 2023, 13, 2152. [Google Scholar] [CrossRef]
  13. Gürdür Broo, D.; Bravo-Haro, M.; Schooling, J. Design and Implementation of a Smart Infrastructure Digital Twin. Autom. Constr. 2022, 136, 104171. [Google Scholar] [CrossRef]
  14. Yan, B.; Yang, F.; Qiu, S.; Wang, J.; Cai, B.; Wang, S.; Zaheer, Q.; Wang, W.; Chen, Y.; Hu, W. Digital Twin in Transportation Infrastructure Management: A Systematic Review. Intell. Transp. Infrastruct. 2023, 2, liad024. [Google Scholar] [CrossRef]
  15. Babanagar, N.; Sheil, B.; Ninić, J.; Zhang, Q.; Hardy, S. Digital Twins for Urban Underground Space. Tunn. Undergr. Space Technol. 2025, 155, 106140. [Google Scholar] [CrossRef]
  16. Tao, F.; Xiao, B.; Qi, Q.; Cheng, J.; Ji, P. Digital Twin Modeling. J. Manuf. Syst. 2022, 64, 372–389. [Google Scholar] [CrossRef]
  17. Latif, K.; Sharafat, A.; Tao, D.; Park, S.; Seo, J. Digital Twin for Excavator-Dump Optimization Based on Two-Stream CNN-LSTM and DES. In Proceedings of the KSCE Convention Conference and Civil Expo, Jeju, Republic of Korea, 16–18 October 2024; pp. 17–18. [Google Scholar]
  18. Grieves, M.; Vickers, J. Digital Twin: Mitigating Unpredictable, Undesirable Emergent Behavior in Complex Systems. In Transdisciplinary Perspectives on Complex Systems; Springer International Publishing: Cham, Switzerland, 2017; pp. 85–113. [Google Scholar]
  19. Guzmán-Torres, J.A.; Domínguez-Mota, F.J.; Alonso Guzmán, E.M.; Tinoco-Guerrero, G.; Tinoco-Ruíz, J.G. A Digital Twin Approach Based Method in Civil Engineering for Classification of Salt Damage in Building Evaluation. Math. Comput. Simul. 2025, 233, 433–447. [Google Scholar] [CrossRef]
  20. Lin, K.; Xu, Y.-L.; Lu, X.; Guan, Z.; Li, J. Digital Twin-Based Collapse Fragility Assessment of a Long-Span Cable-Stayed Bridge under Strong Earthquakes. Autom. Constr. 2021, 123, 103547. [Google Scholar] [CrossRef]
  21. Jiang, F.; Ma, L.; Broyd, T.; Chen, K. Digital Twin and Its Implementations in the Civil Engineering Sector. Autom. Constr. 2021, 130, 103838. [Google Scholar] [CrossRef]
  22. Bado, M.F.; Tonelli, D.; Poli, F.; Zonta, D.; Casas, J.R. Digital Twin for Civil Engineering Systems: An Exploratory Review for Distributed Sensing Updating. Sensors 2022, 22, 3168. [Google Scholar] [CrossRef]
  23. Mahmoodian, M.; Shahrivar, F.; Setunge, S.; Mazaheri, S. Development of Digital Twin for Intelligent Maintenance of Civil Infrastructure. Sustainability 2022, 14, 8664. [Google Scholar] [CrossRef]
  24. Pregnolato, M.; Gunner, S.; Voyagaki, E.; De Risi, R.; Carhart, N.; Gavriel, G.; Tully, P.; Tryfonas, T.; Macdonald, J.; Taylor, C. Towards Civil Engineering 4.0: Concept, Workflow and Application of Digital Twins for Existing Infrastructure. Autom. Constr. 2022, 141, 104421. [Google Scholar] [CrossRef]
  25. Bassier, M.; Vergauwen, M. Unsupervised Reconstruction of Building Information Modeling Wall Objects from Point Cloud Data. Autom. Constr. 2020, 120, 103338. [Google Scholar] [CrossRef]
  26. Lu, Q.; Xie, X.; Parlikad, A.K.; Schooling, J.M. Digital Twin-Enabled Anomaly Detection for Built Asset Monitoring in Operation and Maintenance. Autom. Constr. 2020, 118, 103277. [Google Scholar] [CrossRef]
  27. Hosamo, H.H.; Imran, A.; Cardenas-Cartagena, J.; Svennevig, P.R.; Svidt, K.; Nielsen, H.K. A Review of the Digital Twin Technology in the AEC-FM Industry. Adv. Civ. Eng. 2022, 2022, 2185170. [Google Scholar] [CrossRef]
  28. Xie, N.; Gao, X.; Zhong, Y.; Ye, R.; Chen, S.; Ding, L.; Zhong, T. Enhanced Thermal Performance of Na2HPO4·12H2O Composite Phase Change Material Supported by Sepiolite Fiber for Floor Radiant Heating System. J. Build. Eng. 2022, 56, 104747. [Google Scholar] [CrossRef]
  29. Cheng, X.; Wang, C.; Liang, F.; Wang, H.; Yu, X.B. A Preliminary Investigation on Enabling Digital Twin Technology for Operations and Maintenance of Urban Underground Infrastructure. AI Civ. Eng. 2024, 3, 4. [Google Scholar] [CrossRef]
  30. Shao, F.; Wang, Y. Intelligent Overall Planning Model of Underground Space Based on Digital Twin. Comput. Electr. Eng. 2022, 104, 108393. [Google Scholar] [CrossRef]
  31. Lee, S.; Sharafat, A.; Kim, I.S.; Seo, J. Development and Assessment of an Intelligent Compaction System for Compaction Quality Monitoring, Assurance, and Management. Appl. Sci. 2022, 12, 6855. [Google Scholar] [CrossRef]
  32. Shen, Y.; Ling, J.; Li, X.; Li, H.; Feng, S.; Zhu, H. Holistic Digital-Twin-Based Framework to Improve Tunnel Lighting Environment: From Methodology to Application. Build. Environ. 2022, 224, 109562. [Google Scholar] [CrossRef]
  33. Lee, J.; Lee, Y.; Park, S.; Hong, C. Implementing a Digital Twin of an Underground Utility Tunnel for Geospatial Feature Extraction Using a Multimodal Image Sensor. Appl. Sci. 2023, 13, 9137. [Google Scholar] [CrossRef]
  34. Borrmann, A.; König, M.; Koch, C.; Beetz, J. Building Information Modeling: Why? What? How? In Building Information Modeling; Springer International Publishing: Cham, Switzerland, 2018; pp. 1–24. [Google Scholar]
  35. Lee, S.; Bae, J.Y.; Sharafat, A.; Seo, J. Waste Lime Earthwork Management Using Drone and BIM Technology for Construction Projects: The Case Study of Urban Development Project. KSCE J. Civ. Eng. 2024, 28, 517–531. [Google Scholar] [CrossRef]
  36. Adebiyi, T.A.; Ajenifuja, N.A.; Zhang, R. Digital Twins and Civil Engineering Phases: Reorienting Adoption Strategies. J. Comput. Inf. Sci. Eng. 2024, 24, 100801. [Google Scholar] [CrossRef]
  37. Latif, K.; Sharafat, A.; Park, S.; Seo, J. Digital Twin-Based Hybrid Approach to Visualize the Performance of TBM. In Proceedings of the KSCE, Busan, Republic of Korea, 19–21 October 2022; pp. 3–4. [Google Scholar]
  38. Sharafat, A.; Latif, K.; Tanoli, W.A.; Seo, J. Framework for Design Optimization and Assembly Process Simulation of Tunnel Boring Machine (TBM) Based on Digital Twin and Virtual Reality. In Proceedings of the 22nd International Conference on Construction Applications of Virtual Reality (CONVR), Seoul, Republic of Korea, 16–19 November 2022; pp. 1–8. [Google Scholar]
  39. Sharafat, A.; Latif, K.; Park, S.; Seo, J. Digital Twin-Driven Optimization of Blast Design for Underground Construction. In Proceedings of the KSCE, Busan, Republic of Korea, 19–21 October 2022; pp. 1–2. [Google Scholar]
  40. Yu, G.; Lin, D.; Wang, Y.; Hu, M.; Sugumaran, V.; Chen, J. Digital Twin-Enabled and Knowledge-Driven Decision Support for Tunnel Electromechanical Equipment Maintenance. Tunn. Undergr. Space Technol. 2023, 140, 105318. [Google Scholar] [CrossRef]
  41. Baghalzadeh Shishehgarkhaneh, M.; Keivani, A.; Moehler, R.C.; Jelodari, N.; Roshdi Laleh, S. Internet of Things (IoT), Building Information Modeling (BIM), and Digital Twin (DT) in Construction Industry: A Review, Bibliometric, and Network Analysis. Buildings 2022, 12, 1503. [Google Scholar] [CrossRef]
  42. Yu, D.; He, Z. Digital Twin-Driven Intelligence Disaster Prevention and Mitigation for Infrastructure: Advances, Challenges, and Opportunities. Nat. Hazards 2022, 112, 1–36. [Google Scholar] [CrossRef]
  43. Tuhaise, V.V.; Tah, J.H.M.; Abanda, F.H. Technologies for Digital Twin Applications in Construction. Autom. Constr. 2023, 152, 104931. [Google Scholar] [CrossRef]
  44. Bellini Machado, L.; Massao Futai, M. Tunnel Performance Prediction through Degradation Inspection and Digital Twin Construction. Tunn. Undergr. Space Technol. 2024, 144, 105544. [Google Scholar] [CrossRef]
  45. Salzgeber, H.; Ernst, M.; Schneiderbauer, L.; Flora, M. From Digital Model to Digital Twin in Tunnel Construction. Civ. Eng. Des. 2024, 6, 74–83. [Google Scholar] [CrossRef]
  46. Muhammad Waleed, Q.; Azfar Khan, R.W.; Sharafat, A.; Arshad Tanoli, W.; Zubair, M.U.; Qureshi, H.J. Development of BIM-Based Tunnel Information Modeling Prototype for Tunnel Design. Adv. Civ. Eng. 2024, 2024, 8118578. [Google Scholar] [CrossRef]
  47. Yamamoto, A.; Yabuki, N.; Aruga, T.; Yamamoto, K.; Fukuda, T. Development of IFC River—A River Product Model for Realizing Digital Twins of the River System. In Proceedings of the International Conference on Computing in Civil and Building Engineering, Melbourne, Australia, 3–4 February 2025; pp. 628–638. [Google Scholar]
  48. Huymajer, M.; Paskaleva, G.; Wenighofer, R.; Huemer, C.; Mazak-Huemer, A. IFC Concepts in the Execution Phase of Conventional Tunneling Projects. Tunn. Undergr. Space Technol. 2024, 143, 105368. [Google Scholar] [CrossRef]
  49. Sharafat, A.; Latif, K.; Khan, M.S.; Seo, J. Development of BIM-IFC Standard Data Model Framework for Rock Support of Drill-and-Blast Tunnelling Projects. In Proceedings of the KSCE Convention Conference and Civil Expo, Jeju, Republic of Korea, 21–23 October 2020; pp. 536–537. [Google Scholar]
  50. International Tunnelling and Underground Space Association. I.T. and U.S.A Monitoring and Control in Tunnel Construction; ITA: Rome, Italy, 2011. [Google Scholar]
  51. Schuppener, B. Eurocode 7: Geotechnical Design, Part 1: General Rules-Its Implementation in the European Member States. In Proceedings of the 14th European Conference on Soil Mechanics and Geotechnical Engineering, Spain, Madrid, 23–28 September 2007; Volume 2, pp. 279–289. [Google Scholar]
  52. Kong, K.W.K.; Karlovsek, J. Recommended Rock Joints Setting in 2D FEM Simulations for Engineering Design of Excavations Created in Jointed Rockmass. Aust. J. Multi-Discip. Eng. 2024, 20, 88–106. [Google Scholar]
  53. Granitzer, A.-N.; Tschuchnigg, F. Practice-Oriented Validation of Embedded Beam Formulations in Geotechnical Engineering. Processes 2021, 9, 1739. [Google Scholar] [CrossRef]
  54. Carter, T.G. On Increasing Reliance on Numerical Modelling and Synthetic Data in Rock Engineering. In Proceedings of the ISRM Congress, Montreal, QC, Canada, 10–13 May 2015; ISRM: Lisbon, Portugal, 2015; p. ISRM-13CONGRESS. [Google Scholar]
Figure 1. Five-dimensional digital twin framework.
Applsci 15 04481 g001
Figure 2. Digital twin modules applied in optimization.
Applsci 15 04481 g002
Figure 3. UML diagram of proposed IFC schema extension for digital twin for underground convergence monitoring.
Applsci 15 04481 g003
Figure 4. Digital twin-driven stability optimization framework for large underground caverns.
Applsci 15 04481 g004
Figure 5. Description of trigger levels.
Applsci 15 04481 g005
Figure 6. (a) BIM-based geological model of powerhouse cavern; (b) geological model showing current and tender powerhouse locations.
Applsci 15 04481 g006
Figure 7. Two-dimensional numerical analysis of power house for K = 1.75 in plane and K = 2.25 out of plane, showing (a) deformation without rock support, (b) deformation with rock support, (c) strength factor without rock support, (d) strength factor with rock support, (e) σ1 (maximum stress), and (f) σ3 (tensile stress).
Applsci 15 04481 g007
Figure 8. Three-dimensional finite element analysis (FEM). (a) Overview of BIM-based 3D generation of mesh of powerhouse; (b) initial stress condition (σ1) at powerhouse; (c) total shear strain of powerhouse floor (577 m); (d) deformation pattern during stage 4 of excavation.
Applsci 15 04481 g008
Figure 9. BIM-based construction simulations. (a) Solid BIM-model showing excavation sequence with heading and benching approach; (b) BIM-based rock support model showing anchors, rock bolts, shotcrete, and monitoring instruments; (c) excavation sequence FEM analysis to simulate redistribution of stresses and deformation.
Applsci 15 04481 g009
Figure 10. (a) Powerhouse Stage 3 excavations in real world; (b) powerhouse cross-section showing location of convergence arrays, load cells, and extensometers; (c) geological mapping of powerhouse during construction.
Applsci 15 04481 g010
Figure 11. (a) Location of extensometers, convergence stations, and load cells; sample of deformation data over months in flat format with graphical representation. (b) Extensometer data; (c) convergence station data; (d) load cell data.
Applsci 15 04481 g011
Figure 12. BIM-based as-built information. (a) Actual convergence data; (b) as-build geological information; (c) as-built excavation progress; (d) as-built rock support system.
Applsci 15 04481 g012
Table 1. Definition of sensors and performance attribute sets.
Property SetAttribute NameData TypeDescriptionStatus
Pset_SensorCommonFeatureSensorIDStringUnique identifier for sensor.Existing
SensorTypeEnumType of sensor (e.g., extensometer or load cell).Existing
ManufacturerStringManufacturer of sensor device.Existing
ModelNumberStringModel number of sensor.Existing
InstallationDateDateDate when sensor was installed.Existing
MeasurementUnitStringUnit of measurement (e.g., mm or kN).Existing
AccuracyDoubleAccuracy of sensor readings.Existing
LocationReferenceStringPosition of sensor in BIM model.Existing
OperatingRangeDoubleRange of values that sensor can measure.Extended
PowerSupplyStringType of power supply (e.g., battery or wired).Extended
CommunicationProtocolStringType of communication protocol (e.g., LoRa or Zigbee).Extended
Pset_SensorMonitoringDataTimestampDateTimeTime when measurement was taken.Existing
MeasuredDisplacementDoubleRecorded displacement value (in mm).Existing
RateOfChangeDoubleRate of displacement change over time.Existing
TriggerLevelEnumAlert level (Green, Amber, or Red).Existing
DataQualityIndicatorEnumStatus of data validity (Valid, Warning, or Error).Existing
MonitoringIntervalStringFrequency of data collection (e.g., hourly or daily).Existing
SensorStatusEnumOperational status of sensor (Active or Faulty).Existing
EnvironmentalFactorsStringExternal influences on sensor readings.Extended
CalibrationStatusEnumIndicates if sensor has been calibrated.Extended
Pset_PerformanceDataStressDistributionDoubleNumeric value for stress analysis results.Existing
DeformationLimitDoubleThreshold for safe deformation.Existing
LoadCapacityDoubleStructural load-bearing capacity of supports.Existing
SupportFailureRiskDoubleCalculated risk factor for support failure.Extended
MaterialDeteriorationDoubleRate of material degradation over time.Extended
ThermalEffectsDoubleImpact of temperature variations on performance.Extended
LongTermStabilityEnumStability classification based on historical data.Extended
CorrosionResistanceEnumCorrosion resistance level of support materials.Extended
FatigueAnalysisBooleanIndicates if fatigue analysis has been conducted.Extended
StructuralHealthScoreDoubleComputed score reflecting overall structural health.Extended
Table 2. Proposed IFC schema extension for digital twin-based convergence monitoring.
CategoryNameDescription
New IFC EntitiesIfcGeotechnicalMonitoringRepresents real-time geotechnical monitoring data.
IfcExcavationProcessTracks excavation sequence and deformation response.
IfcStructuralHealthMonitoringRecords structural response and long-term performance of infrastructure.
New Property SetsPset_ExcavationSequenceStores excavation timing, phasing, and monitored changes.
Pset_MaterialAgingDefines material aging properties based on real-world data feedback.
Pset_SupportSystemCaptures data about rock bolts, shotcrete, and other structural supports.
Pset_SafetyThresholdsDefines trigger levels for deformation and stress beyond safe limits.
Extended TypesIfcRealTimeSensorA specialized sensor type for capturing real-time deformation and stress.
IfcSmartRockBoltA rock bolt equipped with integrated strain and stress sensors.
IfcAutomatedSurveySystemA system capable of continuous real-time geotechnical surveying.
Table 3. Properties of intact rock and rock mass parameters for powerhouse.
Rock TypeProperties of Intact Rock Rock Mass Parameters for Powerhouse
(Avg. Rock Cover = 430 m)
UCS (MPa)GSIElastic Modulus (Ei) (GPa)Material Constant (mi)Cohesion (c) (MPa)Friction Angle (°)Young’s Modulus (Emr) (MPa)
Sandstone (SS-1)80–9260–6830–3416–182.5–3.149–5219,500–21,000
Sandstone (SS-2)43–5048–5217–2016–181.4–1.840–436800–7500
Siltstone62–7048–5221–256–81.3–1.735–386800–7400
Mudstone38–4648–5211–148–101.1–1.534–373500–4200
Table 4. Evaluation metrics compared with existing traditional method.
Evaluation MetricDigital Twin-Driven FrameworkTraditional Method
1. Deformation monitoringMaximum Convergence (mm)±10–20% deviation from predicted values due to real-time updates±30–50% deviation due to limited periodic monitoring
Rate of Deformation (mm/day or mm/month)Continuous monitoring for early detectionManual readings at fixed intervals; higher risk of late detection
Deformation Reduction (%) (before vs. after support installation)30–50% reduction with optimized rock support10–20% reduction due to static design assumptions
2. Rock support optimizationRock Support Effectiveness (% reduction in critical failure zones)40–60% due to predictive modeling and feedback loops15–30% due to predefined static designs
Support utilization efficiency (kN/m2)Optimized based on real-time stress analysisOver-designed due to lack of real-time stress feedback
3. Real-time monitoring accuracySensor accuracy (% deviation from predicted values)±5–10% (validated against simulation models)±25–40% (manual measurements introduce errors)
Data latency Real-time data integrationDelayed by hours/days due to manual processing
4. Stress and stability analysisFactor of Safety (FoS)Maintained dynamically (>1.2) with real-time updatesCalculated in design phase, may not reflect actual conditions
Stress Redistribution Efficiency (% change in stress post-excavation)30–50% improvement due to adaptive modifications10–20% improvement with static support design
Shear strain concentration (%)Identified dynamically to prevent failureIdentified post-failure in most cases
5. BIM-based construction efficiencyDeviation from Planned Excavation Sequence (%)<10% due to continuous design refinements>25% due to unforeseen site conditions
Design Modifications (% changes in geometry or structural design)Adjusted dynamically with real-time feedbackRequires significant redesign and delays
Real-time Model Update Frequency (updates per day/week)Continuous updates (daily/hourly)Updated manually (weekly or monthly)
Decision Response Time (hours or days)Immediate corrective actionsDelayed response due to manual assessments
Disclaimer/Publisher’s Note: The statements, opinions and data contained in all publications are solely those of the individual author(s) and contributor(s) and not of MDPI and/or the editor(s). MDPI and/or the editor(s) disclaim responsibility for any injury to people or property resulting from any ideas, methods, instructions or products referred to in the content.

