Article

Research on the Strength Prediction Method of Coal and Rock Mass Based on the Signal While Drilling in a Coal Mine

1
School of Energy and Mining Engineering, China University of Mining & Technology-Beijing, Beijing 100083, China
2
Shaanxi Xiaobaodang Mining Co., Ltd., Yulin 719000, China
3
College of Energy Engineering, Xi’an University of Science and Technology, Xi’an 710054, China
*
Author to whom correspondence should be addressed.
Appl. Sci. 2025, 15(8), 4427; https://doi.org/10.3390/app15084427
Submission received: 13 March 2025 / Revised: 31 March 2025 / Accepted: 15 April 2025 / Published: 17 April 2025

Abstract

:
To study the response relationship between drilling signal and rock mass geomechanical parameters, accurately and quickly perceive and predict the strength of coal and rock mass, guide the optimization of drilling control parameters and the design of the support scheme, and improve the efficiency of roadway excavation, the prediction of rock uniaxial compressive strength based on drilling signal was carried out. Based on the 112,206 return air chute in the Xiaobaodang No.1 Coal Mine as the engineering background, through the drilling data obtained from the roof anchor cable support, data processing, and feature selection, this paper establishes a coal and rock mass strength prediction model based on the AdaBoost integrated algorithm, optimizes the hyperparameter of the model, and analyzes and evaluates the prediction results. The results show that in the AdaBoost integration model, the R2 of SVM is the highest, 0.972, and the values of RMSE, MAE, MAPE, and other error indicators are the lowest. The prediction accuracies of the SVM model, tree model, and linear model are 98.8%, 85.4%, and 75.6%, respectively. The experimental results show that the AdaBoost integrated algorithm using a based learning machine has higher prediction accuracy. At the same time, compared with the current advanced model, it further verifies the effectiveness of the model in the coal mine.

1. Introduction

To meet the urgent needs of the country and coal mines for intelligent equipment, especially during the mining process, the importance of rapid support by anchor rod drilling machines for tunnel excavation cannot be ignored [1]. However, with the increasing complexity of the underground strata environment, the acquisition of middling coal rock mass strength information during the drilling process of the drilling rig is still mainly dependent on static rock mechanics experiments and geological exploration, which has obvious lag and cannot achieve real-time acquisition. During the drilling process, due to the complexity of rock fragmentation and the various responses of drilling rigs under different formations and working conditions, real-time adjustment of control parameters becomes particularly crucial. The current lag has caused the control parameters of the drilling rig to be unable to be adjusted based on real-time coal and rock strength during the drilling process, leading to a series of problems, including severe drill bit wear, low construction efficiency, and safety construction difficulties. Therefore, to achieve the safety, intelligence, low-cost, and high-efficiency support goals of underground drilling operations, there is an urgent need for an intelligent prediction technology for coal and rock mass strength based on drilling signals. This technology will be able to quickly and in real time identify lithology, provide accurate coal and rock strength information for support operations, guide underground drilling operations, effectively respond to the working conditions of drilling rigs in complex geological environments, and ultimately achieve safe, intelligent, low-cost, and high-efficiency support goals.
When drilling anchor rods into different formations, the drilling rig will produce various responses, and the physical and mechanical properties of different rocks make the vibration, torque, and speed of the drilling rig different [2,3,4]. Deep learning network models have been widely applied in the intelligent recognition of coal and rock masses [5]. Ding computer technology has achieved good results in predicting the uniaxial compressive strength of rocks in recent years, using methods such as regression analysis [6], artificial neural networks [7,8], fuzzy inference systems [9], etc. Ding realized the noise reduction, amplitude processing, and fault feature analysis of vibration signals using a nonconvex variable function and algorithm [10]. Yue [11] developed a parameter acquisition system for hydraulic anchor rod drilling machines in tunnels, identifying rock mechanical properties by drilling parameters. Zhang Youzhen [12] conducted drilling experiments on a drilling test bench and established a fuzzy recognition method with a clustering model to classify typical coal-bearing strata, and the final accuracy rate was 92%. Wang Jie [13] obtained the response relationship between drilling parameters and strata and used the support vector machine (SVM) classification algorithm to establish a coal rock interface recognition model based on drilling parameters, achieving automatic recognition of coal rock interfaces. Wu Shunchuan [14] integrated multiple regression models using the stacking ensemble algorithm and established a stacking ensemble model for predicting the uniaxial compressive strength of rocks based on four basic parameters of rock characteristics. The results showed that the model was feasible and reliable. Wu Luyuan [15] established a rock compressive strength prediction model based on three mainstream ensemble algorithms based on existing triaxial test data of different rocks. Bayesian optimization was used to complete hyperparameter optimization, and the generalization ability of the model was evaluated. The importance of rock characteristics was identified. Wang Sheng [16] collected vibration signals in the laboratory and established a dataset through processing, establishing an improved VGG11 convolutional neural network for the lithology intelligent prediction model. The prediction effect was improved through model training. Zhang Zhiyu [17] proposed a lightweight intelligent lithology recognition model, which achieved a good balance between lithology recognition accuracy and speed based on network training. Lei Shun [18] conducted laboratory tests on the point load strength of coal blocks, studied their distribution pattern and relationship with equivalent diameter, and combined them with previous exponential formulas to obtain the uniaxial compressive strength of fractured coal bodies. Liu Heqing [19] conducted drilling experiments on nine similar material specimens in the laboratory and constructed a GA-BP neural network prediction model for uniaxial compressive strength based on drilling vibration signals. The results showed that the research method of using drilling vibration signal perception to predict uniaxial compressive strength is feasible. Hao Jian [20] constructed a GA-BP neural network model based on indoor drilling of four types of original rock (coal) specimens, combined with Fourier transform and vibration signal denoising methods. The final model has excellent predictive ability for uniaxial compressive strength. Yue [21] used a digital drilling test system to conduct experiments on layered rocks with weak interlayers. Time-domain and frequency-domain features of borehole sound pressure and vibration signals were analyzed to identify rock characteristics in weak interlayer areas. Beáta [22] classifies rock types using the machine learning method according to the processing of vibration signals propagated in the process of experimental rotary drilling. Bai Jun [23,24] used the KNN algorithm to predict the rock identification quality of each signal source and used conditional probability and minimum risk decision theory to realize the comprehensive classification and prediction of a variety of rocks.
The above research indicates the feasibility of predicting rock mass strength based on drilling parameters. However, the direct collection of drilling data in coal mines is difficult, and the environment is harsh. Most of them are laboratory experiments and coal rock mass identification. There is relatively little literature on their application in underground engineering and the prediction of coal rock mass strength. Therefore, this article proposes an intelligent prediction of coal and rock mass strength based on the AdaBoost integrated algorithm by collecting signals from anchor rod drilling rigs, achieving efficient lithology identification and analysis, to provide a new solution for lithological intelligent prediction. At the same time, the model development method is optimized to further verify the reliability and innovation of this research result and provide a reference for real-time lithological prediction in the drilling process.

2. Drilling Data Collection

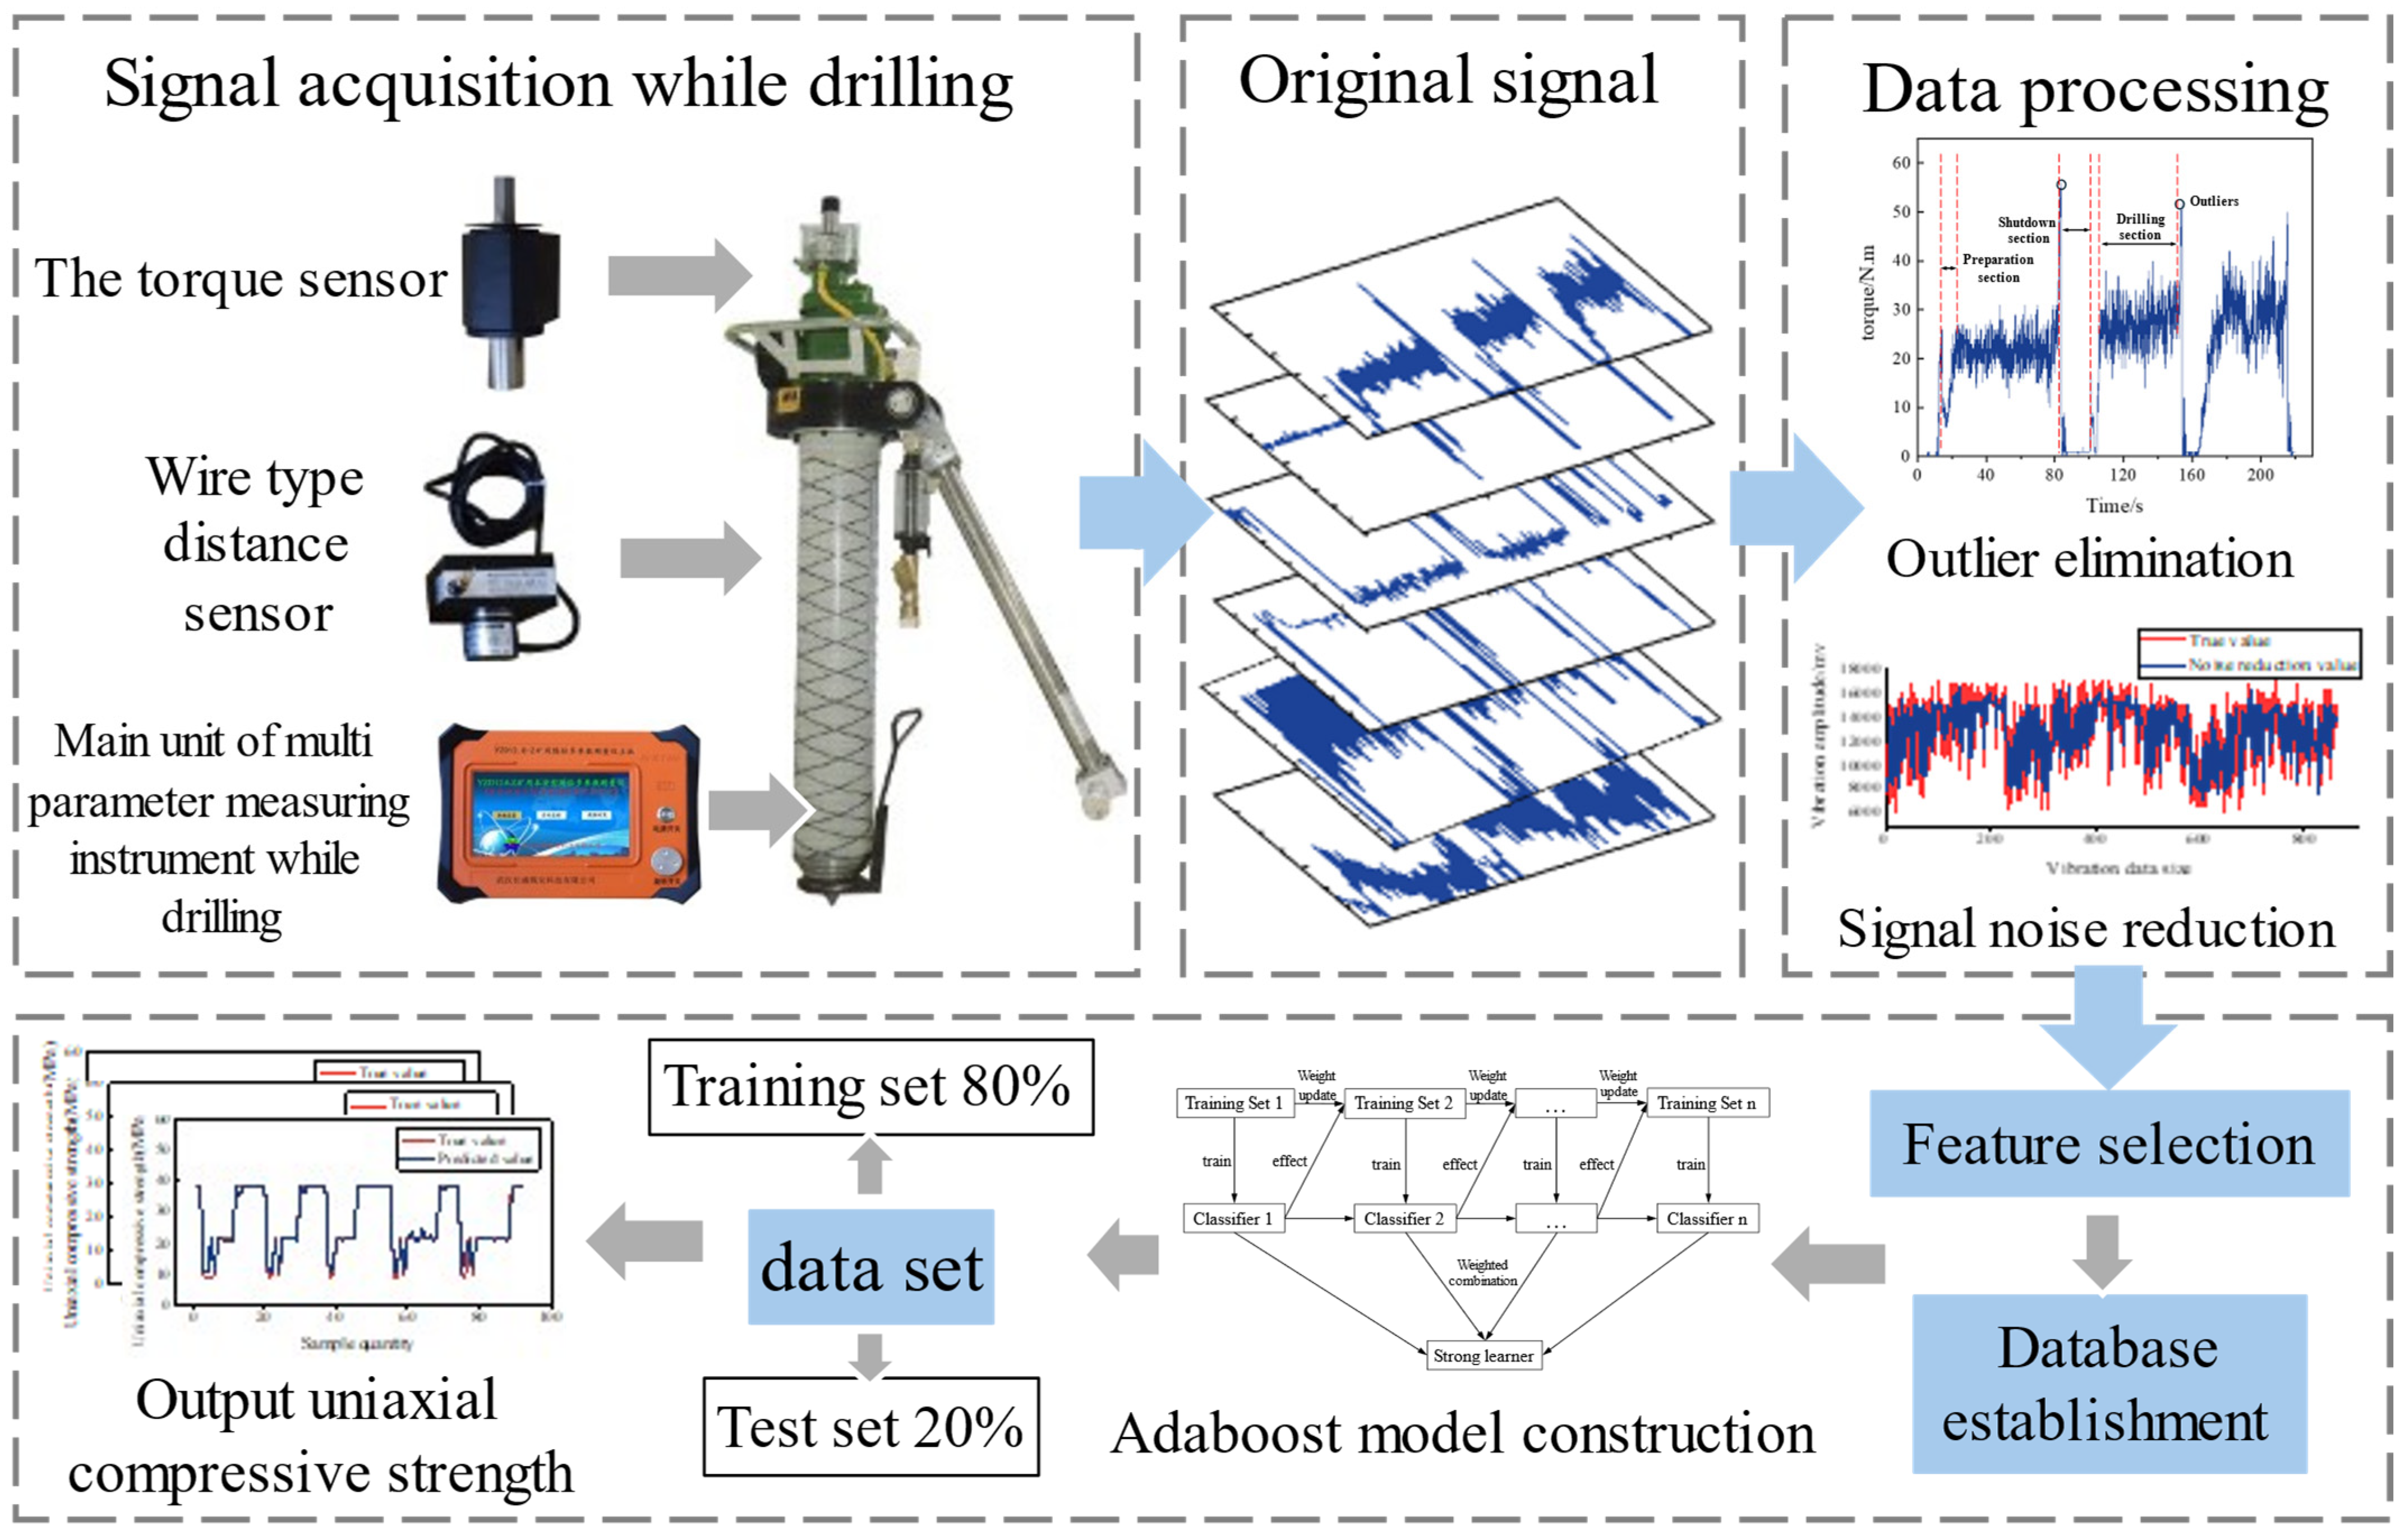
2.1. Signal Acquisition Plan While Drilling

The 112,206 return air passage of the No. 1 coal mine operated by Shaanxi Xiaobaodang Mining Co., Ltd., Yulin, China. is situated within the coal seam of the 11th panel of the second coal seam, with the 112,206 working face oriented to the west. The cross-section of the roadway is rectangular, and the support method employs a combination of anchor mesh, cable, and beam support. The lithology of the immediate roof of the 112,206 return air channel consists of siltstone, with a rock thickness ranging from 1.041 to 1.85 m and an average thickness of 1.45 m. The basic roof is composed of medium-grained sandstone, which locally transitions to coarse-grained sandstone, exhibiting a rock thickness between 18.92 and 25.9 m, with an average thickness of 22.41 m. During the tunnel excavation and support process, numerous anchor cable boreholes are constructed. The drilling process involves the interaction between the drilling tool and the rock mass. The drilling signal serves as the physical feedback from the drilling tool, and fluctuations in this signal occur in the weak areas of the surrounding rock during drilling. The dynamic characteristics of the drilling device can be used to assess the condition of the tunnel’s surrounding rock. In this study, ideal data are obtained by capturing the drilling signal, preprocessing and denoising the original data, and then performing feature selection to establish an AdaBoost model for predicting the strength of the coal and rock mass. The overall scheme is illustrated in Figure 1.
The 112,206 return air channel reinforcement support utilizes a pneumatic handheld drilling rig for anchor cable support. It is primarily designed for drilling in coal roadways and semi-coal roadways with a rock hardness of ≤f6. Additionally, it can be employed for mixing and installing resin anchor rods, as well as for drilling small-diameter hydrological, gas, or blasting holes. This drilling rig features a compact structure, lightweight design, low noise operation, simple usability, convenient maintenance, and an extended service life. The relevant parameters of the drilling rig are presented in Table 1.

2.2. Signal Acquisition Method While Drilling

2.2.1. Sensor Configuration

The multi-parameter measuring instrument for mining while drilling is an intrinsically safe, portable device specifically designed for use in coal mines. The collection equipment consists of a host unit, a torque sensor, and a wire-type distance sensor. The torque sensor integrates pressure sensors, torque sensors, angle sensors, speed sensors, and vibration sensors within its structure. Real-time measurement data display a variety of parameters, including position, footage, inclination angle, rotational speed, pressure, torque, vibration, and speed.

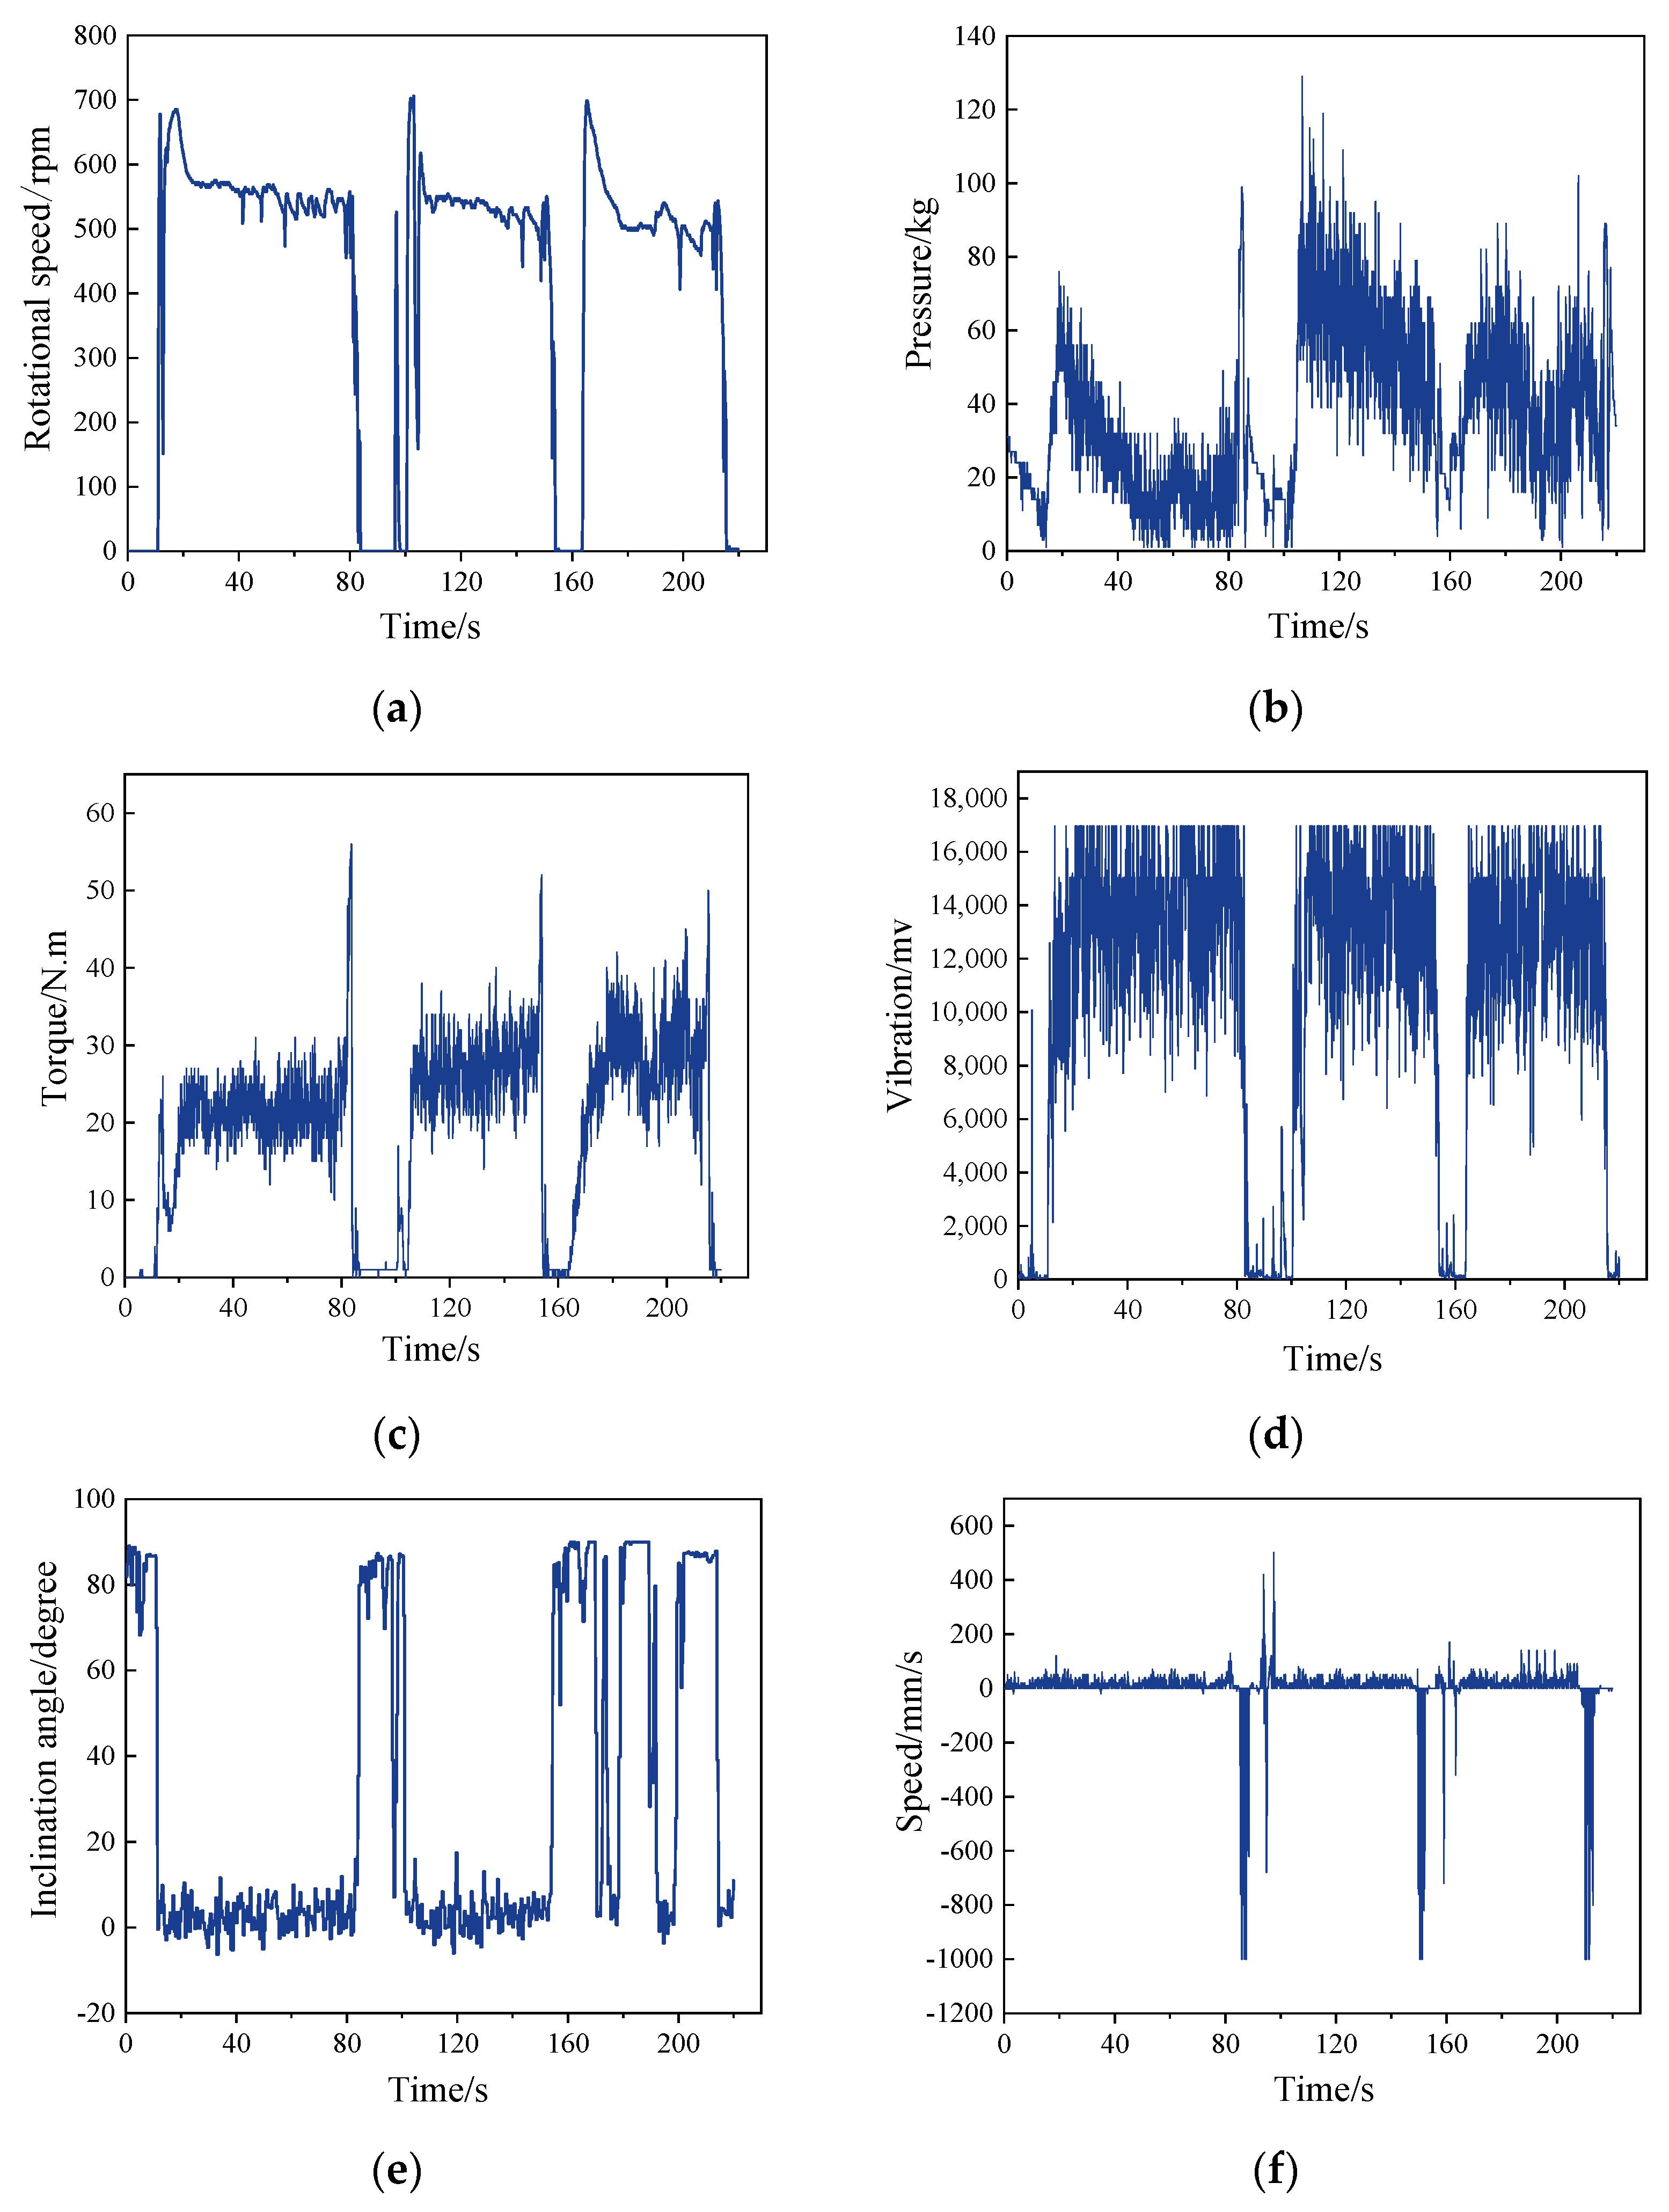
2.2.2. Signal Acquisition Process

When drilling on the roadway, the LWD tester is connected to the roof bolter for signal acquisition. The torque sensor and cable-type distance sensor are connected to the host using dedicated cables, and the real-time monitoring interface is accessed upon startup. The device will initiate real-time monitoring immediately after startup. At this point, the current inclination angle, speed, and depth will fluctuate based on the data collected by the corresponding sensors. The pressure, torque, and vibration windows will display real-time waveforms. When reviewing data, different files can be selected from the data list window. Data communication is established by connecting the device to a computer using the USB cable provided with the device. The data stored on the device can be copied to the computer and exported to the upper computer analysis software for further viewing and processing.
According to the drilling data obtained, the mine borehole imager is utilized to drill the corresponding boreholes to acquire lithological information at various depths. The peep probe is extended into the measured borehole, allowing for the movement of the probe to observe images and positions within the borehole while ensuring proper image storage. A total of 460 sets of effective data were collected during this test. Based on the geological report and borehole histogram of the Xiaobaodang No. 1 coal mine, the average value of the uniaxial compressive strength of the lithology was determined by analyzing the surrounding rock structure of the roadway roof, as presented in Table 2.

3. Signal Processing While Drilling

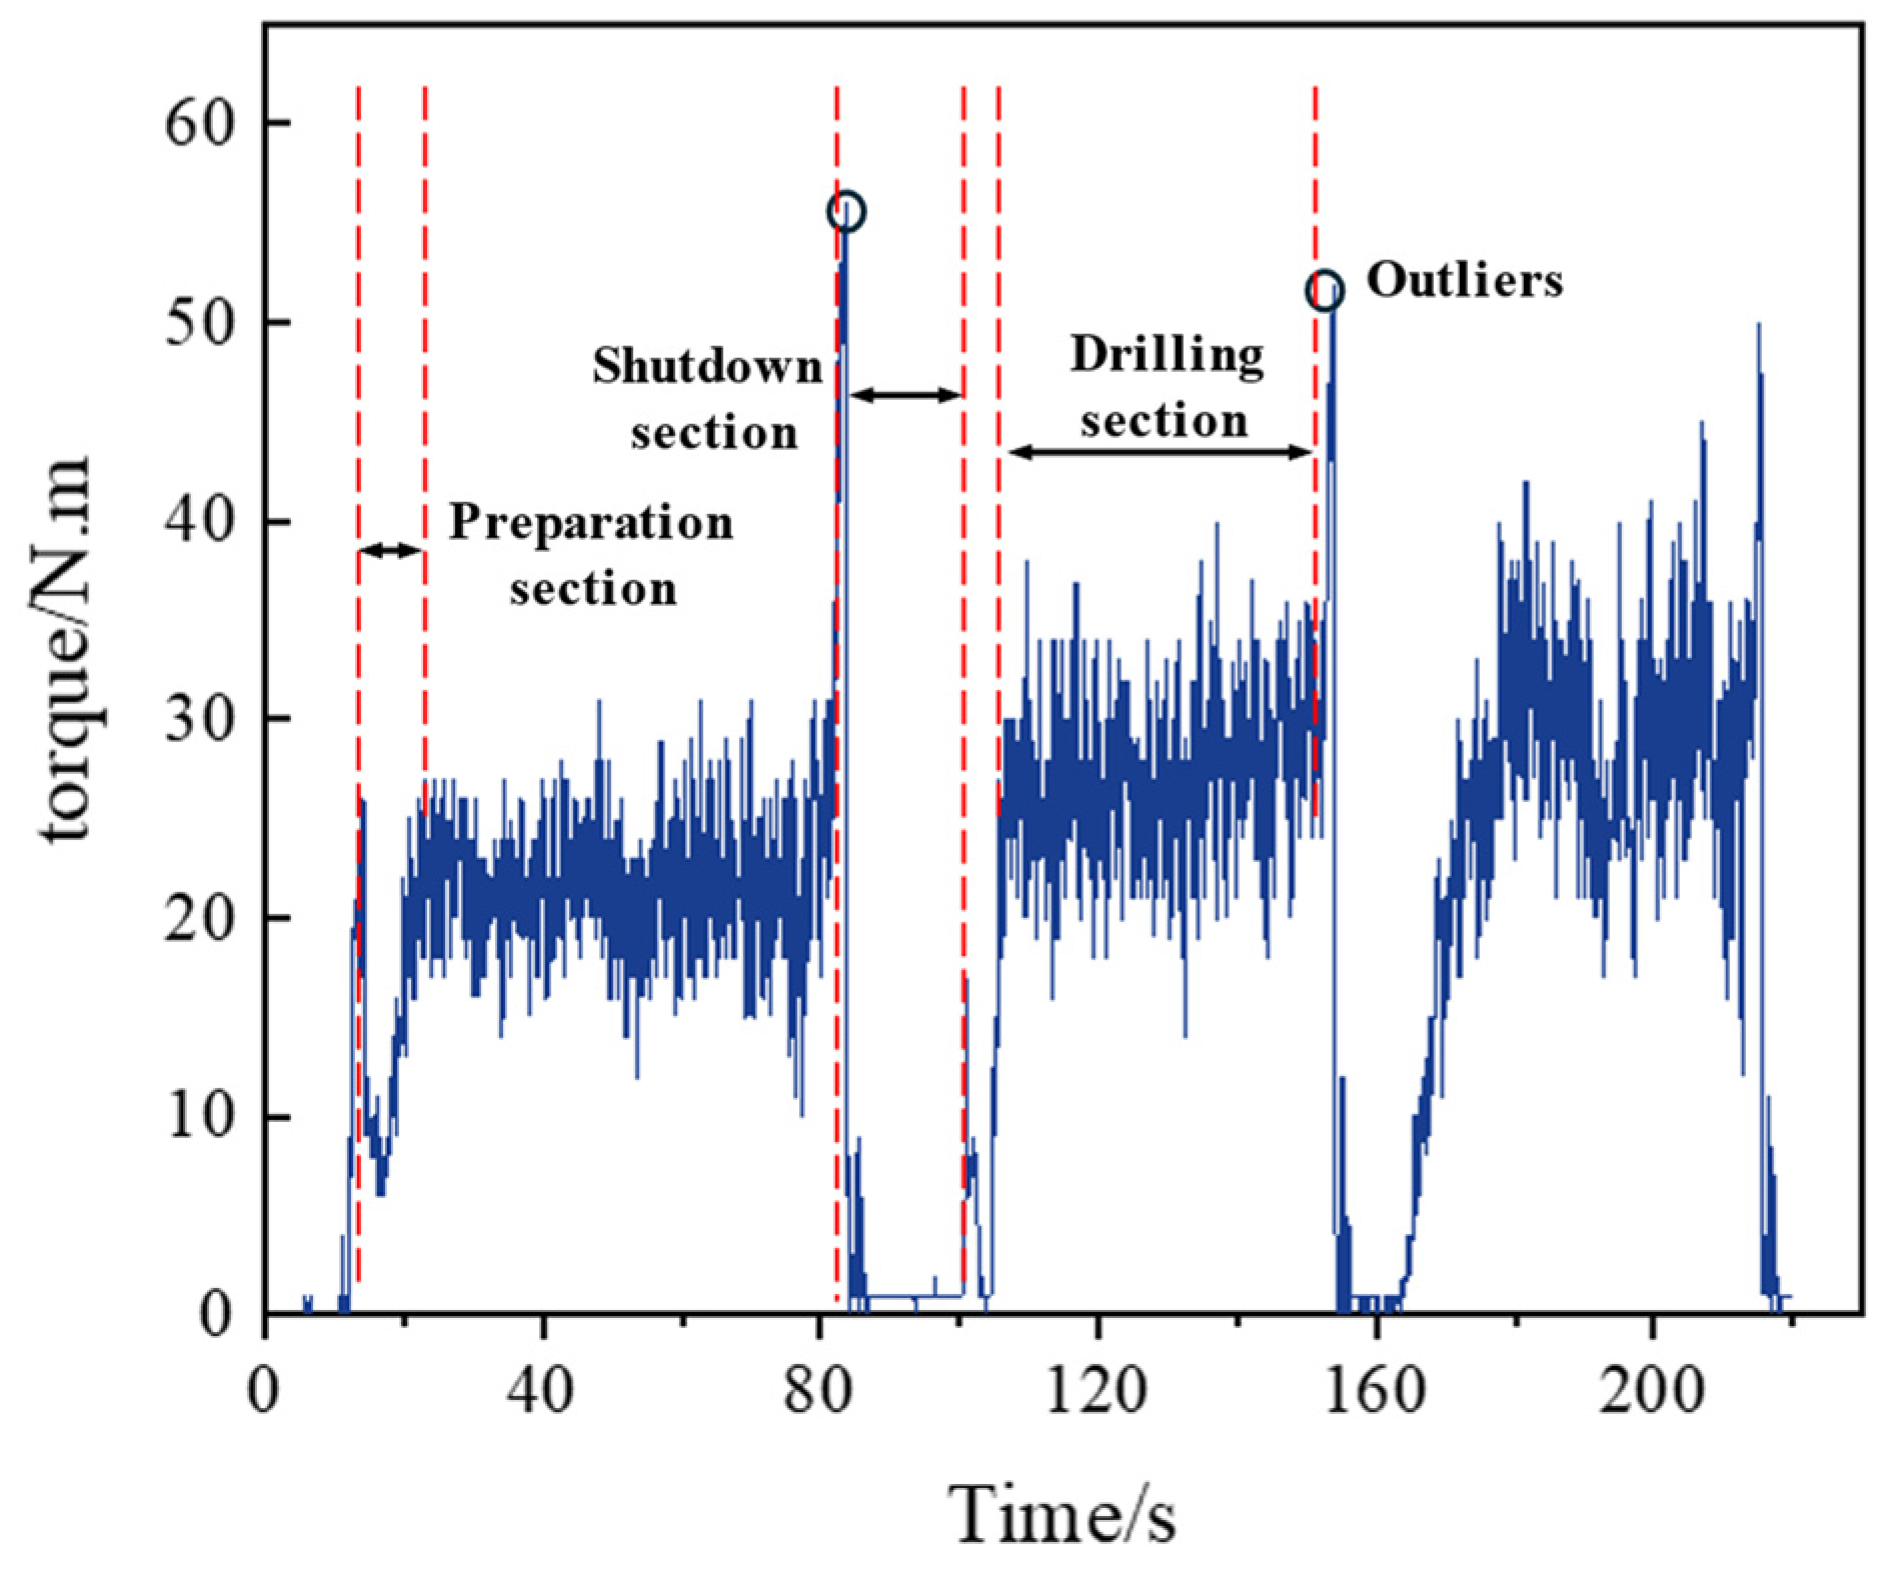
3.1. Data Preprocessing

To predict the strength of coal and rock masses based on drilling signals, it is essential to preprocess the collected raw data to extract information that effectively reflects the strength characteristics of these materials. The host device is connected to the computer using the provided USB cable, and the data are imported into the analysis software for viewing and analysis. The results of raw data collection from various drilling signals are illustrated in Figure 2.
The process of utilizing a drilling rig to create holes for anchor rod and cable support in underground coal mines can be categorized as the “rod installation, rising, drilling, lowering, and rod installation” stage, with the drilling process occurring cyclically. Based on six types of logging while drilling (LWD) signal data—namely, rotating speed, pressure, torque, vibration, dip angle, and speed—collected during field drilling, the characteristics of certain torque signals gathered in the time domain are illustrated in Figure 3. In practice, the operational process can be divided into three sections: the shutdown section, the preparation section, and the drilling section. The shutdown period refers to the cessation of drilling rig operations for rod installation and unloading. The preparation stage occurs when the drilling rig ascends to the rock surface and then descends to the bottom. The drilling section pertains to the rock-breaking process, during which the drilling rig makes contact with the rock surface through rotation and pressurization. A crucial step in establishing an intelligent prediction model for the strength of surrounding rock is analyzing the interaction data between coal and rock generated during the contact process between the drilling rig and the coal rock. Consequently, this article first eliminates data from the shutdown and preparation stages of the original dataset, retaining only the data from the drilling section.
To delete the preparation and shutdown section data within the excavation section, this article selects the drilling section data based on on-site drilling protocols for subsequent data processing and database establishment. Additionally, the drilling rig is subjected to harsh working environments and equipment failures during the drilling process, which can result in the collection of abnormal data. These anomalies do not represent true values and may interfere with and reduce the accuracy of models during subsequent training. Therefore, it is essential to remove these abnormal data points. A statistical analysis method is employed to identify these outliers. In engineering applications, the Pauta criterion is frequently utilized to distinguish abnormal data values. For a set of collected data points (X1, X2, …, Xn), abnormal values are eliminated using the Pauta criterion as follows:
Calculate the arithmetic mean for the data of each drilling section first.
X ¯ = 1 n i = 1 n x i
Then calculate the residual error v i = X i X ¯ , and calculate the root mean square deviation using the Bessel method again:
σ = v i 2 n 1
The criteria for discrimination are as follows: it is assumed that the measurement column follows a normal distribution.
| X i X ¯ | > 3 σ , Xi represents a gross error and should be discarded.
| X i X ¯ | 3 σ , Xi is normal data and should be retained.
The 3σ criterion is employed for the removal of gross errors, even though the probability of observing data with an error greater than 3σ is less than 0.003. Consequently, when the Pauta criterion, also referred to as the 3σ criterion, is applied for gross error removal, the likelihood of discarding valid data is minimal. As a result, some unreasonable outliers may still be retained.

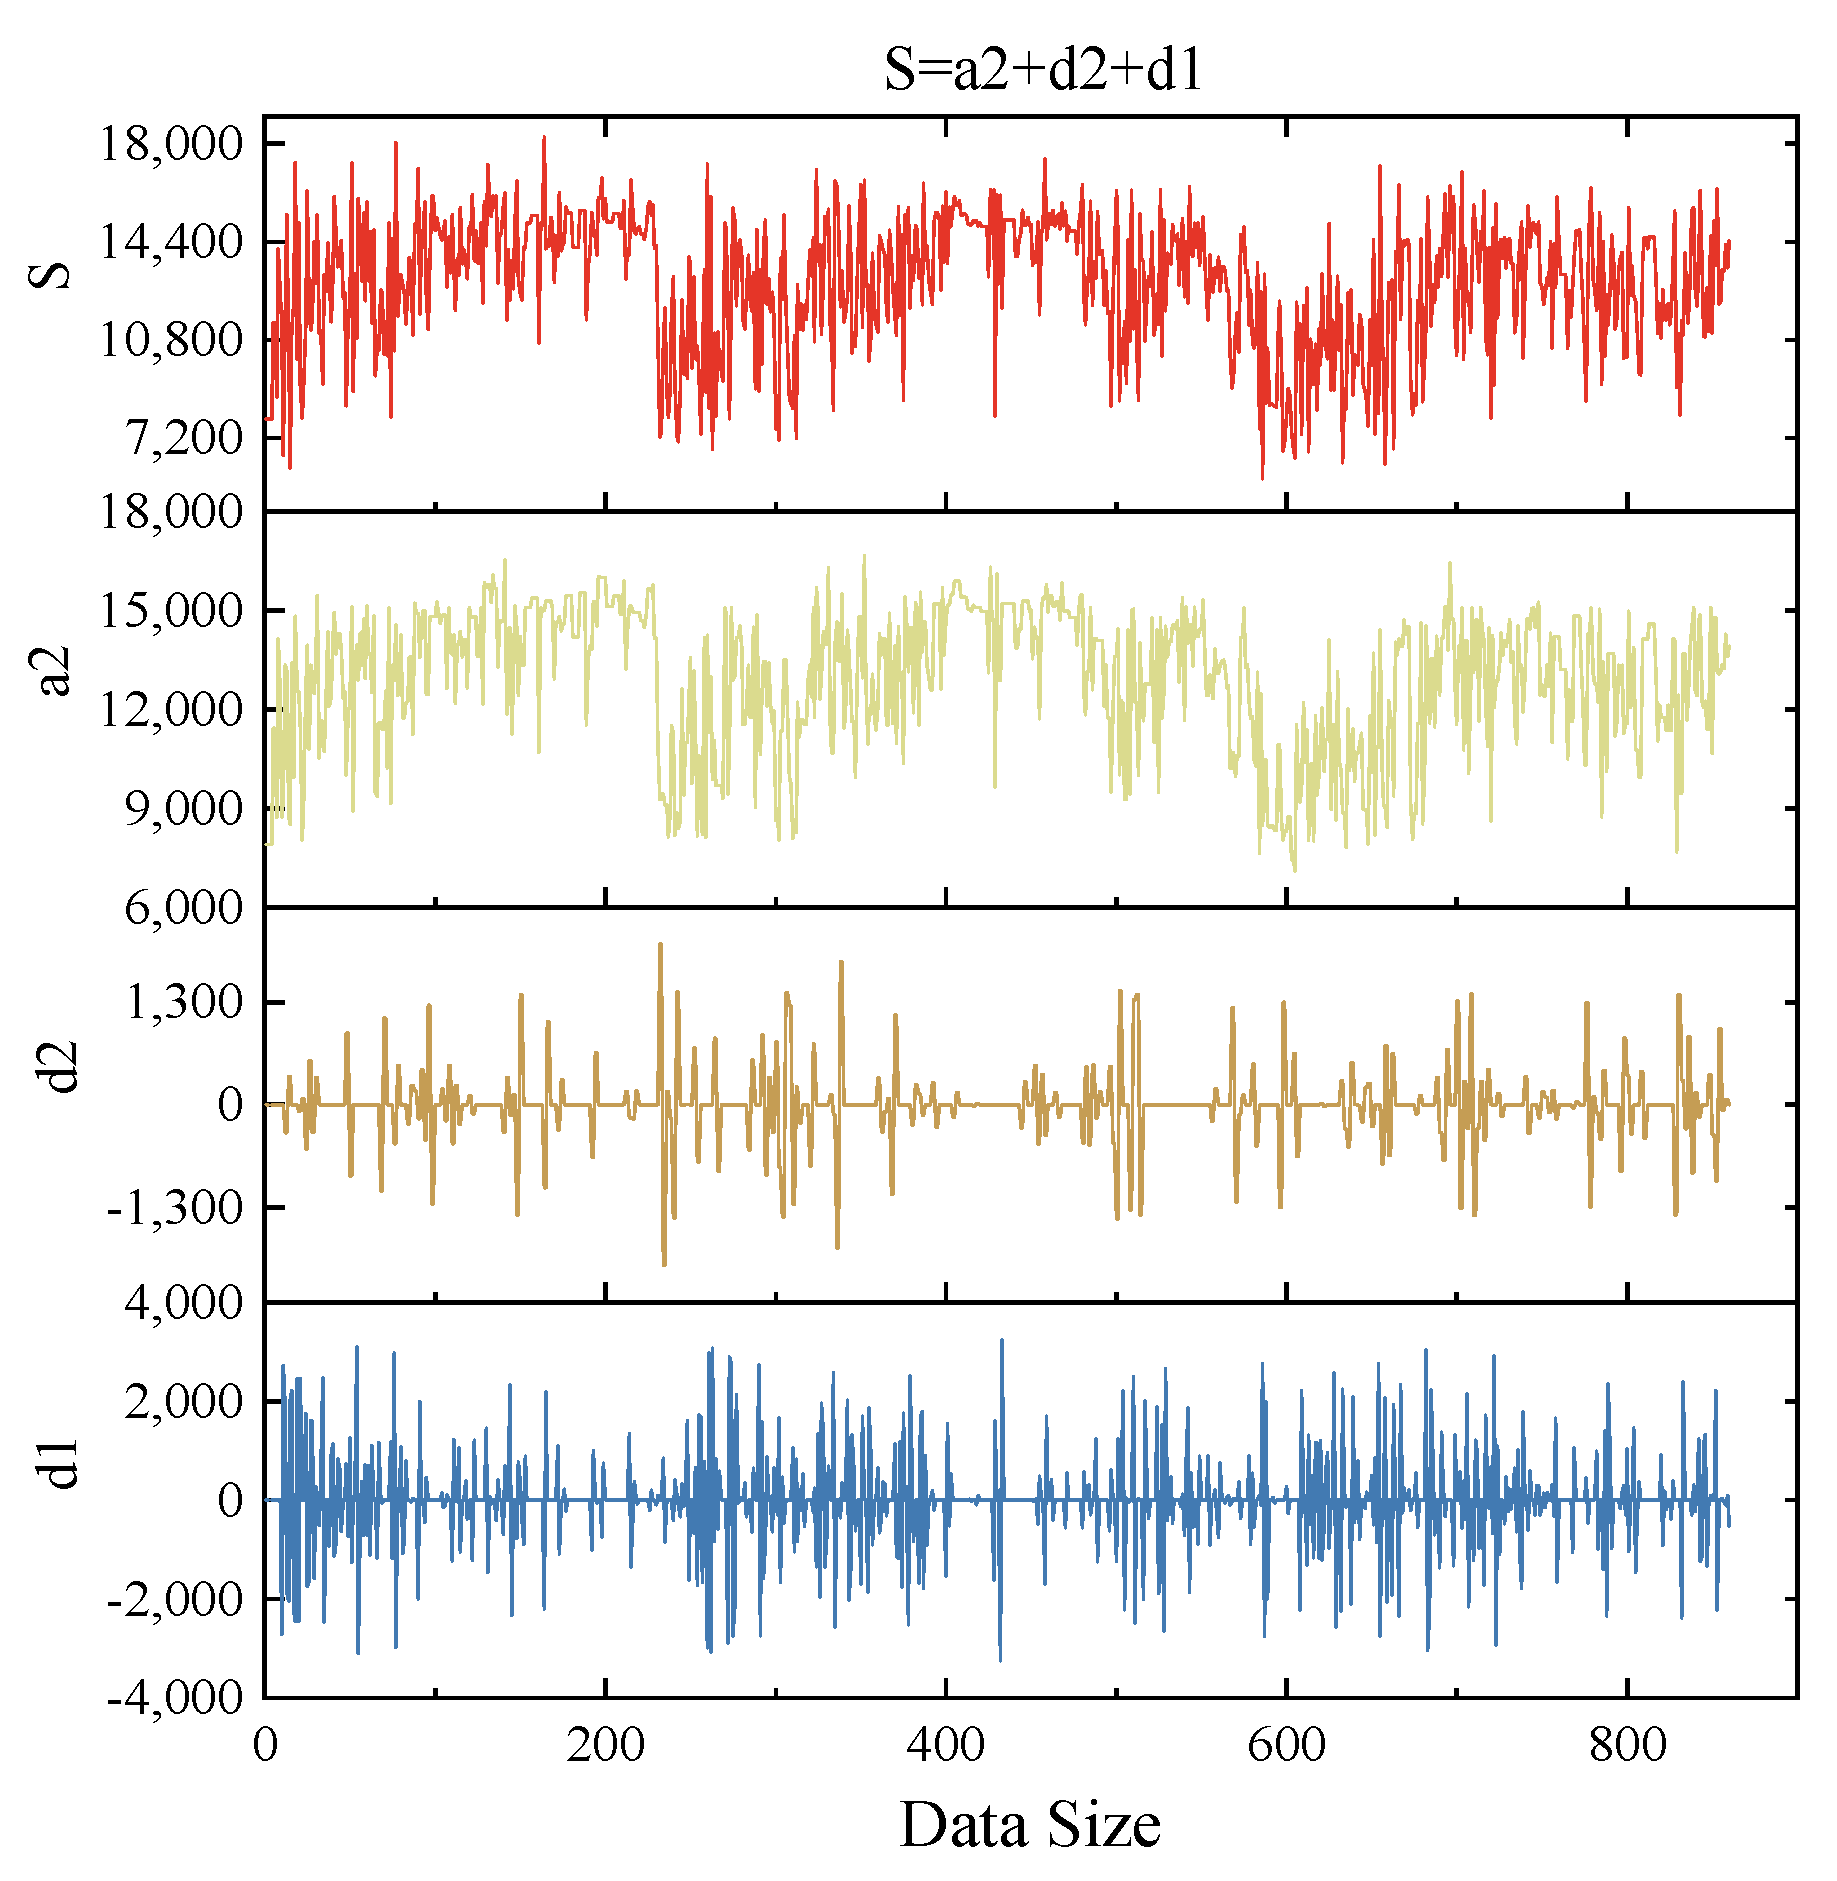
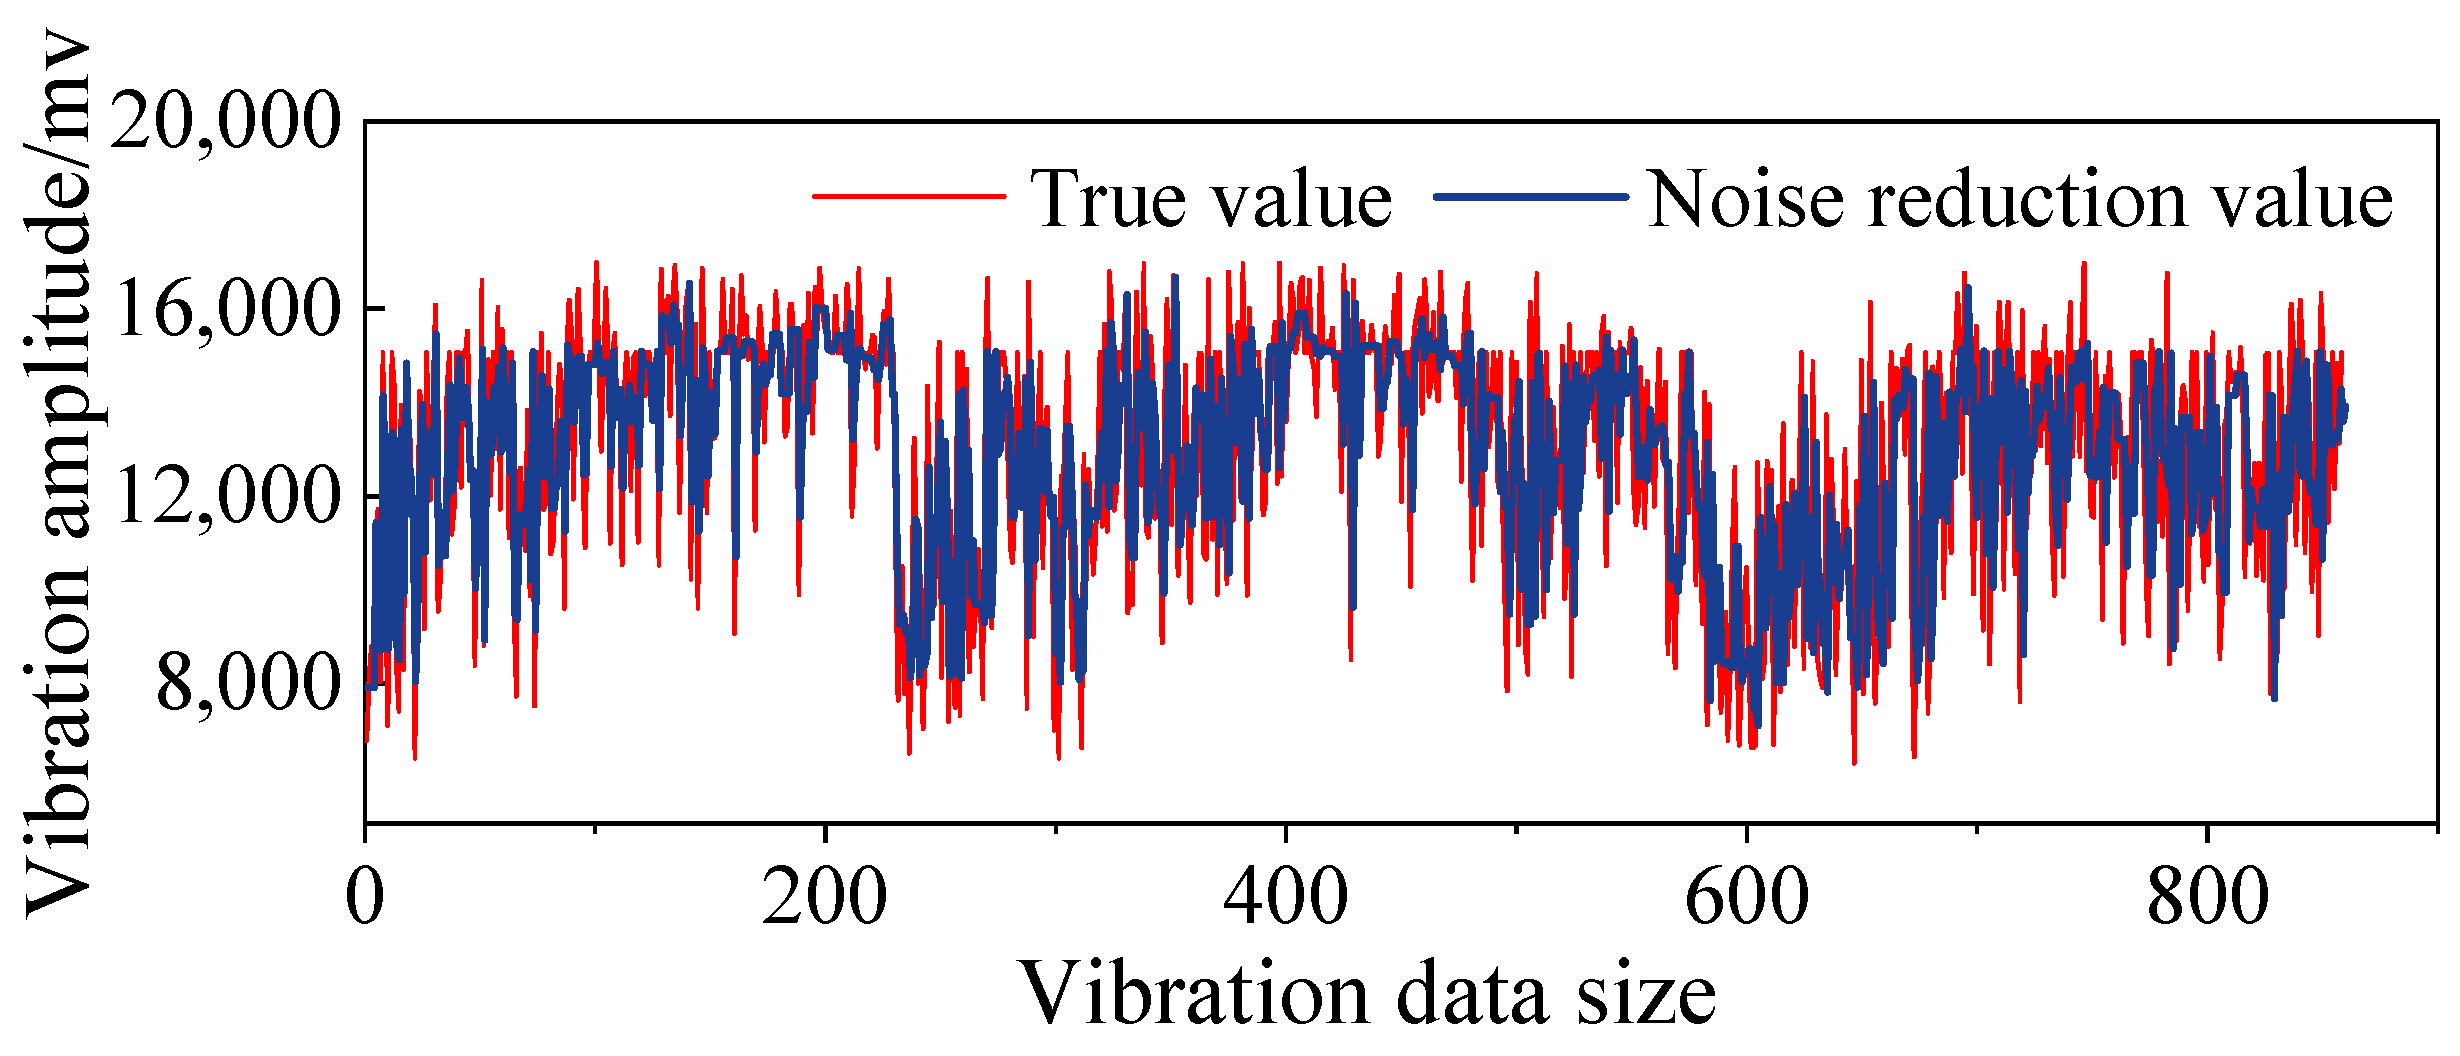
3.2. Signal Filtering and Denoising

In the drilling process, the collected signals often contain noise, which can obscure useful information and adversely affect subsequent feature extraction and model training. This section uses vibration signals as an example to discuss the principles and processes of noise reduction in these signals. The most common denoising methods for mechanical vibration signals include filters and wavelet denoising, with nonlinear wavelet transform threshold denoising being the most frequently employed technique. In this paper, the wavelet analysis toolbox in MATLAB (R2022a) is utilized to denoise the vibration signals. A noisy one-dimensional signal model can be represented in the following form:
s ( k ) = f ( k ) + ε e ( k ) , k = 0 , 1 , , n 1
Among these signals, s(k) represents a noisy signal, f(k) denotes a useful signal, and e(k) is another noisy signal. e(k) is characterized as level 1 Gaussian white noise, typically appearing as a high-frequency signal. In practical engineering applications, f(k) is generally a low-frequency signal or a relatively stable signal. Consequently, we can implement noise reduction processing as follows.
The wavelet transform filters the original time series signal using both low-pass and high-pass filters to obtain the corresponding low-frequency and high-frequency components. The low-frequency component represents the primary characteristics of the original signal, capturing its overall trend, while the high-frequency component contains the details or variations of the signal, often reflecting short-term fluctuations. Firstly, the signal s(t) is transformed by wavelet denoising. Wavelet transform decomposes the signal into wavelet coefficients with different scales and frequencies, which are expressed as follows:
s ( t ) = j = 0 J 1 k c j , k ϕ j , k ( t ) + j = 0 J 1 k d j , k ψ j , k ( t )
where cj,k are approximate coefficients, dj,k are detail coefficients, and Φj,k (T) and ψj,k (T) denote wavelet function and wavelet base, respectively.
Next, the wavelet coefficients are threshold processed. Threshold processing compares the amplitude of wavelet coefficients and determines whether to set them to zero or retain them according to the set threshold parameters. The commonly used threshold processing methods include hard threshold and soft threshold. For the hard threshold method, the threshold processing formula is as follows:
c ^ j , k = c j , k , c j , k > T 0 , c j , k T
d ^ j , k = d j , k , d j , k > T 0 , d j , k T
For the soft threshold method, the threshold processing formula is as follows:
c ^ j , k = s g n ( c j , k ) ( c j , k T ) +
d ^ j , k = s g n ( d j , k ) ( d j , k T ) +
where SGN (·) represents a symbolic function, and the positive part is represented by (s)+ = max (0, x). Finally, the denoised signal s ^ (T) is obtained by inverse wavelet transform of the processed wavelet coefficients.
s ^ ( t ) = j = 0 J 1 k c ^ j , k ϕ j , k ( t ) + j = 0 J 1 k d ^ j , k ψ j , k ( t )
The wavelet denoising of the rock vibration signal is completed by MATLAB. The original vibration signal is preprocessed as the real value of the vibration signal. According to the characteristics of the vibration signal, the decomposition layers with the best denoising effect are determined. The rock vibration signal is denoised by selecting the wavelet basis and continuously adjusting the decomposition layers and other parameters. To further optimize the noise reduction effect, the noise reduction performance of a variety of wavelet basis functions under different decomposition levels is compared, and the optimal combination of wavelet basis functions and decomposition levels is determined, which makes the noise reduction effect of the vibration signal reach the best level, effectively improves the signal quality, and provides a more reliable data basis for subsequent feature extraction and model training. Multi-level wavelet coefficient decomposition is shown in Figure 4. Following the preprocessing of the original vibration signal, the noise-reduced signal is compared and analyzed. The changes before and after noise reduction are depicted in Figure 5.

3.3. Feature Selection

To predict the strength of a coal rock mass, it is essential to first evaluate all parameters in the original data and select those that are appropriate as input features. During the contact drilling process between the drill bit and the rock mass, variations in the sensor parameters can most effectively reflect changes in the state of the rock mass.
The Pearson correlation coefficient is a statistical measure used to assess the degree of linear correlation between two variables. It is widely employed in data analysis across the social sciences, natural sciences, and various other fields. This coefficient is calculated based on the covariance and standard deviations of the two variables, and the significance of the correlation is evaluated through hypothesis testing. The range of the Pearson correlation coefficient is from −1 to 1; the greater the absolute value, the stronger the correlation. A two-tailed significance test is utilized to determine whether the statistics of a sample significantly differ from a specified parameter value. If the p-value of the statistic is less than the significance level, it is concluded that the sample statistics are significantly different from the parameter value. Many researchers have utilized the Pearson correlation coefficient and significance tests to investigate the relationships between variables. Consequently, SPSS (R26) statistical software was employed to analyze the correlation between LWD signals and uniaxial compressive strength. By applying the Pearson correlation coefficient and the two-tailed significance test, a correlation analysis table was generated, illustrating the relationship between uniaxial compressive strength and LWD signals, as presented in Table 3. The results indicated that the Sig between each variable was less than 0.05, suggesting varying degrees of correlation among different drilling signals and between drilling signals and uniaxial compressive strength. The Pearson correlation coefficient ranges from −1 to 1, with larger absolute values signifying a stronger correlation. The Pearson correlation coefficients between drilling signals and uniaxial compressive strength are as follows: torque (0.610), pressure (0.429), vibration (0.326), rotational speed (0.314), speed (0.124), and inclination angle (0.088). There is a strong correlation between torque and uniaxial compressive strength, while pressure, vibration, and rotational speed exhibit moderate correlations with uniaxial compressive strength. In contrast, speed and inclination angle show weak correlations with uniaxial compressive strength. Therefore, torque (T), pressure (F), vibration (A), and speed (N) are considered as input characteristics.
During the drilling process, the data obtained from the sensors primarily focus on the average value and fluctuation amplitude. Consequently, the mean value (Fm, Tm, Am, Nm), standard deviation (Fn, Tn, An, Nn), and peak-to-peak value (Fs, Ts, As, Ns) of the drilling section data processed by the drilling rig are selected as the model’s input parameters. The final input parameters consist of the aforementioned 12 eigenvalues.
Using data processing methods, four drilling state parameters (pressure F, torque T, vibration A, and rotational speed N) and one geomechanical property of the rock mass (uniaxial compressive strength) of the drilling rig were processed to create a rock-machine interaction database. This database includes mean, standard deviation, and peak-to-peak values. A total of 460 datasets were collected, providing a solid foundation for the subsequent learning and validation of algorithmic models.

4. A Coal Rock Strength Prediction Model Based on the AdaBoost Ensemble Method

4.1. Model Structure and Prediction Process

This article utilizes twelve characteristic values of drilling signals in the time domain as inputs and uniaxial compressive strength as the output to develop a coal rock strength prediction model based on the AdaBoost ensemble algorithm.

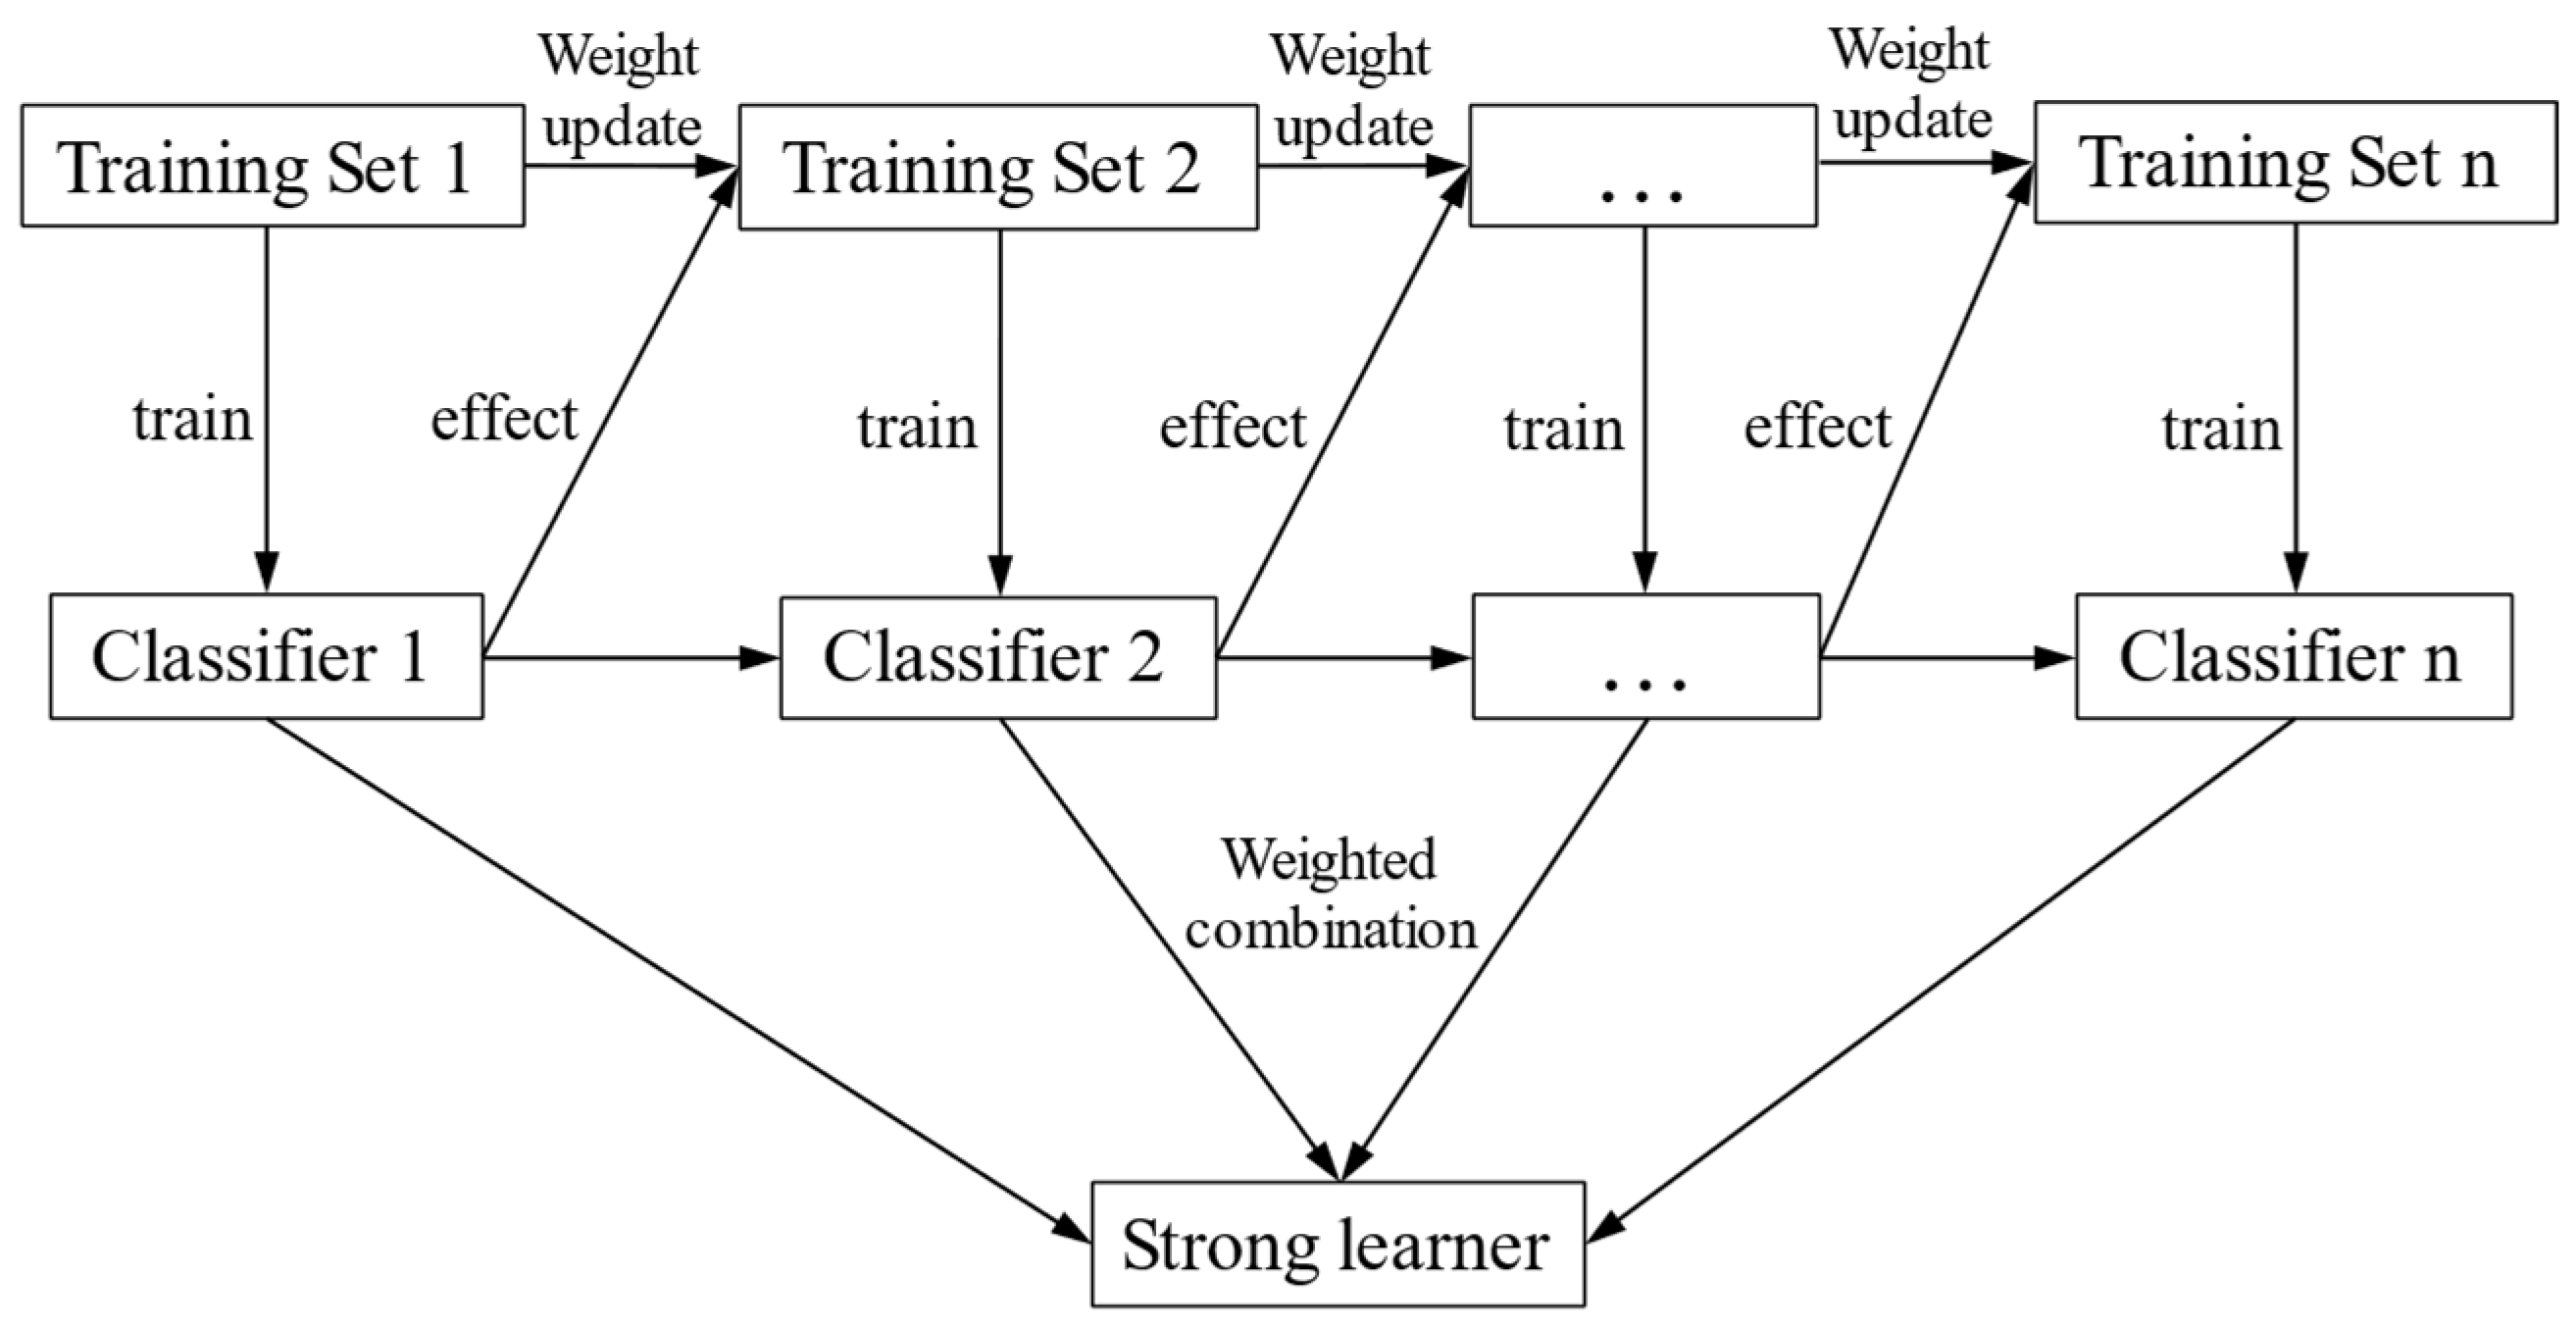
4.1.1. Principles and Basic Ideas

The AdaBoost algorithm is a widely used ensemble learning technique that combines multiple weak classifiers to create a strong classifier. In each training iteration, the weights of the samples that were misclassified by the previous classifier are increased. These updated sample weights are then utilized to train the next classifier. During each iteration, the entire sample set is used to train a new classifier, and both the sample weights and the importance weights of the classifier are updated. This process continues until either the predetermined error rate is achieved or the maximum number of iterations is reached.
Algorithm principle: (1) Initialize the weight distribution of the training data: for N samples, the initial weight of each sample is uniform and set at 1/N. (2) Train a weak classifier: If a sample is correctly classified, its weight will decrease when constructing the next training set; conversely, if a sample is misclassified, its weight will increase. Simultaneously, obtain the corresponding weight for the weak classifier. Secondly, use the updated sample set to continue training the subsequent classifier, and this iterative process continues throughout the training phase. (3) Combining weak classifiers to form strong classifiers: After the training of all weak classifiers is completed, those with lower error rates are assigned significant importance weights and play a crucial role in the final classification function. Conversely, weak classifiers with higher error rates receive smaller importance weights and contribute less to the final classification function. In other words, weak classifiers with low error rates comprise a larger proportion of the final classifier, while those with high error rates constitute a smaller proportion. The framework of the AdaBoost algorithm is illustrated in Figure 6.

4.1.2. Base Learner

Given the training dataset (X1, Y1), …,(XN, YN), where Yi ∈ {−1, 1} represents the class labels of the training samples for i = 1, …, N, do the following:
(1) First, initialize the weight distribution for the training data. Each training sample is assigned the same initial weight: wi = 1/N. Therefore, the initial weight distribution of the training sample set D1(i) is as follows:
D 1 ( i ) = ( w 1 , w 2 , w N ) = ( 1 N , , 1 N )
(2) Perform iterations for t = 1, 2, …, T.
a. Select a weak classifier h with the lowest current error rate as the t basic classifier Ht, and calculate the weak classifier ht:X→{−1, 1}. The error of this weak classifier on the distribution Dt is as follows:
e t = P ( H t ( x i ) y i ) = i = 1 N w t i I ( H t ( x i ) y i )
b. Calculate the weight of the weak classifier in the final classifier, denoted by alpha (α).
α t = 1 2 ln 1 e t e t
c. Update the weight distribution Dt+1 of the training samples:
D t + 1 = D t i exp α t y i H t x i Z t
where Zt is the normalization constant: Z t = 2 e t ( 1 e t )
(3) Finally, combine the weak classifiers based on their weights, denoted as α.
f ( x ) = t = 1 T α t H t ( x )
By utilizing the sign function, the weak classifier’s sign information is obtained, which contributes to the formation of a strong classifier:
H f i n a l = s i g n f ( x ) = s i g n ( t = 1 T α t H t ( x ) )

4.2. Model Evaluation Indicators

To evaluate the performance and effectiveness of the prediction model, this article employs four evaluation metrics: the coefficient of determination (R2), mean absolute error (MAE), mean absolute percentage error (MAPE), and root mean square error (RMSE). These metrics serve as the criteria for evaluating model performance. The formulas for calculating these evaluation indicators are as follows:
The determinable coefficient explains the ratio of the sum of squared deviations of the predicted values to the sum of squared deviations of the observed values, reflecting the degree of fit of the model.
R 2 = i = 1 n ( y ^ i y ¯ ) 2 i = 1 n ( y i y ¯ ) 2
The average absolute error represents the meaning of the absolute differences between predicted and observed values.
M A E = 1 n i = 1 n | y ^ i y i |
The average absolute percentage error represents the mean percentage error between predicted and actual values.
M A P E = 1 n i = 1 n y ^ i y i y ^ i
The root mean square error measures the deviation between predicted values and actual values, and it is sensitive to outliers in the data.
R M S E = 1 n i = 1 n ( y ^ i y i ) 2
In the formula, y ^ i represents the actual compressive strength value of the i-th lithology (where i = 1, 2, 3, …, n); y i represents the predicted compressive strength value for the i-th lithology (where i = 1, 2, 3, …, n); and n denotes the total number of samples.
Compared to RMSE, MAE emphasizes the average magnitude of model prediction errors rather than the sum of squared errors, making it more robust in handling outliers.

4.3. Model Training

A total of 460 samples were collected from on-site tests, which included measurements of pressure, torque, vibration, and rotational speed. Of these, 368 samples (80%) were randomly selected to form the training set, while the remaining 92 samples (20%) were designated as the testing set.
The common base learners in the AdaBoost algorithm are as follows: ① Decision tree base learners: the most frequently used weak learners, which rely on the judgment of a single feature. ② Naive Bayes base learner: a straightforward classifier based on probability, suitable for tasks such as text classification. ③ K-nearest neighbor (KNN) learning algorithm: it classifies data based on the distance between data points, although it requires significant computational resources. ④ Support vector machine (SVM)-based learners: robust classifiers that can also be employed to create weak learners. ⑤ Linear regression base learner: appropriate for regression problems and binary classification tasks. To better understand the performance of base learners, the performances of different base learners under different dataset sizes and feature combinations are analyzed in detail. Through experiments, it is found that the SVM-based learning machine has better adaptability in dealing with complex nonlinear relationships, the decision tree-based learning machine is more intuitive in the division of data, and the linear regression-based learning machine has certain advantages in dealing with linear relationships, but its adaptability is relatively weak for complex coal and rock mass strength prediction scenarios. In this paper, we predict the uniaxial compressive strength based on the characteristics of LWD signals using decision tree-based learning, SVM-based learning, and linear regression-based learning within the AdaBoost integrated model.
Machine learning models contain many hyperparameters, and different combinations of hyperparameters have a great impact on the operation efficiency and generalization performance of the model. Therefore, to obtain a model with good operation efficiency and generalization performance, it is necessary to optimize the hyperparameters. Grid search is a commonly used hyperparameter optimization method. It determines a set of optimal values as the final hyperparameter group of the model by traversing all points on the grid in the hyperparameter space within a given hyperparameter range. In this paper, the grid search method is used to optimize the hyperparameters of the model. The learning rate is used to control the weight update speed of weak classifiers in each iteration. The smaller the learning rate, the slower the learning speed of the model, but it may be more stable. The higher the learning rate, the faster the model’s learning speed, but it may be easier to overfit. Several estimators are used to control the number of weak classifiers in the AdaBoost model. The more the number, the higher the complexity of the model, but the higher the computational cost.
Cross-validation evaluates the performance of each combination by adjusting the combination of different learning rates (from 0.01 to 1.0) and the number of estimators (from 10 to 100). The cross-validation method is used to test the performance of different parameter combinations on the validation set. Finally, the combination with the learning rate of 0.1 and the number of estimators of 50 is selected, which effectively avoids the overfitting problem of the model, improves the generalization ability of the model, and makes the model achieve the best prediction effect.

5. Results and Discussion

5.1. Analysis of Experimental Results

The comparison between the predicted results and the actual values of the load strength of surrounding rock points from 92 test samples, utilizing the class 3 base learners of the AdaBoost ensemble model, is illustrated in Figure 7.
To comprehensively evaluate the performance of the model, the determination coefficient (R2), mean absolute error (MAE), root mean square error (RMSE), and mean absolute percentage error (MAPE) were calculated, and the results are presented in Table 4. By analyzing the data presented in the table, it is evident that the SVM-based learning model developed in this paper outperforms all other models across various indicators. The R2 value of the SVM-based learning model on the test set is the highest at 0.972. This represents a significant improvement compared to the R2 values of the other two models, indicating that the SVM model exhibits a high degree of fit to the data and effectively explaining the variation within it. In contrast, the linear regression-based learning model has the lowest coefficient of determination, suggesting a poor fit. The mean absolute error (MAE) ranges from 1.7 to 9.8 MPa, the root mean square error (RMSE) ranges from 1.9 to 16.5 MPa, and the mean absolute percentage error (MAPE) ranges from 8.1% to 55.7%. Furthermore, the SVM-based ensemble model demonstrates the lowest values in the RMSE, MAE, and MAPE metrics, which are 1.717 MPa, 1.940 MPa, and 8.145%, respectively. This indicates a minimal deviation between the predicted results and the actual values, further substantiating the model’s superior predictive accuracy. When the R2 value of the model approaches 1, it signifies that the model possesses strong explanatory power for the observed data. Additionally, small values of MAE, RMSE, and MAPE indicate that the model demonstrates good predictive ability. This suggests that the model proposed in this article achieves higher prediction accuracy. By employing an SVM-based ensemble learning model to predict the uniaxial compressive strength of the surrounding rock during the coal mine support process, a more effective feedback relationship model can be established. This model characterizes the interaction between the rock and the support system in the tunnel, providing a foundation for adjusting tunnel support parameters.
From the analysis presented in the figure, it is evident that various models exhibit strong fitting capabilities for predicting the uniaxial compressive strength of coal and rock masses. Among these, the SVM model demonstrates the most effective predictive performance. The prediction results from this model show minimal errors compared to the true values for the vast majority of test samples, with only a few individual samples exhibiting discrepancies. Following closely is the decision tree model, which also yields prediction results that are relatively near the true values; however, it displays significant deviations in some cases. In contrast, the linear model performs the poorest, showing a substantial difference between the predicted results and the actual values. This indicates that the linear model possesses limited predictive capability for the uniaxial compressive strength of coal and rock masses.
To further verify the advantages of the AdaBoost SVM model, we compared it with other advanced models, including the convolutional neural network (CNN) model based on deep learning, the LSTM model, and the random forest (RF) model based on traditional machine learning. The determination coefficients R2, RMSE, Mae, and MAPE of the three prediction models are shown in Figure 8. It can be found that the R2 value of the AdaBoost SVM model is 0.972, which is significantly higher than 0.917 of the CNN model, 0.725 of the LSTM model, and 0.811 of the RF model, with the highest accuracy. At the same time, the RMSE, Mae, and MAPE of the CNN model are 2.184, 2.866, and 10.580%, respectively. Compared with the CNN model, the AdaBoost SVM model has a smaller deviation between the predicted results and the actual values and has the best robustness. Compared with the LSTM model and the RF model, the CNN model has higher robustness. These comparison results further prove that the AdaBoost SVM model has higher accuracy and stability and is effective and advanced in the task of coal and rock mass strength prediction.
At the same time, the reasons for the differences are analyzed. Although the LSTM model has advantages in processing time series data, it is not accurate enough in fitting the complex nonlinear relationship of signals while drilling; the CNN model has its characteristics in feature processing and model complexity control, but it fails to give full play to its advantages under the specific data and scenarios of this study. The RF model has a high tolerance for outliers and missing values, but it has high requirements for super parameter setting and may still have an overfitting phenomenon. The AdaBoost model in this paper combines the processing ability of an SVM-based learning device for complex data, which is more suitable for the strength prediction task of the signal while drilling in the coal mine.

5.2. Result Comparison and Discussion

The predicted results do not directly provide the uniaxial compressive strength for various rock types; therefore, it is necessary to reclassify them to determine the uniaxial compressive strength of different rock types. The classification of the predicted uniaxial compressive strength values is presented in Table 5. Based on a comparison between the predicted results and the actual drilling data, the five drilling holes were designated as Drilling Hole 1, Drilling Hole 2, Drilling Hole 3, Drilling Hole 4, and Drilling Hole 5. The depths of these drilling holes ranged from 7.9 m to 8.1 m. Figure 9 illustrates the comparison between the actual values and the predicted results from the three types of models.
The SVM predictions for drilling holes 1–5 are accurate, except for a coal prediction error of 0.52 m in drilling hole 5. The prediction results for the three types of lithology using the linear model from drill hole 1 are all incorrect, yielding a total accuracy of 83%, while all tree model predictions are correct. In borehole 2, there are errors of 0.5 m for siltstone and 0.51 m for medium-grained sandstone in the tree model, whereas the linear model exhibits errors in predicting the three types of lithology, with accuracy rates of 82% and 76%, respectively. Most predictions from the pore model for drill hole 3 classify siltstone and medium-grained sandstone as different types. The tree model predicts 0.83 m of siltstone as coal, while the linear model predicts 0.47 m as medium-grained sandstone. In drilling hole 4, the tree model only incorrectly predicted 0.64 m of siltstone and medium sandstone, achieving an accuracy of 95%, while the linear model made multiple errors, resulting in an accuracy of only 58%. For drilling hole 5, both model types correctly identified medium sandstone, but errors were present in the predictions for coal and siltstone, with accuracy rates of 78% and 83%, respectively.
The prediction accuracies of the SVM model for three types of lithology—coal, siltstone, and medium sandstone—are 0.94, 1.00, and 1.00, respectively. The prediction accuracies of the tree and linear models are illustrated in Figure 10. The average accuracies of the tree model for the three types of lithology are 0.86, 0.78, and 0.94. In contrast, the average accuracies of the linear model for the same lithologies are 0.50, 0.80, and 0.81. Among the three models, the highest prediction accuracy is observed for medium-grained sandstone. The SVM and linear models demonstrate greater accuracy in predicting sandstone compared to coal, while the tree model exhibits a higher prediction rate for coal.
Although the SVM model performs well on the whole, there are still some prediction errors in individual samples. Through the analysis of these error samples, it is found that they are mainly concentrated in the lithological transition area, such as the junction of coal and siltstone. This may be due to the complex changes of rock mechanical properties in these areas, and the characteristics of signals while drilling are not obvious enough, resulting in the deviation of the model in prediction. In future research, we will further optimize feature selection and model structure to improve the prediction accuracy of the model in these complex regions.
The coal and rock mass strength prediction model based on AdaBoost SVM proposed in this study has broad application prospects in coal mines. Through the real-time monitoring of drilling signals and the prediction of coal and rock mass strength, it can provide a scientific basis for the optimization of drilling parameters, the classification of roadway roof stability, and the design of support schemes, to improve the efficiency and safety of roadway excavation. However, there are still some challenges in practical application, such as the complexity of the mine environment, the stability of data acquisition, and the real-time performance of the model. In the future, I will combine more mine data, optimize data acquisition equipment and processes, further explore and mine more features that may affect the strength of rock mass, and further verify and optimize the performance of the model. An additional focus will be to provide accurate rock mass strength information for the design of the support scheme to optimize the support parameters and improve the support effect.

6. Conclusions

This paper proposes an intelligent prediction method for coal and rock mass strength based on the integration of bolt drill drilling signals and the AdaBoost algorithm. This method enables the prediction of intermediate coal and rock mass strength during the support process. The following conclusions were drawn from this study:
(1)
This article collected data on the on-site reinforcement and support of tunnels and obtained the original operating status data of anchor rod drilling machines, providing a reliable data source for analysis and model training.
(2)
Using the Pauta criterion to eliminate invalid and abnormal data from the original dataset, we analyzed the relationship between the strength of the surrounding rock and the drilling data from the anchor drilling rig. Ultimately, the model was established to utilize the mean, standard deviation, and peak-to-peak values of pressure (F), torque (T), vibration (A), and rotational speed (N) in the drilling section as input features.
(3)
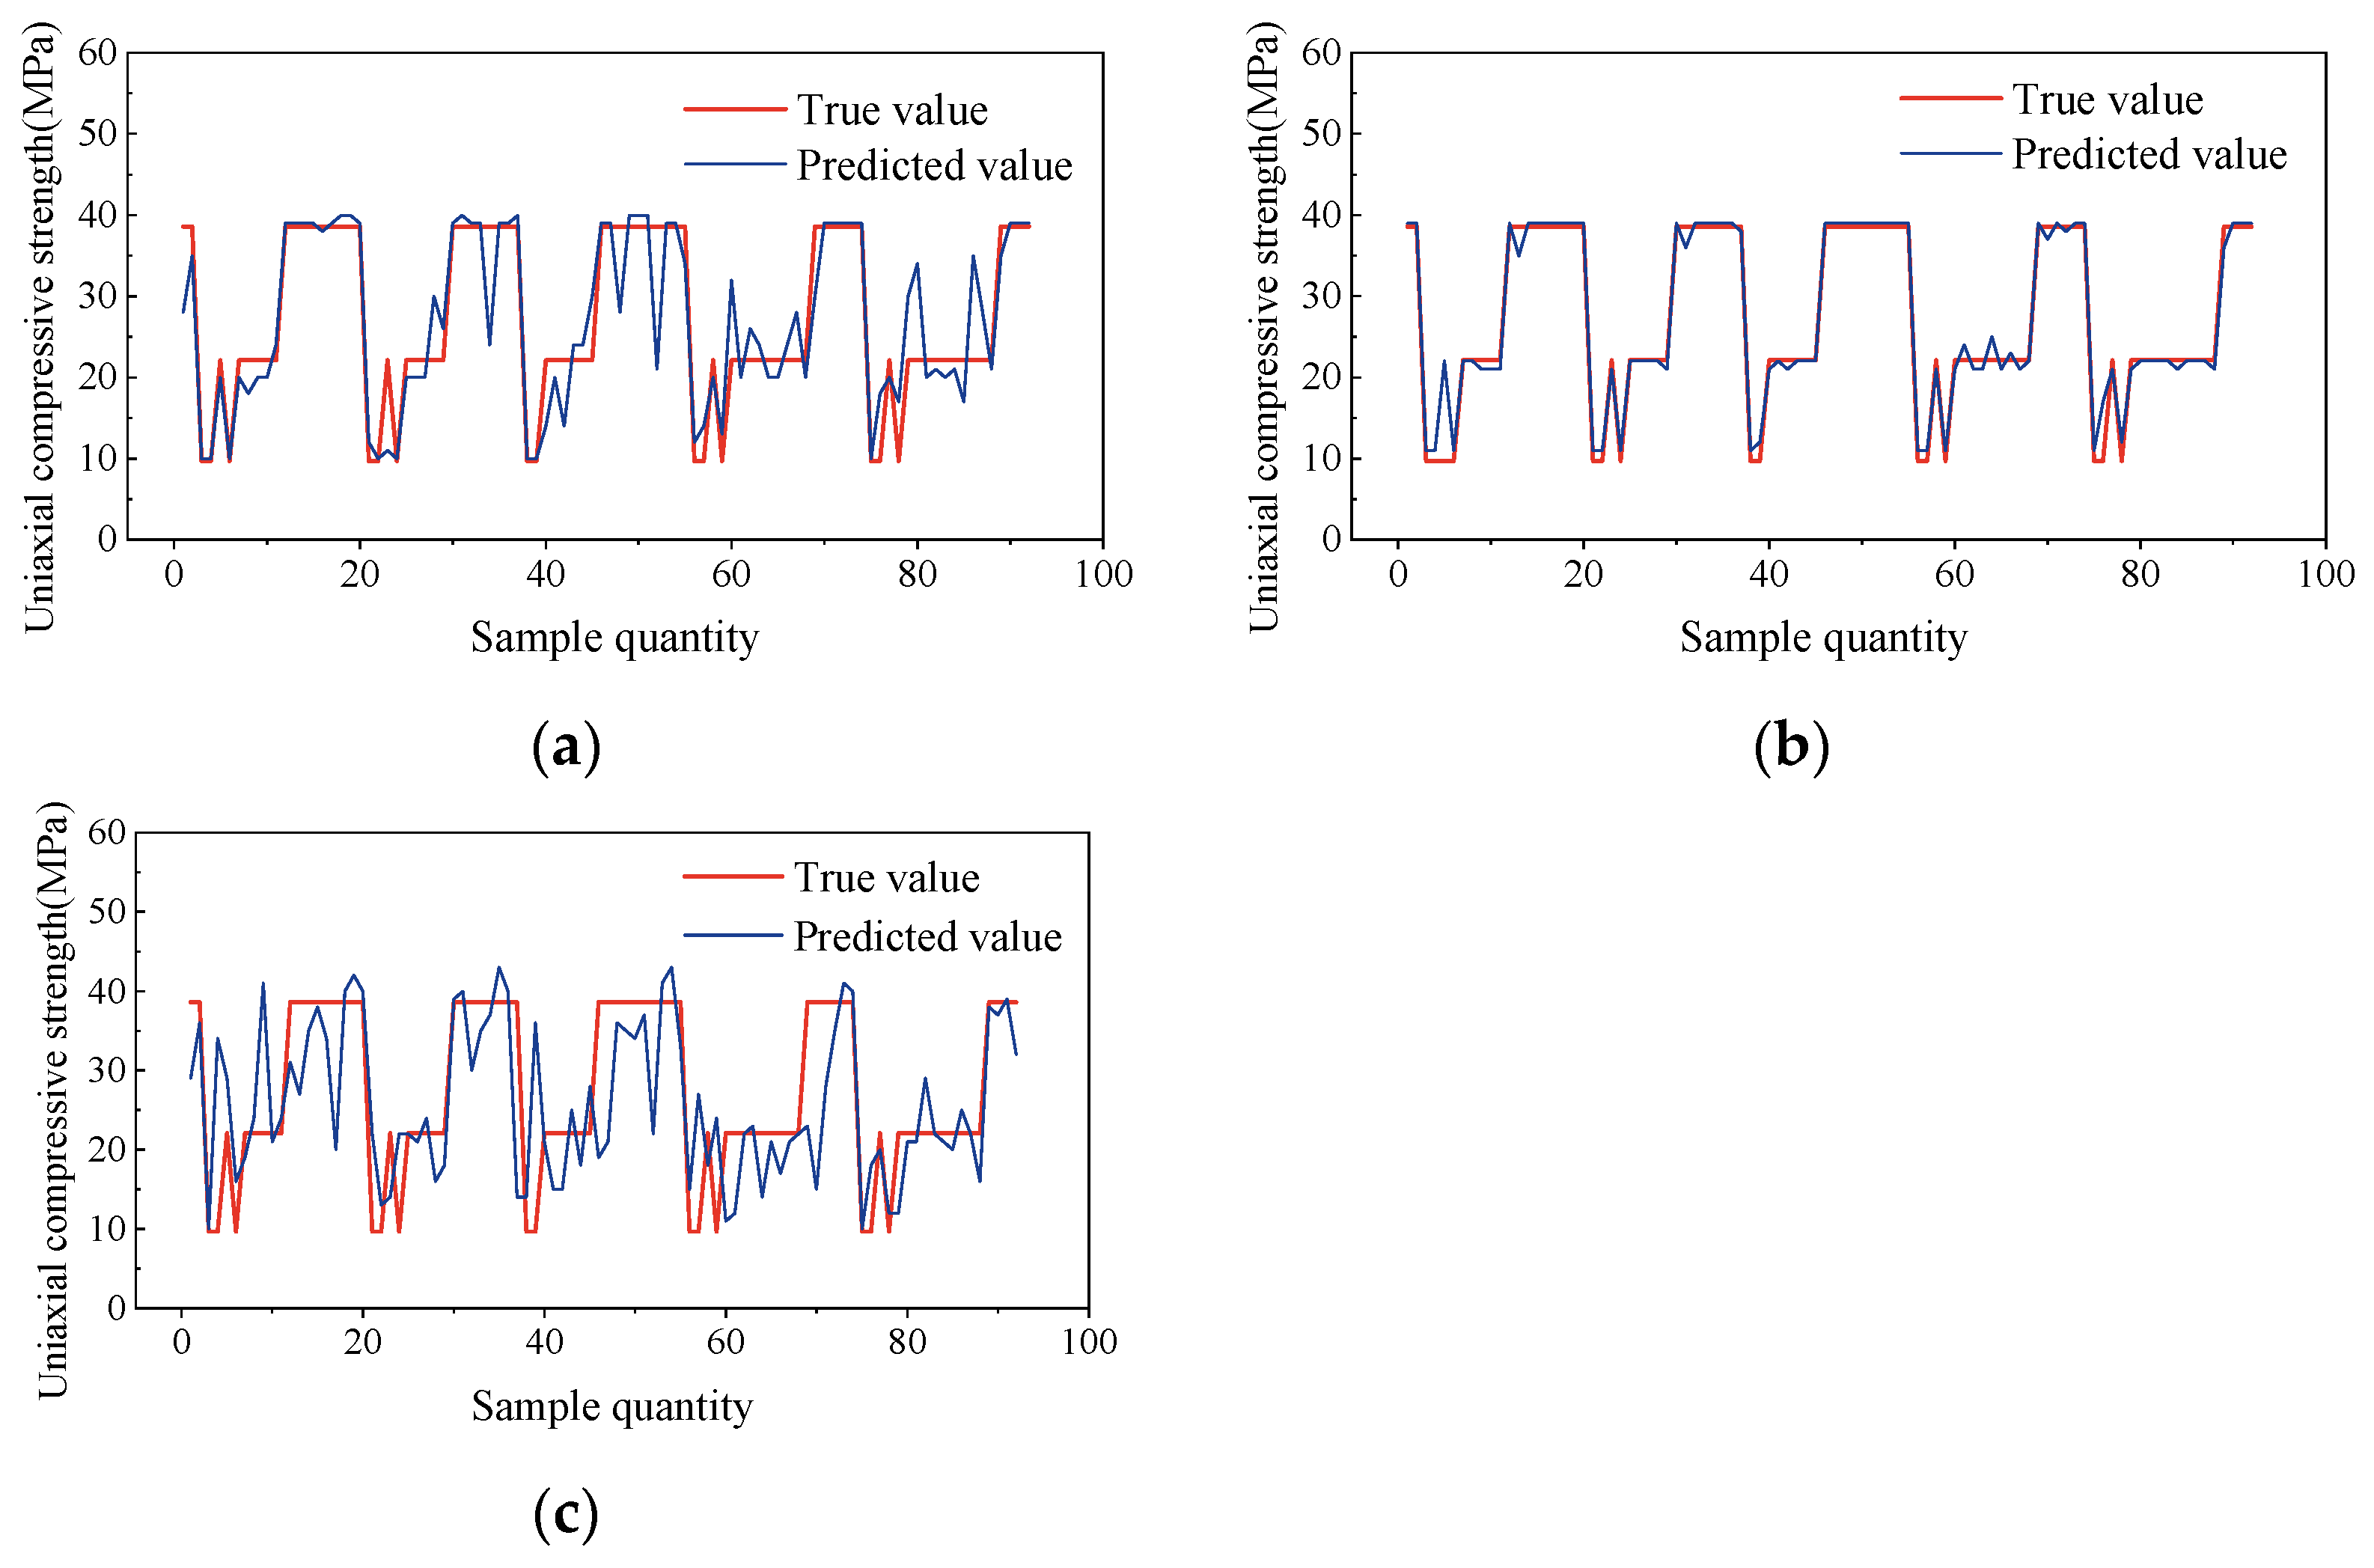
By comparing the prediction results of the SVM, decision tree, and linear base learners within the AdaBoost ensemble model, it was found that the SVM achieved the highest R2 value of 0.972. Additionally, the root mean square error (RMSE), mean absolute error (MAE), and mean absolute percentage error (MAPE) indicators exhibited the smallest values, demonstrating that the model possesses superior predictive accuracy for estimating the uniaxial compressive strength of coal and rock masses.
(4)
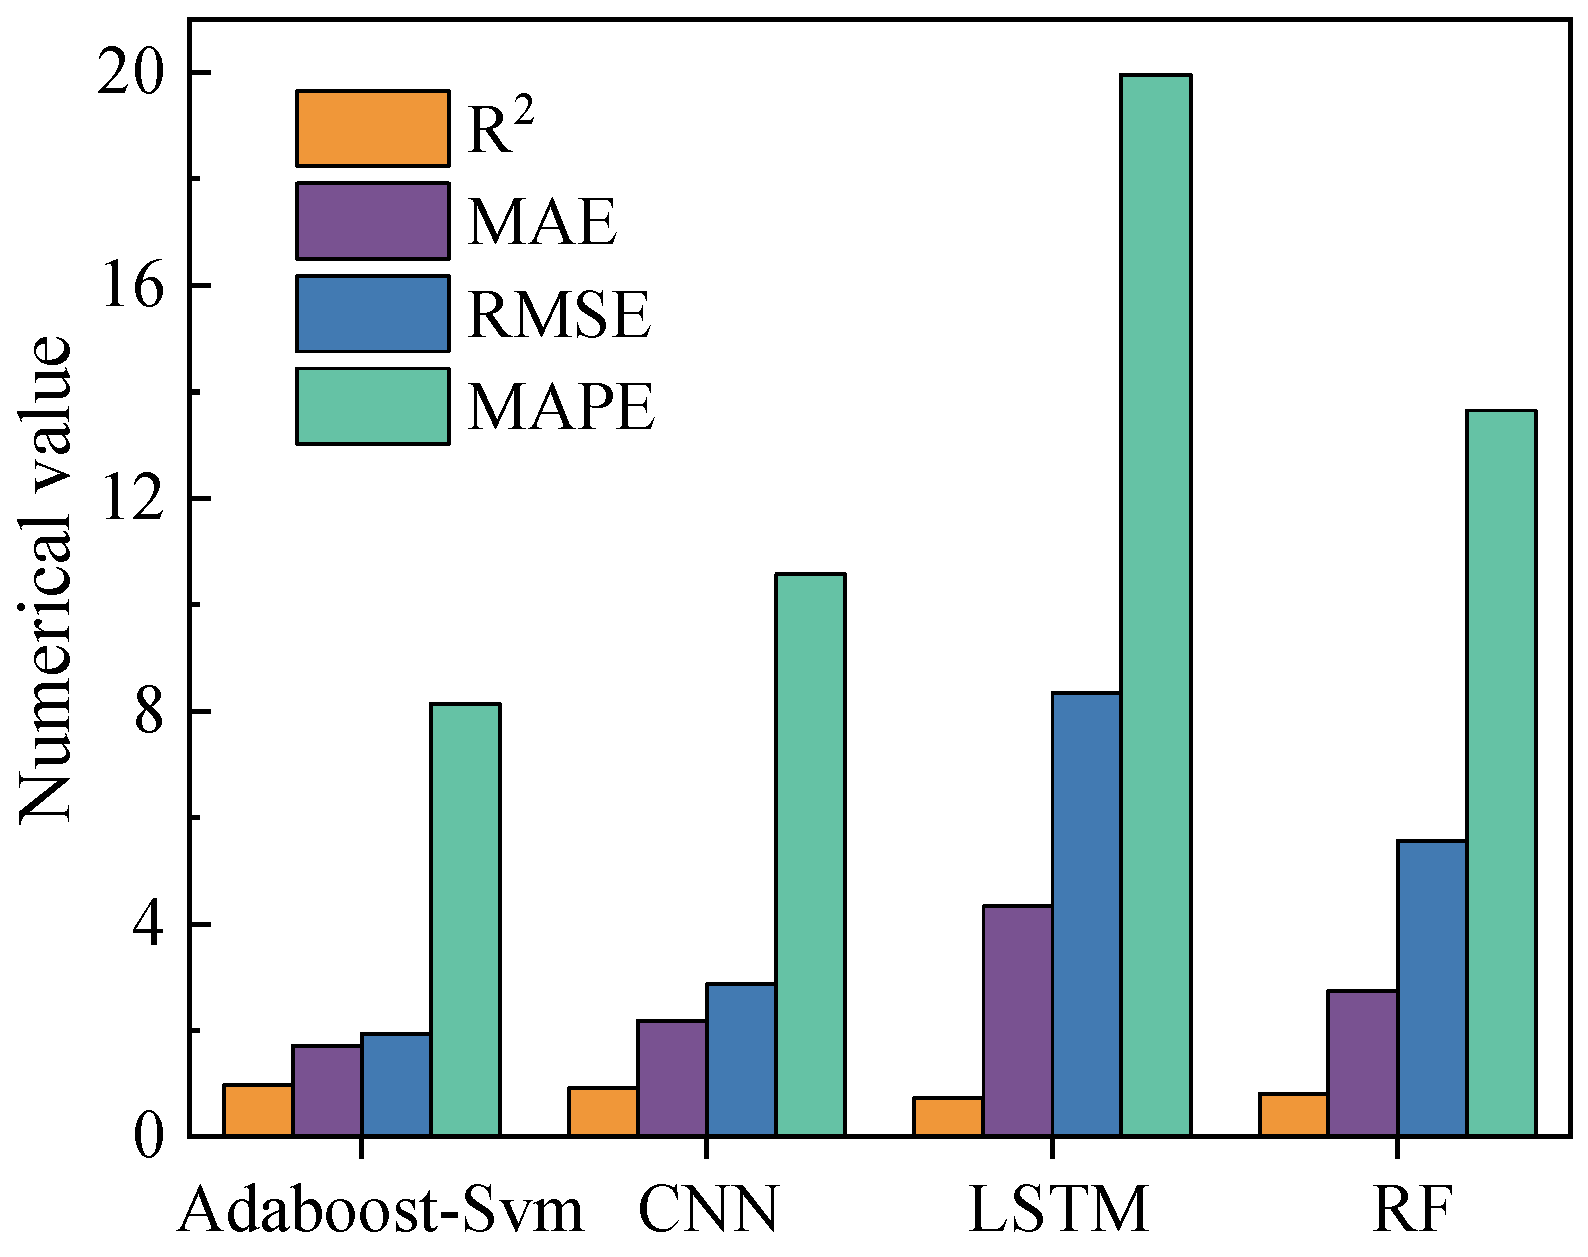
By optimizing the hyperparameter in AdaBoost model training, it is also compared with other most advanced models (CNN model, LSTM model, and RF model). The results show that the AdaBoost SVM model is superior to other models in prediction accuracy and stability, which further verifies its superiority in practical application.
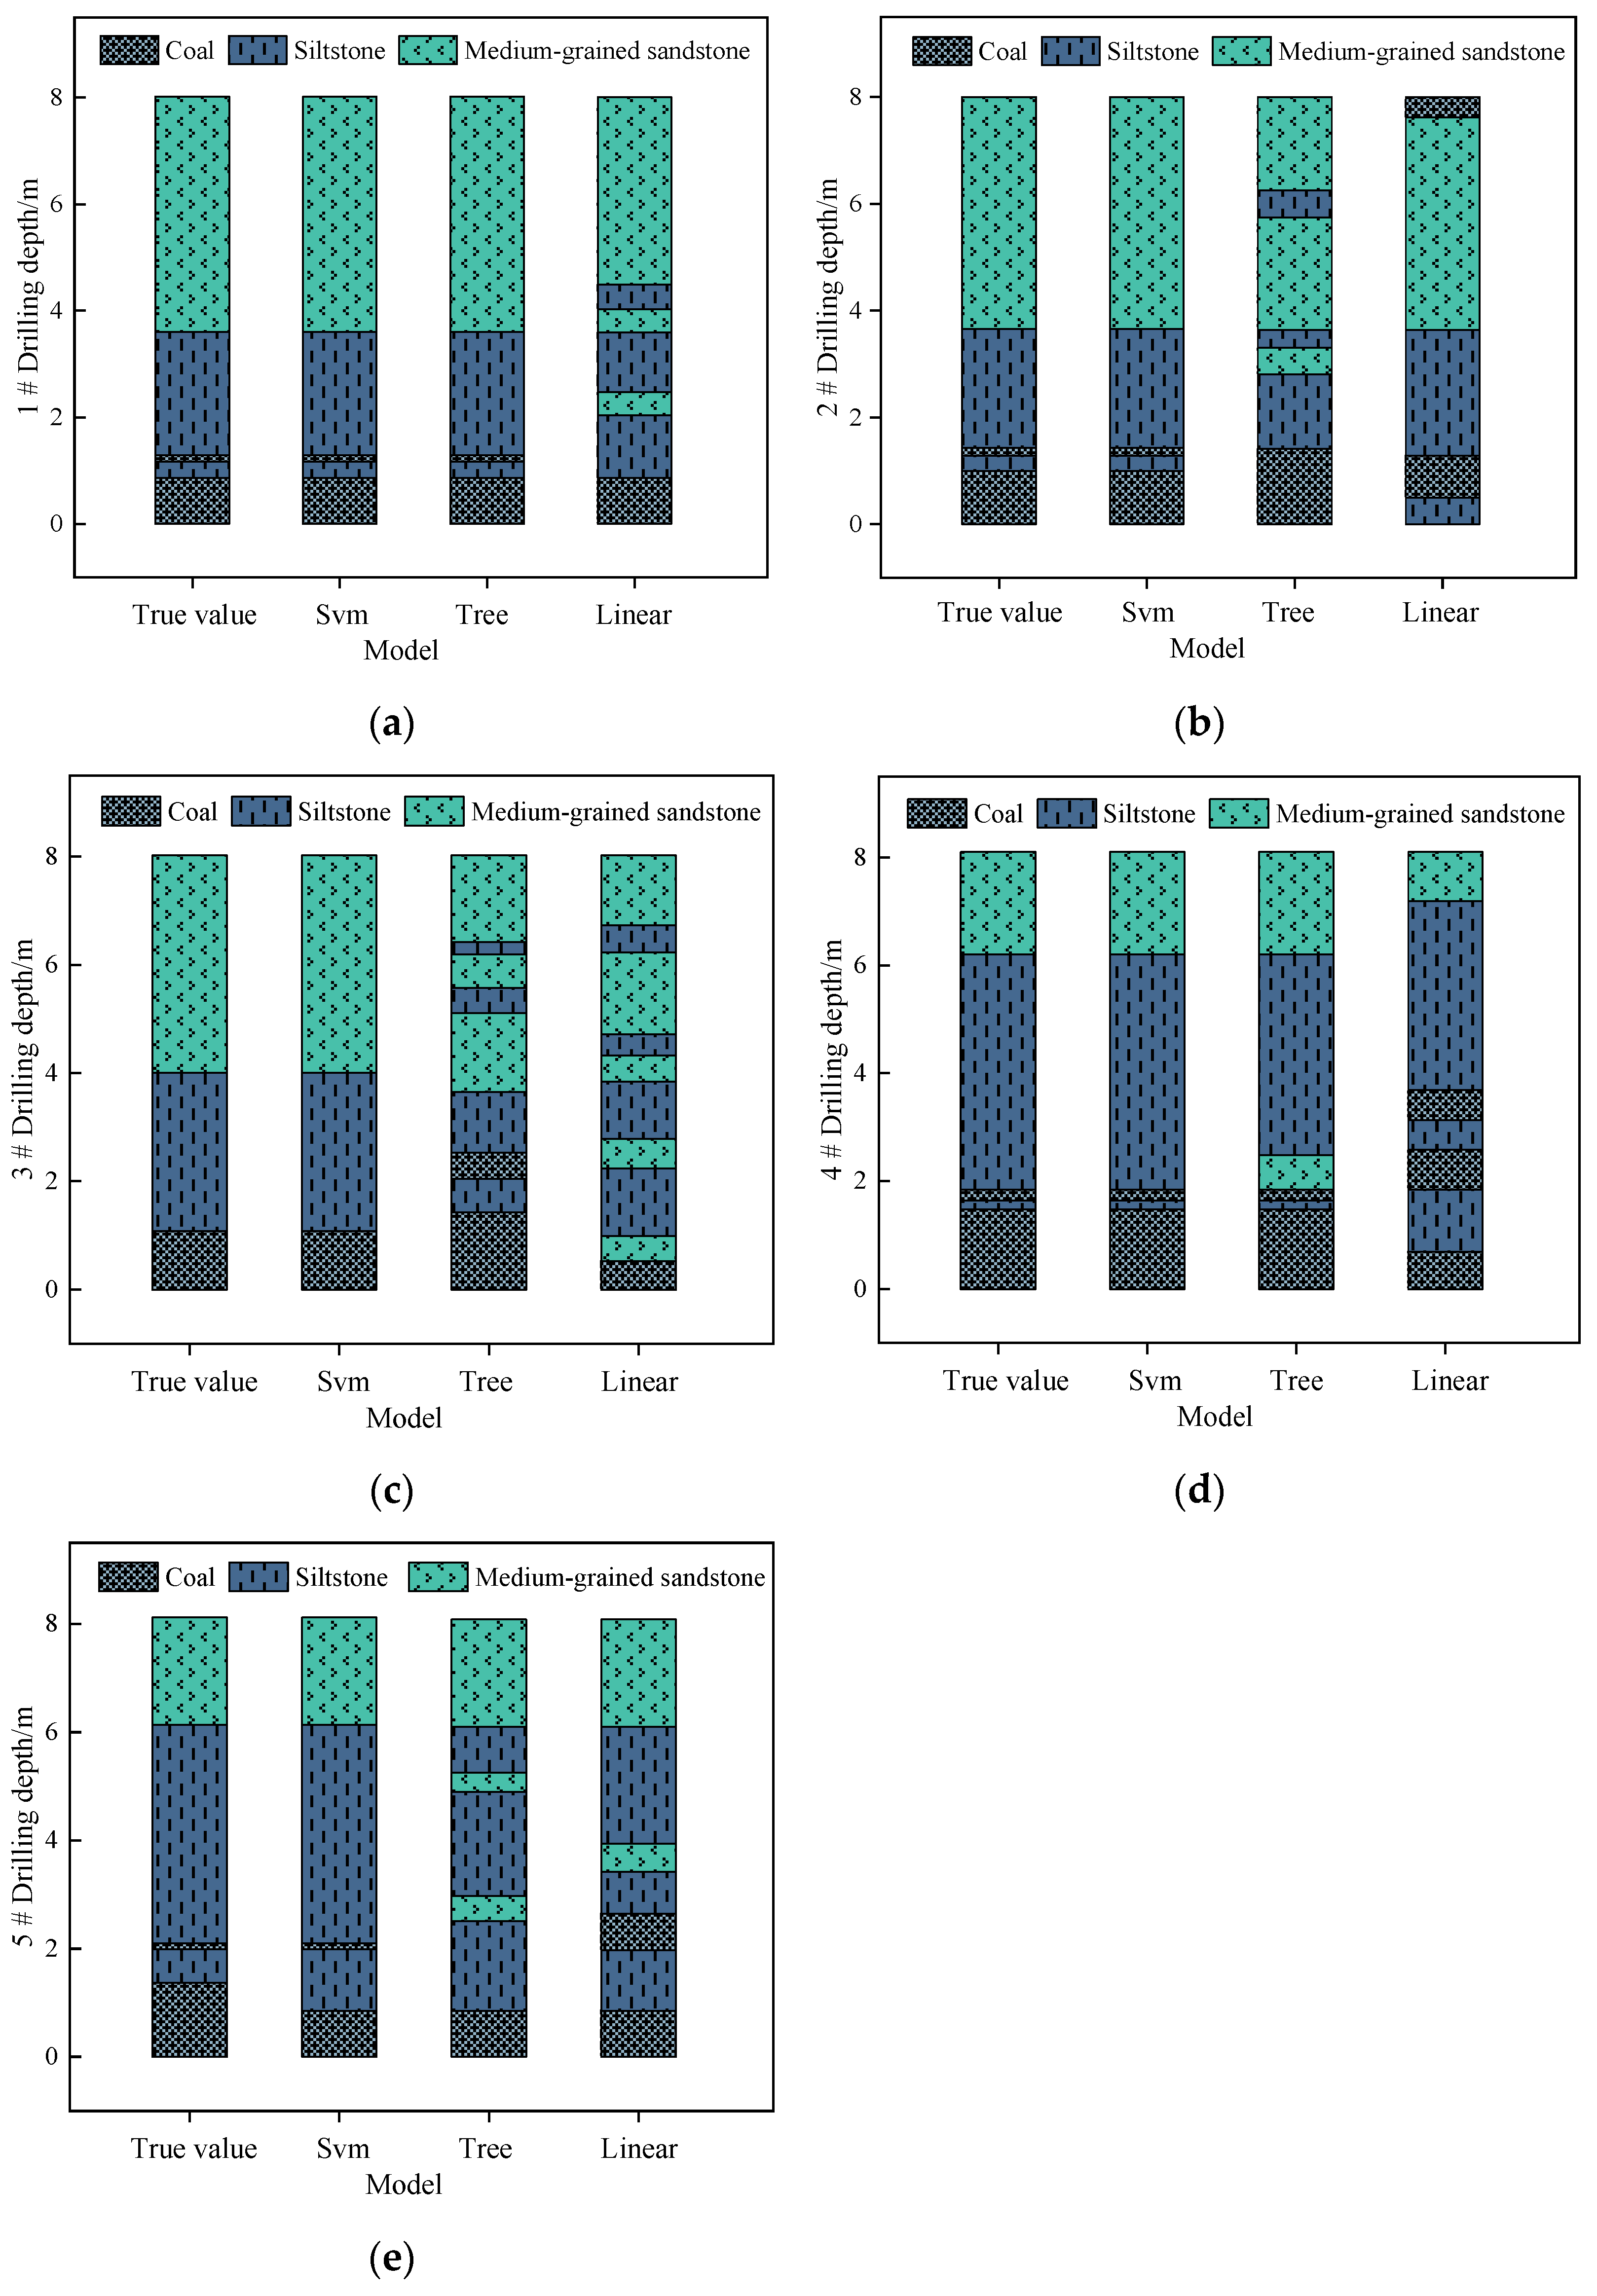
(5)
Comparing the three types of models that classify predicted values into specific rock types, the SVM model, the tree model, and the linear model demonstrate prediction accuracies of 98.8%, 85.4%, and 75.6%, respectively. This indicates that the AdaBoost ensemble algorithm utilizing SVM-based learners achieves the highest prediction accuracy.

Author Contributions

Z.Y.: methodology, writing—original draft, writing—review and editing. H.L.: conceptualization, experimental design, writing, original draft preparation, and visualization. Z.D.: validation, investigation, writing—review and editing. All authors have read and agreed to the published version of the manuscript.

Funding

This research was funded by the National Natural Science Foundation of China, grant number 52074209.

Institutional Review Board Statement

Not applicable.

Informed Consent Statement

Not applicable.

Data Availability Statement

The raw data supporting the conclusions of this article will be made available by the authors on request.

Conflicts of Interest

Author Zheng Yang was employed by the company Shaanxi Xiaobaodang Mining Co., Ltd. The remaining authors declare that the research was conducted in the absence of any commercial or financial relationships that could be construed as a potential conflict of interest.

References

  1. Wang, H.; Chen, M.J.; Zhang, X.F. Twenty years of development and the prospect of rapid coal mine roadway excavation in China. J. China Coal Soc. 2024, 49, 1199–1213. [Google Scholar]
  2. Wang, Q.; Sun, H.B.; Jiang, B.; Gao, S.; Li, S.C.; Gao, H.K. A method for predicting uniaxial compressive strength of rock mass based on digital drilling test technology and support vector machine. Rock Soil Mech. 2019, 40, 1221–1228. [Google Scholar]
  3. Al–Shuker, N.; Kirby, C.; Brinsdon, M. The application of real-time downhole drilling dynamic signatures as a possible early indicator of lithology changes. In Proceedings of the SPE/DGS Saudi Arabia Section Technical Symposium and Exhibition, Al-Khobar, Saudi Arabia, 15–18 May 2011; Society of Petroleum Engineers: Richardson, TX, USA, 2011. SPE–149056–MS. [Google Scholar]
  4. Li, X. Intelligent Identification Technology While Drilling for Roof Rock Strength of Coal Mine Roadway. Master’s Thesis, China University of Mining and Technology, Xuzhou, China, 2022. [Google Scholar]
  5. Jahed Armaghani, D.; Tonnizam Mohamad, E.; Hajihassani, M.; Yagiz, S.; Motaghedi, H. Application of several non-linear prediction tools for estimating the uniaxial compressive strength of granitic rocks and comparison of their performances. Eng. Comput. 2016, 32, 189–206. [Google Scholar] [CrossRef]
  6. Li, W.; Tan, Z.Y. Comparison on Rock Strength Prediction Models Based on MLR and LS-SVM. Min. Res. Dev. 2016, 36, 37–40. [Google Scholar]
  7. Heidari, M.; Mohseni, H.; Jalali, S.H. Prediction of Uniaxial Compressive Strength of Some Sedimentary Rocks by Fuzzy and Regression Models. Geotech. Geol. Eng. 2018, 36, 401–412. [Google Scholar] [CrossRef]
  8. Ding, Z.W.; Zhang, C.F.; Huang, X.; Liu, Q.S.; Liu, B.; Gao, F.; Li, L.; Liu, Y.X. Recognition method of coal-rock reflection spectrum using wavelet scattering transform and bidirectional long short-term memory. Rock Mech. Rock Eng. 2024, 57, 1353–1374. [Google Scholar] [CrossRef]
  9. Jalali, S.H.; Heidari, M.; Mohseni, H. Comparison of models for estimating the uniaxial compressive strength of some sedimentary rocks from Qom Formation. Environ. Earth Sci. 2017, 76, 753. [Google Scholar] [CrossRef]
  10. Ding, C.; Zhao, M.; Lin, J. Sparse feature extraction based on periodical convolutional sparse representation for fault detection of rotating machinery. Meas. Sci. Technol. 2021, 32, 015008. [Google Scholar] [CrossRef]
  11. Yue, Z.W.; Dai, S.Q.; Li, Y.; Yue, X.L.; Li, S.H.; Cao, W. The drilling parameter acquisition system of hydraulic anchor drilling rig in coal mine roadways and its application. J. Min. Sci. Technol. 2023, 8, 66–73. [Google Scholar]
  12. Zhang, Y.Z.; Zhang, N.; Shao, J.J.; Zhong, Z.C. Fuzzy identification of coal-bearing strata lithology based on drilling parameter clustering. J. China Coal Soc. 2019, 44, 2328–2335. [Google Scholar]
  13. Wang, J. Research on coal-rock interface recognition system based on drilling parameters. Coal Geol. Explor. 2023, 51, 72–80. [Google Scholar]
  14. Wu, S.C.; Wang, Y.C.; Zhang, J.H. Study on Prediction Method of Uniaxial Compressive Strength of Rocks Based on Stacking Ensemble Algorithm. Min. Res. Dev. 2022, 42, 105–111. [Google Scholar]
  15. Wu, L.Y.; Li, J.H.; Ma, D.; Wang, Z.F.; Zhang, J.W.; Yuan, C.; Feng, Y.; Li, H. Prediction for Rock Compressive Strength Based on Ensemble Learning and Bayesian Optimization. Earth Sci. 2023, 48, 1686–1695. [Google Scholar]
  16. Wang, S.; Lai, K.; Zhang, Z.; Bai, J.; Luo, Z.B.; Li, B.L.; Zhang, J. Intelligent lithology prediction method based on vibration signal while drilling and deep learning. Coal Geol. Explor. 2023, 51, 51–63. [Google Scholar]
  17. Zhang, Z.Y.; Li, H.; Lei, Z.; Liu, H.S.; Zhang, Y.F. Research on lightweight lithology intelligent recognition system incorporating attention mechanism. Appl. Sci. 2022, 12, 10918. [Google Scholar] [CrossRef]
  18. Lei, S.; Kang, H.P.; Gao, F.Q.; Zhang, X. Point load strength test of fragile coal samples and predictive analysis of uniaxial compressive strength. Coal Sci. Technol. 2019, 47, 107–113. [Google Scholar]
  19. Liu, H.Q.; Liu, J.K.; Hao, J.; Zhao, L.J.; Tang, J.Q. Modeling study of uniaxial compressive strength prediction from similar analog drilling test signals. Coal Sci. Technol. 2024, 1–14. [Google Scholar]
  20. Hao, J.; Liu, H.Q.; Liu, J.K.; Lyu, J.Q.; Zheng, Y.N.; Liu, J.R. Experimental study of rock uniaxial compressive strength prediction with drilling based on vibration signals. Chin. J. Rock Mech. Eng. 2024, 43, 1406–1424. [Google Scholar]
  21. Yue, X.; Huang, D.; Yue, Z.; Zhao, J. Using drilling noise and vibration signals for rock layer identification: A study on layered rock samples with weak interlayers. Bull. Eng. Geol. Environ. 2025, 84, 133. [Google Scholar] [CrossRef]
  22. Stehlíková, B.; Bogdanovská, G.; Flegner, P.; Frančáková, R.; Drančák, L. The Proposal of a Method for Rock Classification Using a Vibration Signal Propagated during the Rotary Drilling Process. Appl. Sci. 2023, 13, 11315. [Google Scholar] [CrossRef]
  23. Bai, J.; Wang, S.; Xu, Q.; Luo, Z.; Zhang, Z.; Lai, K.; Wu, J. Intelligent real-time predicting method for rock characterization based on multi-source information integration while drilling. Bull. Eng. Geol. Environ. 2023, 82, 150. [Google Scholar] [CrossRef]
  24. Zhan, R.; Zhang, B.; Liu, L.; Huan, C.; Zhao, D.; Xi, H. An improved equivalent heat capacity method to simulate and optimize latent thermal energy storage units. Int. J. Heat Mass Transf. 2024, 235, 126135. [Google Scholar] [CrossRef]
Figure 1. Research ideas.
Applsci 15 04427 g001
Figure 2. Raw data of drilling signals. (a) Rotational speed signal; (b) pressure signal. (c) torque signal; (d) vibration signal; (e) inclination angle signal; (f) speed signal.
Applsci 15 04427 g002
Figure 3. Raw data of drilling signals.
Applsci 15 04427 g003
Figure 4. Multi-level wavelet coefficient decomposition diagram.
Applsci 15 04427 g004
Figure 5. Comparison diagram of the actual vibration signal before and after noise reduction.
Applsci 15 04427 g005
Figure 6. AdaBoost algorithm framework.
Applsci 15 04427 g006
Figure 7. Prediction results of three types of base learner models. (a) Tree-based learner; (b) SVM-based learner; (c) linear-based learners.
Applsci 15 04427 g007
Figure 8. Comparison of multi-model evaluation indicators.
Applsci 15 04427 g008
Figure 9. Comparison of actual values and predicted values from three types of models for boreholes 1–5. (a) 1 # drilling; (b) 2 # drilling; (c) 3 # drilling; (d) 4 # drilling; (e) 5 # drilling.
Applsci 15 04427 g009
Figure 10. Model prediction accuracy. (a) Tree; (b) linear.
Applsci 15 04427 g010
Table 1. Drilling rig parameters.
Technical ParameterRangeUnit
Working air pressure0.4~0.63MPa
Rated air pressure0.5MPa
Rated speed440r/min
Rated torque35N·m
Stall torque55N·m
Gas consumption4M3/min
Flushing water pressure0.6~1.2MPa
Overall weight13.5kg
Table 2. Rock uniaxial compressive strength.
LithologyAverage Uniaxial Compressive Strength/MPa
Coal9.7
Siltstone22.1
Medium-grained sandstone38.6
Table 3. Correlation analysis between uniaxial compressive strength and drilling signals.
IndexRotational SpeedPressureTorqueVibrationInclination AngleSpeedUniaxial Compressive Strength
Rotational speed1
Pressure0.4611
Torque0.5570.2471
Vibration0.3960.3210.2041
Inclination angle0.1240.4420.3160.1061
Speed0.2760.1170.2810.2560.1821
Uniaxial compressive strength0.3140.4290.6100.3260.0880.1241
Table 4. Calculation results of performance evaluation indicators for three models.
Base LearnerR2MAERMSEMAPE
Tree0.8062.8015.14612.270%
SVM0.9721.7171.9408.145%
Linear0.4519.107 16.512 55.744%
Table 5. Classification of predicted values for uniaxial compressive strength.
Predicted Value Range/MPaClassification Value/MPaLithology
0~159.7Coal
16~2922.1Siltstone
30~4338.6Medium-grained sandstone
Disclaimer/Publisher’s Note: The statements, opinions and data contained in all publications are solely those of the individual author(s) and contributor(s) and not of MDPI and/or the editor(s). MDPI and/or the editor(s) disclaim responsibility for any injury to people or property resulting from any ideas, methods, instructions or products referred to in the content.

