Abstract
Lanthanide biosorption is important for recycling value-added materials. Previously, we analyzed dysprosium (Dy) absorption in screening strains of the unpopular yeast species Schizoblastosporion sp. However, it would be more desirable to use the well-known yeast Saccharomyces cerevisiae to make an easy-to-breed and efficient Dy-absorbing strain. Thus, we analyzed the physiological response and gene regulation of S. cerevisiae under Dy-absorbing conditions. The Dy content was measured using an inductively coupled plasma atomic emission spectrometer (ICP-AES). Transcriptional regulation was compared under Dy-absorbing and non-absorbing conditions through mRNA analysis and quantitative real-time polymerase chain reaction (qRT-PCR). In the yeast cells, approximately 40% of the Dy was located in the cell wall fraction, and the remaining 60% was located in the intracellular fraction. qRT-PCR analysis showed that the expression of four genes, NCW2, PIR1, CRH1, and OLE1, was upregulated, and that of ATP14 was downregulated. These results suggest that NCW2, PIR1, and CRH1 were responsible for cell wall rearrangement; OLE1 initiated repair of the oxidative damage to the membrane lipids; and intracellular oxidation was caused by an imperfect ATP14 product.
1. Introduction
The lanthanides consist of 15 elements: lanthanum, cerium, praseodymium, neodymium, promethium, samarium, europium, gadolinium, terbium, dysprosium, holmium, erbium, thulium, ytterbium, and lutetium. They are highly valued materials used in various extensively used technologies, such as electric cars, crystal displays, mobile phones, and magnetic resonance imaging (MRI) apparatus. Their importance is growing due to their role in meeting the Sustainable Development Goals (SDGs), particularly in the development of new technologies and green energies [1]. Thus, the biosorption of lanthanides from discarded technology or lanthanide-containing wastewater is a highly efficient, cost-effective, and versatile process that does not involve hazardous chemicals such as organic–inorganic pollutants, toxic metals, or metalloids [1]. To understand the physiological effects of REEs on the available biosorption systems for recovering REEs, we isolated yeast strains that absorb dysprosium (Dy) [1]. Dy is one of the REEs utilized alongside neodymium in various highly magnetic devices, including electric automobiles and magnetic resonance imaging analyzers, owing to its powerful magnetic and superconductive properties [1]. Our isolated yeast strains absorbed more Dy than the typical yeast Saccharomyces cerevisiae; however, this strain was identified as an unpopular yeast species, Schizoblastosporion sp. [1]. To develop yeast strains for Dy biosorption, the biological processes responsible for yeasts’ Dy-absorbing abilities need to be elucidated. Because S. cerevisiae is well known for its physiological reactions, metabolic pathways, genetic properties, and ability to absorb Dy [1], we used S. cerevisiae to elucidate Dy absorption in yeast cells. Lanthanide toxicity has been reported in S. cerevisiae [2]; however, the cellular absorption of lanthanides has not yet been analyzed. The effects of lanthanide absorption in yeast cells are of significant interest and importance. We examined the cellular characteristics and the change in mRNA levels under metal-absorbing conditions using Dy in S. cerevisiae. The mRNA level measurement assay used in the current study was derived from the mRNA analysis performed in the absorption of zinc particles by tobacco plants [3]. In this study, we revealed dual physiological responses and major changes in the transcriptional activity of S. cerevisiae under Dy-absorbing culture conditions. It is recognized that four genes, NCW1 (encoding a GPI-anchored protein involved in cell wall remodeling [4,5]); PIR1 (encoding an O-glycosylated protein required for cell wall stability [6,7]); CRH1 (encoding a chitin transferase [8]); and OLE1 (encoding a D9 fatty acid desaturase [1,2]), were upregulated, and one gene, ATP14 (encoding subunit h in mitochondrial Fo-F1 ATPase [9]), was downregulated.
2. Materials and Methods
2.1. Strain and Culture Media
The budding yeast Saccharomyces cerevisiae strain BY4741 was purchased from Open Biosystems (Lafayette, CO, USA). GYP medium was used, which was composed of glucose (2.0%), peptone (1.0%), and yeast extract (0.5%), adjusted to a pH of 3.5. Solid medium was prepared by the addition of 2.0% agar. Dy-stock solution was prepared as follows: Dy(CH3COO)3 is solubilized with a small volume of 0.1 M HCl and diluted to adjust 10 mM by adding 50 mM sodium acetated buffer (pH 3.5), then sterilized by a sterilization filter. Dy-stock solution was added at a final concentration of 0.1 mM when needed for tests. The culture was incubated at 30 °C.
2.2. Preparation of Protoplast and Cell Wall Solution
Protoplast and cell wall solutions were prepared following a previously published method [1] with minor modifications, as follows: Approximately 1.0 × 10⁷ yeast cells were collected from GYP cultures incubated with or without Dy3+ for various durations, washed twice with 1 M sorbitol, and suspended in 0.02 M potassium phosphate buffer (pH 7.0) containing 1 M sorbitol. The yeast cell walls were digested with 10 mg of Zymolyase 100T (Nacalai Tesque Inc., Tokyo, Japan) in 50 mM potassium phosphate buffer (pH 7.0) with 1 M sorbitol at 37 °C for 1 h. The pellet of yeast protoplasts and the supernatant containing the cell wall materials were fractionated from the digestion mixture via centrifugation at 2000× g and 4 °C for 10 min. The yeast protoplasts were washed twice with 1 M sorbitol solution using ultrapure water.
2.3. Detection of ROS Contents in Yeast Cells
Yeast cells, pre-cultured overnight at 30 °C, were inoculated at 1/100 volume into fresh GYP (at pH 3.5) with or without Dy and cultured for 24 h with shaking at 120 rpm at 30 °C. Approximately 1 × 10⁸ cells were collected, washed in phosphate-buffered saline (PBS), and centrifuged at 3300× g for 5 min at 4 °C. The cells were suspended in PBS supplemented with 20 μM 2′,7′-dichlorodihydrofluorescin diacetate (H2DCFDA) to achieve the desired final concentration. H2DCFDA solution was added from a 5 mM stock of H2DCFDA solution dissolved in dimethylsulfoxide (DMSO). After being treated with H2DCFDA at 30 °C for 15 min, the yeast cells were collected and washed twice with PBS and centrifuged at 3300× g for 5 min at 4 °C. Yeast cells, suspended in 0.5 mL of PBS, were added to 1.5 g of glass beads (ϕ 0.4 mm), lysed through agitation for 1 min using a vortex mixer, and then kept on ice for 1 min. The yeast lysis step was repeated 7 times. The yeast lysate (supernatant) was collected through centrifugation at 20,000× g for 10 min at 4 °C and analyzed using fluorescent spectrophotometry, with the excitation and emission wavelength bands set at 485 and 528 nm, respectively, using the microplate reader BioTek Synergy H1 (Agilent Technologies International, Santa Clara, CA, USA). All the fluorescence measurements were performed at room temperature.
2.4. Analysis of Dy Content
The Dy amounts in intact yeast cells, yeast protoplasts, and yeast cell wall solubilized solutions were analyzed using inductively coupled plasma atomic emission spectrometry (ICP-AES). Yeast cells cultured in GYP with or without Dy(CH3COO)3 were collected through centrifugation at 5000× g for 10 min, washed twice with ultrapure water, and resuspended in ultrapure water to obtain the optical density at 660 nm (OD600). The Dy content was analyzed using the ICP-AES apparatus ICPE-9000 (Shimadzu Co., Kyoto, Japan) after the digestion of each sample with 6 M pure nitric acid for about 1 h at 90 °C and then dilution in ultrapure water at 50–100-fold. All analyses were performed at least in triplicate, and the mean values are reported. The number of yeast cells calculated to be 1.0 OD660 was approximately 1.5 × 10⁷ cells/mL of suspension, as described in a previous report [1].
2.5. Gene Expression Analysis Through mRNA-Seq
Total RNA was extracted from 5 × 10⁷ yeast cells cultured for 18 and 24 h in GYP with or without Dy(CH3COO)3 using a Yeast Processing Reagent for total RNA preparation (Takara Bio, Kusatsu, Japan). The RNA was purified using NucleoSpin RNA (Takara Bio). Reverse transcription and genomic DNA elimination were performed using the PrimeScript TM RT Reagent Kit with gDNA Eraser (Perfect Real Time) (Takara-Bio). The quality of RNA samples was evaluated by electrophoresing them using an Agilent 4200 TapeStation (Agilent Technology, Santa Clara, CA, USA) according to the High-Sensitivity RNA protocol provided by the manufacturer. The degree of degradation of total RNA was evaluated by checking the RNA integrity number equivalent (RINe), which is a value calculated based on the state of rRNA by the Agilent TapeStation using a maximum score of 10 to indicate the degree of RNA degradation (recommended value is 8 points or more), and samples with a score of 8 points or more were used. For the next-generation sequencing, the library was prepared from 4 μg of total RNA using the TrueSeq stranded mRNA Sample Preparation Kit (Illumina, San Diego, CA, USA). Comprehensive sequencing was performed by MiSeq (Illumina); approximately 240 million reads were obtained from each sample (the procedure is detailed in [3]). The provided sequence reads were mapped to S. cerevisiae S288C reference genome sequences (NCBI dataset, National Library of Medicine, Bethesda, MD, USA) using HISAT2 software (v2.0.1) (Kim Lab, Bioinformatics Department, University of Texas Southwestern Medical Center, Dallas, TX, USA), and quality control checks on raw sequence reads were performed using FastQC (Babraham Institute, Cambridge, UK). Functional annotation of the sequence reads obtained from the Saccharomyces Genome Database (https://www.yeastgenome.org/) was performed using BLAST (accessed on 10 October 2020) searches of S. cerevisiae annotation information. Additionally, differentially expressed genes (DEGs) of samples at each culture of different durations were identified using StringTie (Center for Computational Biology, Johns Hopkins University, Baltimore, MD, USA), and they were converted using the prepDE.py program (Center for Computational Biology), with a p value of <0.05 being identified as significant. The gene expression differences were presented in TPM (transcripts per million). The length of amplicons for tested and reference genes was 100–300 bp. Lastly, the functions of the extracted DEGs were determined and classified based on gene ontology (GO) biological process categories reported in the Saccharomyces Genome Database.
2.6. Analysis of Gene Expression Ratio (2 − Δ(ΔCt)) in Dy-Absorbing Culture Through Quantitative Real-Time Polymerase Chain Reaction (qRT PCR)
Total RNA, extracted and qualified as described in the previous subsection, was reverse transcribed, while genomic DNA was excluded using the procedure also outlined in the previous subsection. The prepared cDNA was diluted 10-fold and utilized as a template for quantitative real-time PCR (SYBR Green Master Mix, Toyobo, Osaka, Japan) with the StepOne™ real-time PCR system (Thermo Fisher Sci., Tokyo, Japan) with targeted gene-specific primers (Table S1). A two-step PCR program was performed using the following protocol: DNA dissociation was performed at 95 °C for 1 min, primer annealing and extension were performed at 60 °C for 30 s, and all steps were repeated for 30 cycles. The delta cycle threshold (ΔCt) method [10] was employed to compare the relative expression of the target genes (Ct-TG) via the relative expression of the housekeeping gene mRNA (Ct-HK). Gene expression was compared between the normal culture (control condition) and the Dy-absorbing culture (sample condition) using the Δ(ΔCt) procedure [11] with the following formulas:
ΔCt-control = Ct-TG-control − Ct-HK-control
ΔCt-sample = Ct-TG-sample − Ct-HK-sample
Δ(ΔCt) = ΔCt-sample − ΔCt-control
Expression ratio = 2 − Δ(ΔCt)
The ACT1 gene, which encodes yeast actin, was used as a housekeeping gene [12]. The targeted genes were NCW1 (encoding a GPI-anchored protein involved in cell wall remodeling [4,5]), PIR1 (encoding an O-glycosylated protein required for cell wall stability [6,7]), CRH1 (encoding a chitin transferase [8]), OLE1 (encoding a D9 fatty acid desaturase [1,2]), and ATP14 (encoding a subunit in mitochondrial Fo-F1 ATPase [9]).
2.7. Statistical Analysis
Significance was assessed by Tukey’s test for comparisons between two groups and Tukey’s test for comparisons between three or more groups. A p-value of less than 0.05 indicated a significant difference between samples. In each figure, samples that were significantly different from the reference sample are indicated with the “*” symbol.
3. Results
3.1. Effect of Dy3+ on S. cerevisiae Growth
Our previous study [1] showed that S. cerevisiae growth was repressed in Dy-containing media. Thus, growth repression was confirmed by culturing the strain BY4741 for 12, 18, 24, and 48 h in Dy(CH3COO)3-containing or -free media (Figure S1). The growth of BY4741 was repressed in the Dy(CH3COO)3-containing culture, similarly to the findings of a previous study [1]. To elucidate this growth repression mechanism, ROS production was assayed in S. cerevisiae cells cultured in Dy(CH3COO)3-containing media for 24 h (Figure 1). ROS levels were higher in the yeast cells cultured in Dy(CH3COO)3-containing media than those in Dy-free media. These results show that the inhibition of yeast growth by Dy occurs because of increased ROS production upon Dy addition.
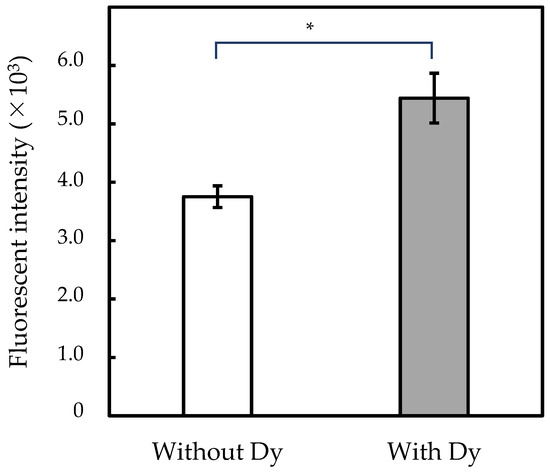
Figure 1.
ROS content in yeast cells. Yeast was cultured for 24 h in GYP with or without 0.1 mM Dy(CH3COO)3 (white and gray columns, respectively). Asterisk represents a significant statistical difference (p < 0.05) between samples with and without Dy3+-treatment.
3.2. Dy Absorption in S. cerevisiae Cells Cultured in Dy-Containing Medium
BY4741 cells were cultured for 12, 18, 24, or 48 h in a medium containing 0.1 mM Dy(CH3COO)3. The Dy content in the intact cells, intracellular region (inside the cell), and cell wall solubilized fraction (on the cell surface) was measured (Table 1). The Dy content in the intact yeast cells gradually increased up to 24 h, after which it was stable at approximately 20 nmol per 1 mg of dry cell weight (DCW). These results suggest that an increase in Dy absorption was observed during the exponential growth of S. cerevisiae (up to 24 h), but no significant change was observed during the stationary phase from 24 to 48 h. The Dy content in the protoplasts and cell wall solutions was assayed for the Dy-containing culture because our previous study [1] showed that Dy was located in both the protoplasts and cell wall fraction in S. cerevisiae cells suspended in Dy(CH3COO)3 solution. As shown in Table 1, Dy absorption was observed in both the protoplast and cell wall solutions at all the time points tested, and similar increasing patterns were observed in both the protoplasts and cell wall solution to those in the intact cells. In addition, the Dy absorption in both the protoplasts and cell wall solution was approximately half of that in the intact cells. These results show the possibility that approximately half of the absorbed Dy is transported into the cells and the other half is located on the cell surface.

Table 1.
Dy content in yeast cells.
3.3. Transcriptional Analysis of Dy-Dependent Differential Gene Expression
To clarify the responses of yeast cells in Dy-absorbing cultures, the yeast gene expression profiles were comprehensively analyzed using an mRNA-sequencing method. Compared to the control, 58 genes showed significantly altered transcription levels, of which 30 were upregulated and 28 were downregulated, in the Dy-absorbing culture at 18 h; at 24 h, 58 genes showed significantly altered transcription levels, of which 16 were upregulated and 42 downregulated (p the values of the data for the 18 and 24 h cultures were <0.05). The results of classifying the DEGs into biological process GO categories are shown in Figure S2. The genes classified under the GO term “fatty acid metabolic pathway” (GO: 0006631) were upregulated after 18 h of culture; the GO term “phospholipid biosynthetic process” (GO: 0008654) genes were upregulated after 24 h of culture; and the GO term “fungal-type cell wall organization” (GO: 0009277) genes were upregulated after both 18 and 24 h of culture. Three genes classified under the GO term “fungal-type cell wall organization” were particularly upregulated: NCW2, PIR1, and CRH1. The genes classified under the GO term “fatty acid metabolic pathway” (GO: 0006631) and “phospholipid biosynthetic process” (GO: 0008654) were also upregulated after 18 and 24 h of culture, respectively. OLE1, classified into both categories, was particularly upregulated after both 18 and 24 h of culture. These results suggest that the expression of four genes, NCW2, PIR1, CHR1, and OLE1, is increased under Dy-absorbing conditions. Many downregulated genes were classified into various GO categories. Interestingly, genes classified under the GO terms “organic acid biosynthetic process” (GO: 0016053) and “regulation of reproductive process” (GO: 2000241) were downregulated after 18 h of culture, as well as those classified under “gluconeogenesis” (M: 00003), “monocarboxylic metabolic process” (GO: 0032787), and “pyruvate metabolism” (ko: 00620). However, no common GO category was found for the genes expressed in the 18 and 24 h cultures. When comparing the genes downregulated after 18 h of culture with those downregulated after 24 h of culture, one gene, ATP14, was found to be downregulated at both time points. These results suggest that the expression of ATP14 is decreased by Dy absorbance.
3.4. mRNA Analysis Through qRT-PCR
The four confirmed upregulated genes, NCW2, PIR1, CHR1, and OLE1, and the confirmed downregulated gene, ATP14, according to the mRNA sequencing analysis, were reanalyzed through qRT-PCR. The results for the upregulated genes are shown in Figure 2. The mRNA levels of NCW2, PIR1, CHR1, and OLE1 were more than two-fold higher in cultures at 18 and 24 h. The results for NCW2, PIR1, and CHR1 suggest that the cell surface components changed under Dy-absorbing conditions in the yeast. The result for OLE1 also suggests that unsaturated fatty acids were regenerated in the cellular membrane because the intracellular ROS concentration was increased in the Dy-treated yeast cells. On the other hand, the downregulated gene, ATP14, was shown to have less than half the mRNA content in the treated yeast cells (Figure 3). This result suggests that ATP production accompanied by proton transportation in important mitochondrial functions is abnormal under Dy-absorbing conditions, and yeast growth is repressed (shown in Figure S1) by this mitochondrial abnormality caused by Dy(CH3COO)3 addition.
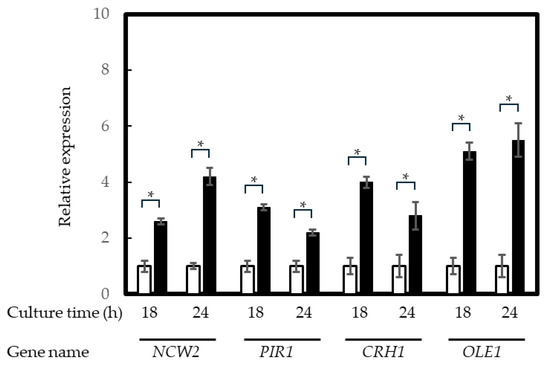
Figure 2.
qRT-PCR results for the Dy3+-treated yeast cells. Yeast RNA was extracted from cultures at 18 h and 24 h. White and black columns represent the Dy3+-free and 0.1 mM Dy3+-treated cultures, respectively. Relative expression was calculated using the ΔΔCt method. Asterisks represent a statistically significant difference (p < 0.05) between samples with and without Dy3+ treatment.
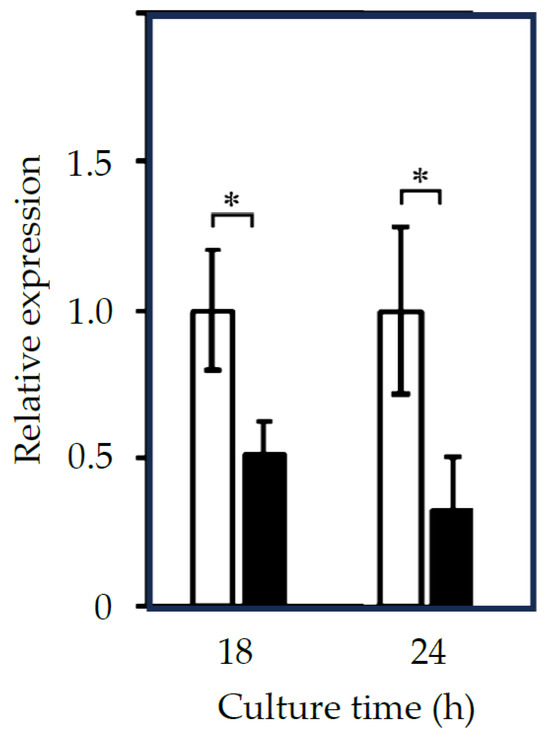
Figure 3.
qRT-PCR results for ATP14 in the Dy3+-treated yeast cells. Yeast RNA was extracted from cultures at 18 h and 24 h. White and black columns represent the Dy3+-free and 0.1 mM Dy3+-treated cultures, respectively. Relative expression was calculated using the ΔΔCt method. Asterisks represent a statistically significant difference (p < 0.05) between samples with and without Dy3+ treatment.
4. Discussion
NCW2, PIR1, and CRH1 expression was significantly enhanced by Dy3+ addition, indicating that Dy3+ affected the cell wall structure. NCW2 encodes GPI-anchored protein involved in cell wall remodeling, the assembly of the cell wall chitin-glucan structure, and repair of cell wall damage caused by the antifungal agent [1]. Therefore, Ncw2 protein plays a role in the cell wall integrity pathway involved in chitin and glucan balance maintenance in the yeast cell wall, and its expression is upregulated in response to cell wall stress [1]. The enhanced expression of NCW2 upon the addition of Dy3+ suggests that Dy3+ damages the cell wall. This was also demonstrated by the enhanced expression of PIR1 and CRH1. PIR1 encodes O-glycosylated protein required for cell wall stability by attachment to beta-1,3-glucan in the cell wall [6]. PIR1 expression is induced by heat shock, and its product, accompanied by the PIR2 product, helps to maintain the cell wall’s structure by protecting it from heat shock damage [6,7]. CRH1 encodes chitin transglycosylase, which functions in the transfer of chitin to β-(1-6) and β-(1-3) glucans in the cell wall and then prevents cell wall stress [8]. CRH1 expression is induced by osmotic stress (via the Hog and Stl1 pathways) resulting from cell wall damage (Zymolyase treatment) [1]. Because every gene examined is enhanced under stress conditions in the cell wall, Dy absorption by the cell wall suggests cell wall stress. Our preliminary experiments suggest that Dy induces cell wall stress, because Dy accumulated in both the cell surface and intracellular component, and they also suggest that the rate of saccharide component increase changes under Dy-absorbing conditions, while the chitin concentration tends to increase in the cell wall (unpublished data). In another experiment, it was found that intracellular oxidation induced by Dy absorption induced oxidative damage to the cellular membrane because of the enhanced expression of OLE1, which is an endoplasmic reticulum membrane protein; it is a Δ-9 fatty acid desaturase involved in monounsaturated fatty acid synthesis, responsible for palmitoleic acid and oleic acid production and needed for cell membrane organization [1,13] and its protection against damage caused by oxidative stress induced by Cd, Cu, and Cr [1].
In contrast, ATP14 was downregulated. ATP14 is known as the “h” subunit of the Fo section of mitochondrial H+-Fo-F1 ATP synthase (F-ATP synthase), which is involved in ATP synthase activity and ATP synthase complex assembly in mitochondria [1]. A defect in subunit h results in a respiratory-deficient phenotype by the insufficient ATP synthesis in the respiratory pathway, leading to an absence of growth on glycerol [1]. Our preliminary experiments showed that S. cerevisiae could not grow on glycerol as a carbon source in a Dy-containing medium and that the cellular ATP concentration tended to decrease, while the mitochondrial function was unknown (unpublished data). F-ATP synthase converts ADP into ATP by transporting protons generated in the intermembrane space by respiratory complex III (cytochrome bc complex) into the mitochondrial matrix [1]. Thus, the increase in intracellular ROS in Dy-absorbing yeast cells is suggested to be caused by an increase in protons in the mitochondrial intermembrane space, caused by the depletion of subunit h due to decreased ATP14 expression. A nonfunctional h subunit is known to cause mitochondrial instability and injury to the respiratory pathway. The yeast growth repression in the Dy-containing medium is also attributed to mitochondrial damage. Moreover, it is recognized that some genes linked to mitochondrial metabolism processes, such as gluconeogenesis, pyruvate metabolism, and monocarboxylic acid metabolism, are downregulated after 18 h of culture, and those linked to processes such as organic acid biosynthesis are downregulated after 24 h of culture (Figure S2). Our preliminary studies have shown that the mRNA level of some genes involved in gluconeogenesis is decreased, according to qRT-PCR. It is unclear what mitochondrial function is related to Dy absorption.
This study was performed under more acidic conditions (pH 3.5) than those used for typical yeast growth (pH 5.5–6.5) because Dy(CH3COO)3 precipitates in these conditions. If it dissolves, this pH shift may affect Dy absorption. In the red yeast Rhodotorula mucilaginosa, it is reported that interactions with curium ions will make this radionuclide more mobile and allow it to reach the biosphere at circumneutral and alkaline pH values [14]. When the other two concentrations, 0.05 and 0.15 mM of Dy(Ch3COO)3, were analyzed, yeast growth tended to be better at 0.05 mM than at 0.1 mM; however, significant differences between the 0.05 mM and 0.1 mM conditions were not recognized, and Dy was precipitated at 0.15 mM under our culture conditions. Moreover, the effect of precipitated Dy is unknown and the exact concentration of Dy absorbed was not measured. In subsequent research, the Dy absorption will be analyzed under culture conditions of more than 0.1 mM Dy(Ch3COO)3.
5. Conclusions
The cellular response to lanthanides is poorly understood. We found little evidence of this response in Dy3+-treated S. cerevisiae. It was shown that some of the absorbed Dy was adsorbed by the cell wall, while some accumulated in the intracellular fraction. Dy on the cell surface causes cell wall stress and leads to cell wall reconstruction through chitin. However, Dy accumulation in cells is thought to induce mitochondrial stress and ROS production. In mammalian cells, mitochondrial stress has pathogenic effects such as inducing apoptosis. Treating S. cerevisiae with lanthanides such as Dy may provide a novel technique for protection against these pathogenic effects in other eukaryotic cells such as human cells.
Supplementary Materials
The following supporting information can be downloaded at https://www.mdpi.com/article/10.3390/app15084426/s1, Figure S1: Effect of Dy on yeast growth. Figure S2: Classification of the DEGs into GO categories for yeast cells cultured with 0.1 mM Dy for 18 and 24 h. Table S1: Primer sequences used in qRT-PCR.
Author Contributions
Conceptualization, M.K.; methodology, M.K. and S.Y.; software, S.Y.; validation, M.K. and S.Y.; formal analysis, M.K. and S.Y.; investigation, M.K.; resources, M.K.; data curation, M.K.; writing—original draft preparation, M.K.; writing—review and editing, M.K.; project administration, M.K.; funding acquisition, S.Y. All authors have read and agreed to the published version of the manuscript.
Funding
This research received no external funding.
Institutional Review Board Statement
Not applicable for studies not involving humans or animals.
Informed Consent Statement
Not applicable.
Data Availability Statement
Data are available in a publicly accessible repository. The original RNA-seq data presented in this study are openly available in the NCBI BioProject database at ID PRJNA1242481.
Acknowledgments
We are grateful to Professor Furuta (Research Institute of Microbial Control, Osaka Metropolitan University) for the technical advice.
Conflicts of Interest
The authors declare no conflicts of interest.
References
- Kishida, M.; Kakita, K. Dysprosium absorption of aluminum tolerant- and absorbing-yeast. Appl. Sci. 2022, 12, 4352. [Google Scholar] [CrossRef]
- Pallares, R.M.; David Faulkner, D.; An, D.D.; Solène Hébert, S.; Loguinov, A.; Proctor, M.; Villalobos, J.A.; Bjornstad, K.A.; Rosen, C.J.; Vulpe, C.; et al. Genome-wide toxicogenomic study of the lanthanides sheds light on the selective toxicity mechanisms associated with critical materials. Proc. Natl. Acad. Sci. USA 2021, 118, e2025952118. [Google Scholar] [CrossRef] [PubMed]
- Yoshihara, S.; Yamamoto, K.; Nakajima, Y.; Takeda, S.; Kurahashi, K.; Tokumoto, H. Absorption of zinc ions dissolved from zinc oxide nanoparticles in the tobacco callus improves plant productivity. Plant Cell Tissue Organ Cult. (PCTOC) 2019, 138, 377–385. [Google Scholar] [CrossRef]
- Terashima, H.; Yabuki, N.; Arisawa, M.; Hamada, K.; Kitada, K. Up-regulation of genes encoding glycosylphosphatidylinositol (GPI)-attached proteins in response to cell wall damage caused by disruption of FKS1 in Saccharomyces cerevisiae. Mol. Gen. Genet. 2000, 264, 64–74. [Google Scholar] [CrossRef] [PubMed]
- Queiroz, M.G.; Elsztein, C.; Strahl, S.; de Morais Junior, M.A. The Saccharomyces cerevisiae Ncw2 protein works on the chitin/β-glucan organisation of the cell wall. Antonie Van Leeuwenhoek 2021, 114, 1141–1153. [Google Scholar] [CrossRef] [PubMed]
- Toh-e, A.; Yasunaga, S.; Nisogi, H.; Tanaka, K.; Oguchi, T.; Matsui, Y. Three yeast genes, PIR1, PIR2 and PIR3, containing internal tandem repeats, are related to each other, and PIR1 and PIR2 are required for tolerance to heat shock. Yeast 1993, 9, 481–494. [Google Scholar] [CrossRef] [PubMed]
- Kapteyn, J.C.; Van Egmond, P.; Sievi, E.; Van Den Ende, H.; Makarow, M.; Klis, F.M. The contribution of the O-glycosylated protein Pir2p/Hsp150 to the construction of the yeast cell wall in wild-type cells and beta 1, 6-glucan-deficient mutants. Mol. Microbiol. 1999, 31, 1835–1844. [Google Scholar] [CrossRef] [PubMed]
- Cabib, E. Two novel techniques for determination of polysaccharide cross-links show that Crh1p and Crh2p attach chitin to both beta (1-6)- and beta (1-3)-glucan in the Saccharomyces cerevisiae cell wall. Eukaryot. Cell 2009, 8, 1626–1636. [Google Scholar] [CrossRef] [PubMed]
- Devenish, R.J.; Prescott, M.; Roucou, X.; Nagley, P. Insights into ATP synthase assembly and function through the molecular genetic manipulation of subunits of the yeast mitochondrial enzyme complex. Biochim. Biophys. Acta 2000, 1458, 428–442. [Google Scholar] [CrossRef] [PubMed]
- Silver, N.; Best, S.; Jiang, J.; Thein, S.L. Selection of housekeeping genes for gene expression studies in human reticulocytes using real-time PCR. BMC Mol Biol. 2006, 7, 33. [Google Scholar] [CrossRef] [PubMed]
- Schmittgen, T.D.; Livak, K.J. Analyzing real-time PCR data by the comparative C(T) method. Nat. Protoc. 2008, 3, 1101–1108. [Google Scholar] [CrossRef] [PubMed]
- Vaudano, E.; Noti, O.; Costantini, A.; Garcia-Moruno, E. Identification of reference genes suitable for normalization of RT-qPCR expression data in Saccharomyces cerevisiae during alcoholic fermentation. Biotechnol. Lett. 2011, 33, 1593–1599. [Google Scholar] [CrossRef] [PubMed]
- Martin, C.E.; Oh, C.S.; Jiang, Y. Regulation of long chain unsaturated fatty acid synthesis in yeast. Biochim. Biophys. Acta 2007, 1771, 271–285. [Google Scholar] [CrossRef] [PubMed]
- Lopez-Fernandez, M.; Moll, H.; Merroun, M.L. Reversible pH-dependent curium(III) biosorption by the bentonite yeast isolate Rhodotorula mucilaginosa BII-R8. J. Hazard Mater. 2019, 370, 156–163. [Google Scholar] [CrossRef] [PubMed]
Disclaimer/Publisher’s Note: The statements, opinions and data contained in all publications are solely those of the individual author(s) and contributor(s) and not of MDPI and/or the editor(s). MDPI and/or the editor(s) disclaim responsibility for any injury to people or property resulting from any ideas, methods, instructions or products referred to in the content. |
© 2025 by the authors. Licensee MDPI, Basel, Switzerland. This article is an open access article distributed under the terms and conditions of the Creative Commons Attribution (CC BY) license (https://creativecommons.org/licenses/by/4.0/).