1. Introduction
Coronavirus disease (COVID-19) is an infectious disease that emerged in December 2019 and has since spread throughout the world and is likely to spread further in many countries, including Thailand [
1]. Most patients (80%) recover without hospitalization [
1]. The disease can be transmitted from person to person by droplets of mucus or saliva from the nose or mouth of a COVID-19 carrier [
2]. Therefore, it is imperative that we keep a distance of at least 1 m from other people [
1]. COVID-19 spreads more quickly than Middle East respiratory syndrome (MERS) and severe acute respiratory syndrome (SARS). The virus spread rapidly worldwide due to increased globalization, the outbreak occurring during a festival, and the extensive transportation network [
3]. Several factors affect the severity of COVID-19 symptoms, including elevated body temperature (>37.5 °C), chills, pneumonia seen on chest X-rays, and diabetes [
4]. Patients who experience chills, pneumonia, or diabetes are at a higher risk of developing severe COVID-19 [
4,
5]. Artificial intelligence (AI) using deep learning methods has achieved up to 89.5% accuracy in diagnosing COVID-19 from CT scans, which could lead to earlier detection, better management, and improved patient outcomes [
6].
Currently at the time of writing this, in Thailand, a total of 4,738,988 cases have been reported, from December 2019 to May 2023 [
7]. The COVID-19 outbreak in Thailand is still going strong. Even though the country’s population has been vaccinated in numerous locations, some of the hospitals did not have enough beds to treat COVID-19 patients, especially when there were significant outbreaks [
8]. The Ministry of Public Health’s Department of Disease Control has taken steps to bring affected patients into the medical system. Home isolation (HI), community isolation (CI), field hospitals, and primary hospitals were all allocated and prescribed according to the symptoms. The Guidelines for Home Isolation Service Management, Department of Medical Services, Ministry of Public Health said that out of a total of 2814 persons, the majority of whom are accepted patients from In-Service (93%), would join the home isolation program at Rajavithi Hospital over the course of three months (2 July 2021–30 September 2021). The patients’ ages ranged from 20 to 59, and 60% of them reside in the central Bangkok region. The majority of patients—77% of all patients—were released after receiving care for 14 days [
9].
Technology is advancing at a rapid pace in today’s world. The Internet of Things (IoT) will help devices connect and share information. The IoT is viewed not as a network of computer systems, but as a system of embedded devices. The more devices are connected, the more important IoT technology becomes [
10]. For example, to enable these devices to communicate with other systems or devices in the network to reuse the information, radio frequency identification (RFID) devices and sensors (Sensors) are integrated. This gives rise to wireless sensor networks (WSNs) that transmit data with the IoT [
11]. Additionally, IoT technology has been adapted for various research applications in healthcare and wearable devices. These include smart home systems for the elderly, which use sensors to monitor health and support independent living [
12]; e-textiles with wireless sensors for tracking physiological parameters and patient location in hospitals [
13]; smart shoes that measure foot pressure during daily activities [
14]; and health monitoring systems that use wearable sensors to track body temperature and heart rate [
15,
16]. Due to remarkable technological advances, artificial intelligence (AI) has become increasingly integrated into healthcare and medical sciences [
17]. An assessment of an AI framework within the healthcare sector in the UAE is focused on improving patient outcomes through the application of techniques such as machine learning and computer vision [
18]. A previous study discusses the role of AI in pandemic management, emphasizing past research on predictive modeling and diagnostics [
19].
Based on data from the COVID-19 epidemic in many countries, the importance of social distancing and self-quarantine as standard practices during the coronavirus epidemic is recognized. The previous limitations on model accuracy, integration with human expertise [
19], and other technologies such as IoT, along with the need for ongoing updates, restrict AI’s effectiveness in responding to COVID-19. Furthermore, monitoring patient transfers for hospitals and healthcare organizations should be considered, especially due to the significant impact COVID-19 has had on the overall supply chain. In this context, the research question that is addressed in this study is as follows: How effective is the use of IoT-based wearable devices, AI facial recognition, and data visualization tools in supporting remote health monitoring and emotional profiling of COVID-19 patients in home isolation? To answer this question, the paper proposes the system monitored and surveilled COVID-19 patients’ health indicators in their homes with wearable technology and AI. These results could be used in the planning and preparation of equipment and beds to be adequate and sufficient for the evolving situation of the COVID-19 epidemic in a timely manner. This can improve the prevention, monitoring, and control of the spread of COVID-19 (or a similar future epidemic) in the community. In summary, the contributions of this paper can be delineated as follows:
We developed a monitoring and surveillance system for emerging infectious diseases, focusing on COVID-19 patient profiling using IoT-based wearable devices and AI;
We employed a classification technique to categorize patients into two groups: those with a positive mood and those with a negative mood, based on the most suitable model.
The remainder of this paper is organized as follows:
Section 2 describes the System Analysis and Design, System Development, Data Collection, Model Evaluation, and Implementing the model.
Section 3 presents the results of Data validation from wearable devices, and developing web applications.
Section 4 discusses the findings and limitations of the study. Finally,
Section 5 concludes the paper with directions for future research.
2. Materials and Methods
2.1. System Analysis and Design
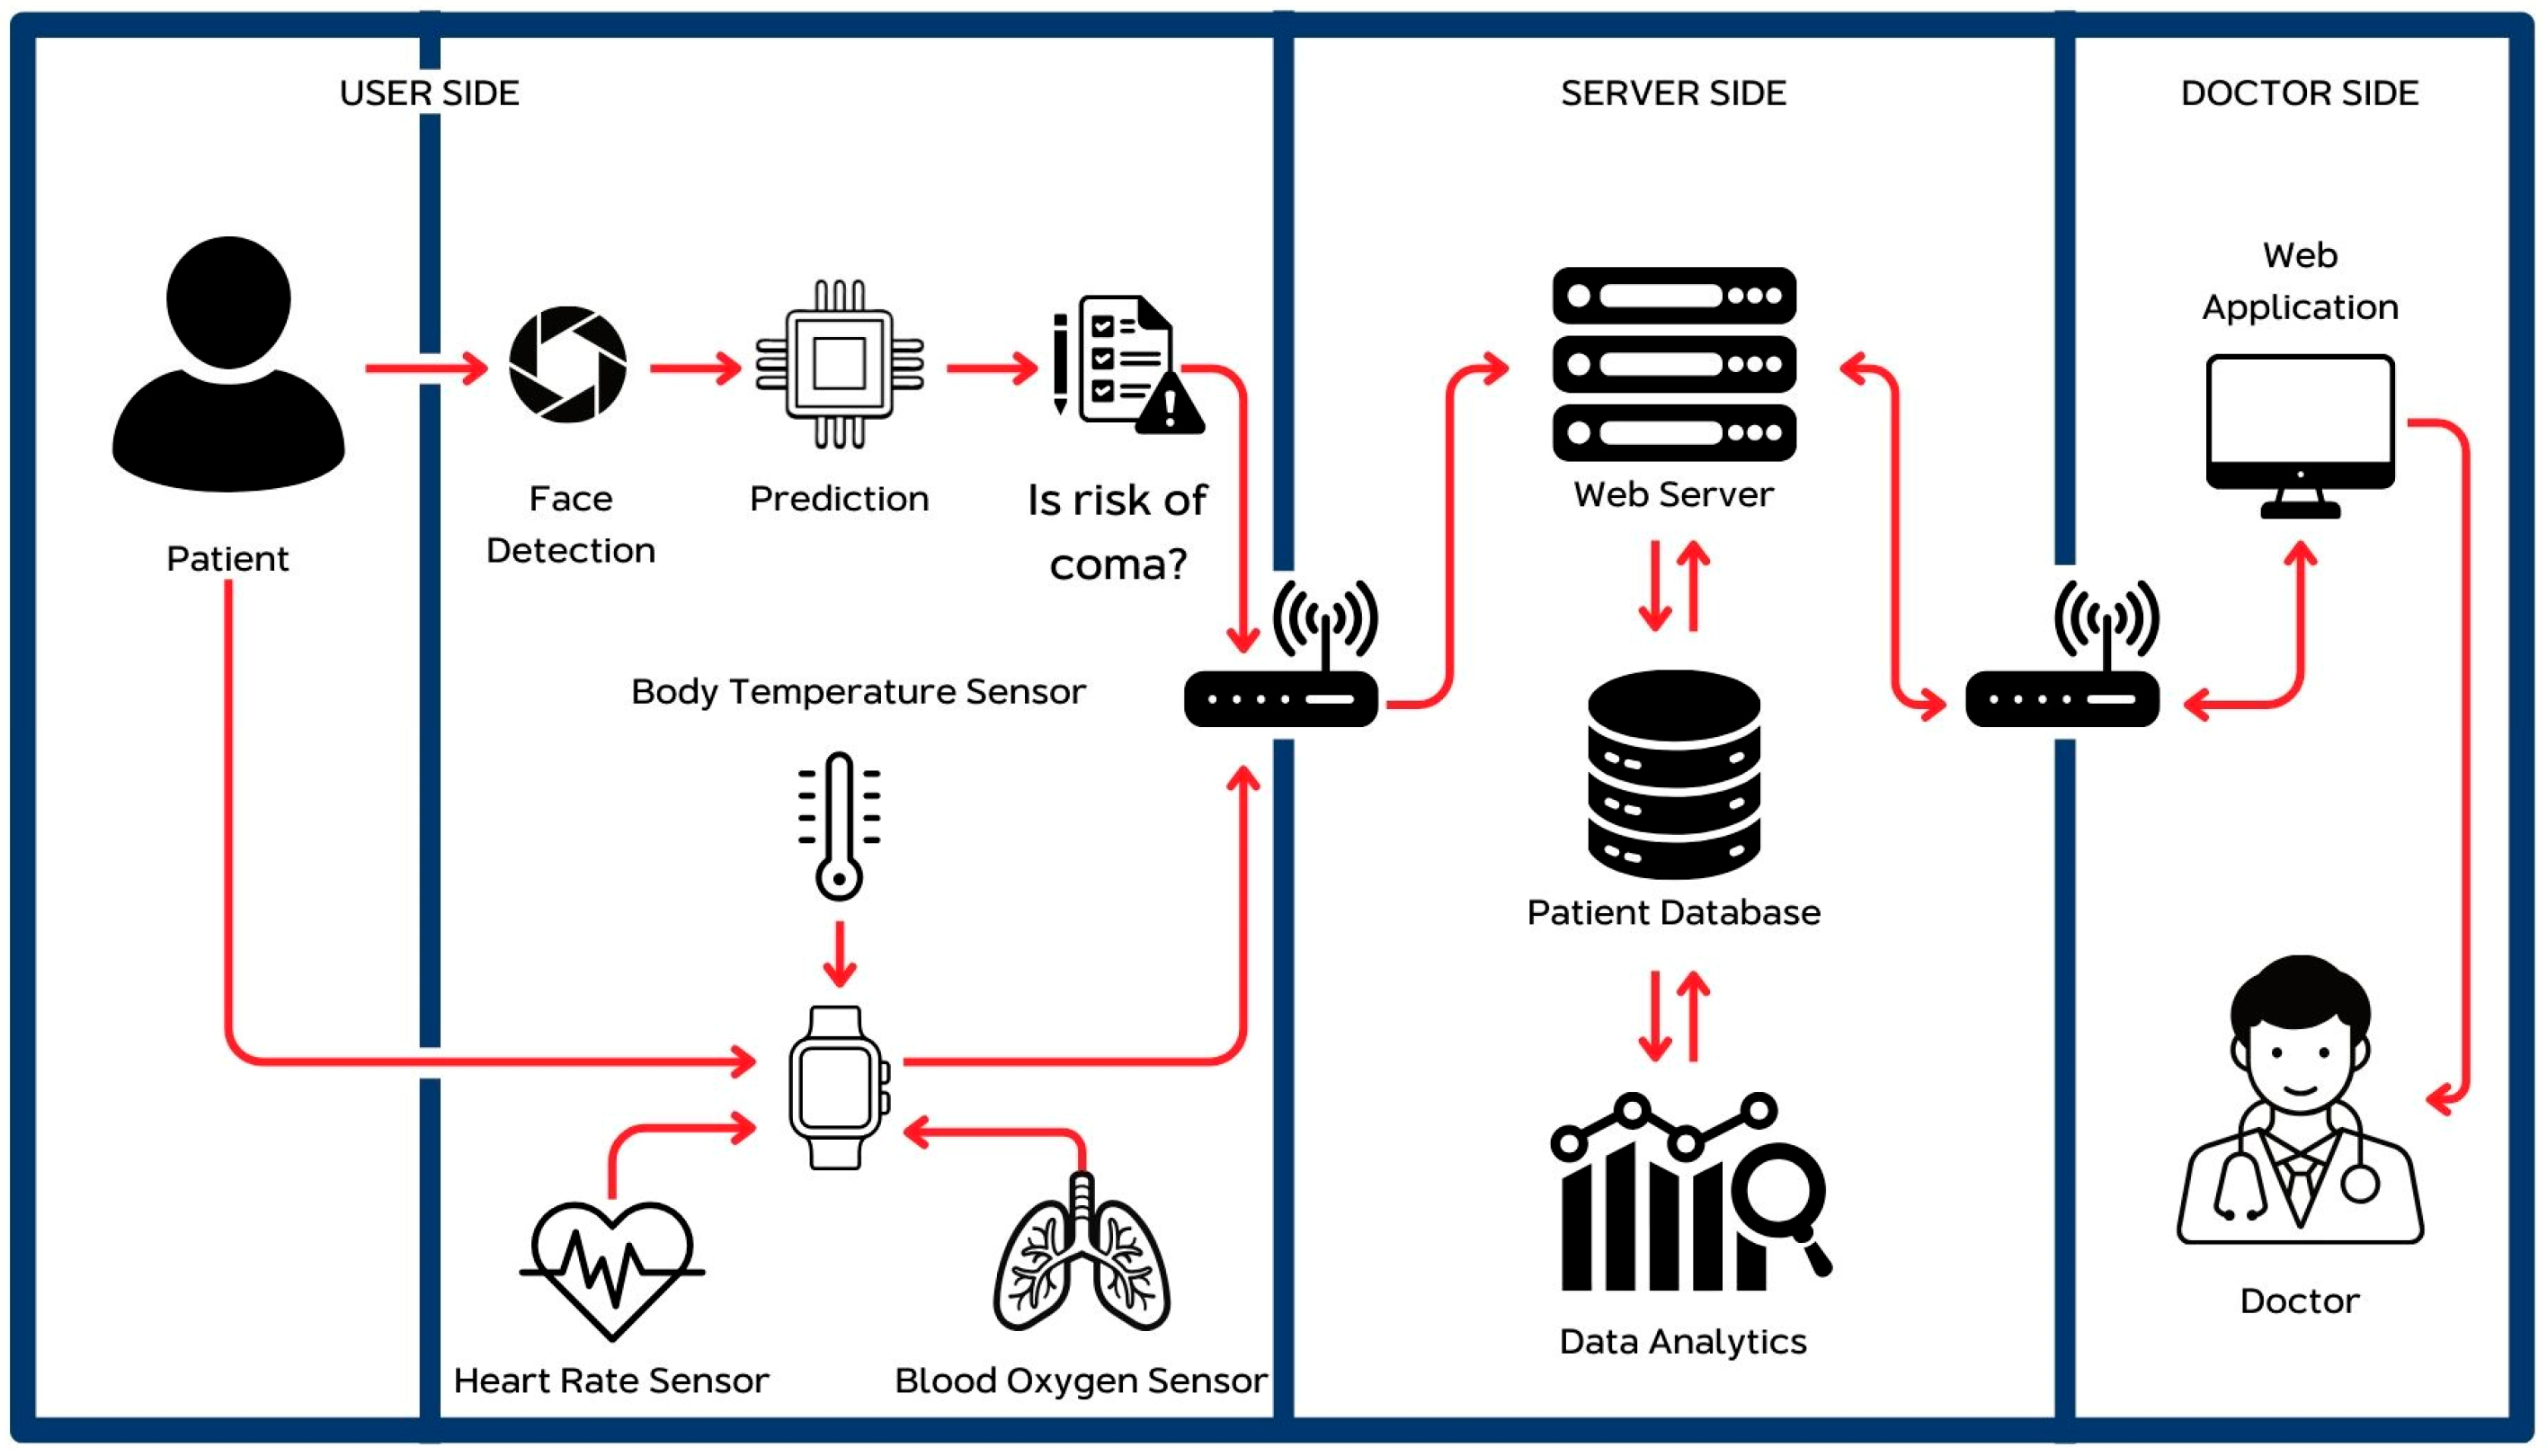
This system was divided into three parts according to the nature of the work and the desired results, as follows: developing an AI camera device, developing Wearable IoT devices, and developing a web application to display information. This led to a system architecture conceptual model that defines the structure, behavior, and more of a system, shown in
Figure 1.
The system measures heart rate, blood oxygen level, and body temperature, with a sensor attached to the patient, every 1 min using the MAX30102 sensor (Analog Devices, Wilmington, MA, USA) for the first two, and the AHT20 sensor (Adafruit, New York, NY, USA) for temperature using an IoT wearable device. Facial emotions are also captured using an AI camera device. All data are sent to the database via a Wi-Fi signal (
Figure 1). MySQL (Version 8.0.40) is used for database management, and an Apache (Version 2.4) web server is used to contact the database system and internet to display the results through the web application. The information is received and analyzed to determine the level of risk that medical treatment is imminently required using the most suitable model. The results from data analysis will be notified to the user via the system. The system allows users to log in to the system for data collection. The patient’s information is displayed and status updates are immediate. There are 2 types of users including medical staff and administrators.
2.2. System Development
IoT wearable devices: The architecture of wearable IoT devices is shown in
Figure 2a. The wearable device allows the system to receive information from the sensor devices.
Web application: There is a three-tier architecture used in this study to create web applications including presentation tier, applications tier, and data tier.
AI camera: An AI camera device was developed, and cameras took videos of COVID-19 patients, which were then sent to the system for prediction of any abnormalities (
Figure 2b). In this study, a webcam was connected to a Jetson Nano board, which was connected to Wi-Fi and sent data to an API that was created. The API then stored the data in a database (
Figure 2b).
2.3. Data Collection and Preprocessing
The health dataset was collected into the monitoring system to monitor the symptoms of COVID-19 patients in home isolation for a total of 1200 records from August 2022 to February 2023, complete with preprocessed data. Ethical review and approval were waived for this study due to the non-interventional nature of the workshop and the complete anonymization of all data collected. The data collection for this study is derived from a workshop focused on assessing the efficacy of a wearable device and evaluating the performance of machine learning algorithms. All 30 participants voluntarily agreed to contribute data over a two-week period, and written informed consent was obtained from each participant prior to data collection. This study will prioritize participant privacy by anonymizing data. Personal identifiers will be removed, and we will use pseudonyms, masking, and tokenization. We will protect the data with encryption, restrict access, and ensure secure storage. Data retention will be minimal, and information will be securely deleted upon request. The study will comply with relevant data protection laws and ethical standards. The device is currently in use with actual patients. Data transmissions from wearable devices were used to record heart rate, blood oxygen level (SpO
2), and body temperature. A written informed consent has been obtained from all participants involved in the study. Data collection started from the moment the patient was registered in the system, and the patient’s data were immediately deleted upon updating their status to recovered. Cleaning the data from the MAX30102 sensor and the AHT20 sensor measuring body temperature may involve removing noise, filtering outliers, and handling any missing or erroneous readings. The Wi-Fi connection is used to send the prepared data to a database system (
Figure 3).
2.4. Machine Learning Algorithms and Statistical Analysis
In this study, we used three Machine Learning algorithms for classification namely multilayer perceptron (MLP), support vector machine (SVM), and Random Forest. MLP is a feedforward neural network that consists of an input layer, hidden layers, and an output layer. Each layer comprises interconnected neurons through adjustable weights, which can be optimized through training using the backpropagation technique and an activation function to learn complex data patterns. MLP excels in non-linear classification tasks [
20]. SVM is a statistical learning technique used for data classification by creating the most optimal hyperplane to separate data groups. It utilizes a subset of data points known as support vectors. A key feature of SVM is its ability to handle high-dimensional data and non-linear data patterns using the kernel trick, which transforms the data into a higher-dimensional space where it becomes linearly separable [
21]. Random Forest is an ensemble learning algorithm that consists of multiple decision trees. Each tree is trained using a randomly selected subset of the data (bootstrap sampling) and employs majority voting to produce accurate predictions. A key strength of Random Forest is its robustness against noisy data and its ability to reduce overfitting [
22].
To validate data from wearable devices and medical devices, we employed Pearson correlation and linear regression analysis. Correlation analysis is a statistical method used to assess the relationship between two variables. The Pearson correlation coefficient ranges from −1 to +1, indicating the strength and direction of the relationship. Additionally, R-squared (R2), known as the coefficient of determination, is a statistical measure used in regression analysis to represent the proportion of variance in the dependent variable that can be explained by the independent variable(s). All significance tests were conducted as two-tailed tests.
2.5. Model Evaluation
Evaluating and identifying the most effective model requires assessing the performances of the various classifiers tested. There are several alternative or complementary methods for this, and here several evaluation metrics are employed, including prediction accuracy, recall, precision, and the F1 score. Classification accuracy typically refers to an easily accepted measure of accuracy, namely the fraction of correct calls among the total number of input cases Equation (1).
However, this measure is considered effective only when there is a relatively balanced distribution of samples across each class (and we give equal cost to each misclassification, or actually specify no cost for those but evaluate only by right or wrong).
The F1 score is defined as the harmonic mean of precision and recall, so its values range from 0 to 1 because both precision and recall are in this range. This metric indicates the accuracy of your classifier, reflecting the proportion of correctly classified instances, as well as its reliability, demonstrating that it does not fail (misclassify) in a substantial number of instances [
23].
Achieving a high precision with a low recall results in exceptional accuracy, albeit at the cost of overlooking numerous instances that are challenging to classify. An increase in the F1 score indicates an improvement in the model’s performance. This relationship is shown in Equation (2):
The F1 score aims to establish a balance between precision and recall.
Precision is defined as the ratio of correctly identified positive results to the total number of positive results predicted by the classifier Equation (3).
The recall is defined as the ratio of correctly identified positive results to the total number of relevant samples, which includes all samples that ought to have been recognized as positive Equation (4).
All the models were developed using Python (Version 3.9), a high-level interpreted programming language that is designed for general-purpose use, and for which public domain machine learning libraries are available free of charge.
2.6. Implementing the Model
The model was mounted on an NVIDIA Jetson Nano device (NVIDIA, Santa Clara, CA, USA) with the following specs: GPU: 128-core NVIDIA Maxwell™, CPU: Quad-core ARM
® A57 @ 1.43 GHz, memory: 2 GB 64-bit LPDDR4 25.6 GB/s and connected to a webcam and Wi-Fi to send data to a database. When the system detected that the patient was at risk, it displayed the message “Risky”. However, if the patient was normal, it showed the message “Good”. In cases where the patient’s face was not found on the screen, it displayed “No Face”. We used the classification technique for real-time emotion detection described by Sawangwong et al. [
24].
The researchers applied this model to classify patients according to mood. Positive-mood patients were classified as having normal symptoms, whereas negative-mood patients were classified as having abnormal symptoms (
Table 1). Emotional data in this study serve as supportive signals rather than diagnostic evidence. Negative emotions such as fear, sadness, or anxiety may indicate psychological distress during isolation. When combined with abnormal physiological parameters, these emotional indicators can help prioritize patients for further assessment or support. Emotional distress is a vital indicator of patient vulnerability and significantly influences treatment outcomes. Research has correlated specific emotions—such as anger, sadness, and anxiety—with stress-related diseases, underscoring the link between emotional health and disease progression [
25]. Additionally, pain can exacerbate depressive moods and hinder emotional processing [
26]. Furthermore, emotional well-being impacts social relationships, with variations among individuals with neurodegenerative diseases potentially affecting their caregivers [
27].
3. Results
3.1. Data Validation from Wearable Device
The patient’s body temperature was measured with an AHT20 sensor and was compared with a commercial non-contact sensor. The maximum relative error was computed as 0.97%, whose value depends upon environmental conditions, such as humidity as well as the accurate placement of the sensor.
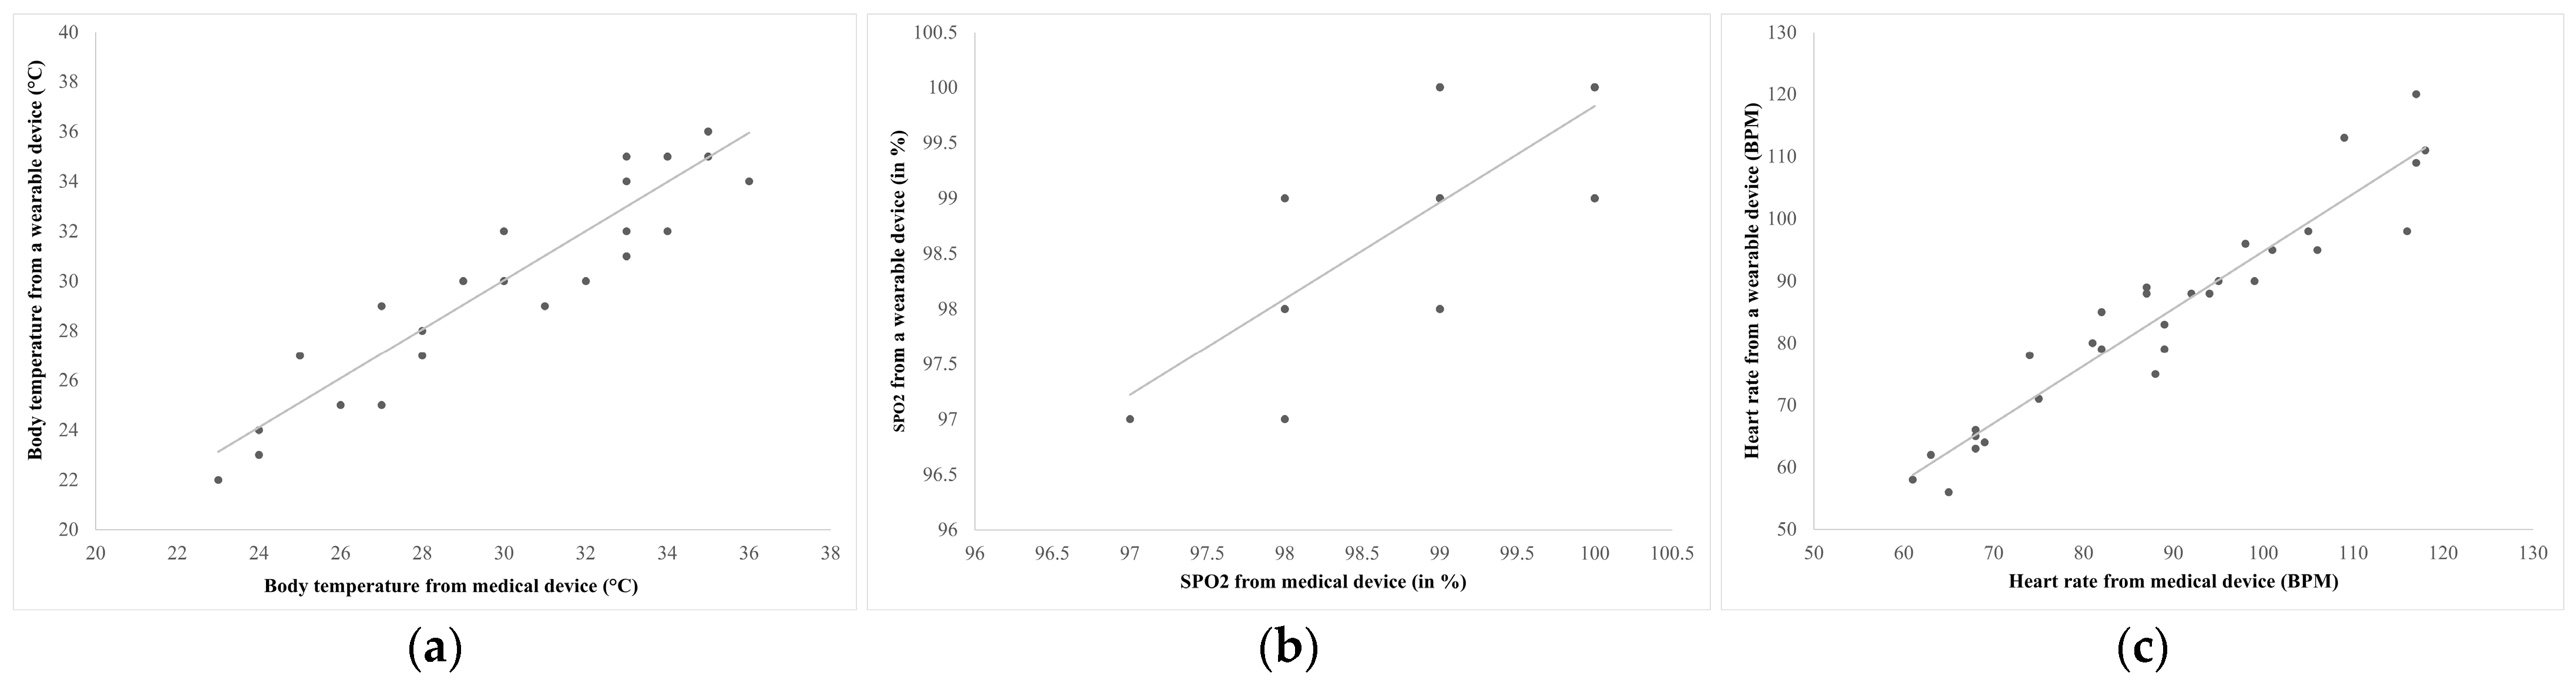
When we compared the results from wearable devices with medical devices, we found that there was a strong correlation between them. The performance evaluation of the sensors in the wearable device was performed by experimenting with measuring body temperature (°C), blood oxygen (in %), and heart rate (BPM), to be compared with readings from medical devices, namely thermometers, pulse oximeters, and blood pressure monitors. Thirty sets of sample data records were collected and analyzed to find the correlations between readings from the sensors and those from the medical devices. This was to assess the effectiveness of sensors in the wearable device and ensure accurate readings, desired to be as similar to medical devices as possible.
Figure 4a shows the correlation of body temperature from the AHT20 sensor of the wearable device to body temperature from the medical device (R = 0.942, r
2 = 0.887).
The oxygen levels of the COVID-19 patients measured by MAX30102 sensors were compared with a medical device (
Figure 4b). The maximum relative error was computed as 1.32% which indicates the high accuracy of the SpO
2 measurement system.
Figure 4b shows the correlation of blood oxygen (SPO2) from the MAX30102 sensor in a wearable device with that from a medical device (R = 0.773, r
2 = 0.598).
Heart rates of COVID-19 patients were measured by the MAX30102 sensor and compared with a blood pressure gauge (
Figure 4c). The maximum relative error calculated was 1.13%, indicating high accuracy of the heart rate measurement.
Figure 4c shows the correlation of heart rate from the MAX30102 sensor in a wearable device with that from a medical device (R = 0.955, r
2 = 0.913).
However, the readings from the sensors depend on the surface area in contact with the individual wearable device, pressure, external environmental conditions such as humidity, and the position in which the device is worn.
IoT wearable devices display the data received from the sensor using an Arduino program, which here displays the heart rate and the blood oxygen level. Each reading is checked for reliability, and the correct data will be used in calculations or analysis.
3.2. Results from Developing Web Applications
Data Management: When the device successfully measured the value, it displayed the result on the LCD screen and sent the data to the database using the API that the developer had written. If successful, the API sent a message back to the device, which displayed the words “App to database complete” on both the sending side and the receiving side.
Data Entry: The system is designed to verify permission to add activities with user authentication such as adding, deleting, editing, or updating Patient Information. In addition, the system also provided the Manage Users page for administrators. However, the administrators were not allowed to view any of the patient’s data, they were contacted when the system worked properly.
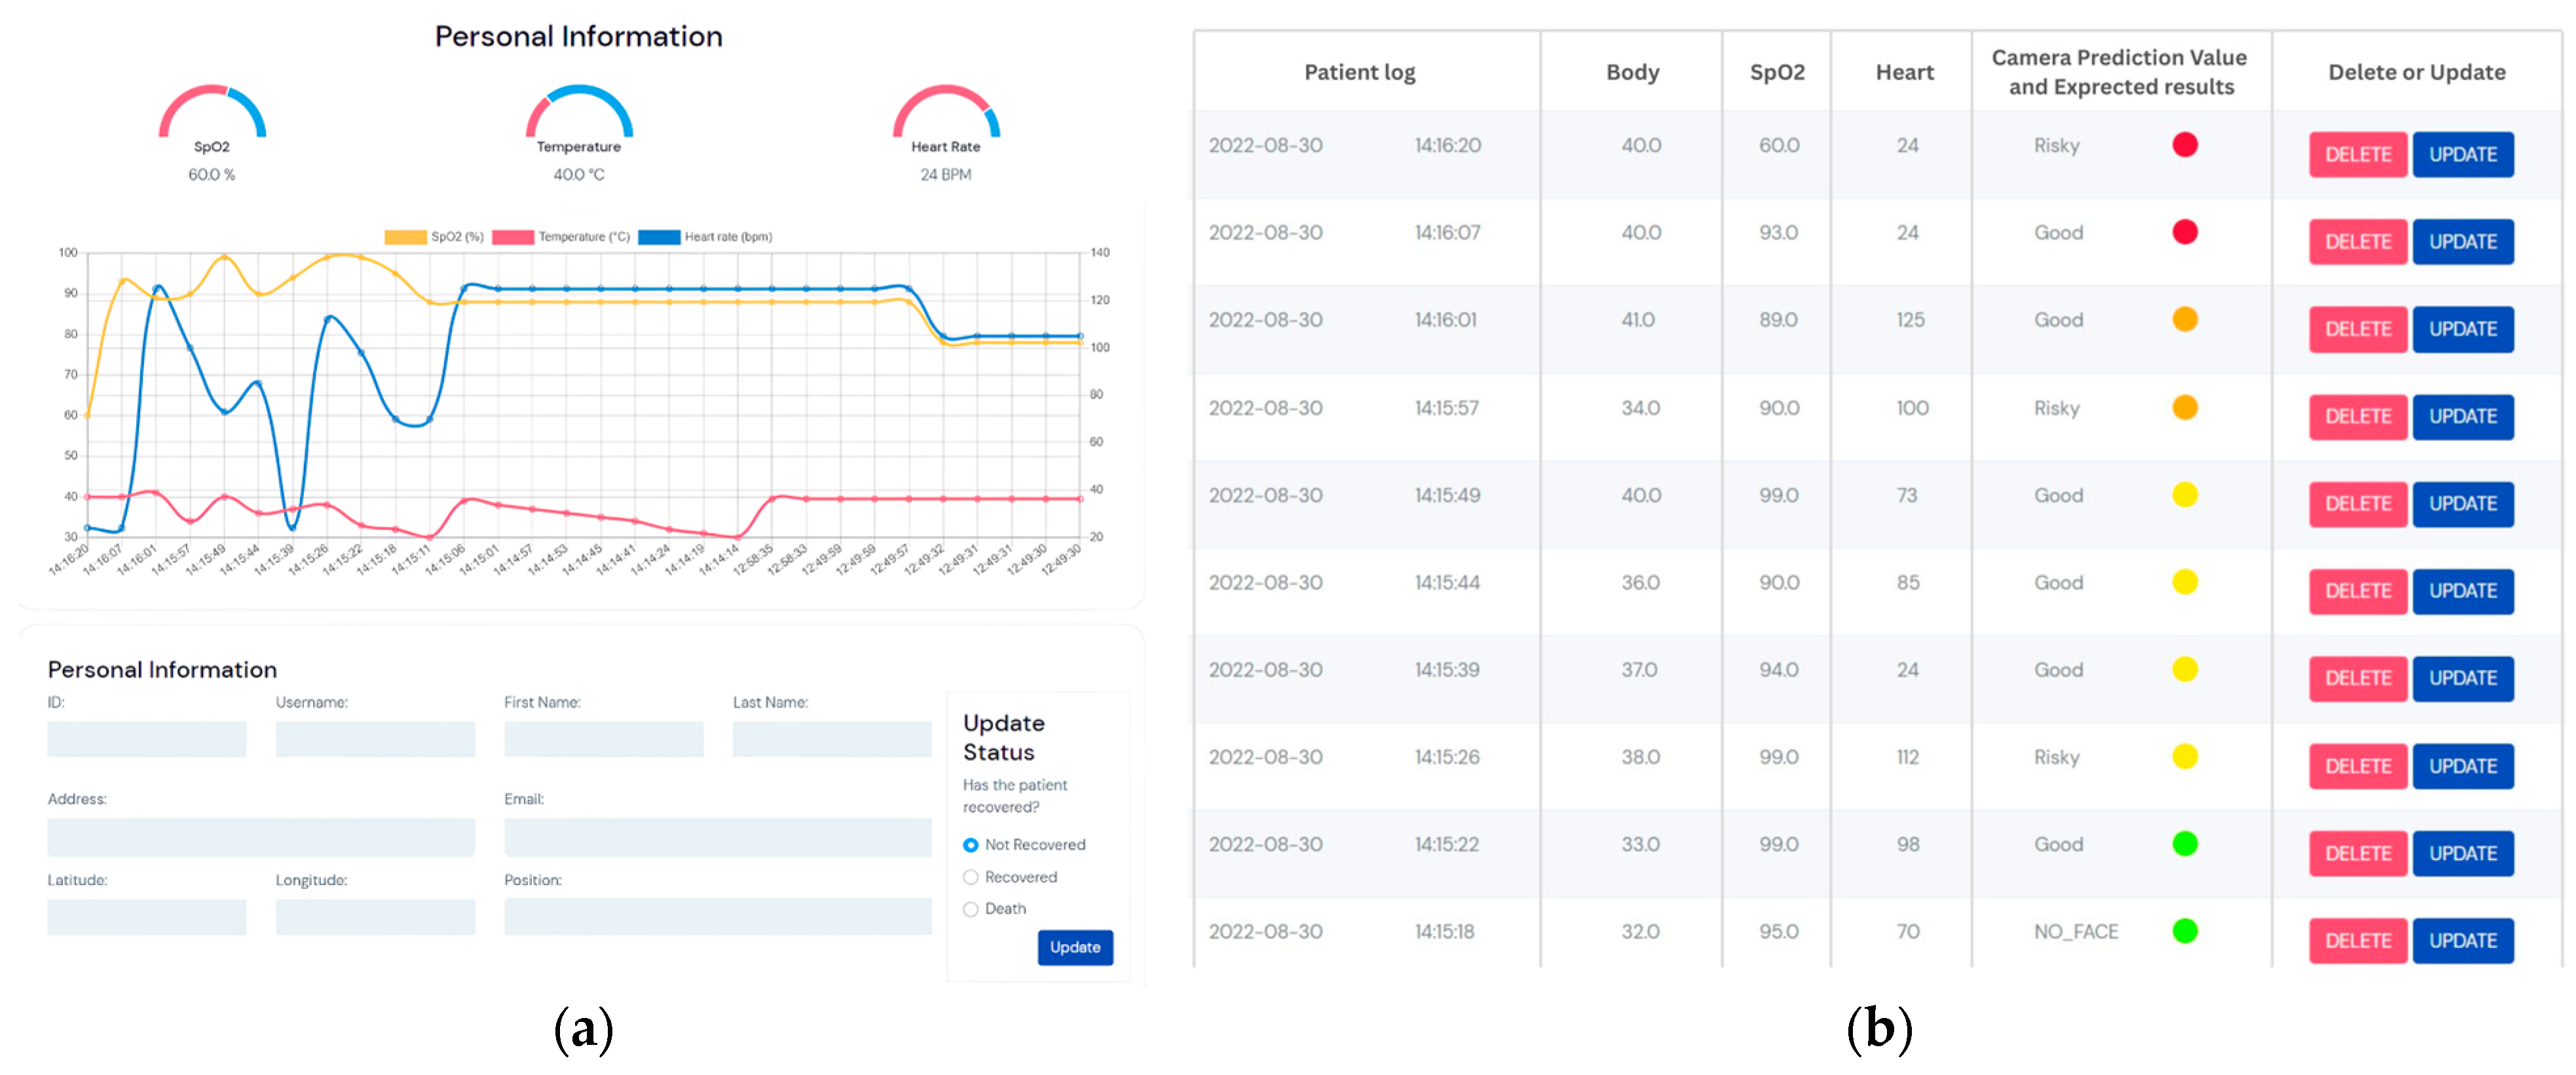
Data Analysis: After successfully logging in through the login page, it led to the homepage of the website, which has a dashboard that summarizes the results of all patients, including the number of recovered patients, patients who needed surveillance, and patients who had died during monitoring. There was also a data analytics page, a user management page, and an administrator profile page. The system provides details of each user in the form of a dashboard and shows the health information in the form of a graph (
Figure 5a). The blood oxygen level information is shown with a yellow line, the body temperature with a red line, and the heart rate with a blue line. Additionally, there is a history of the patient, and the bottom table shows the data received from the sensor and the AI camera. The risk level is indicated by different-colored dots in four levels: normal (green dot), caution (yellow dot), caution level 2 (orange dot), and high-risk (red dot) (
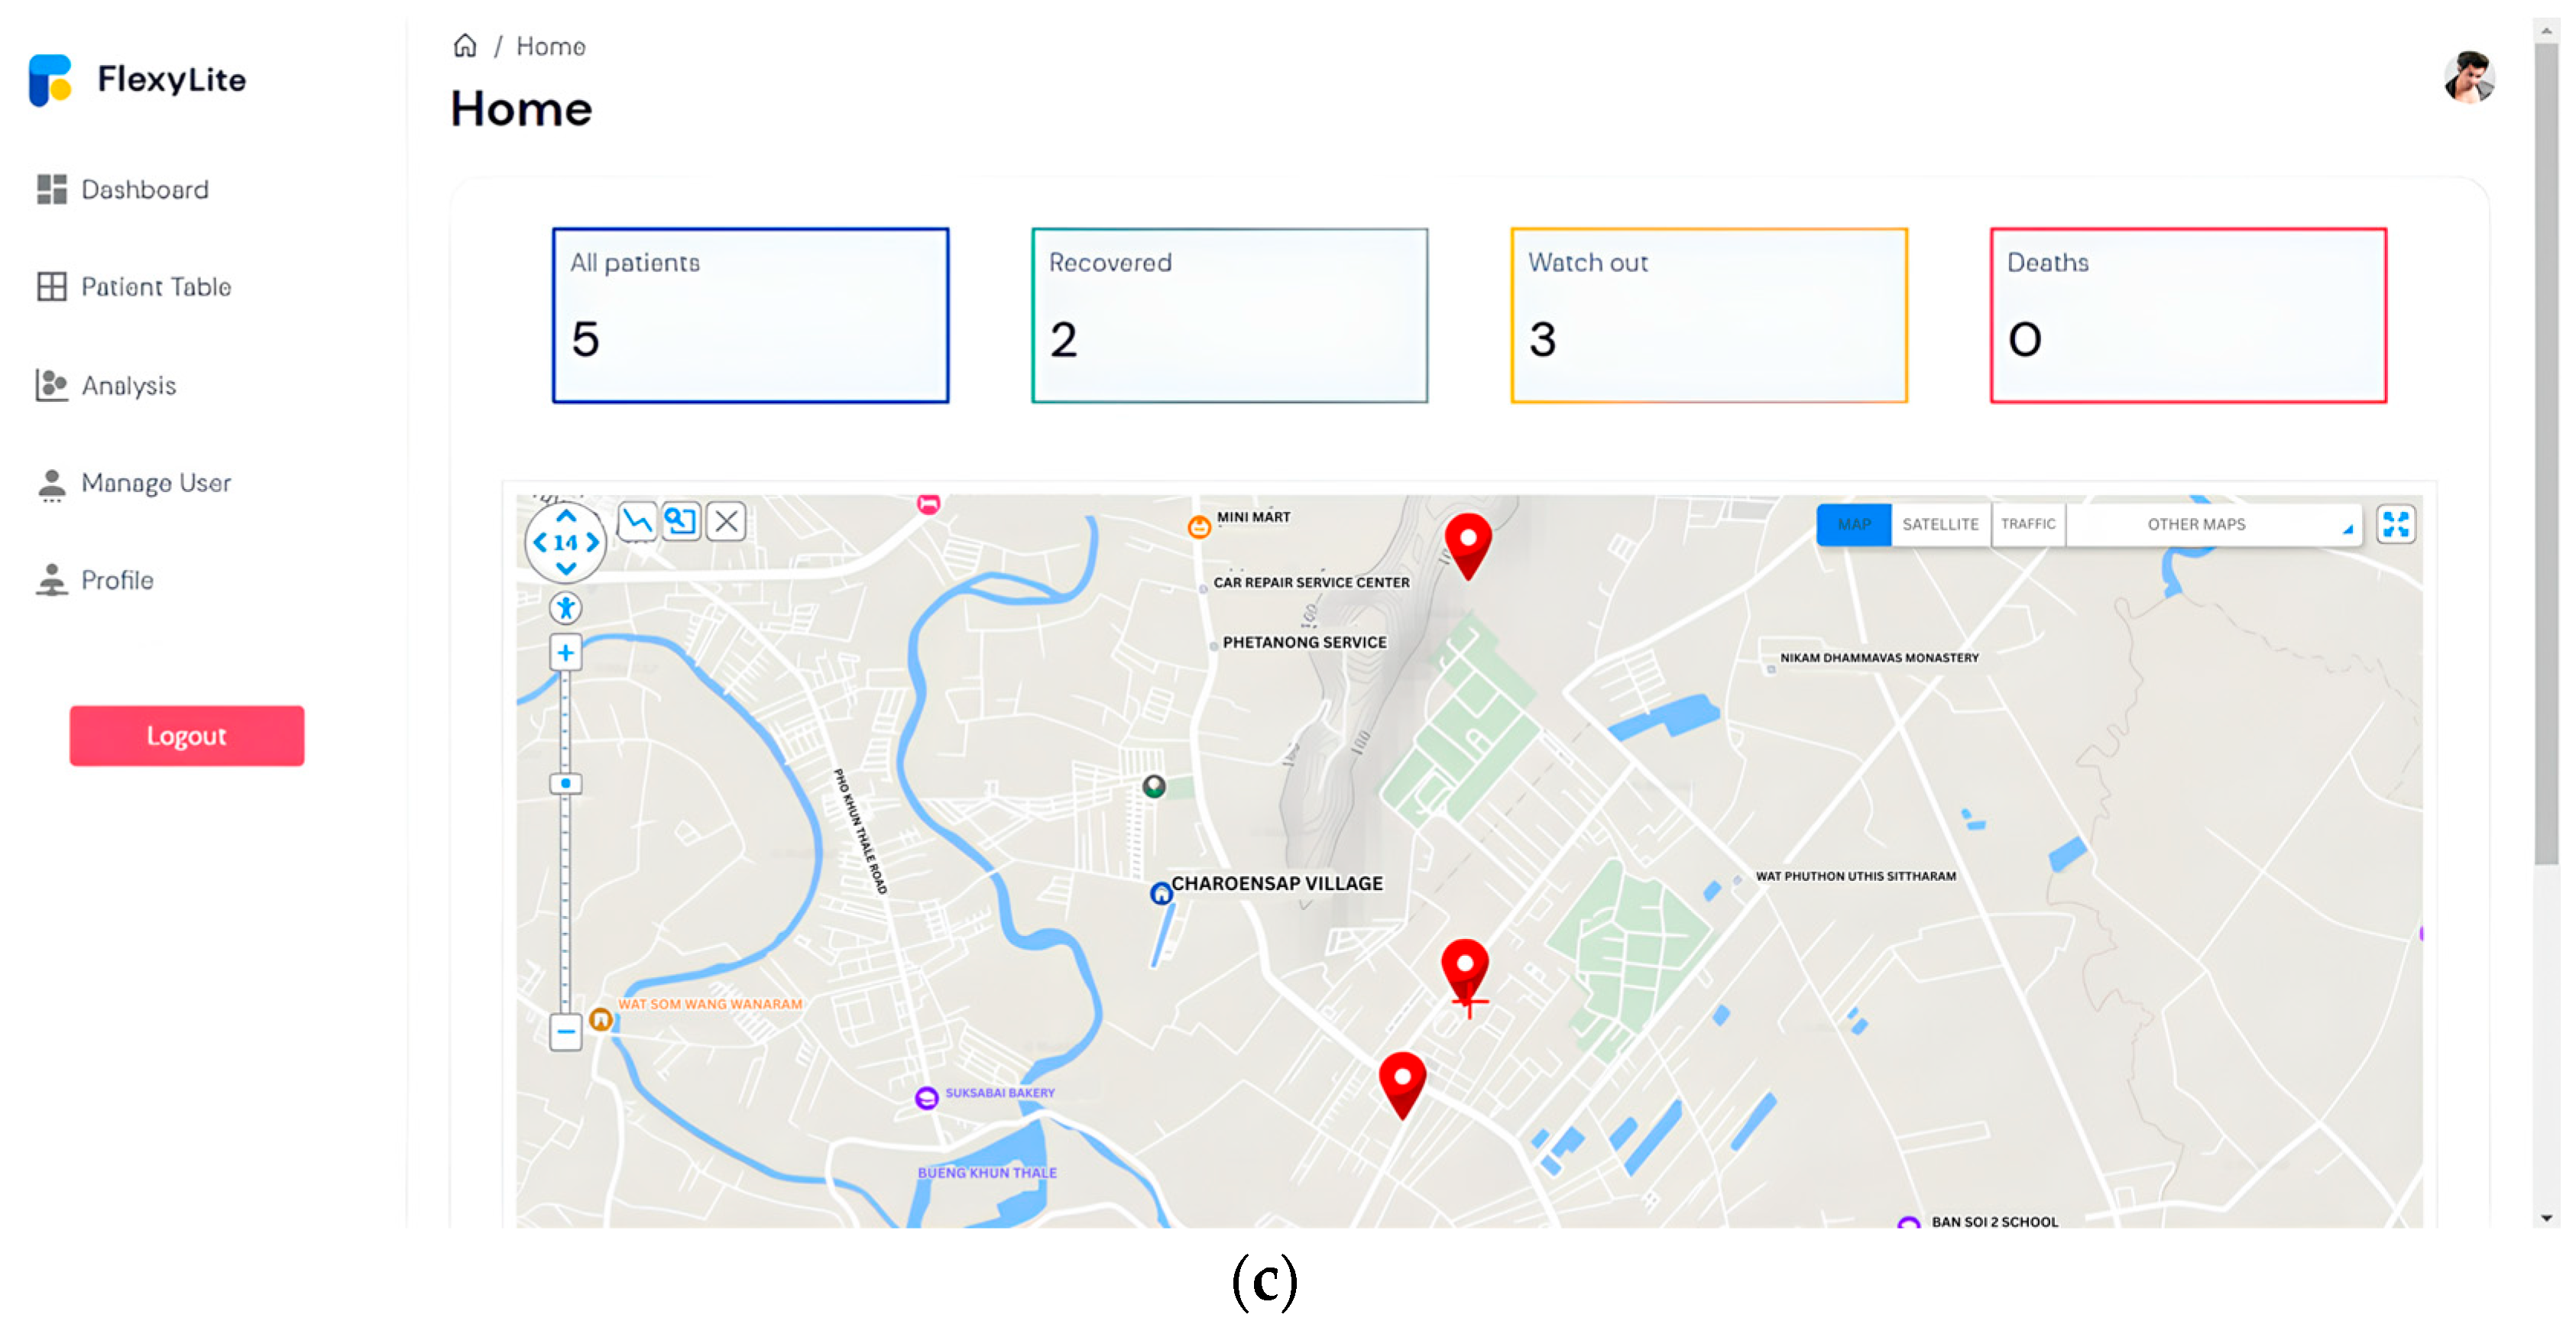
Figure 5b). The system also displayed a map page that could lead to detailed information about each patient (
Figure 5c). The system can take all the information collected from patients such as heart rate, SpO
2, and body temperature, and their correlation coefficient and linear regression model can be generated (
Figure 6a). The system took the information received from the sensor and analyzed the face from the camera to be processed. If specified conditions were met, the system sent a notification via Line Notify, as shown in
Figure 6b. The notification included the patient’s full name and linked the coordinates of the registered patient’s location with the basic information, such as heart rate, blood oxygen, and body temperature (
Figure 6b). The results also show performances of the various classifiers on imbalanced datasets, when tested by the random hold-out technique. The assessment measures accuracy, recall, precision, and F1 score, were used to evaluate the model performances. The results show recall with MLP having the highest weighted average of 76%, and Random Forest having the highest-class macro average of 55%. The most suitable algorithm in this study was Random Forest with an accuracy of 80%, it being the most accurate for calling each class, followed by MLP and SVM both at 78%. The precision, recall, and F1 score are summarized in
Table 2. Based on our findings, we applied the Random Forest algorithm to analyze and classify the patients’ facial expressions comprehensively. This approach provided a better understanding of their emotional responses, thus supporting our research objectives.
4. Discussion
The COVID-19 epidemic has brought about significant changes in the way society functions. One of the most important changes has been the recognition of the importance of social distancing and self-quarantine as standard practices during the coronavirus epidemic. In response to this challenge, researchers have recognized the importance of applying information technology to medicine and public health. This study proposed a system for monitoring and surveillance of COVID-19 patients in home isolation using data transmission from wearable devices. The proposed system was based on IoT technology and used data from COVID-19 patients in Surat Thani province to improve prevention, monitoring, and control of the spread of COVID-19 in the community.
Several studies on remote monitoring have had patients as the subjects. One such study conducted by Bassam et al. [
28] focused on using wearable devices to monitor COVID-19 patients remotely. The study used a wearable device to collect patient data, including heart rate, respiratory rate, and blood oxygen saturation, which were then transmitted to a cloud-based platform for analysis. The results of the study showed that wearable devices were effective in monitoring COVID-19 patients remotely, and they helped healthcare professionals detect potential health risks in a timely manner [
28]. In the part of AI camera devices, machine learning algorithms parse data, learn its properties, and then recognize the same data in real life. To produce a correct output, they require human intervention and a large amount of organized training data for learning classification, prediction, and more [
29,
30]. Such experimental results were acquired by Dhwani Mehta and colleagues [
31].
Artificial intelligence technology has demonstrated significant effectiveness in advancing diagnostic accuracy, optimizing drug discovery processes, and providing real-time decision support to healthcare professionals [
19]. The results of this study have shown the model’s accuracy in identifying patients’ facial emotions. Random Forest is capable of identifying emotions and evaluating their intensity due to its ability to process both numerical and categorical data. The accuracy of Random Forest varies between 71% and 96%, contingent upon the complexity of the features being analyzed. In a prior study conducted by Abdulrahman and Eleyan [
32], simulations were executed and implemented in MATLAB (Version 8.6) utilizing the Japanese female facial expression (JAFFE) and Mevlana University facial expression (MUFE) databases, with the images presented in greyscale TIFF format. The findings indicated that the combination of principal component analysis (PCA) and support vector machine (SVM) achieved a recognition rate of 100% in two instances for JAFFE, while MUFE attained a recognition rate of 87% using the same PCA+SVM approach [
23]. Several elements that might affect the precision of facial expression analysis include: (1) the degree of detail, (2) shifts between expressions, (3) conditions that trigger expressions, (4) the consistency and accuracy of both training and testing datasets, (5) variations in facial features among individuals, (6) head position and complexity of the scene, (7) characteristics of the images, and (8) the connection to non-verbal communication [
33]. Relying solely on facial expressions for emotion recognition is insufficient. A more comprehensive approach that incorporates audio, written expressions from text, and physiological data sourced from wearable devices can significantly enhance classification accuracy and improve the overall efficiency of the model [
34]. However, the previous limitations were identified concerning model accuracy, the integration of human expertise [
19], data privacy, security challenges, and issues related to generalizability and algorithmic bias [
18].
As with any machine learning algorithm, a large amount of training data is required. Videos with varied frame rates, from various viewpoints, with varying backgrounds, with individuals of various genders, nations, races, and so on, must be included in these data. Most publicly available datasets, however, are insufficient. They lack racial and gender diversity, as well as have only a narrow range of emotional expressions. Compared to prior studies, the current one is unique in integrating various technologies to create an integrated system for remote monitoring of COVID-19 patients. The use of an AI camera, wearable IoT devices, and a web application, can provide healthcare professionals with a more comprehensive view of the patient’s health status and allow for more accurate risk assessment. Furthermore, the use of MySQL as the database system can provide an efficient way of storing and analyzing patient data. The demonstrated system can facilitate the transfer of patients between hospitals and healthcare organizations to enhance efficiency.
5. Conclusions
The proposed system for monitoring and surveilling COVID-19 patients in home isolation is innovative and unique, as it combines various technologies to create an integrated system for remote monitoring. The use of wearable devices, AI cameras, and a web application can provide healthcare professionals with a more comprehensive view of the patient’s health status and allow for more accurate risk assessment. The results can be used to provide data for health centers or hospitals, in order to prepare medical treatment plans for COVID-19. The wearable device was designed to gather information about the health activities of patients isolated at home, including heart rate, temperature, and blood oxygen level. In addition, the system reduced the burden on hospitals and healthcare providers as they could monitor patients remotely. Patients felt safe and at ease, knowing that their health was being monitored by a healthcare provider. This study presents a novel approach that enables healthcare professionals to access real-time and comprehensive patient data. This method facilitates continuous monitoring of both vital signs and emotional states, while also providing a cohesive platform for data access and analysis. The primary objective is to enhance the quality of patient care and support informed decision-making. The results of this study could be useful for patient management in healthcare organizations or communities. They can also be applied to other emerging diseases in the future. Using microphones to listen to potentially difficult breathing, which is a serious symptom and might not be captured by the camera or wearable device, would further improve the system in the future.

 ,
, 


