Article

Acute Effects of Different Intensities of Flywheel Half Squat Based on Velocity on Vertical Jump Performance in High-Level Athletes

1
Beijing Sport University, Beijing 100084, China
2
School of Basic Sciences for Aviation, Naval Aviation University, Yantai 264001, China
*
Author to whom correspondence should be addressed.
These authors contributed equally to this work.
Appl. Sci. 2025, 15(8), 4388; https://doi.org/10.3390/app15084388
Submission received: 22 February 2025 / Revised: 8 April 2025 / Accepted: 9 April 2025 / Published: 16 April 2025
(This article belongs to the Special Issue Advances in Sports Science and Biomechanics)

Abstract

:
Coaches manipulate training variables to optimize and improve them, with intensity being crucial. Velocity-based training, measuring intensity by the movement speed, is advantageous over traditional methods. Flywheel training, offering concentric and eccentric loads, allows for supramaximal loading during the eccentric phase, enhancing muscle hypertrophy and performance and reducing injury risk. This study examines the specific effects of flywheel training on post-activation potentiation (PAP). Forty-one high-level male athletes performed flywheel half squats at fast (0.95–1.05 m/s), medium (0.65–0.75 m/s), and slow (0.35–0.45 m/s) speeds. Their drop jump performance was assessed at 30 s and 4, 8, and 12 min post-induction. Lower-limb kinematic data and ground reaction forces were recorded using infrared motion capture and force plates. Measures included peak collision force, peak extension force, knee joint extension moment, knee joint power, average power output, and vertical jump height. High-speed intensity significantly increased peak impact force, peak vertical ground reaction force, knee joint eccentric power, concentric power, and extension torque at 4, 8, and 12 min post-induction (p < 0.05). Fast- (0.95–1.05 m/s) and medium-speed (0.65–0.75 m/s) flywheel squats acutely improved lower-limb performance, especially vertical jump height, within 4–12 min post-stimulation. Fast-speed loading showed greater benefits for reactive strength and power output, while a medium speed also yielded meaningful gains. These findings support using movement velocity to guide flywheel training intensity.

1. Introduction

To design effective training interventions, coaches must carefully manipulate key training variables such as the intensity [1], volume [2], exercise type [3], and sequence [4]. Among these, training intensity is widely regarded as the most critical determinant of adaptation [1]. In recent years, velocity-based training (VBT) has gained increasing attention as a method of prescribing and monitoring intensity, using movement speed as a proxy instead of traditional percentage-based approaches [5,6]. VBT offers several advantages, including the ability to estimate the one-repetition maximum (1 RM) more accurately and to individualize resistance levels for athletes of varying training backgrounds [7].
Flywheel resistance training, which utilizes rotational inertia to generate resistance, allows for both concentric and eccentric loading, including eccentric overload beyond what is achievable through traditional weight training [8,9]. This modality has been shown to promote muscle hypertrophy, improve explosive performance, and reduce injury risk [10,11,12]. Its portability and applicability across various environments further enhance its utility in sport settings. These characteristics also make flywheel training a viable method for inducing post-activation potentiation (PAP), a phenomenon that acutely enhances muscle force output following a high-intensity stimulus [11,13].
PAP is typically elicited through resistance exercises performed before explosive activities such as sprinting or jumping. It is believed to result from both neural and muscular mechanisms, including increased motor unit recruitment, phosphorylation of myosin regulatory light chains, and changes in muscle stiffness [14,15,16,17]. Traditional PAP-inducing exercises—such as barbell squats or isometric contractions—can be effective but often require extensive equipment and controlled environments [18,19,20,21]. Flywheel training offers an alternative that can potentially produce similar or greater PAP effects with added practical advantages.
However, a major challenge in flywheel-based PAP research is standardizing load intensity. Unlike traditional resistance training, flywheel devices lack a clear 1 RM reference point, and the eccentric load depends on factors such as the moment of inertia and the speed of concentric movement. Consequently, using fixed inertial loads across individuals may produce inconsistent physiological responses. Notably, Carroll et al. introduced the concept of using concentric velocity as a surrogate for intensity in flywheel exercises, proposing a load–velocity relationship whereby higher inertial resistance results in slower movement speeds [13]. Building on this framework, Spudić and Strojnik reported that flywheel training using lower inertial loads improved jump height and power output, indicating enhanced post-activation performance benefits [22]. Similarly, Sagelv et al. observed that high-velocity flywheel squats yielded comparable gains in sprint and jump performance to traditional heavy-load training, further supporting the use of velocity-based strategies for enhancing explosive athletic output [23]. Together, these findings highlight the potential role of movement speed in optimizing PAP outcomes in flywheel training.
Despite these insights, there remains a lack of systematic investigation into how concentric movement velocity in flywheel squats influences PAP effects and lower-limb performance. Therefore, the present study aimed to evaluate the acute effects of flywheel half squats performed at three different concentric speeds—fast (0.95–1.05 m/s), medium (0.65–0.75 m/s), and slow (0.35–0.45 m/s)—on vertical jump performance and related biomechanical measures in high-level male athletes. We hypothesized the following: (1) Fast-speed flywheel squats would elicit stronger PAP effects than medium- or slow-speed protocols. (2) The performance enhancements would be most evident between 4 and 12 min post-stimulation.

2. Materials and Methods
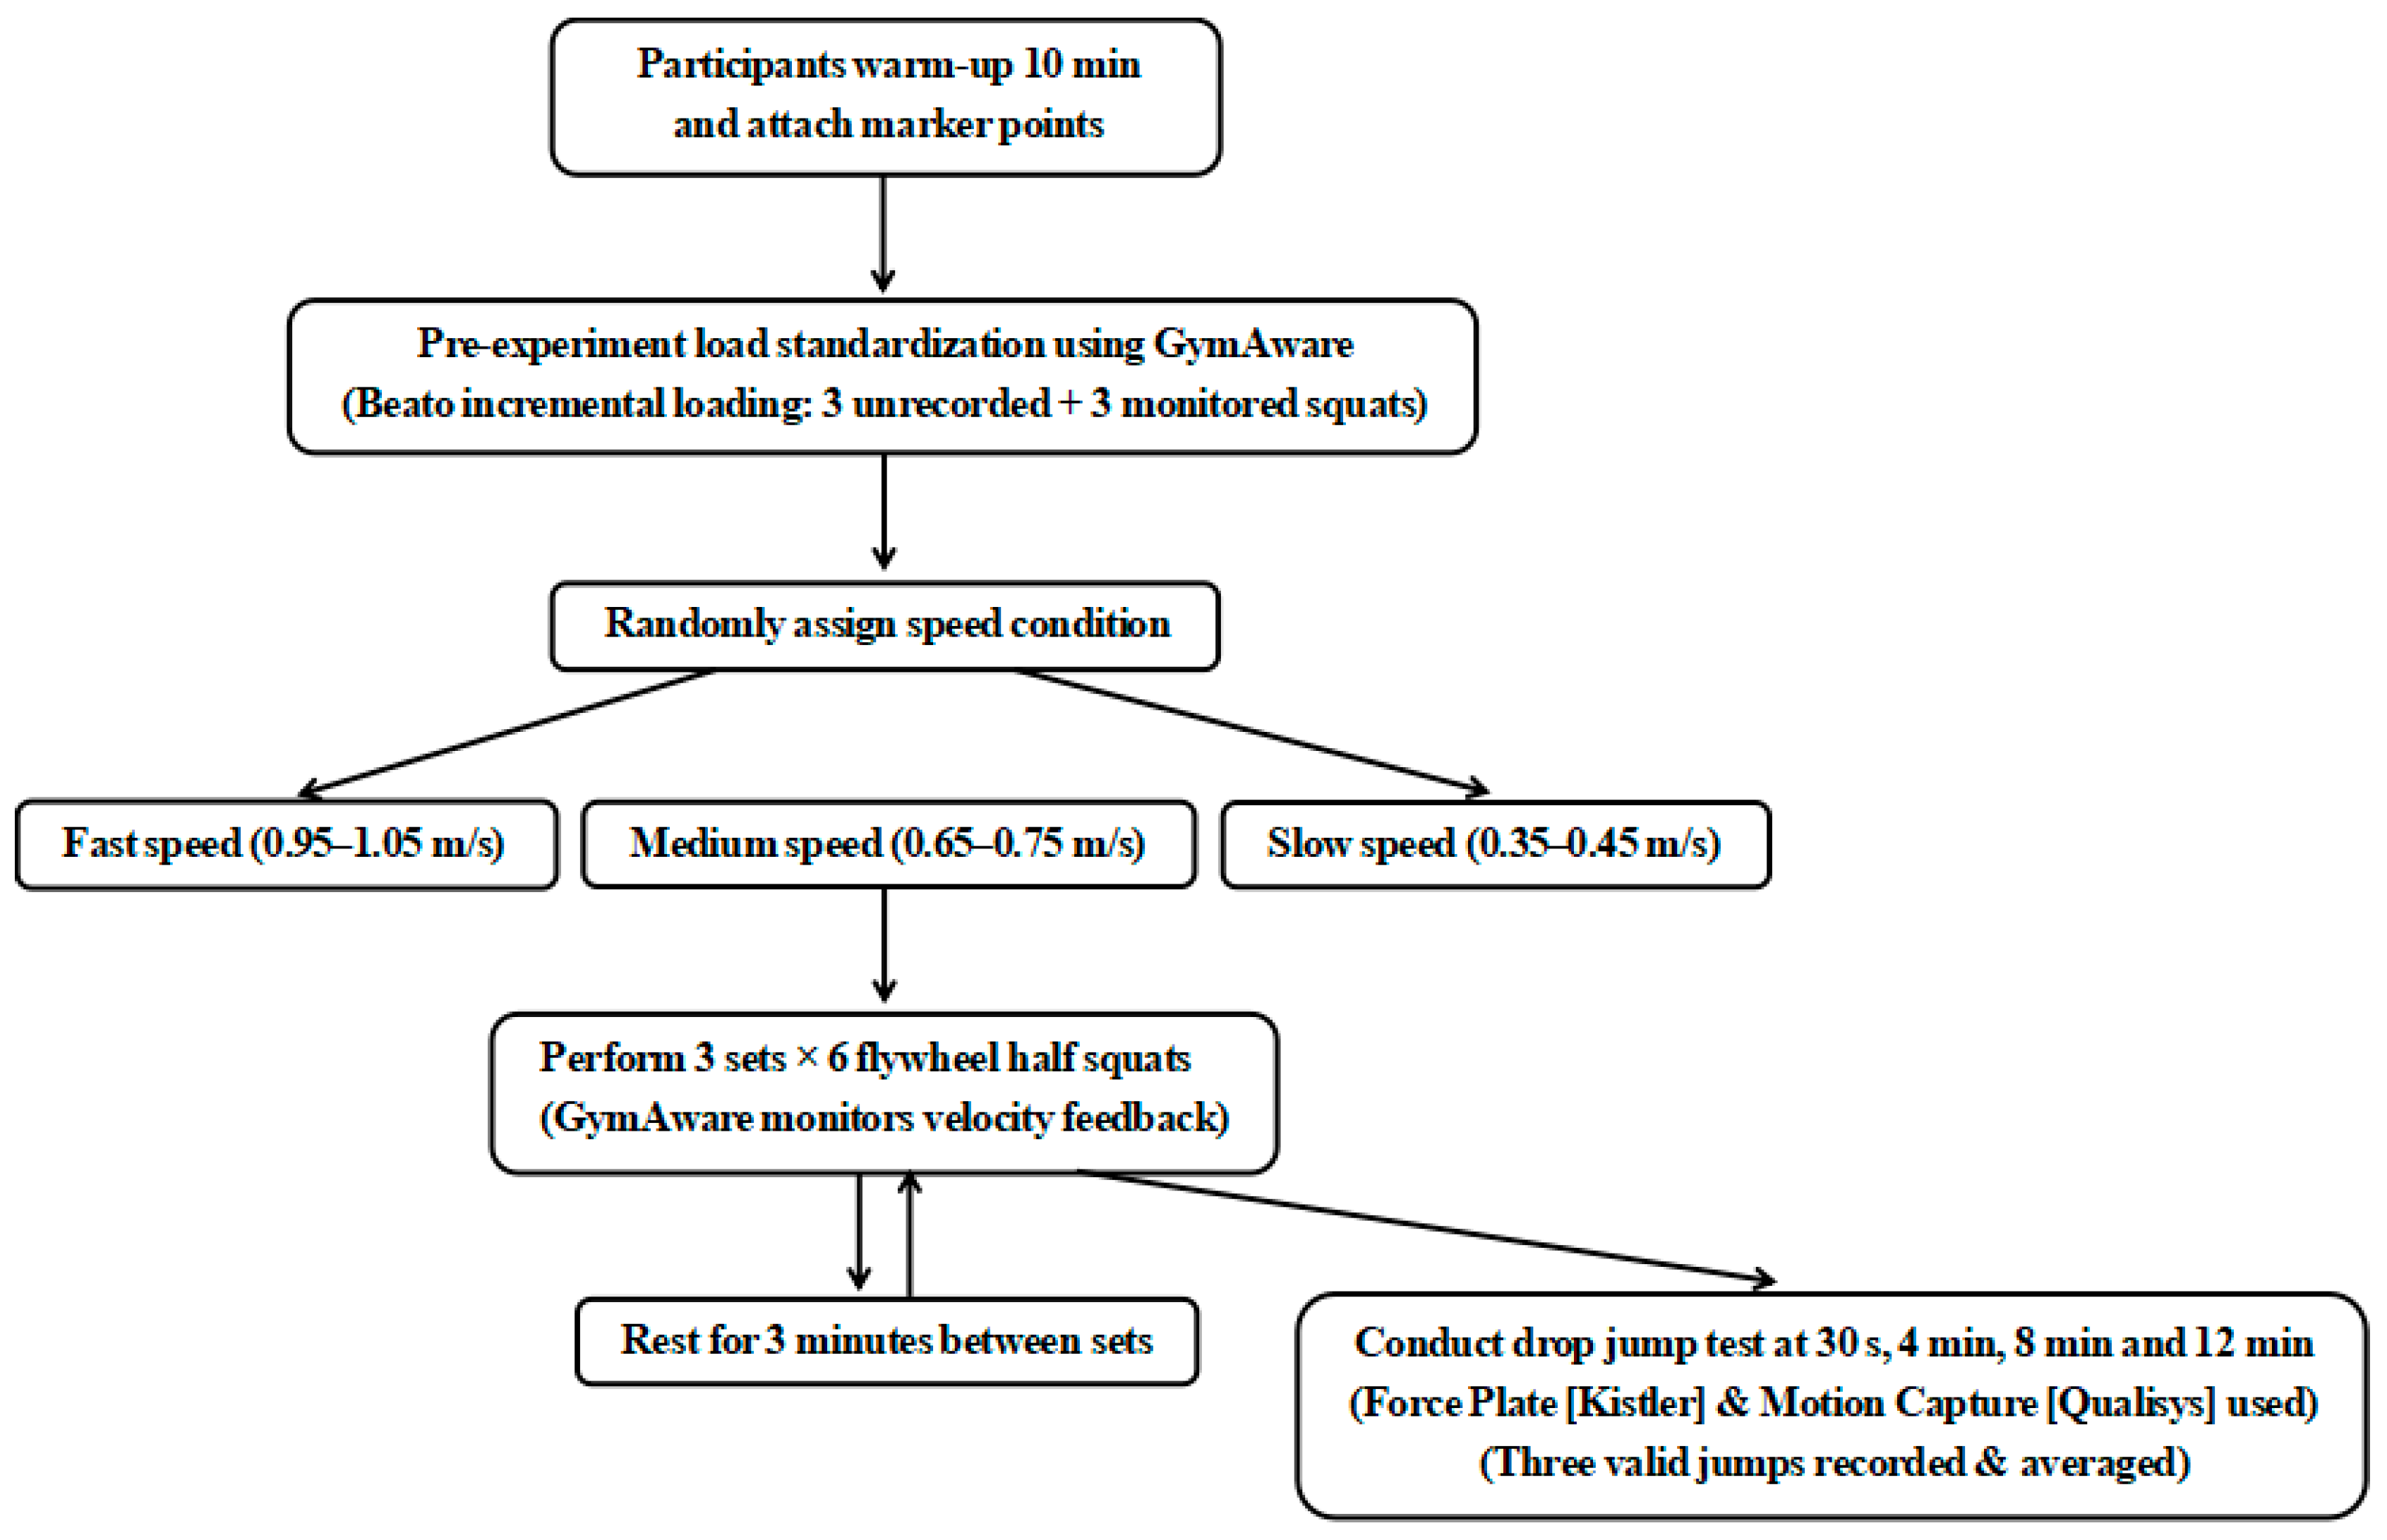
2.1. Design

The study was designed as a repeated-measures design, where each subject completed tests under three different conditions in a randomized order to minimize potential order effects, to evaluate the acute effects of varying intensities of flywheel half squats, based on velocity, on vertical jump performance. This study adhered to the Declaration of Helsinki and was approved by the Institutional Review Board of Beijing Sport University Ethics Committee (approval number: 2021004I).

2.2. Participants

Using G*Power software (version 3.1; GPower GmbH, Düsseldorf, Germany), we calculated the required sample size with an effect size of 0.5, an alpha level of 0.05, and a power of 0.80. The calculation indicated a need for at least 34 subjects. To account for potential attrition, we increased the sample size by 20%, resulting in a final total of 41 subjects. The inclusion criteria were as follows: (1) high-level athletes with a sports classification of at least level 2, (2) at least one resistance training session per week, (3) no sports injuries in the past six months, and (4) aged between 19 and 22 years. The exclusion criteria were as follows: (1) non-classified athletes, (2) recent sports injuries, and (3) no resistance training experience. The study recruited 41 male undergraduates from the Nanjing Sport Institute (see Table 1).

2.3. Intervention Program

2.3.1. Motor Learning

Before the preliminary experiment, the participants underwent four sessions of motor learning to master rhythm and exertion techniques. Real-time feedback on concentric squat speed was provided using GymAware (version 5.1; Kinetic Performance Technologies, Canberra, Australia), a linear position transducer that has been validated for measuring barbell velocity and power output. Studies have demonstrated its high level of accuracy and reliability, with an error margin of less than 2.5% compared to gold-standard motion capture systems [24]. The mean and peak concentric velocities recorded by GymAware were used to classify the intensity levels in this study. The participants received verbal encouragement. Practice continued until participants achieved a smooth rhythm and sufficient exertion.

2.3.2. Flywheel Training Device and Inertia Settings

The study utilized a flywheel resistance training device (YoYo Technology AB, Stockholm, Sweden) with interchangeable inertia discs. The moment of inertia (MOI) for the flywheel was adjusted to match the target concentric velocity, following the inverse load–velocity relationship in flywheel training. The settings were as follows:
Fast-speed condition (0.95–1.05 m/s) → MOI = 0.025 kg·m2;
Medium-speed condition (0.65–0.75 m/s) → MOI = 0.050 kg·m2;
Slow-speed condition (0.35–0.45 m/s) → MOI = 0.075 kg·m2.
These values align with prior research indicating that lower inertial loads allow for higher movement speeds and more pronounced PAP effects, whereas higher inertia enhances eccentric overload [25].

2.3.3. Flywheel Resistance Protocol

Before the experimental intervention, all participants completed baseline performance testing following a standardized warm-up. Baseline measurements for all outcome variables—including peak collision force, extension force, knee joint kinetics, and vertical jump performance—were collected in a rested state, prior to the first flywheel session. These data served as the control values for subsequent comparisons.
The main experiment consisted of three sets of six repetitions, performed at the predetermined speed conditions, with a 3 min rest period between sets. The participants were assigned a randomized speed condition, and each session was conducted using the corresponding inertia setting determined during the pre-experiment phase.
Drop jump performance was assessed at 30 s, 4 min, 8 min, and 12 min post-stimulation. For each time point, three successful trials were recorded and averaged. This time window was selected based on prior research indicating that PAP effects typically peak within 4–12 min after resistance exercise. A schematic representation of the experimental procedure is illustrated in Figure 1.

2.4. Outcome Measurements

During the deep jump, 34 reflective markers were attached to specific anatomical landmarks. Lower-limb kinematic data were captured at 200 Hz using an infrared motion capture system (Oqus, Qualisys, Gothenburg, Sweden). Ground reaction force data during the landing phase were recorded at 1000 Hz using two force plates (Model 9281EA, Kistler, Winterthur, Switzerland). All signals were synchronized using Qualisys Track Manager software (Version 2019.2, Qualisys, Gothenburg, Sweden). Visual 3D software (version 5.0; C-Motion, Germantown, MD, USA) was then used to construct a model of the pelvis and lower-limb skeleton and to process the raw data.

2.4.1. Peak Impact Force

This represented the maximum vertical ground reaction force during the eccentric support phase when the foot contacted the ground. It was normalized by the body mass (N/Kg). This force represented the deceleration of the body’s center of mass upon landing, a key factor in understanding the impact phase of jump landings.

2.4.2. Peak Vertical Ground Reaction Force

This represented the maximum vertical ground reaction force during the concentric push-off phase when the foot contacted the ground. It was normalized by the body mass (N/kg). This measure was critical for assessing the force exerted during the propulsive phase of the jump.

2.4.3. Knee Joint Extension Moment

After filtering, V3D analysis software used inverse dynamics to calculate the net moment at the knee joint generated by muscle contraction, including the maximum extension moment. This was normalized by the body mass (Nm/kg). The knee joint extension moment was essential for understanding the work done during the eccentric and concentric phases of squats and jump landings, directly related to the force production capacity of the knee extensors.

2.4.4. Knee Joint Power

This indicated the ability of the joint to perform work and was calculated as the product of the net joint moment and angular velocity. It included both eccentric and concentric power. This metric was vital for evaluating muscle performance during both the deceleration and acceleration phases of movement.

2.4.5. Average Power Output

This metric reflected the overall power output during the depth jump. It was computed by integrating the kinetic energy changes throughout the motion and was essential for evaluating the athlete’s explosive strength.

2.5. Data Analysis

The data were presented as the mean ± standard deviation (Mean ± SD), with force, joint moment, and joint power data normalized by the body weight (N/Kg). A two-way repeated-measures ANOVA was used to examine the main effects of speed and time. Normality and sphericity tests were performed prior to analysis, with Greenhouse–Geisser corrections applied where necessary. Post hoc comparisons were performed using the Bonferroni method when significant main effects were found. The significance level was set at p < 0.05. The effect size was reported using partial eta squared (η2p), and Cohen’s d was used for pairwise comparisons, with confidence intervals. Statistical power was estimated using G*Power (version 3.1; GPower GmbH, Düsseldorf, Germany) with a target power of 0.80. All statistical analyses were conducted using SPSS Statistics (version 28; IBM Corp., Armonk, NY, USA).

3. Results

3.1. Ground Reaction Forces and Joint Dynamics

Repeated-measures ANOVA revealed that high- and medium-speed conditions successfully elicited PAP effects in peak extension force (PEF), eccentric knee joint power, concentric knee joint power, and EM (all p < 0.05). Both velocity and time showed significant main effects and interaction effects across multiple indicators (p < 0.05). In contrast, the low-speed condition failed to induce significant PAP responses. Effect sizes were moderate to large across key outcomes, supporting the practical significance of the findings (see Table 2 and Table 3).

3.1.1. Peak Collision Force

Mauchly’s test revealed that the assumption of sphericity was violated for both the main effect of time and the time × velocity interaction. Therefore, the Greenhouse–Geisser correction was applied. The results indicated significant main effects of time, with F (3, 117) = 5.23, p < 0.05, η2p = 0.06, and 1 − β = 0.48; and velocity, with F (2, 78) = 4.18, p < 0.05, η2p = 0.08, and 1 − β = 0.59; as well as a significant interaction between time and velocity, with F (6, 234) = 3.45, p < 0.05, η2p = 0.09, and 1 − β = 0.63.
Post hoc Bonferroni comparisons revealed a transient decrease in the PCF at 30 s under the high-speed condition; however, this reduction was not statistically significant compared to baseline (Cohen’s d = 0.24, 95% CI [−0.20, 0.68]). At 4 and 12 min, the PCF values were significantly higher than those at 30 s (p < 0.05), and a significant increase from baseline was observed at 8 min (p < 0.05, d = 0.54, 95% CI [0.10, 0.98]). No significant changes were detected in the medium- or low-speed conditions.
Between-group comparisons indicated that both high- and medium-speed conditions elicited significantly greater PCF responses at 4, 8, and 12 min compared to the low-speed condition (p < 0.05), although no significant differences were observed between the high- and medium-speed conditions (see Table 2).

3.1.2. Peak Extension Force

The assumption of sphericity for PEF was violated; therefore, the Greenhouse–Geisser correction was applied. A repeated-measures ANOVA revealed significant main effects of velocity (F(2, 78) = 5.34, p < 0.01, η2p = 0.12, and 1 − β = 0.72), time (F(3, 117) = 6.78, p < 0.001, η2p = 0.15, and 1 − β = 0.82), and their interaction (F(6, 234) = 4.56, p < 0.001, η2p = 0.18, and 1 − β = 0.88).
Post hoc analysis showed that the PEF significantly increased at 30 s and 4, 8, and 12 min compared to baseline under both high- and medium-speed conditions (p < 0.05), with Cohen’s d ranging from 0.50 to 0.75 (95% CI [0.06, 1.12]). In contrast, no significant changes were observed under the low-speed condition. Furthermore, at 4, 8, and 12 min, the high-speed condition elicited significantly greater PEF values than the medium-speed condition (p < 0.001).

3.1.3. Eccentric Power of the Knee Joint

Due to a violation of the sphericity assumption, the Greenhouse–Geisser correction was applied. Repeated-measures ANOVA revealed significant main effects of time (F(3, 117) = 4.89, p < 0.01, η2p = 0.14, and 1 − β = 0.85) and velocity (F(2, 78) = 3.12, p < 0.05, η2p = 0.07, and 1 − β = 0.55) on eccentric power (EP). A significant time × velocity interaction was also observed (F(6, 234) = 2.78, p < 0.05, η2p = 0.09, and 1 − β = 0.63).
Post hoc Bonferroni comparisons indicated that in both the high- and medium-speed conditions, the EP at 4, 8, and 12 min was significantly higher than both the baseline and the 30 s value (p < 0.05), with effect sizes ranging from d = 0.47 to 0.89 (95% CI [0.03, 1.33]), reflecting meaningful physiological responses. No significant changes were detected in the low-speed condition. Among the three speed conditions, the medium-speed group consistently exhibited the most pronounced post-activation performance enhancement (PAPE) effects across all time points (see Table 3).

3.1.4. Concentric Power of the Knee Joint

As sphericity was violated, the Greenhouse–Geisser correction was applied. Significant main effects of velocity (F(2, 78) = 4.56, p < 0.05, η2p = 0.10, and 1 − β = 0.68) and time (F(3, 117) = 5.78, p < 0.01, η2p = 0.13, and 1 − β = 0.81) were observed for concentric power (CP). The time × velocity interaction was also significant (F(6, 234) = 3.45, p < 0.01, η2p = 0.12, and 1 − β = 0.75).
Post hoc comparisons revealed that both the high- and medium-speed conditions significantly increased CP at 4, 8, and 12 min compared to baseline (p < 0.05), with effect sizes ranging from d = 0.70 to 0.83 (95% CI [0.26, 1.37]). No significant change was found under the low-speed condition. Between-group comparisons indicated that both the high- and medium-speed conditions resulted in significantly greater CP than the low-speed condition (p < 0.05), although the difference between the high- and medium-speed conditions was not statistically significant (see Table 3).

3.1.5. Knee Extension Moment

Following Greenhouse–Geisser correction for violations of sphericity, significant main effects of time (F(3, 117) = 6.78, p < 0.001, η2p = 0.15, and 1 − β = 0.82) and velocity (F(2, 78) = 5.34, p < 0.01, η2p = 0.12, and 1 − β = 0.72) were found for the knee extension moment (EM). A significant time × velocity interaction was also observed (F(6, 234) = 4.12, p < 0.001, η2p = 0.14, and 1 − β = 0.80).
Post hoc analyses indicated that both high- and medium-speed conditions led to significant increases in the EM at 4, 8, and 12 min compared to baseline (p < 0.05), with Cohen’s d ranging from 0.53 to 0.79 (95% CI [0.09, 1.23]) and η2 values exceeding 0.16. However, no significant differences were detected at 30 s. The low-speed condition did not elicit any significant changes (see Table 3).

3.2. Reactive Strength Index, Average Power Output, and Vertical Jump Height

Repeated-measures ANOVA revealed significant main effects and interaction effects of both time and velocity on all three variables (p < 0.05). These findings indicate that both high-speed and medium-speed flywheel intensities successfully induced PAP, while low-speed intensity demonstrated limited efficacy (see Table 4 and Figure 2A–F).

3.2.1. Reactive Strength Index

Mauchly’s test indicated a violation of the sphericity assumption; thus, Greenhouse–Geisser correction was applied. Significant main effects were observed for time (F(3, 117) = 5.12, p < 0.01, η2p = 0.12, and 1 − β = 0.78) and velocity (F(2, 78) = 4.23, p < 0.05, η2p = 0.10, and 1 − β = 0.65) on the reactive strength index (RSI). Under the fast-speed condition, the RSI significantly increased at 4 and 8 min compared to baseline (p < 0.05), with effect sizes of d = 0.53 (95% CI [0.09, 0.97]) and d = 0.49 (95% CI [0.05, 0.93]), respectively. No significant change was observed at 30 s (p > 0.05). Under the medium-speed condition, a significant increase in the RSI was observed at 4 min (p < 0.05), with d = 0.25 (95% CI [−0.19, 0.69]), while the change at 30 s was not significant (p > 0.05). Under the slow-speed condition, the RSI significantly increased at 30 s compared to baseline (p = 0.01, d = 0.52, 95% CI [0.08, 0.96]), but no significant changes were observed at 4 min (p > 0.05).
Across all velocities, the RSI values exhibited a linear trend at 4 and 8 min, with the fast-speed condition producing the most substantial improvements, followed by medium and slow speeds (see Figure 2A,B and Table 4).

3.2.2. Results of Average Power Output

Significant main effects were found for time (F(3, 117) = 6.45, p < 0.001, η2p = 0.14, and 1 − β = 0.82) and velocity (F(2, 78) = 5.78, p < 0.01, η2p = 0.13, and 1 − β = 0.75) on the average power output (APO). In the fast-speed condition, the APO significantly increased at 4 and 8 min compared to baseline (p < 0.05), with Cohen’s d = 0.69 (95% CI [0.25, 1.13]) and d = 0.67 (95% CI [0.23, 1.11]), respectively. A significant decrease was observed at 30 s (p = 0.01, d = 0.56, 95% CI [0.12, 1.00]). Under the medium-speed condition, the APO significantly increased at 4 min (p < 0.05, d = 0.37, 95% CI [−0.07, 0.81]), while no significant change was found at 30 s (p > 0.05). In the slow-speed condition, the APO significantly decreased at 30 s (p = 0.01, d = 0.45, 95% CI [0.01, 0.89]), with no significant changes at 4 min (p > 0.05).
A clear linear trend was observed across velocities at 4 and 8 min, with a fast speed eliciting the greatest enhancement in the APO, followed by medium and slow speeds (see Figure 2C,D and Table 4).

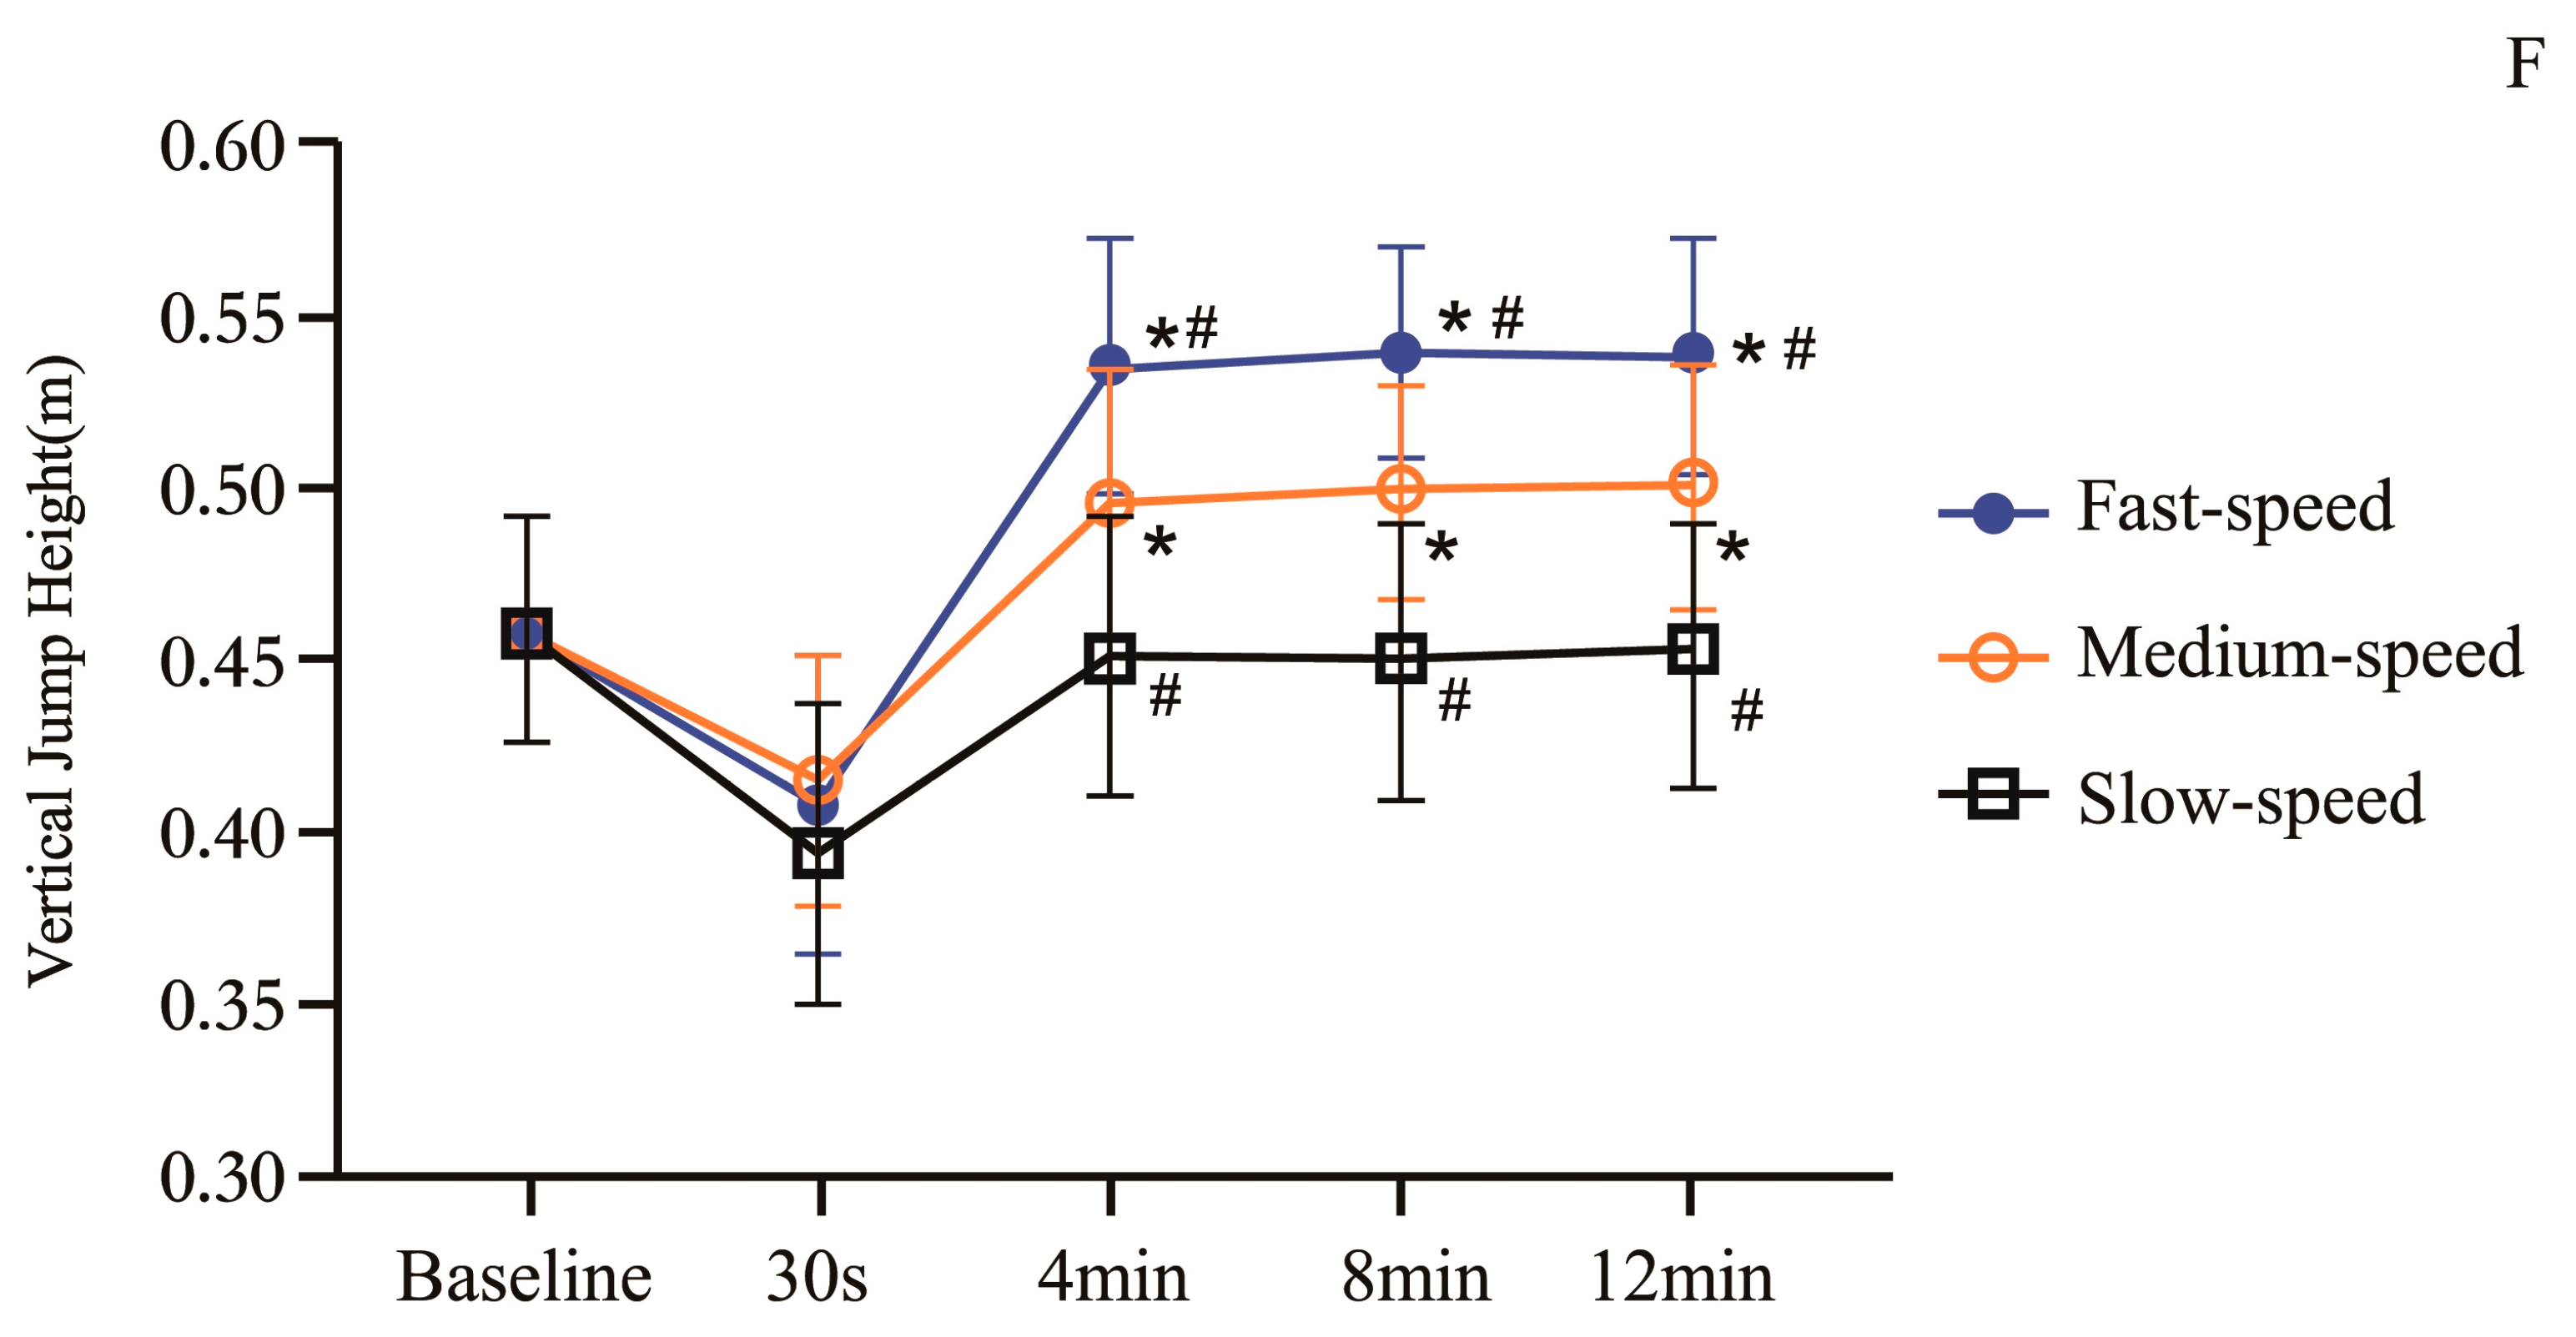
3.2.3. Vertical Jump Height

Greenhouse–Geisser-adjusted results revealed significant main effects of time (F(3, 117) = 7.23, p < 0.001, η2p = 0.16, and 1 − β = 0.85) and velocity (F(2, 78) = 6.12, p < 0.01, η2p = 0.14, and 1 − β = 0.78) on the vertical jump height (VJH). In the fast-speed condition, the VJH significantly increased at 4 min compared to baseline (p < 0.05, d = 2.41, 95% CI [1.97, 2.85]), while a significant decrease was observed at 30 s (p = 0.01, d = 1.38, 95% CI [0.94, 1.82]). Under the medium-speed condition, no significant changes in the VJH were detected at any time point (p > 0.05). In the slow-speed condition, the VJH significantly decreased at 30 s (p = 0.01, d = 0.34, 95% CI [−0.10, 0.78]), with no significant changes observed at 4 min (p > 0.05).
At the 4 min time point, the VJH displayed a linear trend across velocity conditions, with the fast-speed group showing the most pronounced improvement, followed by medium and slow speeds (see Figure 2E,F and Table 4).

4. Discussion

This study aimed to explore the acute effects of flywheel half-squat training at three different concentric speeds—fast (0.95–1.05 m/s), medium (0.65–0.75 m/s), and slow (0.35–0.45 m/s)—on neuromechanical variables and performance-related outcomes associated with PAP. The results partially confirmed the hypotheses. Both fast-speed and medium-speed flywheel squats elicited significant PAP responses in kinetic and kinematic indicators, as evidenced by improvements in the PEF, knee joint power, extension moment, reactive strength index, and vertical jump height (see Table 2, Table 3 and Table 4, Figure 2). In contrast, slow-speed flywheel squats failed to produce significant PAP effects across most variables.
Furthermore, the enhancement effects became significant between 4 and 12 min post-stimulation in both the fast- and medium-speed groups, aligning with the expected time window of optimal PAP expression. At 30 s post-stimulation, most indicators showed no significant improvement or even slight declines, likely due to residual neuromuscular fatigue. This temporal pattern supports previous findings indicating that PAP typically follows a brief fatigue phase and becomes prominent after 4 min, depending on intensity and individual recovery kinetics.
These findings validate the hypothesis that movement velocity can serve as a practical and individualized metric for intensity regulation in flywheel training, as different velocities induced significantly different physiological responses even when using the same training modality.

4.1. Ground Reaction Force and Extension Performance

The results demonstrated that both fast-velocity and moderate-velocity flywheel training effectively enhanced lower-limb PEF and, to a certain degree, PCF. Under fast-velocity conditions, the PEF showed significant improvement at multiple post-training time points. In contrast, the PCF exhibited a transient elevation 8 min after exercise. No meaningful changes were observed in the slow-velocity condition, suggesting limited efficacy of slow-velocity flywheel training in eliciting short-term explosive neuromuscular adaptations.
From a biomechanical standpoint, the increase in PEF is primarily attributed to enhanced concentric force generation. This phenomenon is closely linked to elevated neuromuscular drive under high-speed mechanical stimuli. It has been demonstrated that high-inertia flywheel training can recruit a greater number of motor units, particularly those associated with type II fast-twitch muscle fibers, thereby improving the rapid force production capacity [26]. Supporting this, Fu et al. reported that moderate-to-high inertia flywheel training significantly enhanced explosive lower-limb performance, especially vertical jump and ground reaction force metrics, within 4 to 8 min after training [27].
The PCF reflects the lower limb’s ability to absorb landing impact and recycle elastic energy, which is influenced by limb stiffness, intersegmental coordination, and the efficiency of the stretch-shortening cycle. Rebelo et al. emphasized that both the reactive strength index and the PCF share common neuromechanical underpinnings, particularly in relation to tendon stiffness regulation and neuromuscular elasticity [28]. In this study, participants in the fast-velocity condition generated greater mechanical tension through active braking during the eccentric phase. This may have improved tendon elasticity and joint stiffness regulation, contributing to better impact attenuation and rebound capacity. However, individual variability in training background and movement execution appeared to affect the PCF response.
Physiologically, fast-velocity flywheel training induced high-speed eccentric tension, which has been shown to elevate sarcoplasmic calcium ion concentrations and increase the phosphorylation of myosin light chains [29]. Concurrently, short-term neural adaptations can enhance the excitability of alpha motor neurons and facilitate synchronized motor unit recruitment [30]. These combined effects lead to more efficient cross-bridge cycling and enhanced muscle fiber activation, resulting in improved explosive force generation. Furthermore, von Walden et al. highlighted that the eccentric overload mechanism inherent in flywheel training promotes rapid neuromuscular remodeling, which serves as a foundation for PAP [31].
Recent research has further underscored the importance of tailoring inertial loads. For instance, Shi et al. found that higher-load flywheel training not only enhanced ground reaction forces and power outputs but also prolonged the time course of post-activation performance enhancement [32]. Similarly, Weakley et al. suggested that high-speed velocity-based training protocols offer superior acute activation of neuromuscular output when compared to slower variants, a finding that aligns with the performance trends for PEF and PCF observed in the current investigation [33].
Importantly, despite the relatively large eccentric loads involved, the slow-velocity training condition lacked sufficient movement speed to effectively activate fast-twitch motor units or elicit efficient stretch-shortening cycle engagement. As a result, the lack of velocity-specific stimuli may have dampened PAP effects due to premature fatigue or suboptimal motor rhythm [34].

4.2. Knee Joint Kinetic Performance: Eccentric Power, Concentric Power, and Extension Moment

The present study revealed that both fast- and moderate-velocity flywheel resistance training significantly improved knee joint kinetic performance, as reflected in increases in the eccentric power (EP), CP, and EM. These improvements were predominantly observed within 4 to 12 min post-exercise, exhibiting a typical PAP profile. In contrast, slow-velocity training failed to produce similar effects, indicating suboptimal neuromuscular activation under such loading conditions.
Moderate-velocity training elicited the greatest gains in EP. This result may be attributed to longer eccentric phase duration and more stable force production at moderate velocities, creating a favorable time-under-tension stimulus that enhances mechanical loading and structural adaptation. Douglas et al. emphasized the importance of eccentric tempo in maximizing neuromuscular efficiency [35]. Similarly, Camargo et al. highlighted that high mechanical loading during eccentric exercise activates muscle spindles and high-threshold motor units, facilitating enhanced force development [36]. In addition, Caruso et al. found that inertial training improved performance outcomes without additional motor unit recruitment, suggesting neuromechanical efficiency during eccentric–concentric transitions [37].
CP increased significantly under both fast and moderate conditions, albeit through different mechanisms. High-velocity training emphasizes the rapid neural drive and preferential activation of type II fast-twitch muscle fibers, contributing to increased rate of force development. Conversely, moderate-speed training offers extended contraction durations, which may promote better force summation and efficiency of energy transfer. Martin-Rivera et al. identified similar patterns, noting that contraction duration is a critical factor in maximizing concentric output [38]. Stojanović et al. found that flywheel resistance training produced greater improvements in power-related performance—such as the jump height and sprint speed—compared to volume-matched traditional strength training, despite similar gains in maximal strength [39].
Regarding EM, improvements were more pronounced under moderate-velocity training. This finding suggests that moderate loads may be more effective in enhancing maximal strength development and joint torque capacity. Harris-Love et al. linked increased extension moment to enhanced quadriceps output and better joint stabilization [40]. Likewise, Krishnan et al. found that eccentric training improves stress distribution and extension control at the knee joint, particularly when combined with appropriate structural loading [41].
Physiologically, these adaptations are likely the result of both central and peripheral mechanisms. Centrally, flywheel training enhances the excitability of alpha motor neurons and promotes more synchronized motor unit recruitment, as demonstrated by Fiorilli et al. [42]. Peripherally, an increased sarcoplasmic calcium ion concentration and greater myosin light chain phosphorylation, as described by Rassier and Macintosh, improve excitation–contraction coupling and cross-bridge kinetics [43]. Moreover, chronic adaptations such as enhanced tendon stiffness and more efficient energy transfer, reported by Onambélé et al., contribute to the observed improvements in force production quality [44].
Moreover, accumulating evidence has emphasized the velocity-dependent nature of neuromuscular adaptations. Sabido et al. observed that high-velocity flywheel protocols are more effective in enhancing short-term peak power output, whereas moderate-velocity loading is more beneficial for improving sustained force output and neuromuscular tension regulation [25]. These findings are consistent with the present results and further reinforce the importance of tailoring velocity-specific loading strategies to match performance goals in training interventions.

4.3. Reactive Strength and Power Output Performance

Both fast- and moderate-velocity flywheel training significantly enhanced participants’ reactive strength, average output power, and vertical jump height. In contrast, the slow-velocity condition did not elicit substantial improvements. These findings confirm the efficacy of flywheel resistance training in improving lower-limb explosive performance, especially in tasks dominated by the stretch-shortening cycle (SSC), where high-velocity loading produced more pronounced responses.
Regarding reactive strength, the greatest improvements were observed in the fast-velocity condition, indicating that rapid eccentric–concentric transitions effectively activate the neuromuscular system and improve jump efficiency within short ground contact times. Shimizu et al. found that an eight-week flywheel squat training program significantly enhanced the reactive strength index, jump performance, and stretch-shortening cycle function in collegiate basketball players, confirming the effectiveness of flywheel-based eccentric overload for improving reactive capabilities [45]. Similarly, Hu et al. demonstrated that flywheel training led to greater improvements in countermovement jump height and eccentric utilization ratio compared to eccentric overload training, suggesting enhanced stretch-shortening cycle efficiency and reactive strength in explosive tasks [46].
In terms of average output power, both fast and moderate conditions yielded significant improvements, particularly between 4 and 8 min post-intervention. This enhancement may stem from central neural activation, improved muscular coordination, and better control of metabolic by-products under high-intensity loading. Dorrell et al. also emphasized that real-time adjustment of training intensity based on movement velocity is a key determinant of explosive performance gains in resistance training [47]. Muñoz-López et al. demonstrated that angular acceleration measured in real-time during flywheel exercises is highly sensitive to fatigue, providing a useful metric for monitoring training load and managing fatigue to maintain power output [48].
Vertical jump height, a classic marker of neuromuscular performance and SSC function, was significantly improved in the fast condition in this study, with the highest gains observed 8 min post-training. McErlain-Naylor and Beato reported that flywheel half-squat training offers substantial benefits for vertical jump performance, particularly through improvements in ground reaction force and take-off velocity [49]. Likewise, Seitz and Haff identified training level, load, recovery, and contraction type as key modulators of PAP effectiveness in explosive tasks such as jumping and sprinting [50].
At the mechanistic level, improvements in these neuromuscular performance indicators can be attributed to several factors. First, the eccentric overload inherent in flywheel training elicits greater neuromuscular responses compared to traditional resistance training, potentially contributing to improved force transmission and movement efficiency [51]. Second, high-velocity flywheel loading has been shown to improve maximal strength and power performance, which may be partially explained by enhanced neuromuscular activation [52]. Third, post-activation performance enhancement induced by flywheel training may involve increased neuromuscular efficiency and potentiation mechanisms that facilitate improved performance in ballistic tasks [53].
It is worth noting that although the slow-velocity condition involved substantial eccentric loading, the lack of a sufficient velocity stimulus may have resulted in inadequate neural activation, delayed SSC responsiveness, or even the suppression of PAP. This aligns with the findings of McErlain-Naylor and Beato, who demonstrated that the efficacy of flywheel training is closely related to the inertia velocity relationship and emphasized that exercise intensity should be individualized and prescribed based on velocity rather than power to optimize training adaptations [54].

4.4. Practical Implications and Training Recommendations

The present study confirms that different flywheel training velocities induce distinct neuromuscular responses. Fast-velocity protocols were most effective in enhancing explosive outputs—particularly PEF, reactive strength, and vertical jump height—likely due to improved motor unit recruitment and stretch-shortening cycle efficiency. These protocols are best suited for athletes preparing for tasks requiring rapid eccentric–concentric transitions, such as sprinting, jumping, or change-of-direction movements. Moderate-velocity training was more effective in improving eccentric and CP and EM, indicating its value in developing sustained force output and joint-specific strength. It is recommended during strength-building, injury-prevention, or general preparatory training phases.
Practitioners are advised to integrate velocity-specific protocols according to training goals. Fast-velocity loading is ideal for peaking and potentiation phases, whereas moderate-velocity training fits structural development periods. As slow-velocity protocols did not produce meaningful acute benefits in this study, they should be applied cautiously or combined with other modalities when targeting explosive adaptations.

4.5. Study Limitations and Future Directions

This study provides valuable insights into the acute neuromechanical responses induced by velocity-specific flywheel training. However, certain limitations should be acknowledged. The investigation was limited to short-term PAP effects within 12 min following the intervention. Whether these acute improvements translate into long-term adaptations in muscular strength, power output, and sport-specific performance remains unclear. Future longitudinal studies are warranted to explore the chronic outcomes associated with different flywheel training intensities.
The sample population comprised only high-level male athletes within a narrow age range, which restricts the generalizability of the findings to broader demographics, including female athletes, older populations, and individuals with varying training backgrounds. Expanding participant diversity in future studies will improve external validity and enhance understanding of training responsiveness across subgroups.
In addition, the present design did not include a comparison with other PAP strategies such as traditional resistance training, plyometrics, or isometric protocols. Incorporating comparative groups in future research would help clarify the relative efficacy and specificity of flywheel training in eliciting performance enhancements.
Moreover, the study focused solely on performance outcomes and joint-level kinetics without integrating neuromuscular activation markers or tendon behavior measurements. The inclusion of electromyographic, ultrasound, or other physiological indices in future research could provide more comprehensive insights into the mechanisms underlying observed performance changes.

5. Conclusions

The present study demonstrates that both fast-speed (0.95–1.05 m/s) and medium-speed (0.65–0.75 m/s) flywheel half-squat protocols may acutely enhance lower-limb neuromuscular performance, particularly vertical jump ability, within a 4–12 min post-stimulation window. Fast-speed loading appears more favorable for tasks requiring rapid eccentric–concentric transitions, likely due to enhanced neural drive and stretch-shortening cycle efficiency. However, moderate-speed loading also produced meaningful improvements in power-related metrics and should not be overlooked in training design. These findings suggest that concentric movement velocity can serve as a practical indicator for load prescription in flywheel training. Future studies should explore long-term adaptations and include more diverse populations to enhance generalizability.

Author Contributions

H.W. and X.W. contributed to the design. H.W. and X.W. participated in most of the study steps. H.Z. and H.W. prepared the manuscript. H.Z. and X.W. assisted in designing the study and helped in the interpretation of the study. All authors have read and agreed to the published version of the manuscript.

Funding

No funding was received to support this study.

Institutional Review Board Statement

The study was conducted in accordance with the Declaration of Helsinki, and approved by the Institutional Review Board of Beijing Sport University Ethics Committee (protocol code: 2021004I, and date of approval: April 2021).

Informed Consent Statement

Informed consent was obtained from all subjects involved in the study.

Data Availability Statement

Datasets are available from the corresponding author upon reasonable request. The data are not publicly available due to ethical restrictions.

Acknowledgments

We are grateful to the Nanjing Sport College for providing the necessary facilities and environment that greatly facilitated our research. Furthermore, we acknowledge the collective efforts of all the authors whose contributions have been crucial in bringing this study to fruition.

Conflicts of Interest

The authors declare that the research was conducted in the absence of any commercial or financial relationships that could be construed as a potential conflict of interest.

References

  1. Kraemer, W.J.; Ratamess, N.A. Fundamentals of resistance training: Progression and exercise prescription. Med. Sci. Sports Exerc. 2004, 36, 674–688. [Google Scholar] [CrossRef] [PubMed]
  2. Stone, M.; Plisk, S.; Collins, D. Training principles: Evaluation of modes and methods of resistance training—A coaching perspective. Sports Biomech. 2002, 1, 79–103. [Google Scholar] [CrossRef] [PubMed]
  3. Nunes, J.P.; Grgic, J.; Cunha, P.M.; Ribeiro, A.S.; Schoenfeld, B.J.; de Salles, B.F.; Cyrino, E.S. What influence does resistance exercise order have on muscular strength gains and muscle hypertrophy? A systematic review and meta-analysis. Eur. J. Sport Sci. 2021, 21, 149–157. [Google Scholar] [CrossRef]
  4. Nájera-Ferrer, P.; Pérez-Caballero, C.; González-Badillo, J.J.; Pareja-Blanco, F. Effects of exercise sequence and velocity loss threshold during resistance training on following endurance and strength performance during concurrent training. Int. J. Sports Physiol. Perform. 2021, 16, 811–817. [Google Scholar] [CrossRef]
  5. Banyard, H.G.; Tufano, J.J.; Delgado, J.; Thompson, S.W.; Nosaka, K. Comparison of the effects of velocity-based training methods and traditional 1RM-percent-based training prescription on acute kinetic and kinematic variables. Int. J. Sports Physiol. Perform. 2019, 14, 246–255. [Google Scholar] [CrossRef]
  6. González-Badillo, J.J.; Yañez-García, J.M.; Mora-Custodio, R.; Rodríguez-Rosell, D. Velocity loss as a variable for monitoring resistance exercise. Int. J. Sports Med. 2017, 38, 217–225. [Google Scholar] [CrossRef]
  7. Liao, K.F.; Wang, X.X.; Han, M.Y.; Li, L.L.; Nassis, G.P.; Li, Y.M. Effects of velocity-based training vs. traditional 1RM percentage-based training on improving strength, jump, linear sprint and change of direction speed performance: A systematic review with meta-analysis. PLoS ONE 2021, 16, e0259790. [Google Scholar] [CrossRef]
  8. Norrbrand, L.; Fluckey, J.D.; Pozzo, M.; Tesch, P.A. Resistance training using eccentric overload induces early adaptations in skeletal muscle size. Eur. J. Appl. Physiol. 2008, 102, 271–281. [Google Scholar] [CrossRef]
  9. Maroto-Izquierdo, S.; García-López, D.; de Paz, J.A. Functional and muscle-size effects of flywheel resistance training with eccentric overload in professional handball players. J. Hum. Kinet. 2017, 60, 133–143. [Google Scholar] [CrossRef]
  10. Tesch, P.A.; Fernandez-Gonzalo, R.; Lundberg, T.R. Clinical applications of iso-inertial, eccentric-overload (YoYo™) resistance exercise. Front. Physiol. 2017, 8, 241. [Google Scholar] [CrossRef]
  11. Beato, M.; Bigby, A.E.J.; De Keijzer, K.L.; Nakamura, F.Y.; Coratella, G.; McErlain-Naylor, S.A. Post-activation potentiation effect of eccentric overload and traditional weightlifting exercise on jumping and sprinting performance in male athletes. PLoS ONE 2019, 14, e0222466. [Google Scholar] [CrossRef] [PubMed]
  12. Tous-Fajardo, J.; Maldonado, R.A.; Quintana, J.M.; Pozzo, M.; Tesch, P.A. The flywheel leg-curl machine: Offering eccentric overload for hamstring development. Int. J. Sports Physiol. Perform. 2006, 1, 293–298. [Google Scholar] [CrossRef] [PubMed]
  13. Carroll, K.M.; Wagle, J.P.; Sato, K.; Taber, C.B.; Yoshida, N.; Bingham, G.E.; Stone, M.H. Characterising overload in inertial flywheel devices for use in exercise training. Sports Biomech. 2019, 18, 390–401. [Google Scholar] [CrossRef] [PubMed]
  14. Krzysztofik, M.; Wilk, M.; Stastny, P.; Golas, A. Post-activation performance enhancement in the bench press throw: A systematic review and meta-analysis. Front. Physiol. 2021, 11, 598628. [Google Scholar] [CrossRef]
  15. McGowan, C.J.; Pyne, D.B.; Thompson, K.G.; Rattray, B. Warm-up strategies for sport and exercise: Mechanisms and applications. Sports Med. 2015, 45, 1523–1546. [Google Scholar] [CrossRef]
  16. Hodgson, M.; Docherty, D.; Robbins, D. Post-activation potentiation: Underlying physiology and implications for motor performance. Sports Med. 2005, 35, 585–595. [Google Scholar] [CrossRef]
  17. Rassier, D.E. The effects of length on fatigue and twitch potentiation in human skeletal muscle. Clin. Physiol. 2000, 20, 474–482. [Google Scholar] [CrossRef]
  18. Chiu, L.Z.; Fry, A.C.; Weiss, L.W.; Schilling, B.K.; Brown, L.E.; Smith, S.L. Postactivation potentiation response in athletic and recreationally trained individuals. J. Strength Cond. Res. 2003, 17, 671–677. [Google Scholar] [CrossRef]
  19. Kilduff, L.P.; Bevan, H.R.; Kingsley, M.I.; Owen, N.J.; Bennett, M.A.; Bunce, P.J.; Hore, A.M.; Maw, J.R.; Cunningham, D.J. Postactivation potentiation in professional rugby players: Optimal recovery. J. Strength Cond. Res. 2007, 21, 1134–1138. [Google Scholar] [CrossRef]
  20. Esformes, J.I.; Bampouras, T.M. Effect of back squat depth on lower-body postactivation potentiation. J. Strength Cond. Res. 2013, 27, 2997–3000. [Google Scholar] [CrossRef]
  21. Sale, D.G. Postactivation potentiation: Role in human performance. Exerc. Sport Sci. Rev. 2002, 30, 138–143. [Google Scholar] [CrossRef] [PubMed]
  22. Spudić, D.; Strojnik, V.; Štirn, I.; Pori, P.; Šarabon, N. Effects of flywheel resistance training on countermovement jump performance and vastus lateralis muscle stiffness: A controlled study. J. Sports Sci. 2024, 42, 2412–2423. [Google Scholar] [CrossRef] [PubMed]
  23. Sagelv, E.H.; Pedersen, S.; Nilsen, L.P.R.; Casolo, A.; Welde, B.; Randers, M.B.; Pettersen, S.A. Flywheel squats versus free weight high load squats for improving high velocity movements in football: A randomized controlled trial. BMC Sports Sci. Med. Rehabil. 2020, 12, 61. [Google Scholar] [CrossRef]
  24. Rossi, C.; Vasiljevic, I.; Manojlovic, M.; Trivic, T.; Ranisavljev, M.; Stajer, V.; Thomas, E.; Bianco, A.; Drid, P. Optimizing strength training protocols in young females: A comparative study of velocity-based and percentage-based training programs. Heliyon 2024, 10, e30644. [Google Scholar] [CrossRef]
  25. Sabido, R.; Hernández-Davó, J.L.; Pereyra-Gerber, G.T. Influence of different inertial loads on basic training variables during the flywheel squat exercise. Int. J. Sports Physiol. Perform. 2018, 13, 482–489. [Google Scholar] [CrossRef]
  26. Aagaard, P.; Simonsen, E.B.; Andersen, J.L.; Magnusson, P.; Dyhre-Poulsen, P. Increased rate of force development and neural drive of human skeletal muscle following resistance training. J. Appl. Physiol. 2002, 93, 1318–1326. [Google Scholar] [CrossRef]
  27. Fu, K.; Chen, L.; Poon, E.T.; Wang, R.; Li, Q.; Liu, H.; Ho, I.M.K. Post-activation performance enhancement of flywheel training on lower limb explosive power performance. Front. Physiol. 2023, 14, 1217045. [Google Scholar] [CrossRef]
  28. Rebelo, A.; Pereira, J.R.; Martinho, D.V.; Duarte, J.P.; Coelho-E-Silva, M.J.; Valente-Dos-Santos, J. How to improve the Reactive Strength Index among male athletes? A systematic review with meta-analysis. Healthcare 2022, 10, 593. [Google Scholar] [CrossRef]
  29. Vandenboom, R. Modulation of skeletal muscle contraction by myosin phosphorylation. Compr. Physiol. 2016, 7, 171–212. [Google Scholar] [CrossRef]
  30. Tillin, N.A.; Bishop, D. Factors modulating post-activation potentiation and its effect on performance of subsequent explosive activities. Sports Med. 2009, 39, 147–166. [Google Scholar] [CrossRef]
  31. von Walden, F.; Hjalmarsson, E.; Reimeringer, M.; Kvist, O.; Raffalt, P.C.; Pontén, E.; Fernandez-Gonzalo, R. Comparative analysis of power, work and muscle activation during weight-stack and iso-inertial flywheel resistance exercise in young adults with cerebral palsy. J. Rehabil. Med. 2020, 52, jrm00060. [Google Scholar] [CrossRef] [PubMed]
  32. Shi, J.; Yan, B.; Yu, M.; Wang, Z.; Wang, Y.; Liu, H.; Zhang, W.; Girard, O. Heavier loads in flywheel exercise induce greater post-activation performance enhancement in countermovement jumps compared to heavy Smith machine squats in males. Biol. Sport. 2024, 41, 231–240. [Google Scholar] [CrossRef] [PubMed]
  33. Weakley, J.; Mann, B.; Banyard, H.; McLaren, S.; Scott, T.; Garcia-Ramos, A. Velocity-based training: From theory to application. Strength Cond. J. 2021, 43, 31–49. [Google Scholar] [CrossRef]
  34. Nuñez Sanchez, F.J.; Sáez de Villarreal, E. Does flywheel paradigm training improve muscle volume and force? A meta-analysis. J. Strength Cond. Res. 2017, 31, 3177–3186. [Google Scholar] [CrossRef]
  35. Douglas, J.; Pearson, S.; Ross, A.; McGuigan, M. Chronic adaptations to eccentric training: A systematic review. Sports Med. 2017, 47, 917–941. [Google Scholar] [CrossRef]
  36. Camargo, P.R.; Alburquerque-Sendín, F.; Salvini, T.F. Eccentric training as a new approach for rotator cuff tendinopathy: Review and perspectives. World J. Orthop. 2014, 5, 634–644. [Google Scholar] [CrossRef]
  37. Caruso, J.F.; Hernandez, D.A.; Porter, A.; Schweikert, T.; Saito, K.; Cho, M.; De Garmo, N.; Nelson, N.M. Integrated electromyography and performance outcomes to inertial resistance exercise. J. Strength Cond. Res. 2006, 20, 151–156. [Google Scholar] [CrossRef]
  38. Martín-Rivera, F.; Beato, M.; Alepuz-Moner, V.; Maroto-Izquierdo, S. Use of concentric linear velocity to monitor flywheel exercise load. Front. Physiol. 2022, 13, 961572. [Google Scholar] [CrossRef]
  39. Stojanović, M.D.M.; Mikić, M.; Drid, P.; Calleja-González, J.; Maksimović, N.; Belegišanin, B.; Sekulović, V. Greater power but not strength gains using flywheel versus equivolumed traditional strength training in junior basketball players. Int. J. Environ. Res. Public Health 2021, 18, 1181. [Google Scholar] [CrossRef]
  40. Harris-Love, M.O.; Gollie, J.M.; Keogh, J.W.L. Eccentric exercise: Adaptations and applications for health and performance. J. Funct. Morphol. Kinesiol. 2021, 6, 96. [Google Scholar] [CrossRef]
  41. Krishnan, C.; Allen, E.J.; Williams, G.N. Effect of knee position on quadriceps muscle force steadiness and activation strategies. Muscle Nerve 2011, 43, 563–573. [Google Scholar] [CrossRef] [PubMed]
  42. Fiorilli, G.; Mariano, I.; Iuliano, E.; Giombini, A.; Ciccarelli, A.; Buonsenso, A.; Calcagno, G.; di Cagno, A. Isoinertial eccentric-overload training in young soccer players: Effects on strength, sprint, change of direction, agility and soccer shooting precision. J. Sports Sci. Med. 2020, 19, 213–223. [Google Scholar] [PubMed] [PubMed Central]
  43. Rassier, D.E.; Macintosh, B.R. Coexistence of potentiation and fatigue in skeletal muscle. Braz. J. Med. Biol. Res. 2000, 33, 499–508. [Google Scholar] [CrossRef] [PubMed]
  44. Onambélé, G.L.; Maganaris, C.N.; Mian, O.S.; Tam, E.; Rejc, E.; McEwan, I.M.; Narici, M.V. Neuromuscular and balance responses to flywheel inertial versus weight training in older persons. J. Biomech. 2008, 41, 3133–3138. [Google Scholar] [CrossRef]
  45. Shimizu, T.; Tsuchiya, Y.; Ueda, H.; Izumi, S.; Ochi, E. Eight-week flywheel training enhances jump performance and stretch-shortening cycle function in collegiate basketball players. Eur. J. Sport Sci. 2025, 25, e12257. [Google Scholar] [CrossRef]
  46. Hu, Z.; Liu, Y.; Huang, K.; Huang, H.; Zhang, Y.; Yuan, X. Effects of inertial flywheel training vs. accentuated eccentric loading training on strength, power, and speed in well-trained male college sprinters. Life 2024, 14, 1081. [Google Scholar] [CrossRef]
  47. Dorrell, H.F.; Smith, M.F.; Gee, T.I. Comparison of velocity-based and traditional percentage-based loading methods on maximal strength and power adaptations. J. Strength Cond. Res. 2020, 34, 46–53. [Google Scholar] [CrossRef]
  48. Muñoz-López, A.; Pozzo, M.; Floria, P. Real-time mechanical responses to overload and fatigue using a flywheel training device. J. Biomech. 2021, 121, 110429. [Google Scholar] [CrossRef]
  49. McErlain-Naylor, S.A.; Beato, M. Post flywheel squat potentiation of vertical and horizontal ground reaction force parameters during jumps and changes of direction. Sports 2021, 9, 5. [Google Scholar] [CrossRef]
  50. Seitz, L.B.; Haff, G.G. Factors modulating post-activation potentiation of jump, sprint, throw, and upper-body ballistic performances: A systematic review with meta-analysis. Sports Med. 2016, 46, 231–240. [Google Scholar] [CrossRef]
  51. Hortobágyi, T.; DeVita, P.; LaStayo, P. Letter: Neuromuscular and balance responses to flywheel inertial versus weight training in older persons. J. Biomech. 2009, 42, 956; author reply 957. [Google Scholar] [CrossRef]
  52. Petré, H.; Ovendal, A.; Westblad, N.; Ten Siethoff, L.; Rosdahl, H.; Psilander, N. Effect of the intrasession exercise order of flywheel resistance and high-intensity interval training on maximal strength and power performance in elite team-sport athletes. J. Strength Cond. Res. 2023, 37, 2389–2396. [Google Scholar] [CrossRef] [PubMed]
  53. Blazevich, A.J.; Babault, N. Post-activation potentiation versus post-activation performance enhancement in humans: Historical perspective, underlying mechanisms, and current issues. Front. Physiol. 2019, 10, 1359. [Google Scholar] [CrossRef] [PubMed]
  54. McErlain-Naylor, S.A.; Beato, M. Concentric and eccentric inertia-velocity and inertia-power relationships in the flywheel squat. J. Sports Sci. 2021, 39, 1136–1143. [Google Scholar] [CrossRef]
Figure 1. Flowchart depicting the experimental protocol, including warm-up, speed assignment, flywheel training, rest intervals, and post-training performance evaluation.
Applsci 15 04388 g001
Figure 2. (A) Effects of time and flywheel speed on reactive strength index. (B) Reactive strength index across different flywheel speeds. (C) Average power output across different time points. (D) Average power output across different flywheel speeds. (E) Vertical jump height across different time points. (F) Vertical jump height across different flywheel speeds. * indicates a significant difference compared to the baseline value; # indicates a significant difference compared to the 30 s mark.
Applsci 15 04388 g002aApplsci 15 04388 g002bApplsci 15 04388 g002c
Table 1. Basic information of experimental subjects (n = 41).
Age (y)Height (m)Weight (kg)BMITraining Duration (y)
20.14 ± 0.931.81 ± 0.0672.65 ± 10.2722.06 ± 2.455.86 ± 2.72
Table 2. Peak collision force and peak extension force across time points and velocity conditions.
IntensityTimePCF (N/kg)d vs. Baseline 95% CIPEF (N/kg)d vs. Baseline
Baseline 20.82 ± 4.68-16.04 ± 3.61-
Fast speed30 s19.69 ± 4.650.24 [−0.20, 0.68]14.31 ± 2.31 *0.52 [0.08, 0.96]
4 min23.29 ± 4.32 #0.54 [0.10, 0.98]18.71 ± 3.38 *,#0.75 [0.30, 1.20]
8 min23.62 ± 4.44 *,#0.59 [0.15, 1.03]18.41 ± 3.47 *,#0.67 [0.22, 1.12]
12 min23.31 ± 4.62 #0.54 [0.10, 0.98]18.74 ± 3.69 *,#0.77 [0.32, 1.22]
Medium speed30 s19.64 ± 4.40.25 [−0.19, 0.69]14.08 ± 3.04 *0.58 [0.14, 1.02]
4 min22.32 ± 4.460.32 [−0.12, 0.76]17.4 ± 3.28 *,#0.50 [0.06, 0.94]
8 min22.19 ± 4.910.29 [−0.15, 0.73]17.63 ± 4.79 *,#0.59 [0.15, 1.03]
12 min21.89 ± 5.610.23 [−0.21, 0.67]17.11 ± 3.33 *,#0.49 [0.05, 0.93]
Slow speed30 s19.14 ± 5.640.36 [−0.08, 0.80]14.84 ± 2.270.33 [−0.11, 0.77]
4 min20.13 ± 3.790.07 [−0.37, 0.51]15.53 ± 3.040.26 [−0.18, 0.70]
8 min20.85 ± 4.220.01 [−0.43, 0.45]15.58 ± 3.310.13 [−0.31, 0.57]
12 min21.06 ± 4.370.05 [−0.39, 0.49]15.28 ± 3.180.23 [−0.21, 0.67]
Note: * indicates a significant difference compared to the baseline value; # indicates a significant difference compared to the 30 s mark; PCF: peak collision force; PEF: peak extension force; EP: eccentric power of the knee joint; CP: concentric power of the knee joint; EM: extension moment of the knee joint. Effect sizes (Cohen’s d) are reported with 95% confidence intervals (95% CI). The statistical power (1 − β) for main effects ranged from 0.55 to 0.88.
Table 3. Knee joint power and moment variables across time points and velocity conditions.
IntensityTimeEP (Nm/s/kg)d vs. Baseline
95% CI
CP (Nm/s/kg)d vs. Baseline
95% CI
EM (Nm/s/kg)d vs. Baseline
95% CI
Baseline −27.47 ± 7.16-14.27 ± 2.86-2.7 ± 0.44-
Fast speed30 s4.94 ± 5.90.37 [−0.07, 0.81]13.28 ± 2.70.36 [−0.08, 0.80]2.6 ± 0.5 *,#0.24 [−0.20, 0.68]
4 min−31.37 ± 7.11 *,#0.55 [0.11, 0.99]17.29 ± 2.55 *,#1.18 [0.74, 1.62]2.92 ± 0.45 *,#0.52 [0.08, 0.96]
8 min−31.61 ± 6.48 *,#0.61 [0.17, 1.05]17.6 ± 2.17 *,#1.20 [0.76, 1.64]2.9 ± 0.46 *,#0.46 [0.02, 0.90]
12 min−31.5 ± 7.19 *,#0.58 [0.14, 1.02]18 ± 2.83 *,#1.15 [0.71, 1.59]2.86 ± 0.42 *,#0.36 [−0.08, 0.80]
Medium speed30 s−24.89 ± 6.88 *0.36 [−0.08, 0.80]12.64 ± 2.570.57 [0.13, 1.01]2.55 ± 0.54 *0.28 [−0.16, 0.72]
4 min−33.65 ± 7.25 *,#0.86 [0.42, 1.30]18.13 ± 2.53 *,#1.31 [0.87, 1.75]3.03 ± 0.43 *,#0.76 [0.32, 1.20]
8 min−33.47 ± 7.01 *,#0.84 [0.40, 1.28]18 ± 3.33 *,#1.20 [0.76, 1.64]3.09 ± 0.43 *,#0.91 [0.47, 1.35]
12 min−33.68 ± 7.47 *,#0.87 [0.43, 1.31]18.6 ± 2.97 *,#1.34 [0.90, 1.78]3.05 ± 0.4 *,#0.79 [0.35, 1.23]
Slow speed30 s−25.82 ± 6.370.23 [−0.21, 0.67]13.7 ± 2.130.45 [0.01, 0.89]2.71 ± 0.390.02 [−0.42, 0.46]
4 min−28.19 ± 6.640.10 [−0.34, 0.54]14.65 ± 2.010.13 [−0.31, 0.57]2.76 ± 0.410.14 [−0.30, 0.58]
8 min−28.51 ± 7.20.15 [−0.29, 0.59]14.96 ± 2.50.24 [−0.20, 0.68]2.68 ± 0.410.05 [−0.39, 0.49]
12 min−28.39 ± 7.760.13 [−0.31, 0.57]14.91 ± 2.730.23 [−0.21, 0.67]2.67 ± 0.390.07 [−0.37, 0.51]
Note: * indicates a significant difference compared to the baseline value; # indicates a significant difference compared to the 30 s mark; PCF: peak collision force; PEF: peak extension force; EP: eccentric power of the knee joint; CP: concentric power of the knee joint; EM: extension moment of the knee joint. Effect sizes (Cohen’s d) are reported with 95% confidence intervals (95% CI). The statistical power (1 − β) for main effects ranged from 0.55 to 0.88.
Table 4. Average power output, reactive strength index, and vertical jump height across time points and velocity conditions.
IntensityTimeRSI (m/s)d vs. BaselineAPO (W/kg)d vs. BaselineVJH (m)d vs. Baseline
Baseline 1.02 ± 0.31-34.48 ± 4.64-0.46 ± 0.03-
Fast speed30 s0.92 ± 0.250.35 [−0.09, 0.79]31.93 ± 4.81 *0.56 [0.12, 1.00]0.41 ± 0.04 *1.38 [0.94, 1.82]
4 min1.18 ± 0.32 *,#0.53 [0.09, 0.97]37.65 ± 4.46 *,#0.69 [0.25, 1.13]0.54 ± 0.04 *,#2.41 [1.97, 2.85]
8 min1.17 ± 0.3 *,#0.49 [0.05, 0.93]37.57 ± 4.37 *,#0.67 [0.23, 1.11]0.54 ± 0.03 *,#2.78 [2.34, 3.22]
12 min1.17 ± 0.31 *,#0.49 [0.05, 0.93]37.44 ± 4.46 *,#0.65 [0.21, 1.09]0.54 ± 0.03 *,#2.73 [2.29, 3.17]
Medium speed30 s0.9 ± 0.28 *0.42 [−0.02, 0.86]32.05 ± 4.28 *0.52 [0.08, 0.96]0.41 ± 0.03 *1.53 [1.09, 1.97]
4 min1.1 ± 0.34 #0.25 [−0.19, 0.69]36.2 ± 4.18 *,#0.37 [−0.07, 0.81]0.51 ± 0.04 *,#1.32 [0.88, 1.76]
8 min1.1 ± 0.32 #0.25 [−0.19, 0.69]36.27 ± 4.22 *,#0.38 [−0.06, 0.82]0.50 ± 0.03 *,#1.21 [0.77, 1.65]
12 min1.09 ± 0.34 #0.23 [−0.21, 0.67]36.06 ± 4.49 *,#0.35 [−0.09, 0.79]0.50 ± 0.04 *,#1.11 [0.67, 1.55]
Slow speed30 s0.86 ± 0.28 *0.52 [0.08, 0.96]32.38 ± 4.56 *0.45 [0.01, 0.89]0.39 ± 0.04 *1.89 [1.45, 2.33]
4 min1.0 ± 0.29 #0.07 [−0.37, 0.50]34.33 ± 4.26 #0.09 [−0.35, 0.53]0.45 ± 0.03 #0.01 [−0.43, 0.45]
8 min1.0 ± 0.33 #0.06 [−0.38, 0.50]34.21 ± 4.4 #0.07 [−0.37, 0.51]0.45 ± 0.04 #0.01 [−0.43, 0.45]
12 min1.01 ± 0.450.04 [−0.40, 0.48]34.18 ± 4.52 #0.06 [−0.38, 0.50]0.45 ± 0.03 #0.01 [−0.43, 0.45]
Note: * indicates a significant difference compared to the baseline value; # indicates a significant difference compared to the 30 s mark; RSI: reactive strength index, APO = average power output, VJH: vertical jump height. Effect sizes (Cohen’s d) are reported with 95% confidence intervals (95% CI). The statistical power (1 − β) for main effects ranged from 0.55 to 0.88.
Disclaimer/Publisher’s Note: The statements, opinions and data contained in all publications are solely those of the individual author(s) and contributor(s) and not of MDPI and/or the editor(s). MDPI and/or the editor(s) disclaim responsibility for any injury to people or property resulting from any ideas, methods, instructions or products referred to in the content.

