
Experimental Investigation into Permeable Asphalt Pavement Based on Small-Scale Accelerated Testing


Abstract
1. Introduction
2. Materials and Methods
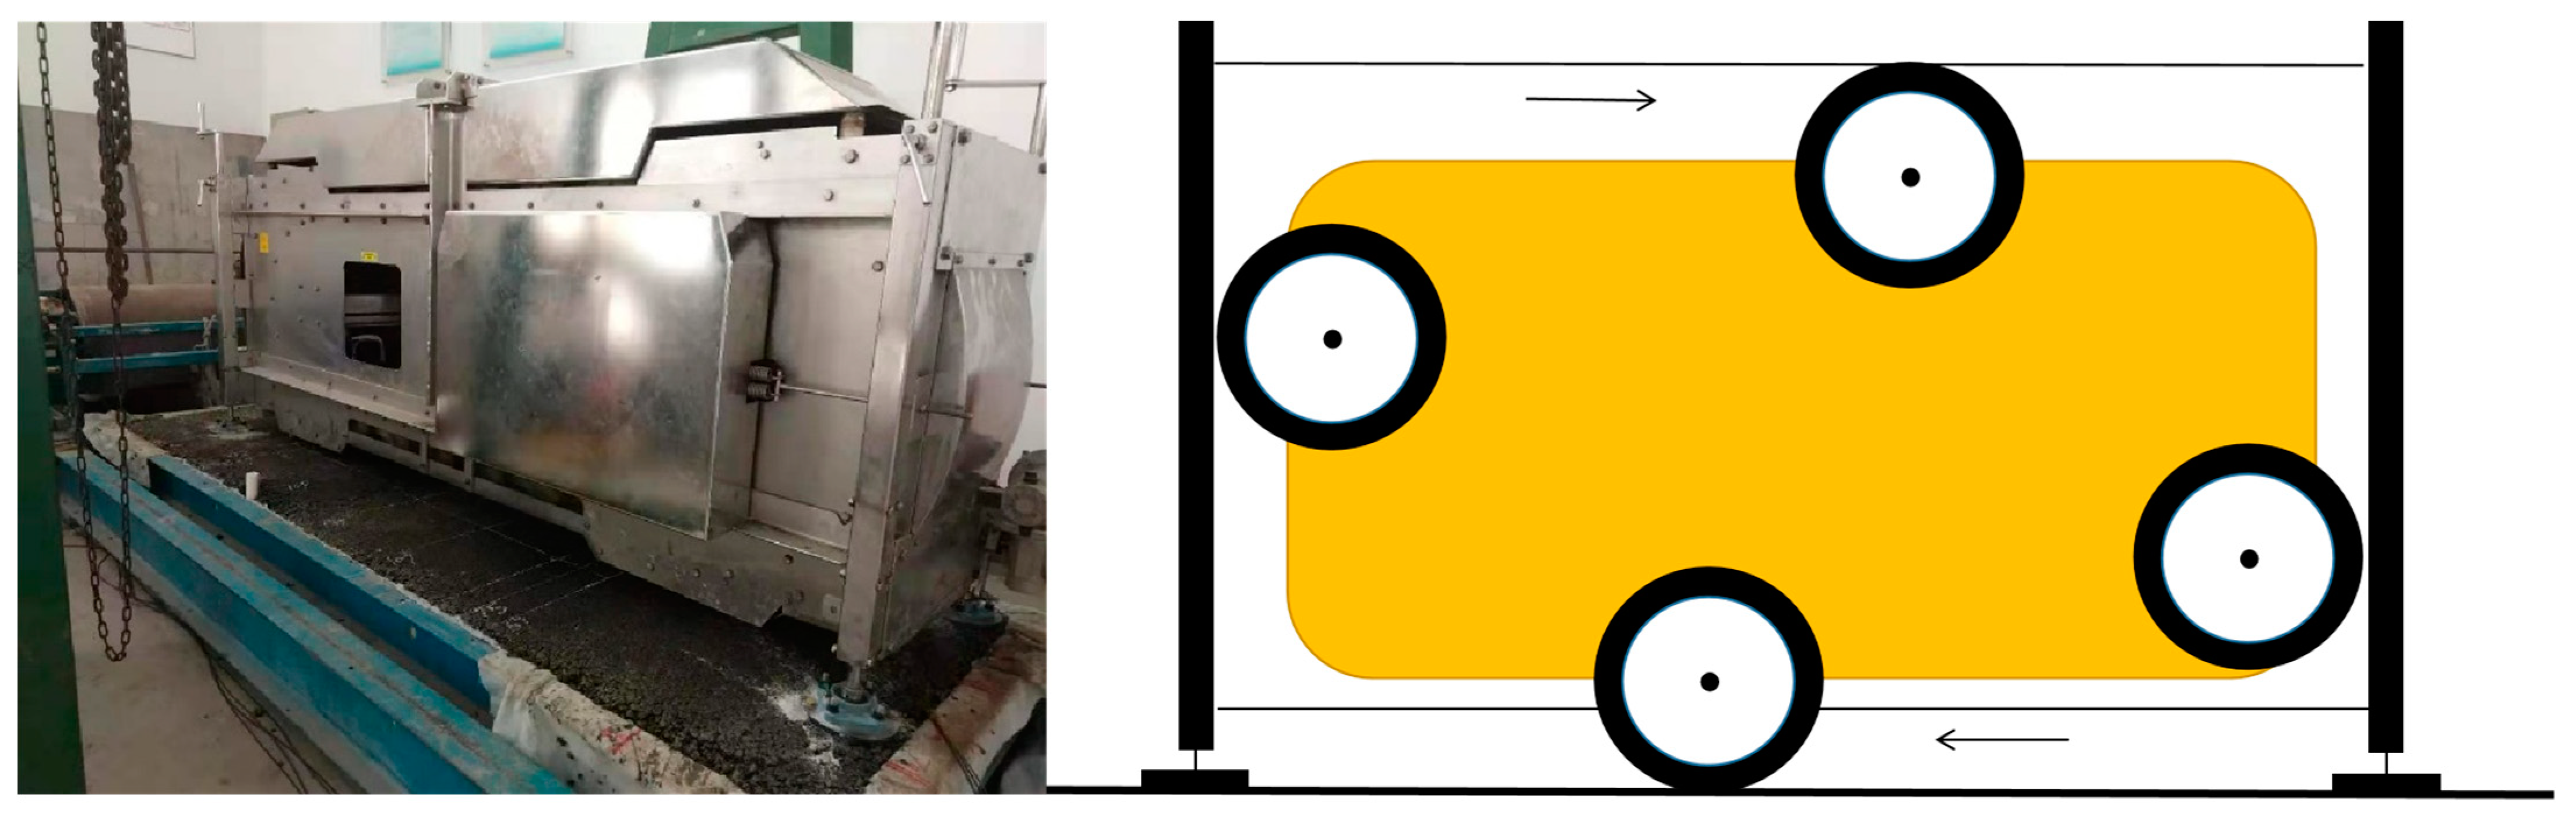
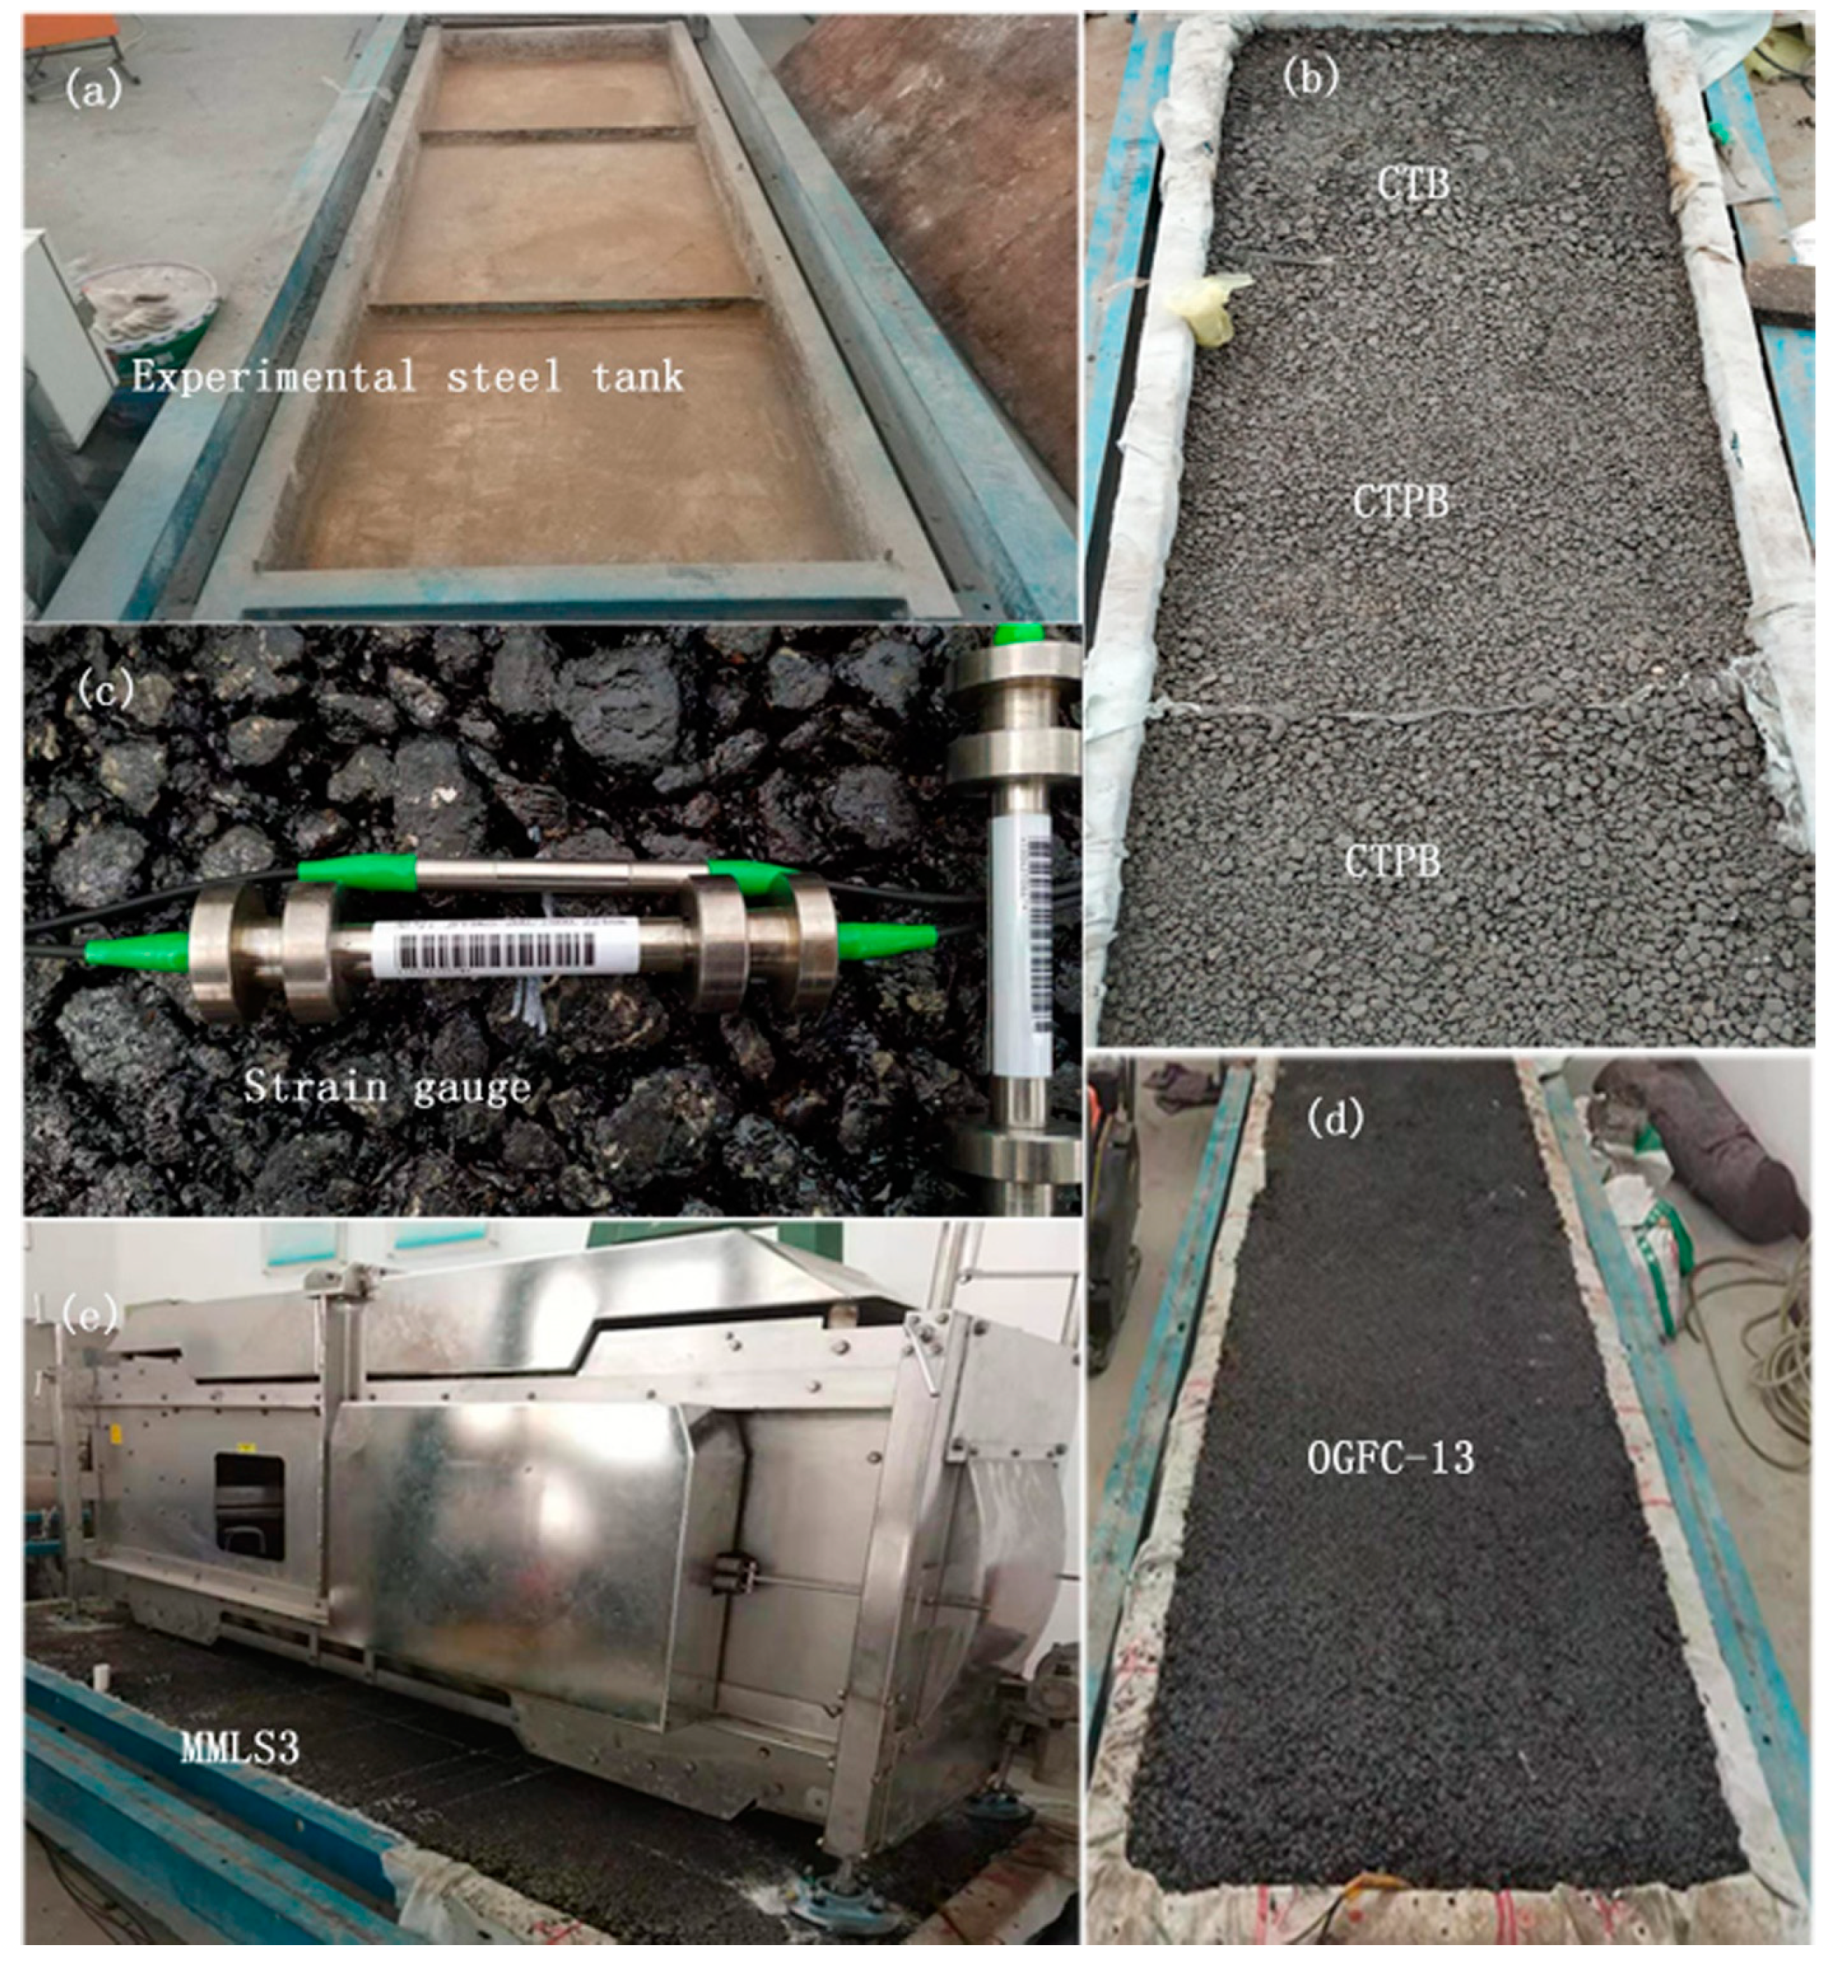
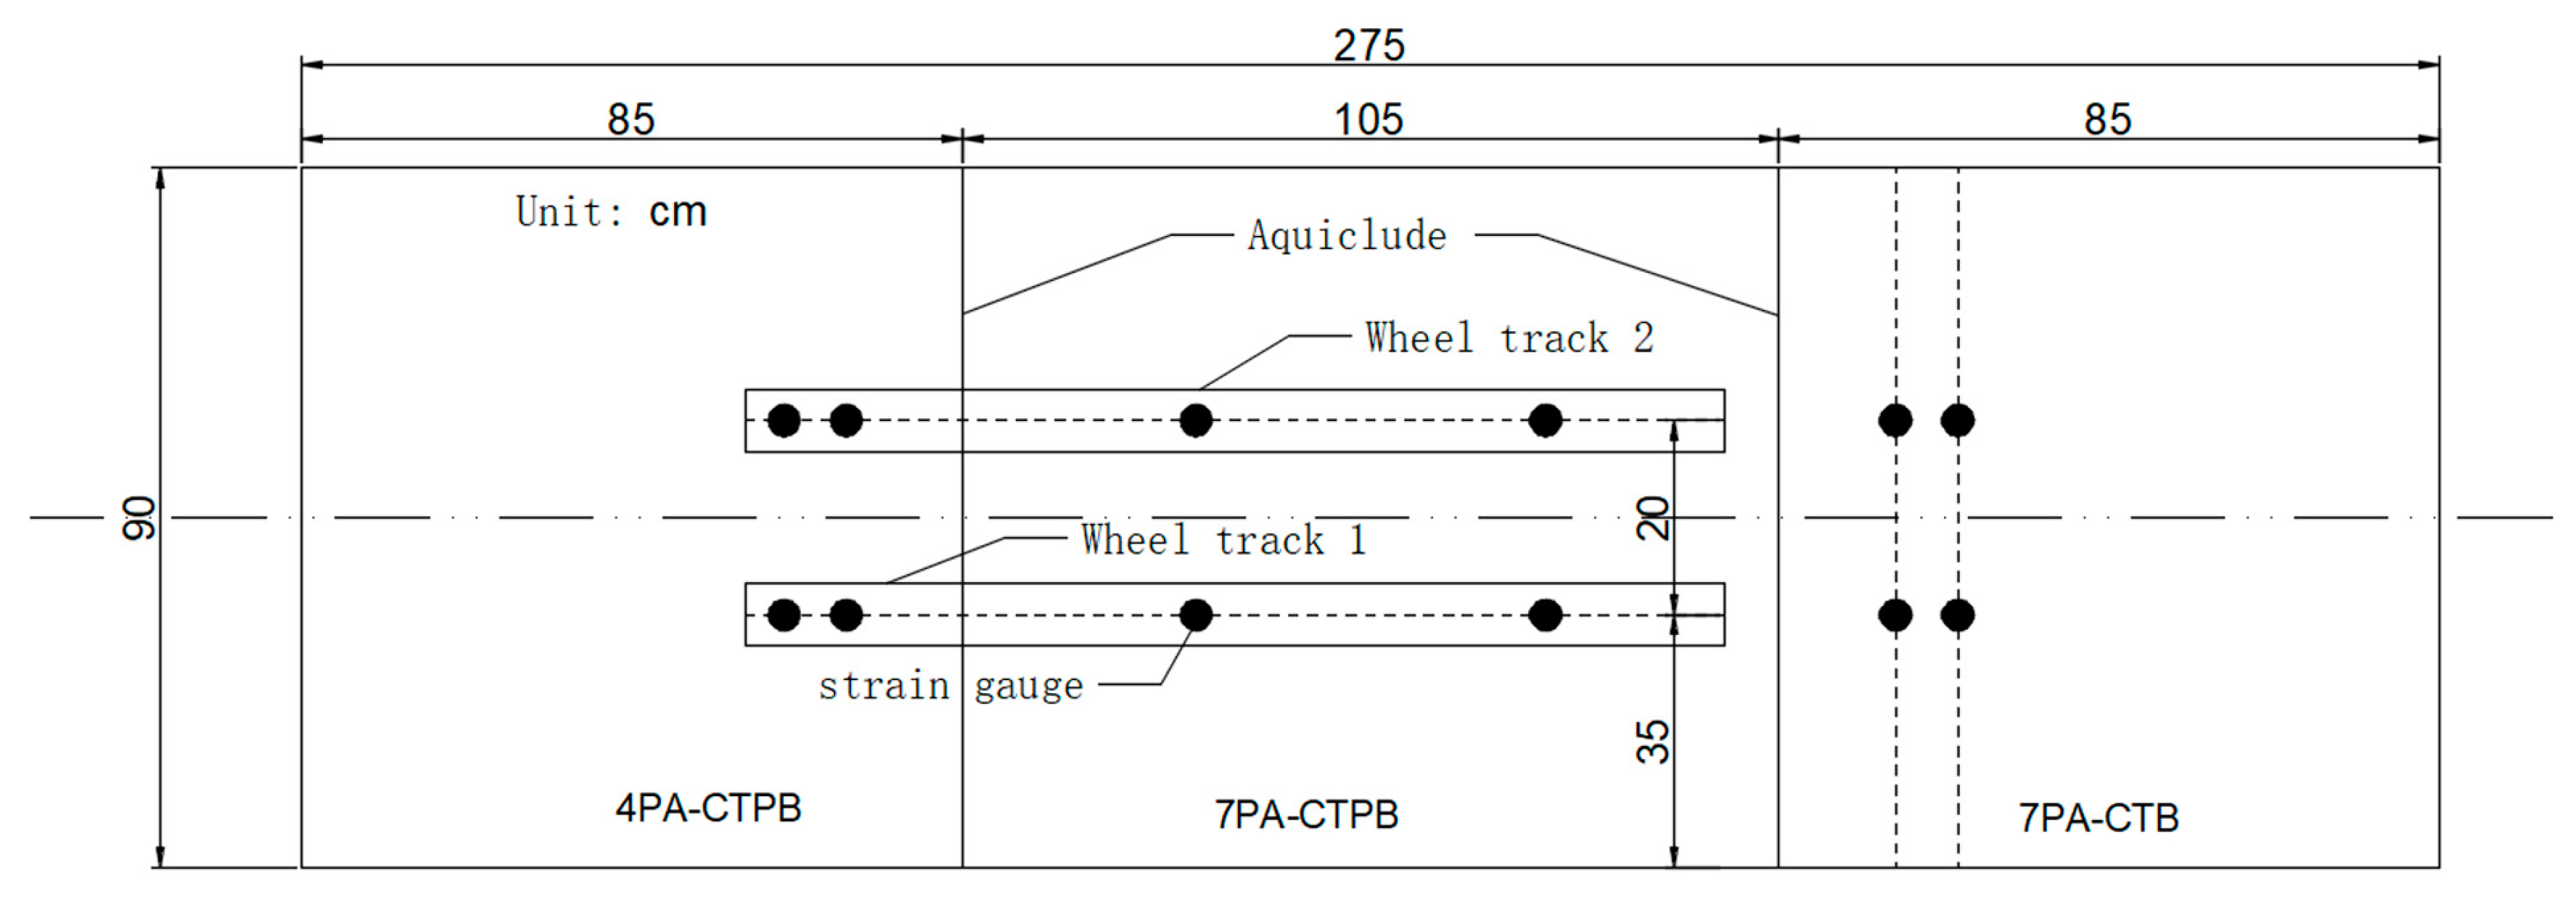
2.1. Model Mobile Load Simulator MMLS3
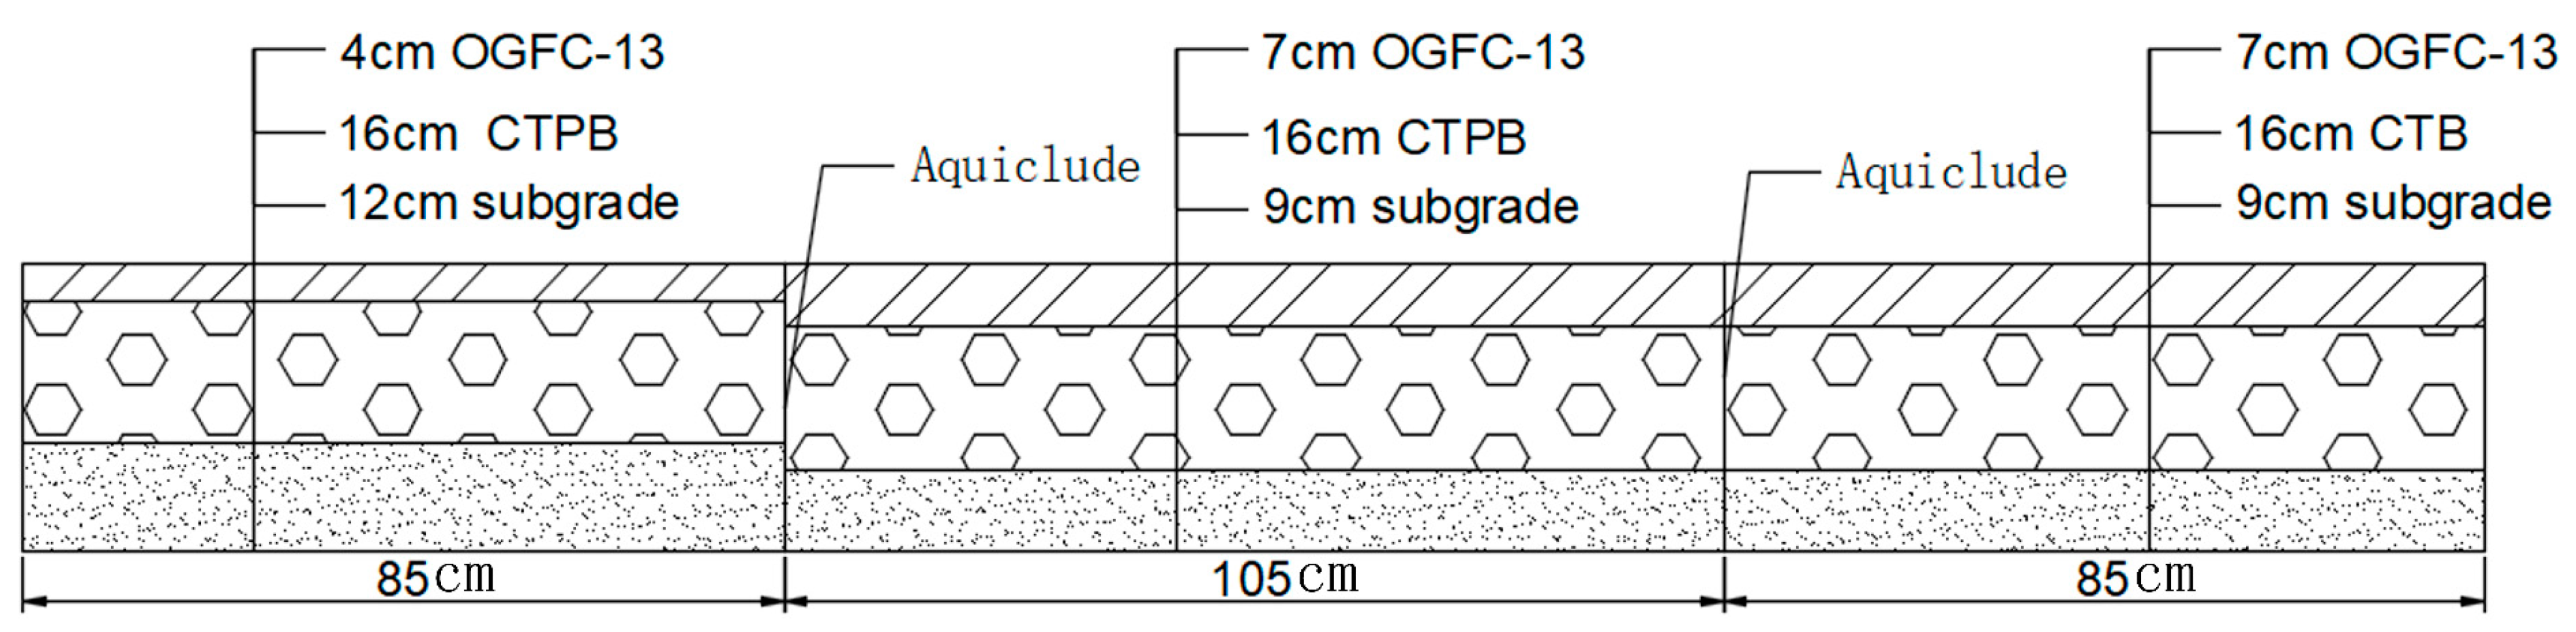
2.2. Structures and Materials
2.3. Preparation of Structures
- (1)
- Subgrade: The waterproof geotextile was spread all over the bottom and all around the steel tank, soil evenly sprinkled on the inside of the steel tank, and a small roller used to compact it to the required thickness and compaction;
- (2)
- Base: The filtration geotextile was laid on top of the subgrade of 4PA-CTPB and 7PA-CTPB, and the waterproof geotextile was used to separate 4PA-CTPB, 7PA-CTPB, and 7PA-CTB. Then the base materials were evenly paved and rolled to the required thickness;
- (3)
- Interface bonding layer: After 7 days, a layer of tack coat was evenly spread on top of the base, and the permeability of base was examined;
- (4)
- Surface layer: After 2 days, the porous asphalt mixture was paved and rolled to the required thickness with a small roller; the paving temperature was 175 °C, and the rolling temperature was 150 °C.
2.4. Test Procedure
3. Results and Discussion
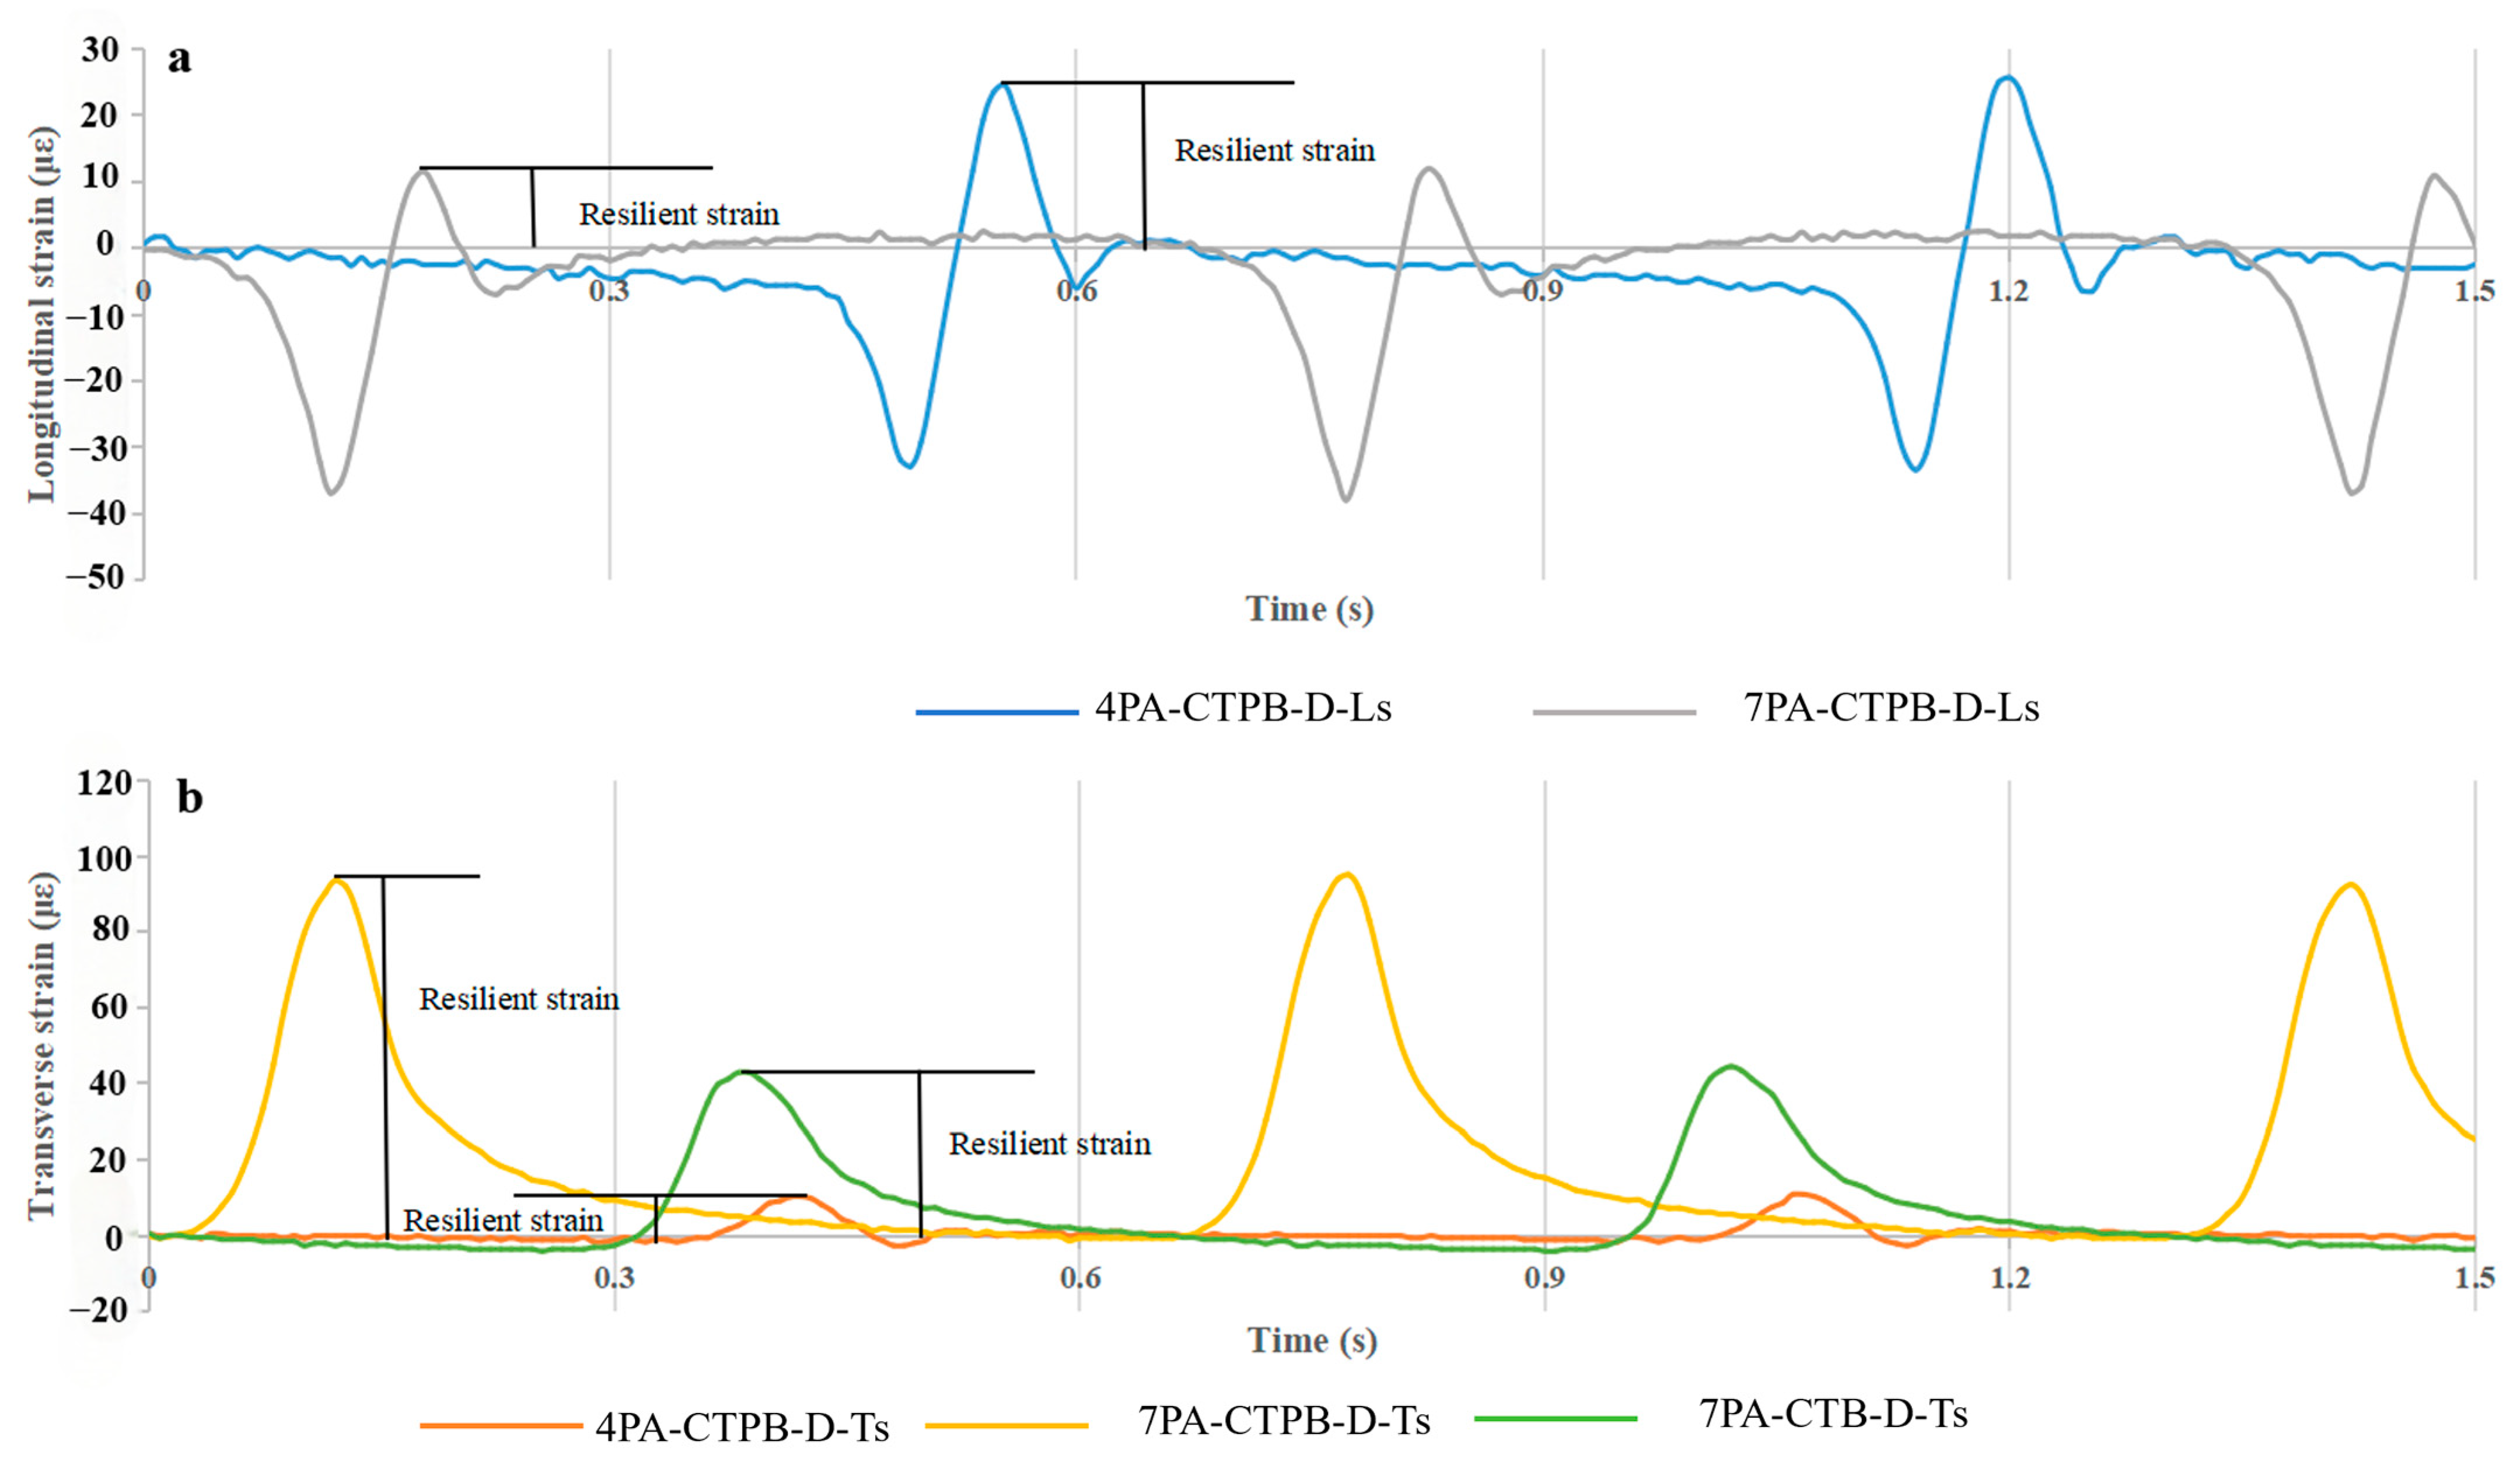
3.1. Dry Condition
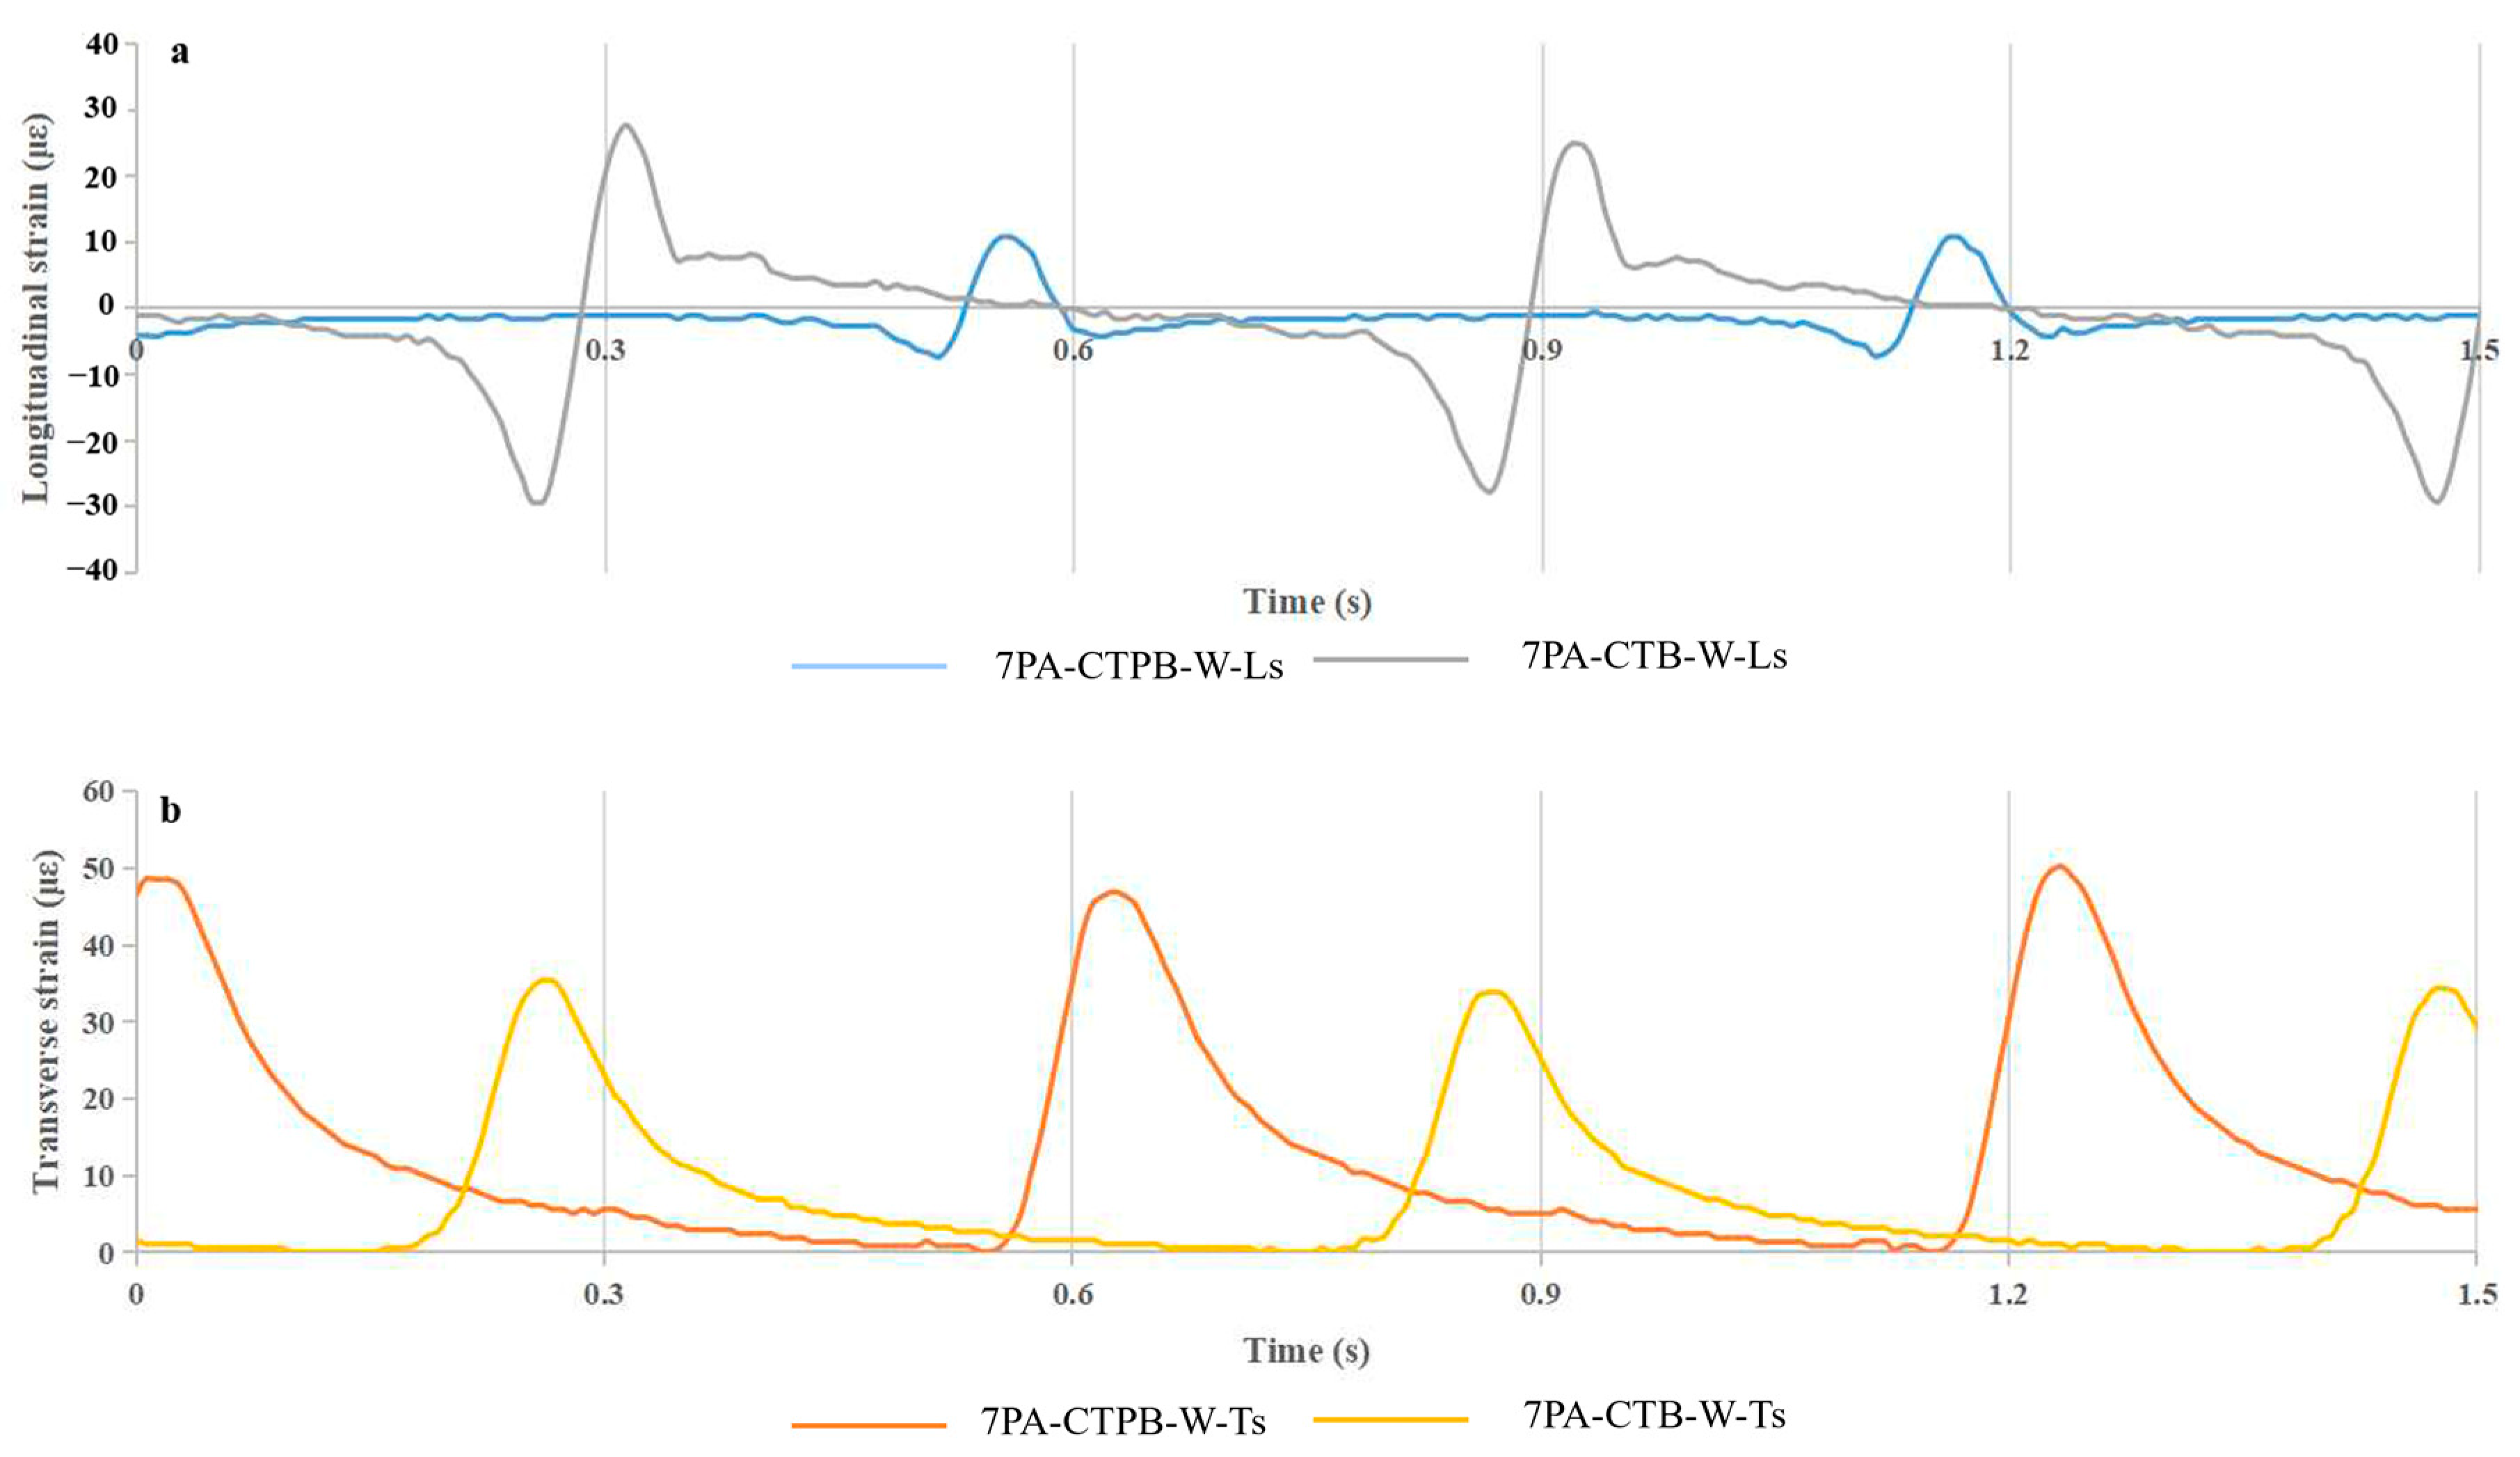
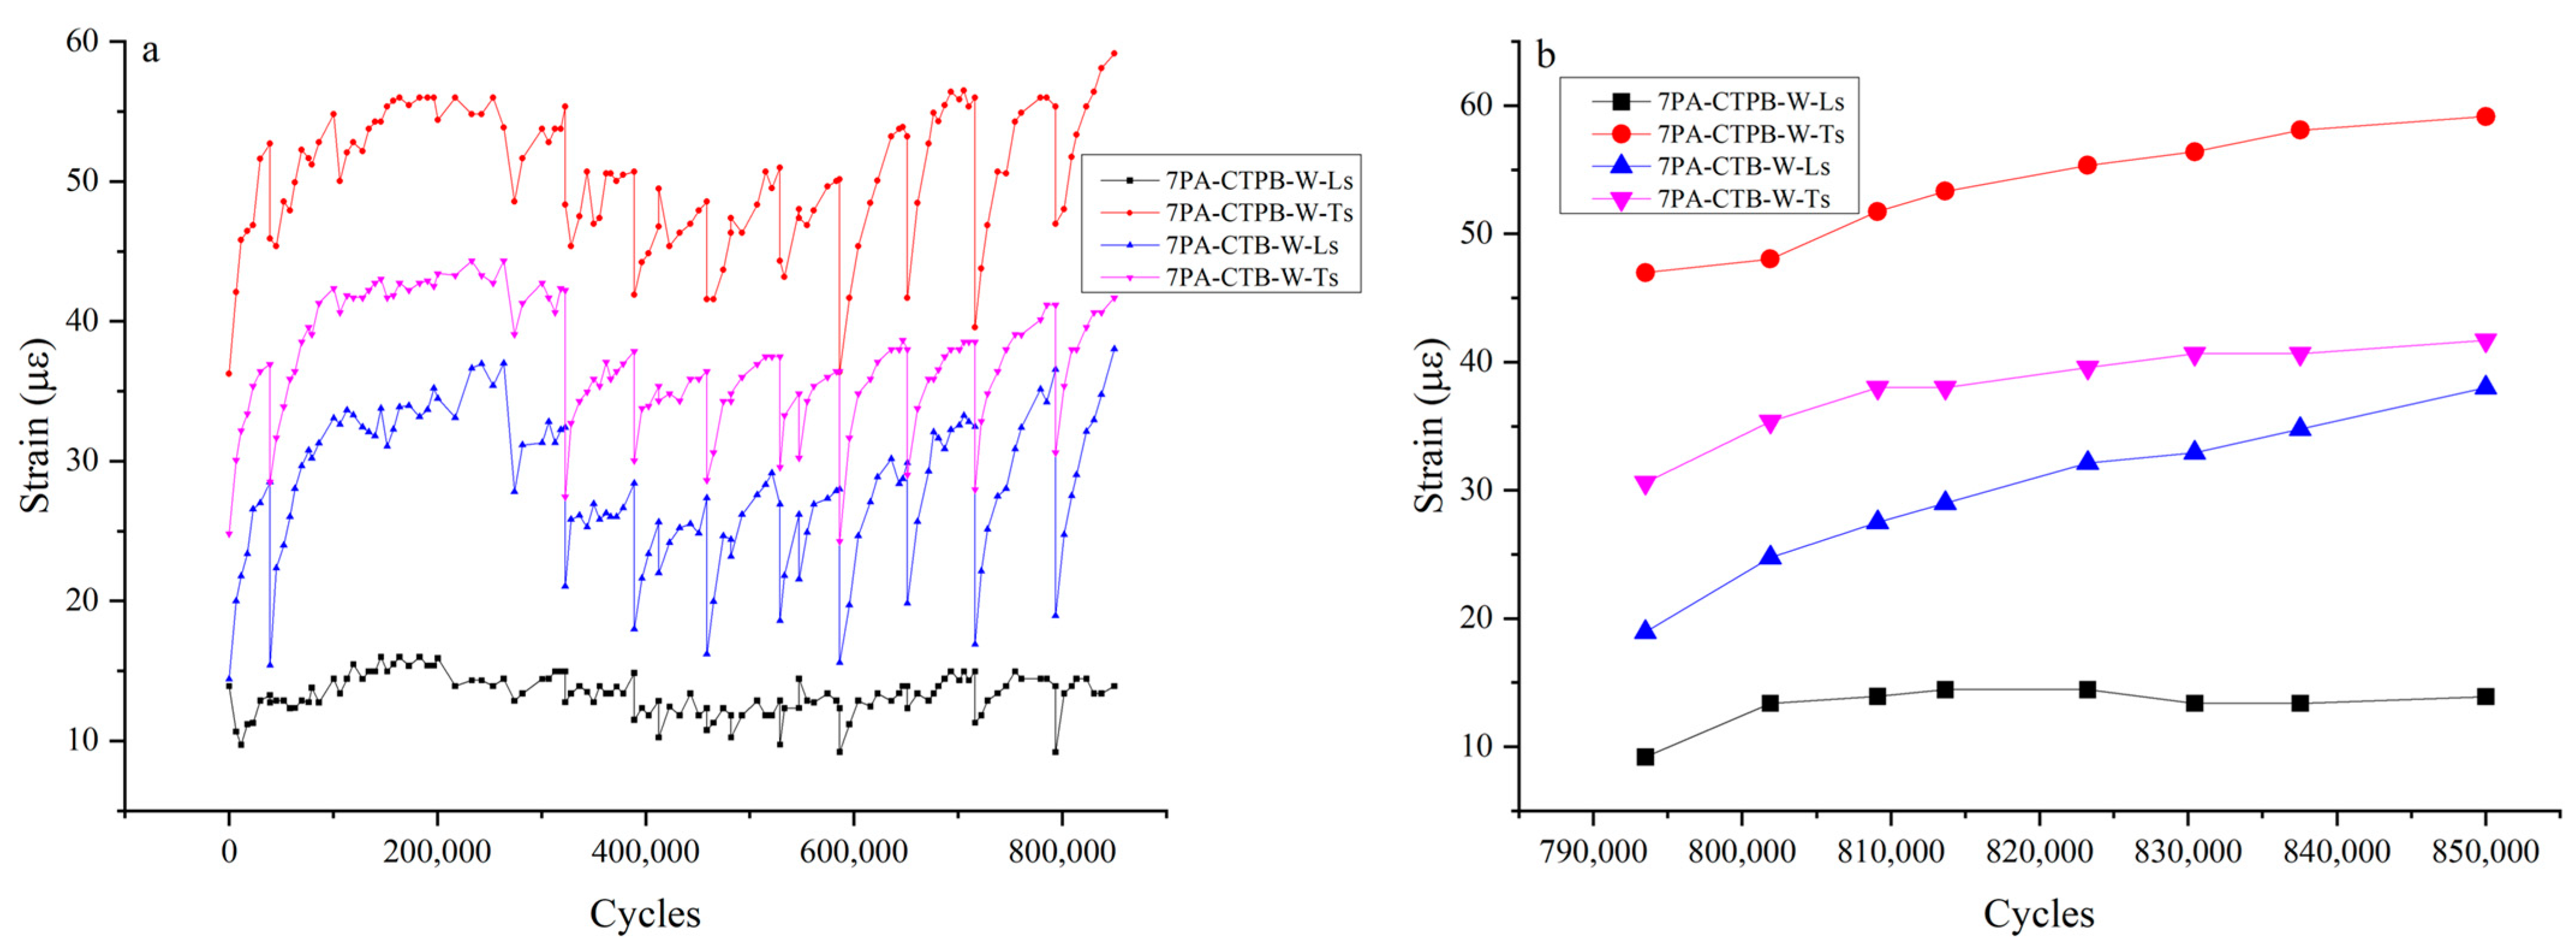
3.2. Wet Conditions
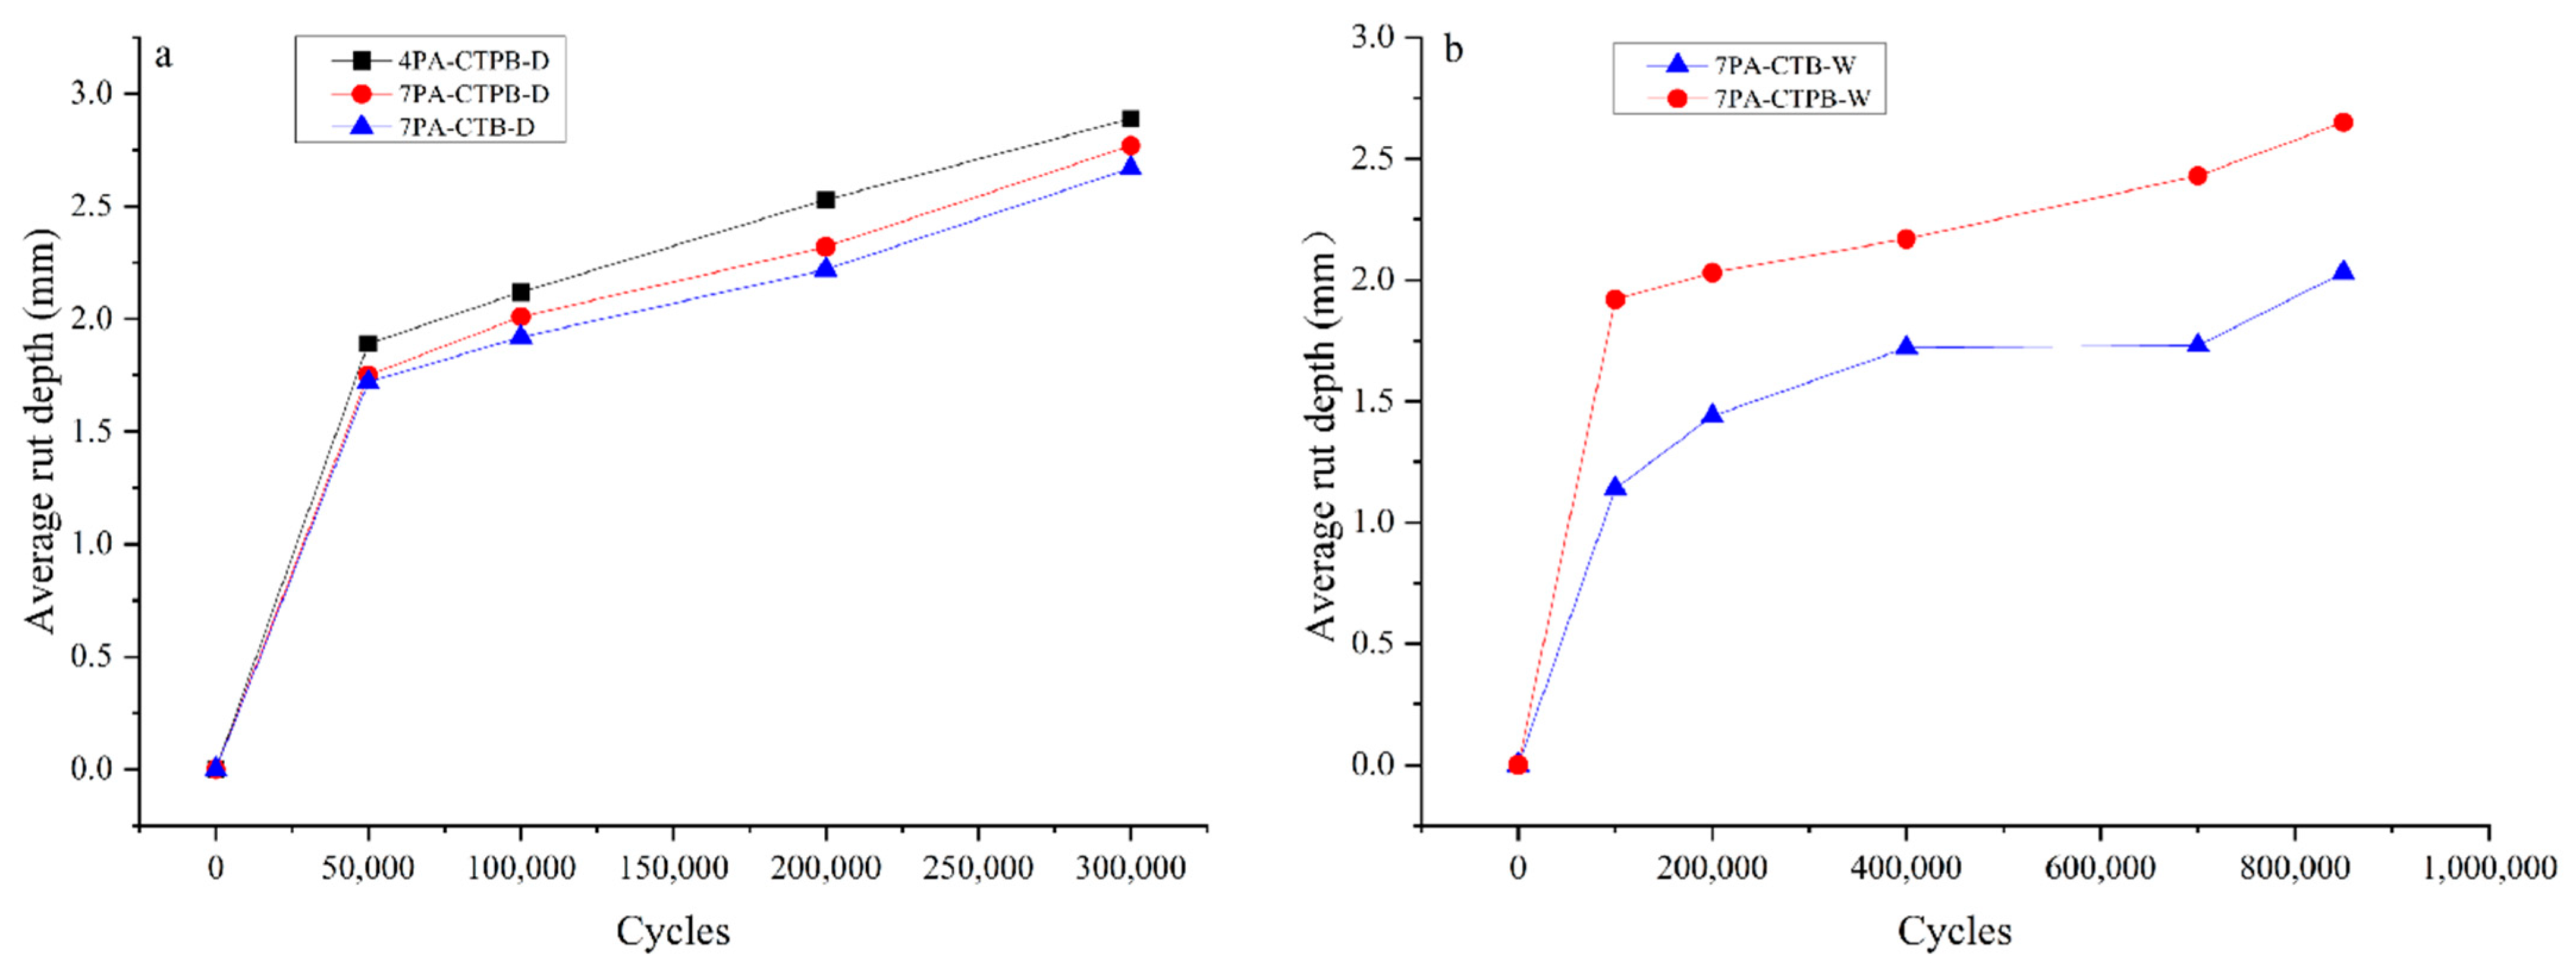
3.3. Results of Rut Depth
3.4. Results of Temperatures of Bottom Layer
4. Conclusions
- The transverse resilient tensile strain significantly increased with increasing loading cycles with a decreasing rate, and the increase could be affected by temperature. The thickness of the surface layer and base materials had effects on the longitudinal strain, leading to different strain change patterns;
- Under dry conditions, a structure with a thinner surface layer was more prone to produce a larger permanent deformation and a lower tensile strain in the surface layer. In addition, the base materials had a significant effect on tensile strain at the bottom of the surface layer;
- Compared with dry conditions, the resilient strain of the structures with different base materials (7PA-CTPB-D and 7PA-CTB-D) presented a similar change trend under wet conditions. Compared with dry conditions, both the longitudinal and transverse resilient tensile strain decreased under wet conditions. In addition, compared with the rut depth under dry conditions, the average rut depth was slightly lower after 0.85 million cycles under wet conditions, which could be caused by the better compaction of the subgrade soil and the increased strength of the base materials after loading for dry conditions;
- The temperature differences at the bottom of the surface layer presented the same variation trend as the strain cycles. The temperature differences increased with increasing loading cycles during each day of loading, which indicated the strain variation was caused by both temperature and load. In addition, fully permeable asphalt pavement with a permeable base produced a higher temperature at the bottom of the surface layer, potentially leading to more damage to the surface layer.
Author Contributions
Funding
Institutional Review Board Statement
Informed Consent Statement
Data Availability Statement
Conflicts of Interest
References
- Turco, M.; Kodešová, R.; Brunetti, G.; Nikodem, A.; Fér, M.; Piro, P. Unsaturated hydraulic behaviour of a permeable pavement: Laboratory investigation and numerical analysis by using the HYDRUS-2D model. J. Hydrol. 2017, 554, 780–791. [Google Scholar] [CrossRef]
- Min, S.K.; Zhang, X.; Zwiers, F.W.; Hegerl, G.C. Human contribution to more-intense precipitation extremes. Nature 2011, 470, 378–381. [Google Scholar] [CrossRef]
- Scholz, M.; Grabowiecki, P. Review of permeable pavement systems. Build. Environ. 2007, 42, 3830–3836. [Google Scholar] [CrossRef]
- Meiarashi, S. Researches on low noise pavement in Japan. J. Acoust. Soc. Jpn. (E) 1999, 20, 19–27. [Google Scholar] [CrossRef]
- Li, H.; Jones, D.; Harvey, J. Development of Mechanistic-Empirical Design Procedure for Fully Permeable Pavement Under Heavy Traffic. Transp. Res. Rec. 2012, 2, 83–94. [Google Scholar] [CrossRef]
- Dessouky, S.; Pothuganti, A.; Walubita, L.F.; Rand, D. Laboratory Evaluation of the Workability and Compactability of Asphaltic Materials prior to Road Construction. J. Mater. Civ. Eng. 2013, 25, 810–818. [Google Scholar] [CrossRef]
- Kazmee, H.; Tutumluer, E.; Beshears, S. Using Accelerated Pavement Testing to Evaluate Reclaimed Asphalt Pavement Materials for Pavement Unbound Granular Layers. J. Mater. Civ. Eng. 2017, 29, 04016205. [Google Scholar] [CrossRef]
- Saeedzadeh, R.; Romanoschi, S.A.; Akbariyeh, N.; Khajeh-Hosseini, M.; Abdullah, A.Q. Sustainability Assessment of Recycled Asphalt Mixtures Based on Performance in Full-Scale Testing. J. Transp. Eng. B-Pavements 2018, 144, 04018024. [Google Scholar] [CrossRef]
- Kohler, E.; Plessis, L.D.; Harvey, J.; Motumah, L. Comparison of precast and cast-in-place concrete pavements responses under heavy vehicle simulator loads. In Proceedings of the 8th International Conference on the Bearing Capacity of Roads, Railways & Airfields International Conference, Champaign, IL, USA, 29 June–2 July 2009. [Google Scholar] [CrossRef]
- Iida, A.; Shimeno, S.; Kaneda, M.; Satou, M. Evaluation of Plastic Flow Rutting Resistance of Dense-Graded Asphalt Pavements on Expressways. J. Pavement Eng. JSCE 1999, 4, 173–178. [Google Scholar] [CrossRef]
- Kim, S.-M.; Hugo, F. Small-Scale accelerated pavement testing. J. Transp. Eng. 1998, 124, 117–122. [Google Scholar] [CrossRef]
- Huang, Y.; Wang, L.; Xiong, H. Evaluation of pavement response and performance under different scales of APT facilities. Road Mater. Pavement Des. 2017, 18, 159–169. [Google Scholar] [CrossRef]
- Al-Qadi, I.L.; Wang, H. Full-depth Pavement Responses under Various Tire Configurations: Accelerated Pavement Testing and Finite Element Modeling. Presented at the Asphalt Paving Technology 2009, Minneapolis, MN, USA, 15–18 March 2009; pp. 721–760. Available online: https://www.researchgate.net/publication/288714532 (accessed on 1 January 2009).
- Frederick, H.P.E. Comparative scaled MMLS3 tests versus full-scale MLS10 tests in Mozambique. Presented at the Transportation Research Board Meeting, Washington, DC, USA, 21–25 January 2007. [Google Scholar]
- Bhattacharjee, S.; Mallick, R.B. Effect of temperature on fatigue performance of hot mix asphalt tested under model mobile load simulator. Int. J. Pavement Eng. 2012, 13, 166–180. [Google Scholar] [CrossRef]
- Bhattacharjee, S.; Gould, J.S.; Mallick, R.B.; Hugo, F. An Evaluation of use of Accelerated Loading Equipment for Determination of Fatigue Performance of Asphalt Pavement in Laboratory. Int. J. Pavement Eng. 2004, 5, 61–79. [Google Scholar] [CrossRef]
- Smit, A.; Hugo, F.; Rand, D.; Powell, B. Model mobile load simulator testing at National Center for Asphalt Technology test track. Transp. Res. Rec. 2003, 1832, 182–190. [Google Scholar] [CrossRef]
- Bhattacharjee, S.; Mallick, R.B. Determination of Damage Development in Asphalt Concrete Using Small-Scale Accelerated Pavement Testing via Frequency Domain Analysis Approach. J. Transp. Eng. ASCE 2012, 138, 723–731. [Google Scholar] [CrossRef]
- Lee, J.; Kim, Y.R.; Lee, J. Rutting performance evaluation of asphalt mix with different types of geosynthetics using MMLS3. Int. J. Pavement Eng. 2014, 16, 894–905. [Google Scholar] [CrossRef]
- Liu, Y.; Huang, Y.; Sun, W.; Nair, H.; Lane, D.S.; Wang, L. Effect of coarse aggregate morphology on the mechanical properties of stone matrix asphalt. Constr. Build. Mater. 2017, 152, 48–56. [Google Scholar] [CrossRef]
- Cong, L.; Wang, T.J. Effect of fine aggregate angularity on skid-resistance of asphalt pavement using accelerated pavement testing. Constr. Build. Mater. 2018, 168, 41–46. [Google Scholar] [CrossRef]
- Kermani, B.; Stoffels, S.M.; Xiao, M.; Qiu, T. Experimental Simulation and Quantification of Migration of Subgrade Soil into Subbase under Rigid Pavement Using Model Mobile Load Simulator. J. Transp. Eng. B-Pavements 2018, 144, 04018049. [Google Scholar] [CrossRef]
- Harvey, J.; Smith, D.R.; Jones, D.J.; Killingsworth, B.; Willis, R.; Li, H. Permeable Pavement Road Map Workshop and Proposed Road Map for Permeable Pavement. UC Davis: National Center for Sustainable Transportation. 2018. Available online: https://escholarship.org/uc/item/1vz9p6gc (accessed on 1 August 2018).
- Kim, H.; Sokolov, K.; Poulikakos, L.D.; Partl, M.N. Fatigue Evaluation of Porous Asphalt Composites with Carbon Fiber Reinforcement Polymer Grids. Transp. Res. Rec. 2009, 2116, 108–117. [Google Scholar] [CrossRef]
- Arraigada, M.; Pugliessi, A.; Partl, M.N.; Martinez, F. Effect of full-size and down-scaled accelerated traffic loading on pavement behavior. Mater. Struct. 2014, 47, 1409–1424. [Google Scholar] [CrossRef]
- Zhang, Y.; Druta, C.; Wang, L.; Xiong, H.; Zhang, W. Dynamic responses of asphalt concrete slab under cyclic wheel loading using acceleration spectrum analysis. Constr. Build. Mater. 2017, 152, 134–144. [Google Scholar] [CrossRef]
- Zhou, W.; Huang, X.; Wang, L. Study on the void reduction behaviour of porous asphalt pavement based on discrete element method. Int. J. Pavement Eng. 2017, 18, 285–291. [Google Scholar] [CrossRef]
- Sun, Y.; Guo, R.; Gao, L.; Wang, J.; Wang, X.; Yuan, X. Study on Dynamic Response Characteristics of Saturated Asphalt Pavement under Multi-Field Coupling. Materials 2019, 12, 959. [Google Scholar] [CrossRef]
- Li, H.; Jones, D.; Wu, R.; Harvey, J. Development and HVS Validation of Design Tables for Permeable Interlocking Concrete Pavement: Final Report; UC Davis, UC Berkeley UCPRC-RR-2014-04.2. 2014. Available online: https://escholarship.org/uc/item/6f97n4tm (accessed on 1 December 2014).
- Al-Qadi, I.L.; Dessouky, S.; Tutumluer, E.; Kwon, J. Geogrid mechanism in low-volume flexible pavements: Accelerated testing of full-scale heavily instrumented pavement sections. Int. J. Pavement Eng. 2011, 12, 121–135. [Google Scholar] [CrossRef]
- Gokhale, S.; Byron, T.; Iyer, S.; Choubane, B. Evaluation of Pavement Strain Gauge Repeatability. Transp. Res. Rec. 2009, 2094, 30–40. [Google Scholar] [CrossRef]
- JTG E20-2011; Standard Test Methods of Bitumen and Bituminous Mixtures for Highway Engineering. Ministry of Transport of the People’s Republic of China: Beijing, China, 2011. Available online: https://xxgk.mot.gov.cn/2020/jigou/glj/202006/t20200623_3312352.html (accessed on 2 December 2011).
- JTG/T F20-2015; Technical Guidelines for Construction of Highway Roadbases. Ministry of Transport of the People’s Republic of China: Beijing, China, 2015. Available online: https://xxgk.mot.gov.cn/2020/jigou/glj/202006/t20200623_3312274.html (accessed on 28 May 2015).
- ASTM C1701; Standard Test Method for Infiltration Rate of In Place Pervious Concrete. ASTM: West Conshohocken, PA, USA, 2023.
- Wu, J.; Ye, F.; Hugo, F. Strain response of a semi-rigid base asphalt pavement based on heavy-load full-scale accelerated pavement testing with fibre bragg grating sensors. Road Mater. Pavement Des. 2015, 16, 316–333. [Google Scholar] [CrossRef]
- Zhao, Z.; Xu, L.; Li, X.; Guan, X. Comparative analysis of pavement performance characteristics of flexible, semi-flexible and rigid pavement based on accelerated pavement tester. Constr. Build. Mater. 2023, 387, 131672. [Google Scholar] [CrossRef]
- Garcia, G.; Thompson, M.R. Strain and Pulse Duration Considerations for Extended-Life Hot-Mix Asphalt Pavement Design. Transp. Res. Rec. 2008, 2087, 3–11. [Google Scholar] [CrossRef]
- Nilsson, R.N.; Oost, I.; Hopman, P.C. Viscoelastic Analysis of Full-Scale Pavements: Validation of VEROAD. Transp. Res. Rec. 1996, 1539, 81–87. [Google Scholar] [CrossRef]
- Muraya, P.M.; van Dommelen, A.E. APT testing and visco-elastic analysis of asphalt motorway pavements. Presented at the 2nd International Conference on Accelerated Pavement Testing, Minneapolis, MN, USA, 25–29 September 2004; 27p. Available online: https://trid.trb.org/view/1157018 (accessed on 23 August 2012).
- Zhuang, C.; Guo, H.; Zhao, S.; Shu, S.; Ye, Y.; Xing, B. Study on fatigue performance of asphalt mixture in service life based on accelerated loading test. Case Stud. Constr. Mater. 2024, 20, e03055. [Google Scholar] [CrossRef]
- Ritter, J.; Rabe, R.; Wolf, A. Analysis of the Long-Term Structural Performance of Flexible Pavements Using Full-Scale Accelerated Pavement Tests. Procedia—Soc. Behav. Sci. 2012, 48, 1244–1253. [Google Scholar] [CrossRef]
- Lu, G.; Liu, P.; Törzs, T.; Wang, D.; Oeser, M.; Grabe, J. Numerical analysis for the influence of saturation on the base course of permeable pavement with a novel polyurethane binder. Constr. Build. Mater. 2020, 240, 117930. [Google Scholar] [CrossRef]
- Nguyen, H.Q.H.; Maekawa, K. Multi-Scale Simulation for Fatigue Life Evaluation of Concrete Pavement subjected to Moving Load under Dry and Wet Conditions. J. Adv. Concr. Technol. 2020, 18, 95–115. [Google Scholar] [CrossRef]
- Hu, M.; Lyu, L.; Pahlavan, F.; Han, P.; Sun, D.; Fini, E.H. Toward Sustainable Non-Emitting Asphalts: Understanding Diffusion–Adsorption Mechanisms of Hazardous Organic Compounds. Adv. Sustain. Syst. 2025, 9, 2400868. [Google Scholar] [CrossRef]
- Kermani, B.; Xiao, M.; Stoffels, S.M.; Qiu, T. Measuring the migration of subgrade fine particles into subbase using scaled accelerated flexible pavement testing—A laboratory study. Road Mater. Pavement Des. 2017, 20, 36–57. [Google Scholar] [CrossRef]
- Alobaidi, I.; Hoare, D.J. Mechanisms of Pumping at the Subgrade-Subbase Interface of Highway Pavements. Geosynth. Int. 1999, 6, 241–259. [Google Scholar] [CrossRef]
- Wang, W.; Wu, Y.; Yang, C.; Feng, Q. Mechanism and influencing factors of mud pumping in railway subgrade. J. Traffic Transp. Eng. 2019, 19, 54–64. [Google Scholar] [CrossRef]
- Wu, R.; Harvey, J.; Buscheck, J.; Mateos, A. Mechanistic-Empirical (ME) Design: Mix Design Guidance for Use with Asphalt Concrete Performance-Related Specifications. University of California Paveemnt Research Center, UC Davis, UC Berkeley, CA, USA. 2018. UCPRC-RR-2017-12. Available online: http://www.ucprc.ucdavis.edu/PDF/UCPRC-RR-2017-12.pdf (accessed on 1 August 2018).
- Zhao, L. Study on Materials and Structure Design of Urban Permeable Pavement. Master’s Thesis, Chang’an University, Xi’an, China, 2010. [Google Scholar]
- Bejarano, M.O.; Thompson, M.R. Subgrade Damage Approach for the Design of Airport Flexible Pavements. In Advancing Airfield Pavements, Presented at the 27th International Air Transportation Conference, Chicago, IL, USA, 5–8 August 2001; American Society of Civil Engineers: Reston, VA, USA, 2001. [Google Scholar]
- Lin, D.F.; Luo, H.L.; Wang, H.Y.; Hung, M.J. Successful Application of CLSM on a Weak Pavement Base/Subgrade for Heavy Truck Traffic. J. Perform. Constr. Facil. 2007, 21, 70–77. [Google Scholar] [CrossRef]
- Selvi, P. Fatigue and rutting strain analysis on lime stabilized subgrades to develop a pavement design chart. Transp. Geotech. 2015, 2, 86–98. [Google Scholar] [CrossRef]
- Tang, X.; Stoffels, S.M.; Palomino, A.M. Mechanistic-empirical approach to characterizing permanent deformation of reinforced soft soil subgrade. Geotext. Geomembr. 2016, 44, 429–441. [Google Scholar] [CrossRef]
- Coleri, E.; Harvey, J.T.; Yang, K.; Boone, J.M. Micromechanical investigation of open-graded asphalt friction courses’ rutting mechanisms. Constr. Build. Mater. 2013, 44, 25–34. [Google Scholar] [CrossRef]
- Stuart, K.; Mogawer, W.; Aapt, A. Validation of the superpave asphalt binder fatigue cracking parameter using the FHWA’s accelerated loading facility. In Technical Sessions of the Association-of-Asphalt-Paving-Technologists; Association Asphalt Paving Technologists: Colorado Springs, CO, USA, 2002; pp. 116–146. [Google Scholar]
- Wu, R.; Harvey, J.; Signore, J. Cracking and Rutting Performance of Composite Pavements Under Testing with Heavy Vehicle Simulator Rubberized Hot-Mix Asphalt with Gap-Graded Aggregates over Portland Cement Concrete. Transp. Res. Rec. 2012, 2304, 177–184. [Google Scholar] [CrossRef]
- Cheng, H.; Liu, L.; Sun, L. Determination of Layer Modulus Master Curve for Steel Deck Pavement using Field-Measured Strain Data. Transp. Res. Rec. 2019, 2673, 617–627. [Google Scholar] [CrossRef]
- Cheng, H.; Liu, J.; Sun, L.; Liu, L. Critical position of fatigue damage within asphalt pavement considering temperature and strain distribution. Int. J. Pavement Eng. 2020, 22, 1773–1784. [Google Scholar] [CrossRef]


| MMLS3 | Specification |
|---|---|
| Evaluated track length (mm) | 1260 |
| Tire diameter (mm) | 300 |
| Tire width (mm) | 80 |
| Tire pressure (MPa) | 0.7 |
| Load per tire (kN) | 2.7 |
| Speed (km/h) | 7.5 |
| Number of cycles per hour | 6000 |
| Types | Surface Layer | Base Layer | Subgrade | Abbreviation |
|---|---|---|---|---|
| 4PA-CTPB | PA | Cement-treated permeable base (CTPB) | Dry | 4PA-CTPB-D |
| Wet | 4PA-CTPB-W | |||
| 7PA-CTPB | PA | Cement-treated permeable base (CTPB) | Dry | 7PA-CTPB-D |
| Wet | 7PA-CTPB-W | |||
| 7PA-CTB | PA | Cement-treated base (CTB) | Dry | 7PA-CTB-D |
| Dry | 7PA-CTB-W |
| Subgrade | Base | Surface | ||||
|---|---|---|---|---|---|---|
| Type | Clay | Type | CTB | CTPB | Type | PA |
| Compaction (%) | 90 | Cement content (%) | 4.50 | 8 | Asphalt content (%) | 4.66 |
| Maximum dry density (g/cm3) | 1.914 | Optimum water content (%) | 5.40 | 3.8 | Total porosity (%) | 17.90 |
| Optimum moisture content (%) | 9.6 | Maximum dry density (g/cm3) | 2.40 | 2.104 | Stability (KN) | 8.10 |
| Hydraulic conductivity (10−5 cm/s) | 2.3 | 7 days unconfined compressive strength (MPa) | 4.86 | 5.37 | Raveling loss (%) | 8.00 |
| - | - | Porosity (%) | - | 20.43 | Porosity (%) | 19.21 |
| Sieve (mm) | Percent Passing (%) | ||
|---|---|---|---|
| CTB | CTPB | PA | |
| 31.5 | 100.0 | 100.0 | 100.0 |
| 26.5 | - | 100.0 | 100.0 |
| 19 | 75.5 | 92.0 | 100.0 |
| 16 | - | - | 100.0 |
| 13.2 | - | - | 90.0 |
| 9.5 | 48.6 | 27.0 | 79.6 |
| 4.75 | 29.0 | 13.0 | 29.2 |
| 2.36 | 20.3 | 7.0 | 16.0 |
| 1.18 | - | 5.0 | 12.3 |
| 0.6 | 8.9 | - | 7.7 |
| 0.3 | - | 2.0 | 4.6 |
| 0.15 | - | - | 3.6 |
| 0.075 | 3.5 | 1.0 | 5.4 |
| Parameters | δ | α | β | γ | C1 | C2 |
|---|---|---|---|---|---|---|
| Fitting value | −2.671 | 7.062 | −1.719 | −0.342 | 15.600 | 147.564 |
| Types | Longitudinal Strain (με) | Transverse Strain (με) |
|---|---|---|
| 4PA-CTPB-D | 28 | 10 |
| 7PA-CTPB-D | 12 | 94 |
| 7PA-CTB-D | - | 42 |
| 7PA-CTPB-W | 10 | 50 |
| 7PA-CTB-W | 28 | 36 |
Disclaimer/Publisher’s Note: The statements, opinions and data contained in all publications are solely those of the individual author(s) and contributor(s) and not of MDPI and/or the editor(s). MDPI and/or the editor(s) disclaim responsibility for any injury to people or property resulting from any ideas, methods, instructions or products referred to in the content. |
© 2025 by the authors. Licensee MDPI, Basel, Switzerland. This article is an open access article distributed under the terms and conditions of the Creative Commons Attribution (CC BY) license (https://creativecommons.org/licenses/by/4.0/).
Share and Cite
Yang, B.; Li, H.; Li, Y.; Cheng, M.; Sun, Y.; Han, Y. Experimental Investigation into Permeable Asphalt Pavement Based on Small-Scale Accelerated Testing. Appl. Sci. 2025, 15, 4359. https://doi.org/10.3390/app15084359
Yang B, Li H, Li Y, Cheng M, Sun Y, Han Y. Experimental Investigation into Permeable Asphalt Pavement Based on Small-Scale Accelerated Testing. Applied Sciences. 2025; 15(8):4359. https://doi.org/10.3390/app15084359
Chicago/Turabian StyleYang, Bing, Hui Li, Yingtao Li, Murong Cheng, Yang Sun, and Yuzhao Han. 2025. "Experimental Investigation into Permeable Asphalt Pavement Based on Small-Scale Accelerated Testing" Applied Sciences 15, no. 8: 4359. https://doi.org/10.3390/app15084359
APA StyleYang, B., Li, H., Li, Y., Cheng, M., Sun, Y., & Han, Y. (2025). Experimental Investigation into Permeable Asphalt Pavement Based on Small-Scale Accelerated Testing. Applied Sciences, 15(8), 4359. https://doi.org/10.3390/app15084359