Article

The Effect of the Number of Substitutions on Running Activity in Professional Football Matches: An Observational Study from the Swiss Super League

by
Gabriele Bagattini
1,2,
Jose Asian-Clemente
1,3,*,
Manuele Ferrini
1,
Mattia Garrone
4 and
Luis Suarez-Arrones
1,5
1
Department of Sport Sciences, Universidad Pablo de Olavide, 41013 Sevilla, Spain
2
Performance Department, Xamax FCS, 2000 Neuchatel, Switzerland
3
FSI Lab, Football Science Institute, 18016 Granada, Spain
4
Department of Medical Sciences, University of Turin, 10126 Turin, Italy
5
Performance and Health Department, FC Lugano, 6900 Lugano, Switzerland
*
Author to whom correspondence should be addressed.
Appl. Sci. 2025, 15(8), 4328; https://doi.org/10.3390/app15084328
Submission received: 24 February 2025 / Revised: 5 April 2025 / Accepted: 12 April 2025 / Published: 14 April 2025
(This article belongs to the Special Issue Advances in Sports Science and Biomechanics)

Abstract

:
This study aimed to compare the running activity of full-time players when the team made three or fewer substitutions versus when more than three substitutions were made. An observational study was conducted on one professional football team from the Swiss Super League during the 2021–2022 season. Matches were classified into two groups: Group A (≤3 substitutions) and Group B (>3 substitutions). Running activity was assessed using GPS technology, measuring total distance covered, sprinting distance, and acceleration/deceleration patterns. Despite a significantly higher number of substitutions in Group B (4.42 ± 0.51 vs. 2.8 ± 0.42, p < 0.01), no differences were observed between groups for all parameters analyzed (p > 0.05). Both groups exhibited significantly higher running performance during the first half compared to the second half (p < 0.01), except for distance covered > 25.2 km·h−1, which remained unchanged (p > 0.05). No differences in second half running performance were found between groups (p > 0.05). The increase from three to five substitutions did not significantly alter the external load of full-time players. Running performance declined in the second half regardless of the number of substitutions made. These findings suggest that the new substitution rule does not influence the physical performance of players who complete the entire match.

1. Introduction

Modern football has evolved into a sport where matches are increasingly physically demanding, causing greater stress on football players [1]. A previously published study has shown that between the 2006/2007 season and the 2012/2013 season, the high-intensity and sprinting demands on football players increased by 30% and 35%, respectively [2]. A study conducted comparing the seasons 2014/2015 and 2018/2019 also found a notable increase in the total distance covered, distance covered at high intensity, and sprinting [3]. The growing trend of increments in running demands in football is so significant that some authors predict that by the year 2030, matches could become 40% more demanding in terms of high-intensity activity [4]. Although other authors argue that these increases will be more moderate, with high-speed efforts expected to rise by around 10% and sprint distance covered by 15% [3], it seems evident that the physical demands on football players are increasingly stringent. Football players face greater physical demands due to more intense matches, and another hallmark of modern football is that players participate in more matches per season, exposing themselves to more frequent and dense periods of high-intensity effort [4,5,6].
Taking into account the broader context, an increase in the number of substitutions per match could emerge as a viable strategy for mitigating injury risks, particularly in tightly scheduled matches [7,8]. This approach would be especially pertinent for players exposed to high chronic competitive loads [9]. A higher number of substitutions could also potentially counteract the observed decline in running performance during the second half of football matches, which could be reflected in matches that are more attractive for spectators.
In 2021, in response to the COVID-19 pandemic and to minimize match overload and potential player fatigue, the Fédération Internationale de Football Association (FIFA®) authorized an increase to five substitutions for each team per match, instead of the usual three. This new regulation caused a change in football, affecting coaches’ decision-making, particularly in everything related to substitute players. Although football coaches generally adhere to similar substitution patterns [10] and substitutes are typically introduced at halftime or during the second half of the game [9,11], the reasons for substitutions vary widely. For example, tactical adjustments, countering fatigue, reshaping the team after dismissals, replacing cautioned players, addressing injuries or under-performance, granting playing time to those with fewer minutes, and preventing fatigue accumulation among team members are all factors that influence substitution decisions [9,11,12]. Despite the existence of different reasons for which substitutions are made, the physical response of substitute players is the most studied element in the literature. Sydney et al. (2023) demonstrated that in the Australian National Premier League (semi-professional) and National Youth League (youth professional), while starting players accumulate a higher absolute amount of total distance covered and high-speed running distance, substitute players, across all playing positions, exhibit a greater relative high-speed running distance per minute compared to players who participate throughout the entire match [13]. Similarly, a study of the English Premier League also found that substitute players tend to cover a greater distance with high-intensity running during the equivalent time period compared to starters [12]. In addition, substitutes were found to accumulate significantly longer distances of high-intensity running and sprinting during the last 15 min of the match compared to players who played the entire match [14]. Despite the research conducted to understand substitute players, investigations of the impact of the new regulations that have expanded the maximum number of substitutions on teams’ physical performance have not been carried out. Given the evolving substitution rules, it remains uncertain whether these changes significantly impact the analyzed variables, making this study valuable for gaining a better understanding of their potential effects. Therefore, this study had three aims: (1) To compare the running demands of full-time players when the team made three or fewer (≤3) substitutions with those when the team made >3 substitutions; (2) To compare the running performance between the first and second half depending on the number of substitutions made; and (3) To compare the running activity of full-time players during the second half of matches when ≤3 or >3 substitutions were made.

2. Materials and Methods

2.1. Experimental Design

An observational design was used to examine one professional football team that played in the Swiss first division national league (Swiss Super League) during the 2021–2022 season. All matches were played on outdoor fields, including both natural and synthetic grass surfaces. The season 2021/2022 was analyzed as it was the first season unaffected by issues related to COVID-19 and this team was chosen because, despite being permitted up to 5 substitutions during this season, they only made up to 3 substitutions in some matches. The matches were thus classified into two groups: A: matches with ≤3 substitutions (Group A), and B: matches where coaches replaced 4 or 5 starting players 3 (Group B). Once this classification was done, variables related to the running demands of football players in each group were compared.

2.2. Participants/Subjects

A time-motion analysis of 32 professional soccer players (age = 27 ± 5; height = 182 ± 7 cm, % fat mass = 9.5 ± 2.3) was conducted during 43 matches (36 regular season, 2 Swiss Cup, and 5 friendly matches). The running demands of the players during matches were recorded, resulting in a total of 508 individual pieces of data being collected. The following exclusion criteria were used to avoid including data that could significantly distort the results in the analysis: (I) goalkeepers were excluded [15,16,17]; (II) matches in which a player was sent off or the team did not finish with 11 players, for example, due to an injury when all substitutions had already been made [16,18]; and (III) matches that presented goal differences greater than two goals, considering only matches with a narrow result (a difference of two goals or less, including tie games) for analysis [19,20]. After filtering the data based on the exclusion criteria, 10 matches were analyzed (2 matches with 2 substitutions; 8 matches with 3 substitutions) from Group A and 12 matches (7 matches with 4 substitutions; 5 matches with 5 substitutions) from Group B. Thus, a total of 300 GPS match data points were collected, with 127 from Group A (distributed among 27 players) and 173 from Group B (distributed among 30 players). All data were part of the team’s daily monitoring, so institutional ethics committee authorization was not required [21]. However, this study was conducted in accordance with the ethical standards outlined in the Declaration of Helsinki, and informed consent was obtained from all participants prior to their involvement.

2.3. Procedures

To provide a preliminary overview, age averages, number and distribution of substitutions [11,12], total match duration including extra time [22], and the possession percentage [17] for both groups were compared. In line with previous research, all substitutions occurred during the second half [12,23,24]. This study found 12 (15%) substitutions between the 45th and 59th minutes (Group A: 2; Group B: 10), 37 (46.3%) substitutions between the 60th and 74th minutes (Group A: 15; Group B: 22), and 31 (38.8%) substitutions after the 75th minute (Group A: 10; Group B: 21). After categorizing the groups, GPS data were incorporated into each group for further analysis, following the same protocol as in the previously published literature [25]. Subsequently, comparisons were made between the two groups of the number of substitutions, the duration of the match, the percentage of possession, and the running activity. Likewise, for both groups, the relative running activity per minute [16] was obtained and analyzed during the first and second halves of the matches. Finally, the running activity levels of Group A and Group B during the second half were compared (focusing exclusively on full-time players).

2.4. Activity Pattern Measurements

The match metrics, which included the number of substitutions (#sub), duration of the match (TT), duration of the match for substitutes (TTsubs), and percentage of possession (%poss), were sourced from the Transfermarkt website (http://www.transfermarkt.com accessed on 8 January 2025) [26]. Running activity was monitored using global navigation satellite system (GNSS) technology (Apex Pro, STATSports, Newry, Ireland) with a 10 Hz sampling rate. The validity and reliability of these devices has been previously reported [27,28,29]. The following metrics were obtained: TD = total distance covered (meters); DC 19.8–25.2 km·h−1 = distance covered between 19.8 and 25.2 km·h−1 (meters); DC > 25.2 km·h−1 = distance covered at above 25.2 km·h−1 (meters); DC > 19.8 km·h−1 = distance covered at above 19.8 km·h−1 (meters); SPR = sprint distance (DC at least 1 s > 25.2 km·h−1, which stops when the speed falls below 80% of sprint threshold (25.2 km·h−1); #SPR = number of sprints; #ACC = number of accelerations above 3 m·s−2; and #DEC = number of decelerations above 3 m·s−2. These variables have been used in the previous literature [25,30,31].

2.5. Statistical Analysis

The data are presented as means ± standard deviations (SD). The Shapiro-Wilk test was used to verify normality, and all statistical tests were performed using the Statistical Package for Social Sciences (SPSS V22.0, Inc., Chicago, IL, USA). Differences between Group A and Group B (the whole match and second half) were analyzed using an independent Student’s t-test. Differences within groups between the first and second halves were determined using Student’s dependent t-test. We set the significance level at p < 0.05. The effect size (ES) was determined, and the threshold values for Cohen’s ES statistics were classified as trivial (0.0–0.19), small (0.2–0.59), moderate (0.6–1.1), large (1.2–1.9), and very large (>2.0) [32].

3. Results

The analysis of the age distributions between groups (Group A: 27.4 ± 4.9 and Group B: 27.2 ± 4.8) indicated no statistically significant difference (p = 0.9155; ES = −0.03 ± 0.52).

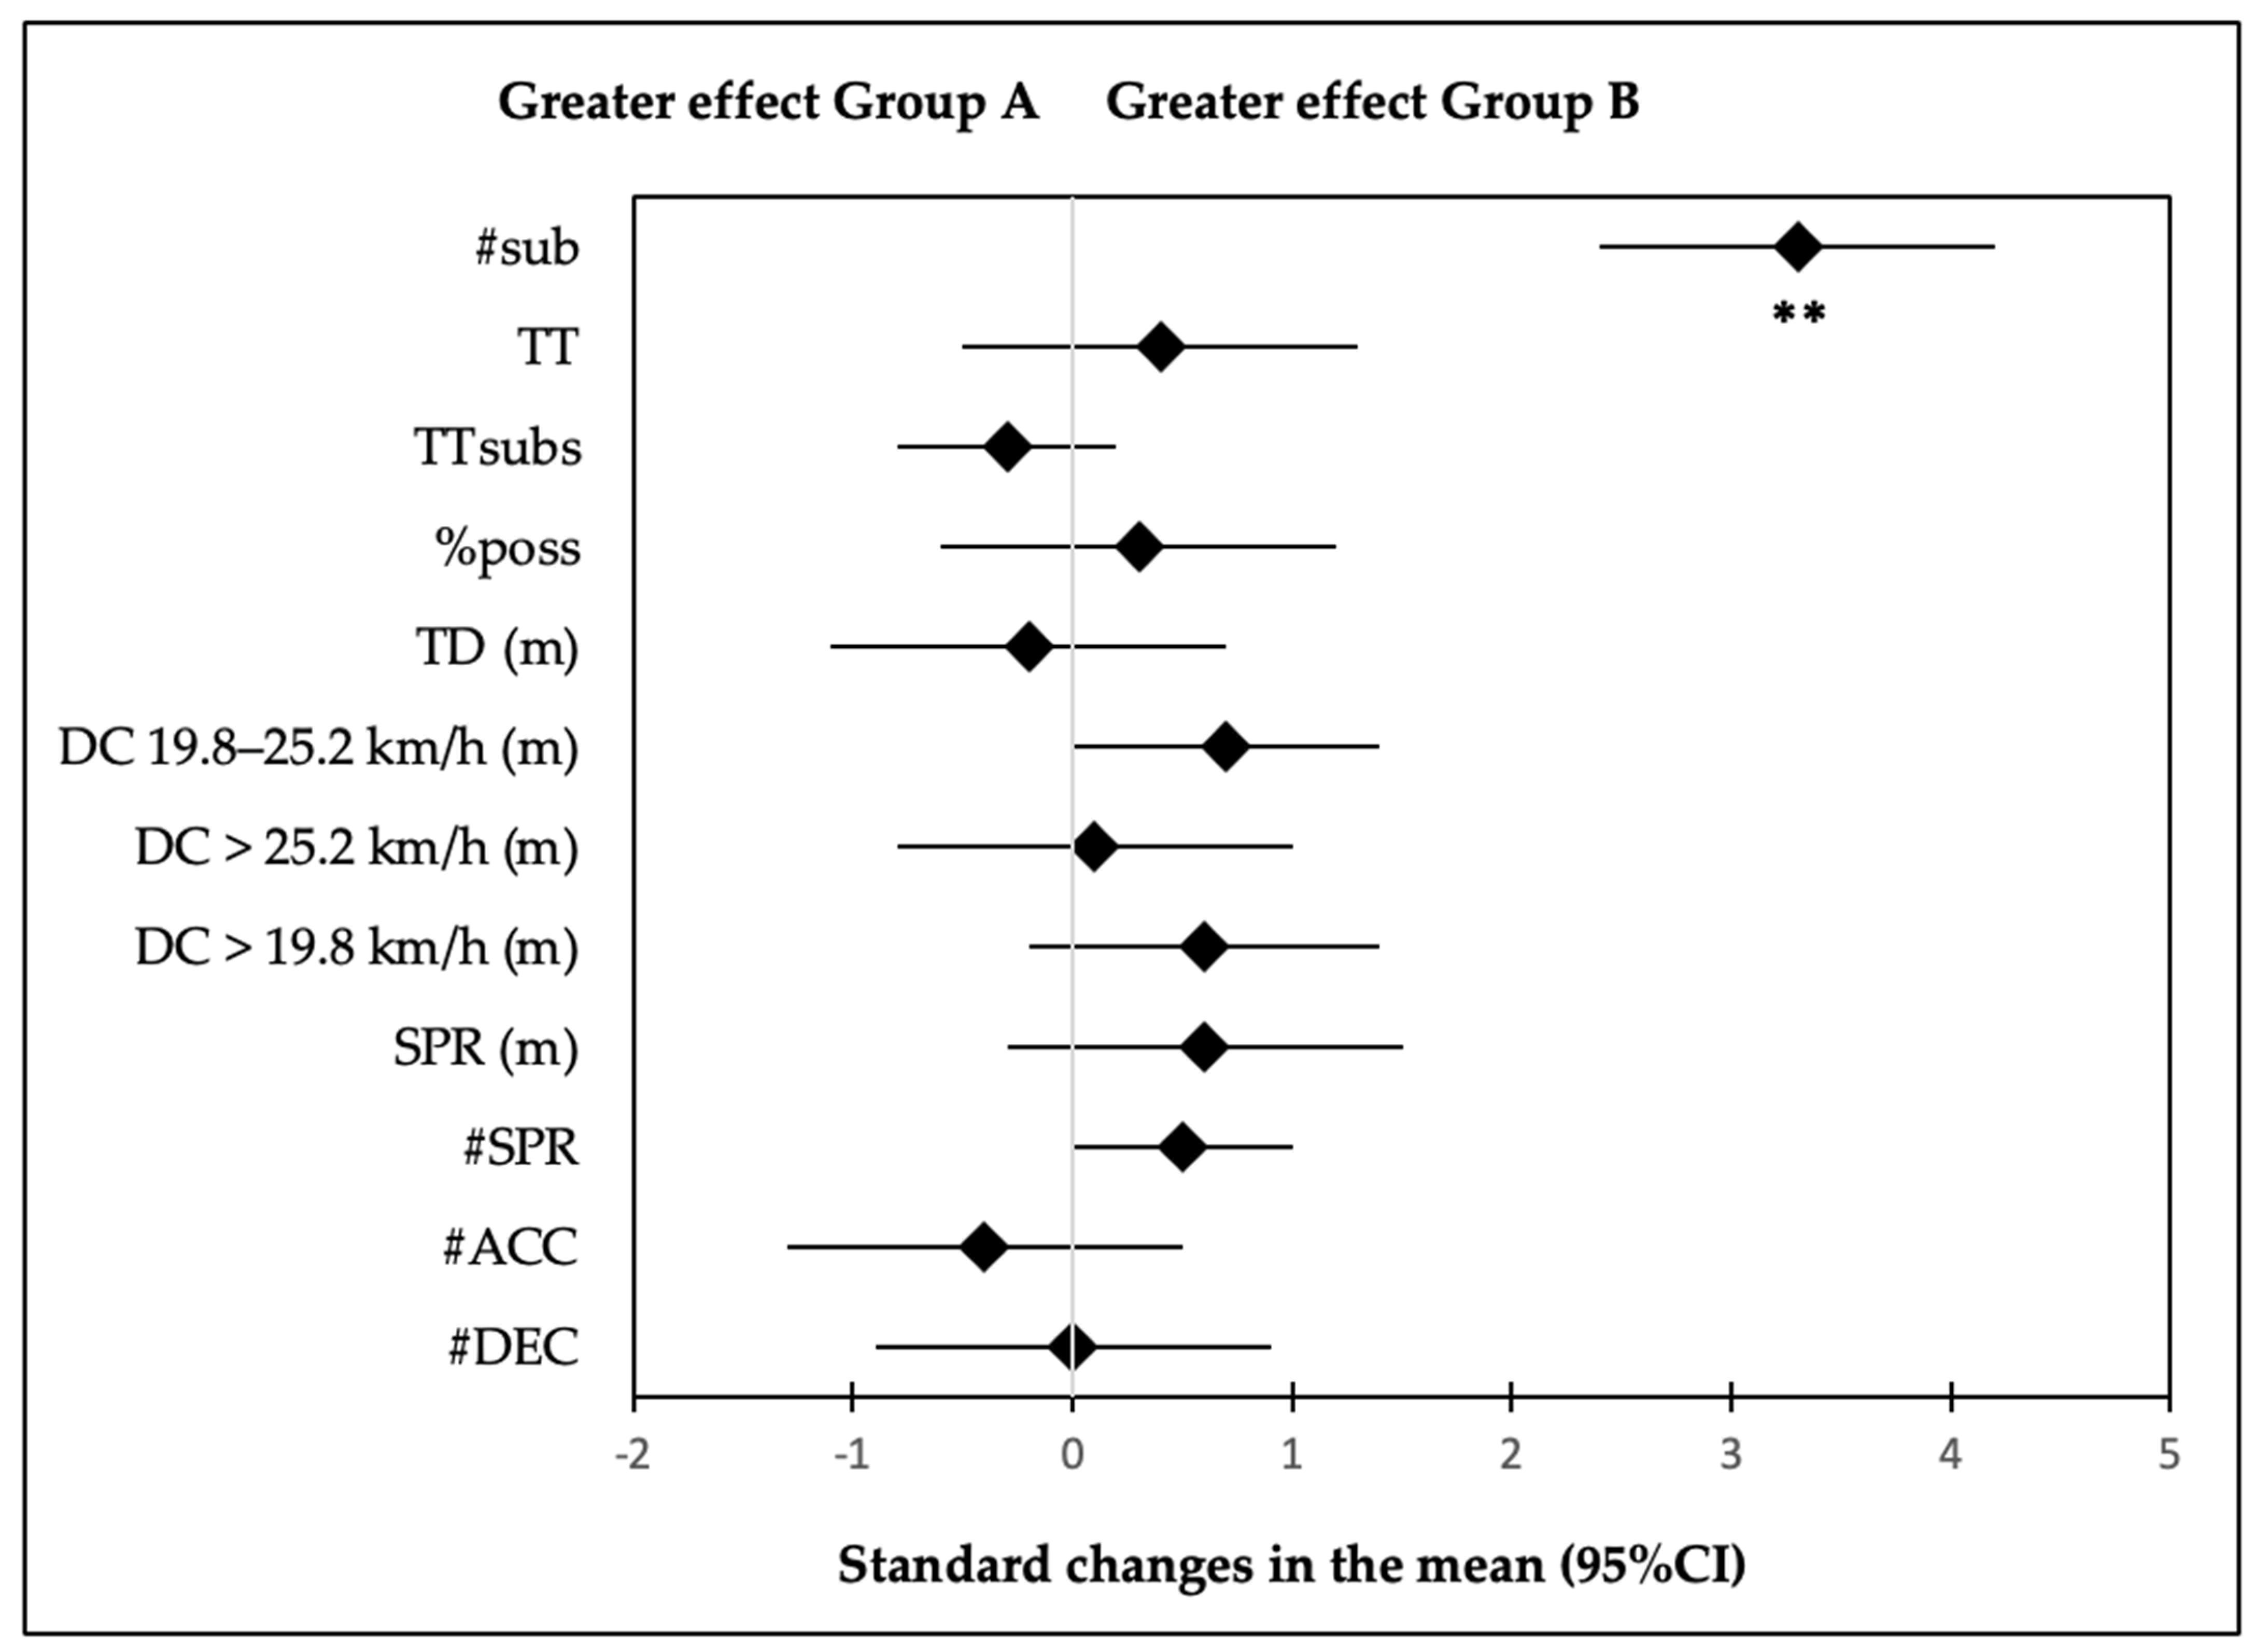
3.1. Comparison Between Groups of Metrics and Running Demands

Descriptive statistics of the full matches in Group A and Group B are presented in Table 1 and Figure 1 The analysis indicated that the #sub was significantly higher (p < 0.01) in Group B (4.42 ± 0.51) than in Group A (2.8 ± 0.42). No differences between groups were observed in TT (p = 0.32), TTsubs (p = 0.29), and %poss (p = 0.50). There were no statistical differences between groups in TD (p = 0.64), DC 19.8–25.2 km·h−1 (p = 0.12), DC ≥ 25.2 km·h−1 (p = 0.80), DC ≥ 19.8 km·h−1 (p = 0.14), SPR (p = 0.17), #SPR (p = 0.24), #ACC (p = 0.33), and #DEC (p = 0.98).

3.2. Comparison of Running Demands Between the First and Second Halves Within Each Group

Descriptive statistics of the full matches in Group A and Group B are presented in Table 2. The analysis indicated that the #sub was significantly higher (p < 0.01) in Group B (4.42 ± 0.51) than in Group A (2.8 ± 0.42). No differences between groups were observed in TT (p = 0.32) and %poss (p = 0.50). There were no statistical differences between groups in TD (p = 0.64), DC 19.8–25.2 km·h−1 (p = 0.12), DC ≥ 25.2 km·h−1 (p = 0.80), DC ≥ 19.8 km·h−1 (p = 0.14), SPR (p = 0.17), #SPR (p = 0.24), #ACC (p = 0.33), and #DEC (p = 0.98).

3.3. Comparison Between Groups for Running Demands During the Second Half

Table 3 and Figure 2 show the analysis of running activity during the second half in each group. Despite the higher number of substitutions made in Group B, no statistical differences between groups were observed in any of the variables studied (p > 0.05).

4. Discussion

To the best of our knowledge, this is the first study that has investigated the impact of new substitution regulations on the running activity of professional football players. The main results of this study were as follows: (1) the possibility of making up to five substitutions did not lead to advantages in improving the running performance of full-time players; (2) During the first half, regardless of the number of substitutions made, a greater running distance was covered in all the analyzed variables except for the DC > 25.2 km·h−1; (3) Despite the higher number of substitutions made in Group B (4.4 vs. 2.8) during the second half, no statistical differences in running performance were observed between groups.
The findings of this article are in line with the previously published literature, in which no differences were found in total running distance relating to the number of substitutions [22,25]. A study conducted during the Brazilian National Championships, comparing the 2019 season (with up to three substitutions per match) and the 2020 season (with up to five substitutions per match), found no significant differences in the absolute and relative running performance of female players when the number of substitutions was different [25]. These authors suggested that the number of substitutions made during matches did not affect the total distance covered, total sprint distance (>18 km·h−1), or accelerations and decelerations > 3 m·s−2 [25]. Despite some differences in parameters, such as the sprint speed threshold used (>18 km·h−1 vs. >19.8 km·h−1) and the different gender and level of the participants, their results were comparable to those of our study. Likewise, López-Valenciano et al. [22] analyzed how the introduction of the five-substitution option affected football teams’ running performance. Although they demonstrated that the five-substitution option allowed increased running performance at DC ≥ 21.0 km·h−1 during the matches, it was the starting players who covered higher running distances at high speed during the matches. Although our study did not directly compare running metrics between substitutes and starters, an analysis of the relative running performance per minute played among full-time players in Group A and Group B revealed no differences in running performance. This suggests that starters, despite the higher number of substitutions and the different number of players involved, did not exhibit higher performance. Differences between these studies could be attributed to the limited sample size, the varying leagues and quality of players, and the specific speed metrics examined.
Another study conducted by Ayabe et al. (2022), which examined all teams across the 2019, 2020, and 2021 seasons in the J-League (Japan), showed that increasing the maximum number of substitutions from three to five resulted in a significant increase in total distance covered and number of sprints (>24 km·h−1) during professional football matches [33]. The differences from our findings may be because the authors analyzed all the teams in the J-League without considering the percentage of ball possession, which can influence running performance, whereas our study focused on a single team compared in two situations where there were no differences in the percentage of ball possession that could influence running performance or differences in the schedule and level of our studied league.
The present study showed statistically higher running activity by players during the first half compared to the second half, except DC > 25.2 km·h−1. These findings are consistent with previous research, which has demonstrated a reduction in overall distance covered during the second half compared to the first half [14,31,34]. Rampinini et al. [31] found that when players exerted more physical effort in the first half, there was a subsequent decrease in physical performance indicators such as total distance covered, high-intensity running distance (>14.4 km·h−1), and very high-intensity running distance (>19.8 km·h−1) in the second half. Conversely, when the physical exertion in the first half was lower, total distance covered and high-intensity running distance (>14.4 km·h−1) remained stable, and very high-intensity running distance (>19.8 km·h−1) even increased during the second half [31].
Our data showed that players did not show a decrease in DC > 25.2 km·h−1 during the second half, but they decreased the sprint distance covered (DC > 25.2 km·h−1 maintained for at least 1 s) and the number of sprints > 25.2 km·h−1. In some cases, the substituted players did not manage to cover the distance at this speed, which may have contributed to the lack of difference between the three and five substitutions. Previous research revealed that running distances between >19.8 km·h−1 and >21.1 km·h−1 remained unchanged between the first and second halves of a reserve team from the Premier League and teams from the Spanish first division, respectively [35,36]. Mugglestone et al. (2012) found, in semi-professional English football players during the 2009/2010 season, no significant differences in the number of sprints >21 km·h−1 performed by players between the first and second halves and concluded that players were able to maintain their sprinting efforts throughout the game [37]. These discrepancies in findings could be attributed to the match-to-match variability during official games for professional soccer players. Variability in running activity is high for some variables, particularly high-speed running and sprinting, suggesting that players do not consistently produce maximal efforts in official games. Therefore, these parameters might not be a good indicator of players’ physical performance and possible accumulated fatigue [38].
In our study, the numbers of accelerations and decelerations by full-time players were substantially reduced between the first and second half. These outcomes are in line with a previously published systematic review and meta-analysis that asserted that there is a small decrease in the frequency of high- and very high-intensity accelerations and decelerations from the first to the second half periods of match play, with the limitations that the meta-analysis included different sports teams and its conclusions were not based solely on football articles [1]. For A-League professional soccer players in Australia, Wehbe et al. [39] identified a substantial reduction in the number of medium accelerations and decelerations (2.5–4.0 m·s−2) and a reduction in the number of rapid decelerations (>4.0 m·s−2) between the first and second halves of the game. Other studies have also documented reductions in the number of accelerations and decelerations (>3 m·s−2) between the first and second halves [35,40]. Based on these findings, the nature of football appears to be characterized by a decrease in the ability to perform accelerations and decelerations between the first and second halves of the match. However, we must obviously take into account that the reduction in running activity as the match progresses may be related to both pacing strategies and physiological and mental fatigue [14,34,37].
Contrary to what might be expected, namely, that including a greater number of substitutes in the second half would lead to a higher running activity in comparison with matches where fewer substitutions are made, our results showed similar demands between matches. This outcome could be explained by several factors. First, two additional substitutions may not be enough to significantly alter the overall running demands of the game. The introduction of substitutes did not seem to drastically affect the running metrics or intensity levels across halves. A previous study has shown that football players, even after substitutions, face similar levels of physical exertion due to the nature of the sport and the tactical needs of the team [31]. On the other hand, running demands decrease due to pacing as players manage their energy expenditure throughout the match. As football is not a sport that consistently requires maximal effort throughout the game [41], pacing strategies enable players to manage their energy reserves effectively, ensuring that critical demands are met, especially in high-stress periods such as the final minutes of the game [34,42].
Although this study provides new insights into the effect of increasing the number of substitutions on the performance of professional players, it has some limitations that should be considered when interpreting the results. First, the analyses were conducted based on the matches played by a single team. Therefore, the results could have been influenced by the limited sample size, as well as by the characteristics and level of the players, the schedule and level of the league, and the team’s performance, all of which could potentially impact the study’s outcome [14,30,43]. Future studies should be conducted with a larger sample to examine the effect of this new substitution regulation, employing a multi-team and multi-league approach. Additionally, the analyses did not include internal load measures (e.g., heart rate or subjective perception of exertion), which could provide more information about the players’ workload and pacing strategies. Although substitutes may be more motivated to demonstrate their desire for increased playing time under the five-substitution rule, potentially leading to greater effort, this was not reflected in the results of this study. However, this remains a hypothesis, as this specific aspect was not directly examined. For this reason, future studies should investigate how internal load and perception of exertion may vary based on the number of substitutions. Finally, another parameter not considered was the effective playing time. Taking into account that some studies suggest that effective playing time gives a more representative overview of soccer players’ match running performance [44], future studies should investigate the effect of substitutions considering this variable. The final limitation is that variables such as effective playing time or contextual factors that could have influenced running demands were not considered. Therefore, future studies should incorporate these elements to provide a more comprehensive understanding of performance requirements.

5. Conclusions

The results of this study indicated that making three or up to five substitutions did not impact the running demands for a professional team from the Swiss First Division. Similarly, this study demonstrated that, regardless of the number of substitutions, all variables examined were higher in the first half compared to the second half, except for TD ≥ 25.2 km·h−1, which remained unchanged. During the second half, performance running data for players who played the entire match were consistent, irrespective of the number of substitutions made. On this basis and from the practical point of view, the rule allowing five substitutions does not appear to increase the running activity on soccer players compared to the previous rule that only allowed for three substitutions.

Author Contributions

Conceptualization, G.B. and L.S.-A.; methodology, G.B. and L.S.-A.; software, G.B. and M.F.; validation, G.B., J.A.-C. and M.F.; formal analysis, L.S.-A. and G.B.; investigation, G.B. and L.S.-A.; resources, G.B., M.F. and M.G.; data curation, G.B. and J.A.-C.; writing—original draft preparation, G.B.; writing—review and editing, G.B., J.A.-C. and L.S.-A.; visualization, J.A.-C. and L.S.-A.; supervision, J.A.-C. and L.S.-A. All authors have read and agreed to the published version of the manuscript.

Funding

This research received no external funding.

Institutional Review Board Statement

The study was conducted in accordance with the Declaration of Helsinki and approved by the Anti-Doping Lab Qatar Institutional Review Board (E2013000004) on 9 September 2013.

Informed Consent Statement

Informed consent was obtained from all subjects involved in the study.

Data Availability Statement

The raw data supporting the conclusions of this article will be made available by the authors on request.

Conflicts of Interest

The authors declare no conflict of interest.

References

  1. Harper, D.J.; Carling, C.; Kiely, J. High-Intensity Acceleration and Deceleration Demands in Elite Team Sports Competitive Match Play: A Systematic Review and Meta-Analysis of Observational Studies. Sports Med. 2019, 49, 1923–1947. [Google Scholar] [CrossRef] [PubMed]
  2. Barnes, C.; Archer, D.; Hogg, B.; Bush, M.; Bradley, P. The Evolution of Physical and Technical Performance Parameters in the English Premier League. Int. J. Sports Med. 2014, 35, 1095–1100. [Google Scholar] [CrossRef] [PubMed]
  3. Allen, T.; Taberner, M.; Zhilkin, M.; Rhodes, D. Running More than before? The Evolution of Running Load Demands in the English Premier League. Int. J. Sports Sci. Coach. 2024, 19, 779–787. [Google Scholar] [CrossRef]
  4. Nassis, G.P.; Massey, A.; Jacobsen, P.; Brito, J.; Randers, M.B.; Castagna, C.; Mohr, M.; Krustrup, P. Elite Football of 2030 Will Not Be the Same as That of 2020: Preparing Players, Coaches, and Support Staff for the Evolution. Scand. Med. Sci. Sports 2020, 30, 962–964. [Google Scholar] [CrossRef]
  5. Bradley, P.S.; Archer, D.T.; Hogg, B.; Schuth, G.; Bush, M.; Carling, C.; Barnes, C. Tier-Specific Evolution of Match Performance Characteristics in the English Premier League: It’s Getting Tougher at the Top. J. Sports Sci. 2016, 34, 980–987. [Google Scholar] [CrossRef] [PubMed]
  6. Carling, C.; Lacome, M.; McCall, A.; Dupont, G.; Le Gall, F.; Simpson, B.; Buchheit, M. Monitoring of Post-Match Fatigue in Professional Soccer: Welcome to the Real World. Sports Med. 2018, 48, 2695–2702. [Google Scholar] [CrossRef] [PubMed]
  7. Dupont, G.; Nedelec, M.; McCall, A.; McCormack, D.; Berthoin, S.; Wisløff, U. Effect of 2 Soccer Matches in a Week on Physical Performance and Injury Rate. Am. J. Sports Med. 2010, 38, 1752–1758. [Google Scholar] [CrossRef]
  8. Bengtsson, H.; Ekstrand, J.; Waldén, M.; Hägglund, M. Muscle injury rates in professional football increase with fixture congestion: An 11-year follow-up of the uefa champions league injury study. Br. J. Sports Med. 2014, 48, 566–567. [Google Scholar] [CrossRef]
  9. Hills, S.P.; Barwood, M.J.; Radcliffe, J.N.; Cooke, C.B.; Kilduff, L.P.; Cook, C.J.; Russell, M. Profiling the Responses of Soccer Substitutes: A Review of Current Literature. Sports Med. 2018, 48, 2255–2269. [Google Scholar] [CrossRef]
  10. Gomez, M.-A.; Lago-Peñas, C.; Owen, L.A. The Influence of Substitutions on Elite Soccer Teams’ Performance. Int. J. Perform. Anal. Sport. 2016, 16, 553–568. [Google Scholar] [CrossRef]
  11. Hills, S.P.; Barrett, S.; Thoseby, B.; Kilduff, L.P.; Barwood, M.J.; Radcliffe, J.N.; Cooke, C.B.; Russell, M. Quantifying the Peak Physical Match-Play Demands of Professional Soccer Substitutes Following Pitch-Entry: Assessing Contextual Influences. Res. Q. Exerc. Sport 2022, 93, 270–281. [Google Scholar] [CrossRef] [PubMed]
  12. Bradley, P.S.; Lago-Peñas, C.; Rey, E. Evaluation of the Match Performances of Substitution Players in Elite Soccer. Int. J. Sports Physiol. Perform. 2014, 9, 415–424. [Google Scholar] [CrossRef]
  13. Sydney, M.G.; Ball, N.; Mara, J.K.; Chapman, D.; Wollin, M. Substitute Running Outputs in Elite Youth Male Soccer Players:Less Peak but Greater Relative Running Outputs. Biol. Sport 2023, 40, 241–248. [Google Scholar] [CrossRef] [PubMed]
  14. Mohr, M.; Krustrup, P.; Bangsbo, J. Match Performance of High-Standard Soccer Players with Special Reference to Development of Fatigue. J. Sports Sci. 2003, 21, 519–528. [Google Scholar] [CrossRef]
  15. Modric, T.; Versic, S.; Alexe, D.I.; Gilic, B.; Mihai, I.; Drid, P.; Radulovic, N.; Saavedra, J.M.; Menjibar, R.B. Decline in Running Performance in Highest-Level Soccer: Analysis of the UEFA Champions League Matches. Biology 2022, 11, 1441. [Google Scholar] [CrossRef]
  16. García-Aliaga, A.; Martín-Castellanos, A.; Marquina Nieto, M.; Muriarte Solana, D.; Resta, R.; López Del Campo, R.; Mon-López, D.; Refoyo, I. Effect of Increasing the Number of Substitutions on Physical Performance during Periods of Congested Fixtures in Football. Sports 2023, 11, 25. [Google Scholar] [CrossRef]
  17. Lorenzo-Martinez, M.; Kalén, A.; Rey, E.; López-Del Campo, R.; Resta, R.; Lago-Peñas, C. Do Elite Soccer Players Cover Less Distance When Their Team Spent More Time in Possession of the Ball? Sci. Med. Footb. 2021, 5, 310–316. [Google Scholar] [CrossRef] [PubMed]
  18. Carling, C.; Bloomfield, J.; Nelsen, L.; Reilly, T. The Role of Motion Analysis in Elite Soccer: Contemporary Performance Measurement Techniques and Work Rate Data. Sports Med. 2008, 38, 839–862. [Google Scholar] [CrossRef]
  19. Bradley, P.S.; Carling, C.; Archer, D.; Roberts, J.; Dodds, A.; Di Mascio, M.; Paul, D.; Gomez Diaz, A.; Peart, D.; Krustrup, P. The Effect of Playing Formation on High-Intensity Running and Technical Profiles in English FA Premier League Soccer Matches. J. Sports Sci. 2011, 29, 821–830. [Google Scholar] [CrossRef]
  20. Linke, D.; Link, D.; Weber, H.; Lames, M. Decline in Match Running Performance in Football Is Affected by an Increase in Game Interruptions. J. Sports Sci. Med. 2018, 17, 662–667. [Google Scholar]
  21. Winter, E.M.; Maughan, R.J. Requirements for Ethics Approvals. J. Sports Sci. 2009, 27, 985. [Google Scholar] [CrossRef]
  22. López-Valenciano, A.; Moreno-Perez, V.; Campo, R.L.-D.; Resta, R.; Coso, J.D. The Five-Substitution Option Enhances Teams’ Running Performance at High Speed in Football. Int. J. Sports Med. 2023, 44, 344–351. [Google Scholar] [CrossRef]
  23. Rey, E.; Lago-Ballesteros, J.; Padrón-Cabo, A. Timing and Tactical Analysis of Player Substitutions in the UEFA Champions League. Int. J. Perform. Anal. Sport. 2015, 15, 840–850. [Google Scholar] [CrossRef]
  24. Del Corral, J.; Barros, C.P.; Prieto-Rodríguez, J. The Determinants of Soccer Player Substitutions: A Survival Analysis of the Spanish Soccer League. J. Sports Econ. 2008, 9, 160–172. [Google Scholar] [CrossRef]
  25. Kobal, R.; Aquino, R.; Carvalho, L.; Serra, A.; Sander, R.; Gomes, N.; Concon, V.; Ramos, G.P.; Barroso, R. Does the Number of Substitutions Used during the Matches Affect the Recovery Status and the Physical and Technical Performance of Elite Women’s Soccer? IJERPH 2022, 19, 11541. [Google Scholar] [CrossRef] [PubMed]
  26. Hoenig, T.; Edouard, P.; Krause, M.; Malhan, D.; Relógio, A.; Junge, A.; Hollander, K. Analysis of More than 20,000 Injuries in European Professional Football by Using a Citizen Science-Based Approach: An Opportunity for Epidemiological Research? J. Sci. Med. Sport. 2022, 25, 300–305. [Google Scholar] [CrossRef] [PubMed]
  27. Beato, M.; Coratella, G.; Stiff, A.; Iacono, A.D. The Validity and Between-Unit Variability of GNSS Units (STATSports Apex 10 and 18 Hz) for Measuring Distance and Peak Speed in Team Sports. Front. Physiol. 2018, 9, 1288. [Google Scholar] [CrossRef]
  28. Beato, M.; De Keijzer, K. The Inter-Unit and Inter-Model Reliability of GNSS STATSports Apex and Viper Units in Measuring Peak Speed over 5, 10, 15, 20 and 30 Meters. Biol. Sport 2019, 36, 317–321. [Google Scholar] [CrossRef] [PubMed]
  29. Crang, Z.L.; Duthie, G.; Cole, M.H.; Weakley, J.; Hewitt, A.; Johnston, R.D. The Inter-Device Reliability of Global Navigation Satellite Systems during Team Sport Movement across Multiple Days. J. Sci. Med. Sport. 2022, 25, 340–344. [Google Scholar] [CrossRef]
  30. Di Salvo, V.; Gregson, W.; Atkinson, G.; Tordoff, P.; Drust, B. Analysis of High Intensity Activity in Premier League Soccer. Int. J. Sports Med. 2009, 30, 205–212. [Google Scholar] [CrossRef]
  31. Rampinini, E.; Coutts, A.; Castagna, C.; Sassi, R.; Impellizzeri, F. Variation in Top Level Soccer Match Performance. Int. J. Sports Med. 2007, 28, 1018–1024. [Google Scholar] [CrossRef] [PubMed]
  32. Hopkins, W.G.; Marshall, S.W.; Batterham, A.M.; Hanin, J. Progressive Statistics for Studies in Sports Medicine and Exercise Science. Med. Sci. Sports Exerc. 2009, 41, 3–12. [Google Scholar] [CrossRef] [PubMed]
  33. Ayabe, M.; Sunami, S.; Kumahara, H.; Ishizaki, S. Effects of Substitute Allowance on Match Activity Characteristics in Japanese Professional Football across 2019, 2020, and 2021 Seasons. J. Sports Sci. 2022, 40, 2654–2660. [Google Scholar] [CrossRef] [PubMed]
  34. Bradley, P.S.; Noakes, T.D. Match Running Performance Fluctuations in Elite Soccer: Indicative of Fatigue, Pacing or Situational Influences? J. Sports Sci. 2013, 31, 1627–1638. [Google Scholar] [CrossRef]
  35. Russell, M.; Sparkes, W.; Northeast, J.; Cook, C.J.; Love, T.D.; Bracken, R.M.; Kilduff, L.P. Changes in Acceleration and Deceleration Capacity Throughout Professional Soccer Match-Play. J. Strength. Cond. Res. 2016, 30, 2839–2844. [Google Scholar] [CrossRef]
  36. Rey, E.; Kalén, A.; Lorenzo-Martínez, M.; López-Del Campo, R.; Nevado-Garrosa, F.; Lago-Peñas, C. Elite Soccer Players Do Not Cover Less Distance in the Second Half of the Matches When Game Interruptions Are Considered. J. Strength. Cond. Res. 2024, 38, 709–713. [Google Scholar] [CrossRef]
  37. Mugglestone, C.; Morris, J.; Saunders, B.; Sunderland, C. Half-Time and High-Speed Running in the Second Half of Soccer. Int. J. Sports Med. 2012, 34, 514–519. [Google Scholar] [CrossRef]
  38. Mendez-Villanueva, A.; Buchheit, M. Physical Capacity–Match Physical Performance Relationships in Soccer: Simply, More Complex. Eur. J. Appl. Physiol. 2011, 111, 2387–2389. [Google Scholar] [CrossRef]
  39. Wehbe, G.M.; Hartwig, T.B.; Duncan, C.S. Movement Analysis of Australian National League Soccer Players Using Global Positioning System Technology. J. Strength. Cond. Res. 2014, 28, 834–842. [Google Scholar] [CrossRef]
  40. Akenhead, R.; Hayes, P.R.; Thompson, K.G.; French, D. Diminutions of Acceleration and Deceleration Output during Professional Football Match Play. J. Sci. Med. Sport. 2013, 16, 556–561. [Google Scholar] [CrossRef]
  41. Bangsbo, J.; Mohr, M.; Krustrup, P. Physical and Metabolic Demands of Training and Match-Play in the Elite Football Player. J. Sports Sci. 2006, 24, 665–674. [Google Scholar] [CrossRef] [PubMed]
  42. Waldron, M.; Highton, J. Fatigue and Pacing in High-Intensity Intermittent Team Sport: An Update. Sports Med. 2014, 44, 1645–1658. [Google Scholar] [CrossRef] [PubMed]
  43. Rampinini, E.; Impellizzeri, F.M.; Castagna, C.; Coutts, A.J.; Wisløff, U. Technical Performance during Soccer Matches of the Italian Serie A League: Effect of Fatigue and Competitive Level. J. Sci. Med. Sport. 2009, 12, 227–233. [Google Scholar] [CrossRef]
  44. Castellano, J.; Blanco-Villaseñor, A.; Álvarez, D. Contextual Variables and Time-Motion Analysis in Soccer. Int. J. Sports Med. 2011, 32, 415–421. [Google Scholar] [CrossRef] [PubMed]
Figure 1. Full-match running metrics in Group A vs. Group B. Group A = players who play matches with ≤3 substitutions; Group B = players who play matches with 4 or 5 substitutions; #sub = number of substitutions; TT = duration of the match; TTsubs = duration of the match for substitutes; %poss = percentage of possession; TD = total distance covered; DC 19.8–25.2 km·h−1 = distance covered between 19.8 and 25.2 km·h−1; DC > 25.2 km·h−1 = distance covered above 25.2 km·h−1; DC > 19.8 km·h−1 = distance covered above 19.8 km·h−1; SPR = sprint distance covered; #SPR = number of sprints; #ACC = number of accelerations above 3 m·s−2; #DEC = number of decelerations above 3 m·s−2. ** p < 0.01.
Applsci 15 04328 g001
Figure 2. Relative running activity during the second halves for each group (full-time players). Group A = players who play matches with ≤3 substitutions; Group B = players who play matches with 4 or 5 substitutions; TD = total distance covered; DC 19.8–25.2 km·h−1 = distance covered between 19.8 and 25.2 km·h−1; DC > 25.2 km·h−1 = distance covered above 25.2 km·h−1; DC > 19.8 km·h−1 = distance covered above >19.8 km·h−1; SPR = sprint distance covered; #SPR = number of sprints; #ACC = number of accelerations above 3 m·s−2; #DEC = number of decelerations above 3 m·s−2.
Applsci 15 04328 g002
Table 1. Descriptive statistics of the full matches in Group A and Group B.
Match Metric and
Running Activity
Group A (≤3)
Mean ± SD
Group B (>3)
Mean ± SD
ES (95%CI)p Value
#sub2.8 ± 0.44.4 ± 0.53.3 ± 0.90.00
TT94.4 ± 1.494.9 ± 0.90.4 ± 0.90.32
TTsubs26.6 ± 14.723.4 ± 9.8−0.3 ± 0.50.29
%poss43.9 ± 6.946.3 ± 9.50.3 ± 0.90.50
TD (m)100,911 ± 2510100,398 ± 2462−0.2 ± 0.90.64
DC 19.8–25.2 km·h−1 (m)5260.5 ± 292.65513.8 ± 426.80.7 ± 0.70.12
DC > 25.2 km·h−1 (m)1482.4 ± 227.71506.8 ± 22.80.1 ± 0.90.80
DC > 19.8 km·h−1 (m)6742.9 ± 315.87033.5 ± 545.60.6 ± 0.80.14
SPR (m)5826 ± 3696102.8 ± 536.10.6 ± 0.90.17
#SPR325.6 ± 27.9339.6 ± 25.40.5 ± 0.90.24
#ACC795.4 ± 65.2767 ± 68.5−0.4 ± 0.90.33
#DEC916.2 ± 48916.9 ± 58.50 ± 0.90.98
SD = standard deviation; ES = effect size; CI = confidence interval; #sub = number of substitutions; TT = duration of the match; TTsubs = duration of the match for substitutes; %poss = percentage of possession; TD = total distance covered; DC 19.8–25.2 km·h−1 = distance covered between 19.8 and 25.2 km·h−1; DC > 25.2 km·h−1 = distance covered above 25.2 km·h−1; DC > 19.8 km·h−1 = distance covered above 19.8 km·h−1; SPR = sprint distance covered; #SPR = number of sprints; #ACC = number of accelerations above 3 m·s−2; #DEC = number of decelerations above 3 m·s−2.
Table 2. Relative running activity during the first and second halves for each group.
Relative Running ActivityGroup A (n = 73)Group B (n = 67)
1st Half 2nd Half 1st Half 2nd Half
Mean ± SDSEMMean ± SDSEMMean ± SDSEMMean ± SDSEM
TD (m·min−1)102.9 ± 12.11.4198.7 ± 12.7 **1.41106.1 ± 10.91.3497.1 ± 12.7 **1.41
DC 19.8–25.2 km·h−1 (m·min−1)5.2 ± 1.80.204.3 ± 1.7 **0.205.4 ± 1.80.224.6 ± 1.7 **0.21
DC > 25.2 km·h−1 (m·min−1)1.4 ± 0.90.101.2 ± 1.00.121.6 ± 1.20.151.4 ± 10.12
DC > 19.8 km·h−1 (m·min−1)6.7 ± 2.20.265.6 ± 2.4 **0.297 ± 2.50.306 ± 2.7 **0.28
SPR (m·min−1)5.5 ± 2.00.244.5 ± 2.2 **0.265.8 ± 2.30.285.1 ± 2 **0.25
#SPR (#·min−1)0.40 ± 0.120.010.28 ± 0.12 **0.010.7 ± 0.10.010.3 ± 0.1 **0.01
#ACC (#·min−1)0.84 ± 0.210.020.70 ± 0.18 **0.020.8 ± 0.20.020.7 ± 0.2 **0.02
#DEC (#·min−1)1.00 ± 0.240.030.84 ± 0.18 **0.021 ± 0.20.030.9 ± 0.2 **0.03
SD = standard deviation; SEM = standard errors of the means; ** p < 0.01; TD = total distance covered; DC 19.8–25.2 km·h−1 = distance covered between 19.8 and 25.2 km·h−1; DC > 25.2 km·h−1 = distance covered above 25.2 km·h−1; DC > 19.8 km·h−1 = distance covered above >19.8 km·h−1; SPR = sprint distance covered; #SPR = number of sprints; #ACC = number of accelerations above 3 m·s−2; #DEC = number of decelerations above 3 m·s−2.
Table 3. Relative running activity during the second halves for each group (full-time players).
Relative Running Activity2nd Half Group A
(2.8 Substitutions)
2nd Half Group B
(4.4 Substitutions)
ES (95%CI)p Value
Mean ± SDMean ± SD
TD (m·min−1)98.7 ± 12.797.1 ± 11.3–0.1 ± 0.30.44
DC 19.8–25.2 km·h−1 (m·min−1)4.3 ± 1.74.6 ± 1.70.2 ± 0.30.30
DC > 25.2 km·h−1 (m·min−1)1.2 ± 11.4 ± 10.2 ± 0.30.31
DC > 19.8 km·h−1 (m·min−1)5.6 ± 2.46 ± 2.30.2 ± 0.30.24
SPR (m·min−1)4.5 ± 2.25.1 ± 20.3 ± 0.30.15
#SPR (#·min−1)0.3 ± 0.10.3 ± 0.10.2 ± 0.30.16
#ACC (#·min−1)0.7 ± 0.20.7 ± 0.20.1 ± 0.30.59
#DEC (#·min−1)0.8 ± 0.20.9 ± 0.20.2 ± 0.30.32
SD = standard deviation; ES = effect size; CI = confidence interval; TD = total distance covered; DC 19.8–25.2 km·h−1 = distance covered between 19.8 and 25.2 km·h−1; DC > 25.2 km·h−1 = distance covered above 25.2 km·h−1; DC > 19.8 km·h−1 = distance covered above >19.8 km·h−1; SPR = sprint distance covered; #SPR = number of sprints; #ACC = number of accelerations above 3 m·s−2; #DEC = number of decelerations above 3 m·s−2.
Disclaimer/Publisher’s Note: The statements, opinions and data contained in all publications are solely those of the individual author(s) and contributor(s) and not of MDPI and/or the editor(s). MDPI and/or the editor(s) disclaim responsibility for any injury to people or property resulting from any ideas, methods, instructions or products referred to in the content.

