

Quality Dimensions for Automatic Assessment of Structured Cyber Threat Intelligence Data


Abstract
1. Introduction
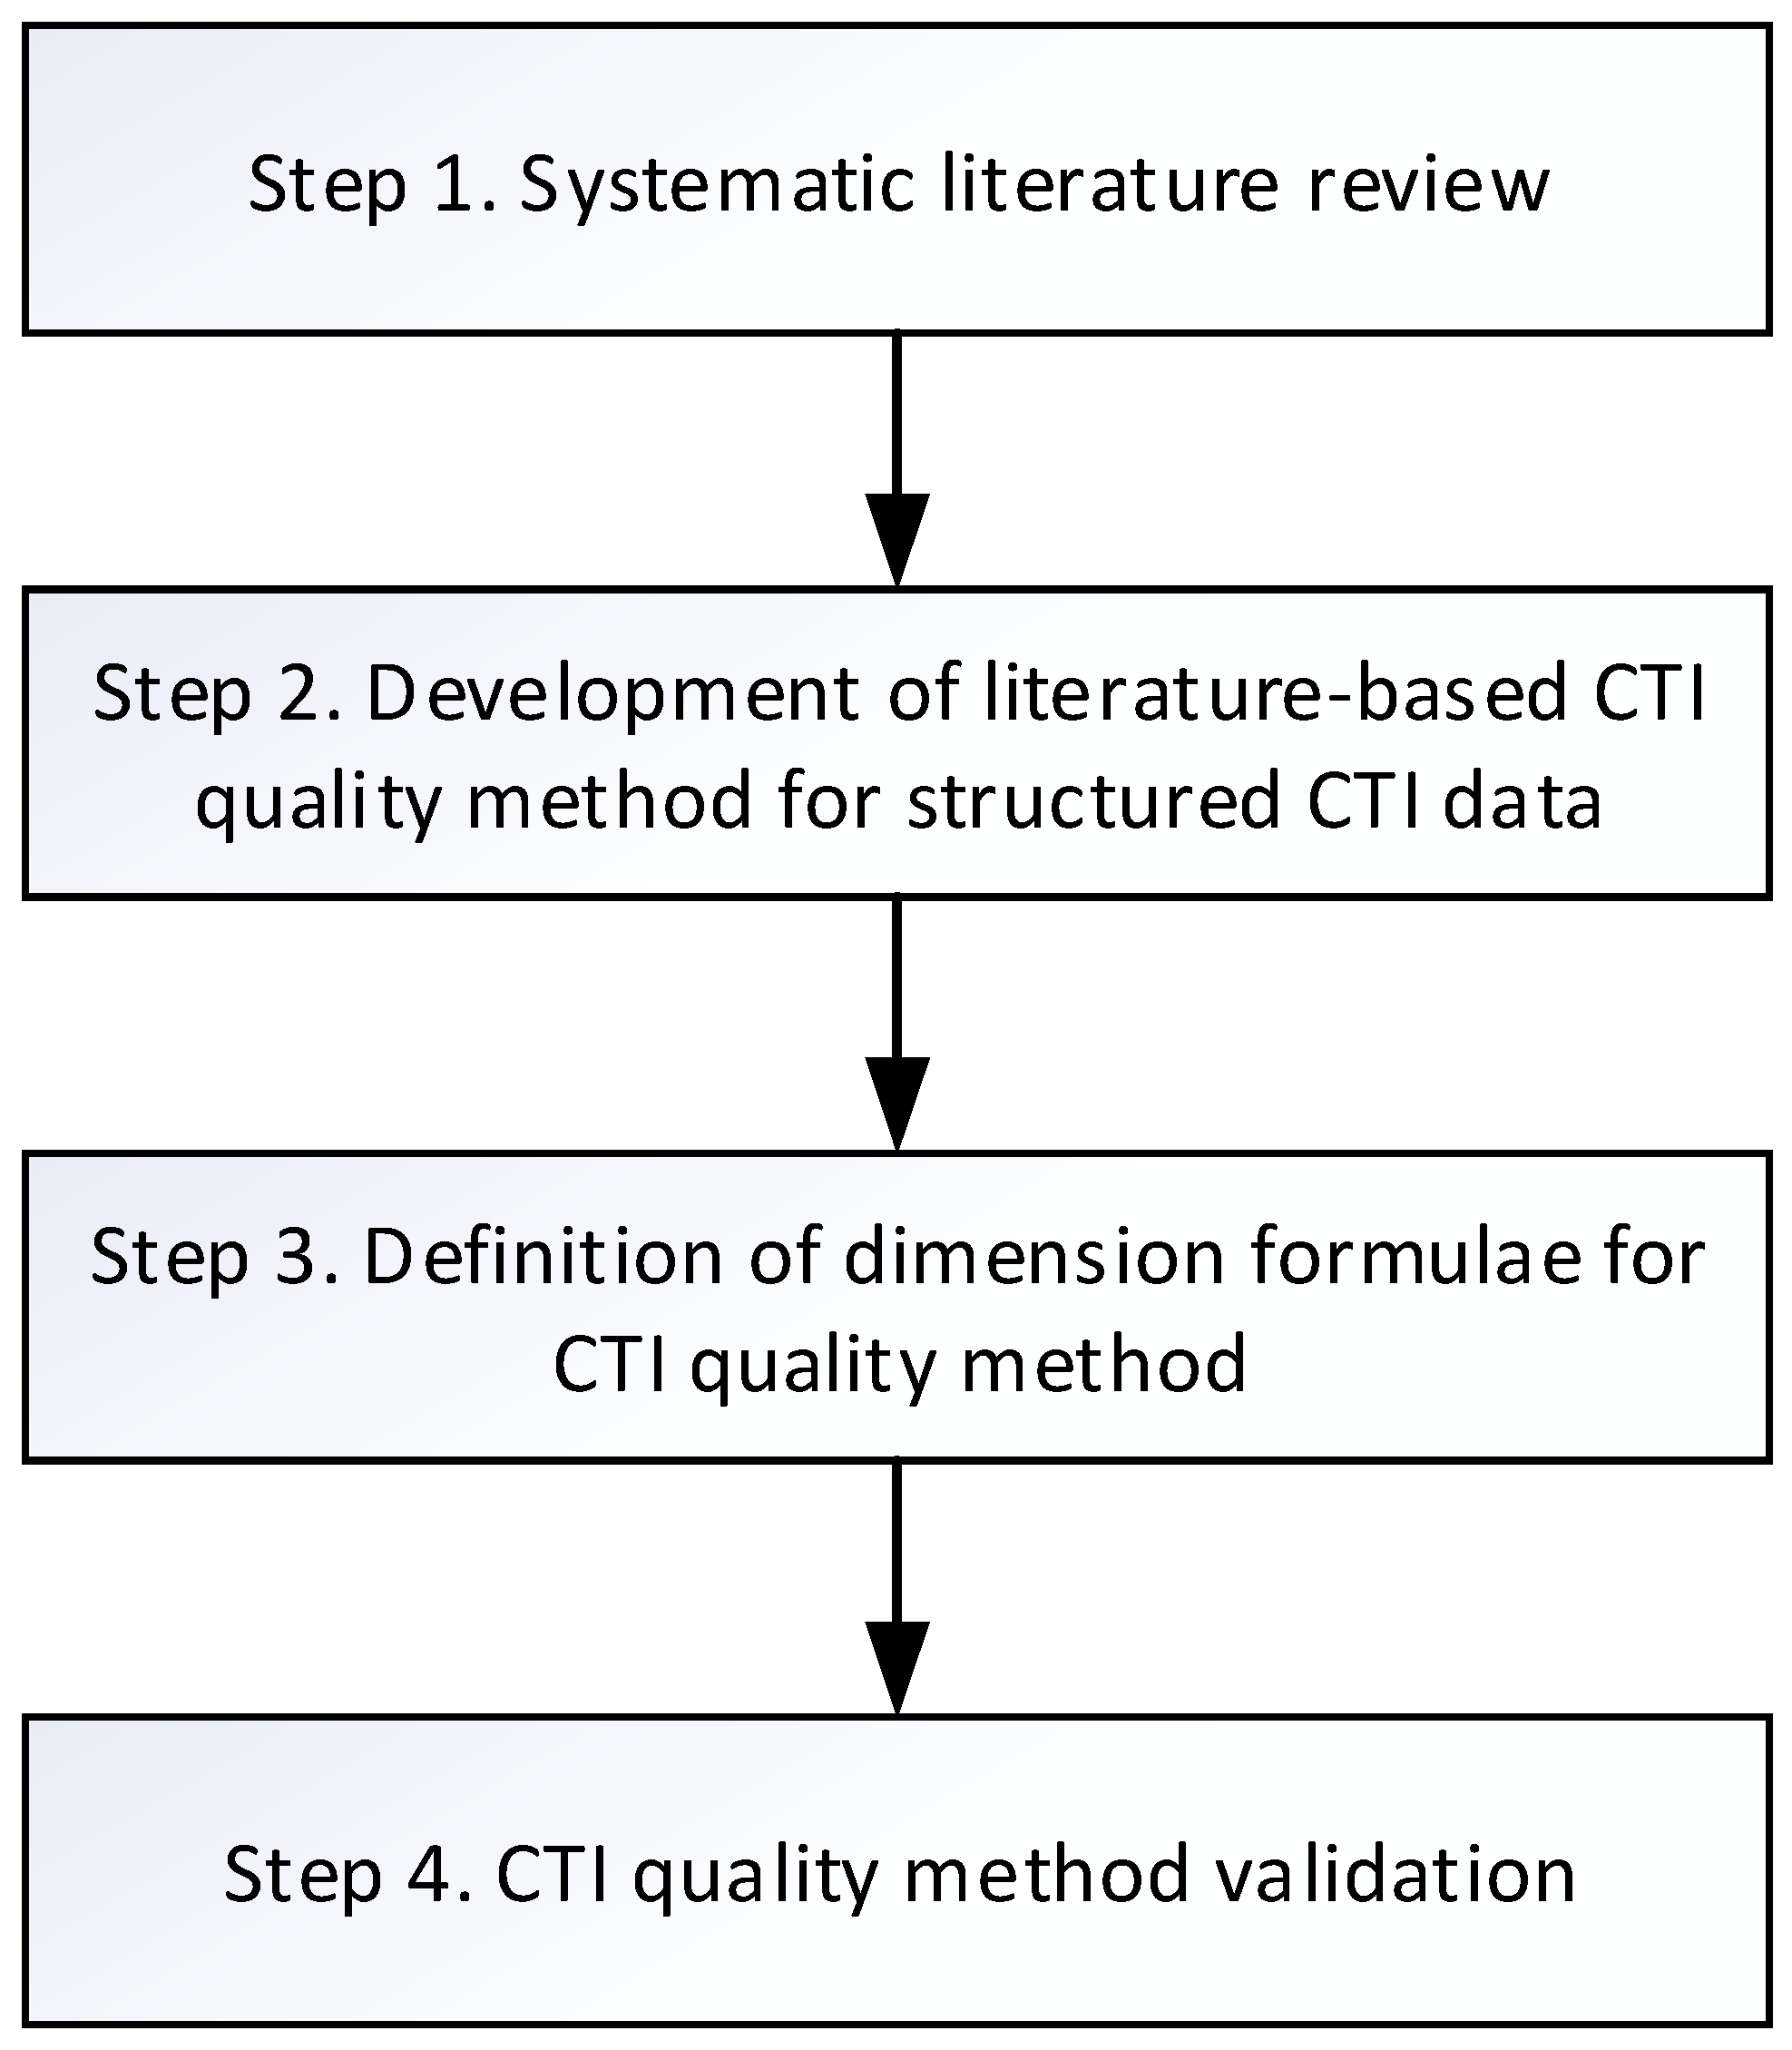
- Providing a systematic literature review of CTI data quality dimensions;
- Defining separate calculations of CTI data quality for technical and tactical levels of using CTI. To the best of our knowledge, such an approach is novel for CTI data quality assessment;
- Defining a set of literature-based CTI data quality dimensions for structured CTI data provided in a machine-readable format;
- Creating measurement formulae for defined CTI data quality dimensions. Most of the formulae are original ones;
- Implementing defined formulae and providing experimental results of applications to real CTI data.
2. Review of Related Work
3. Proposed Automated CTI Data Quality Assessment Method
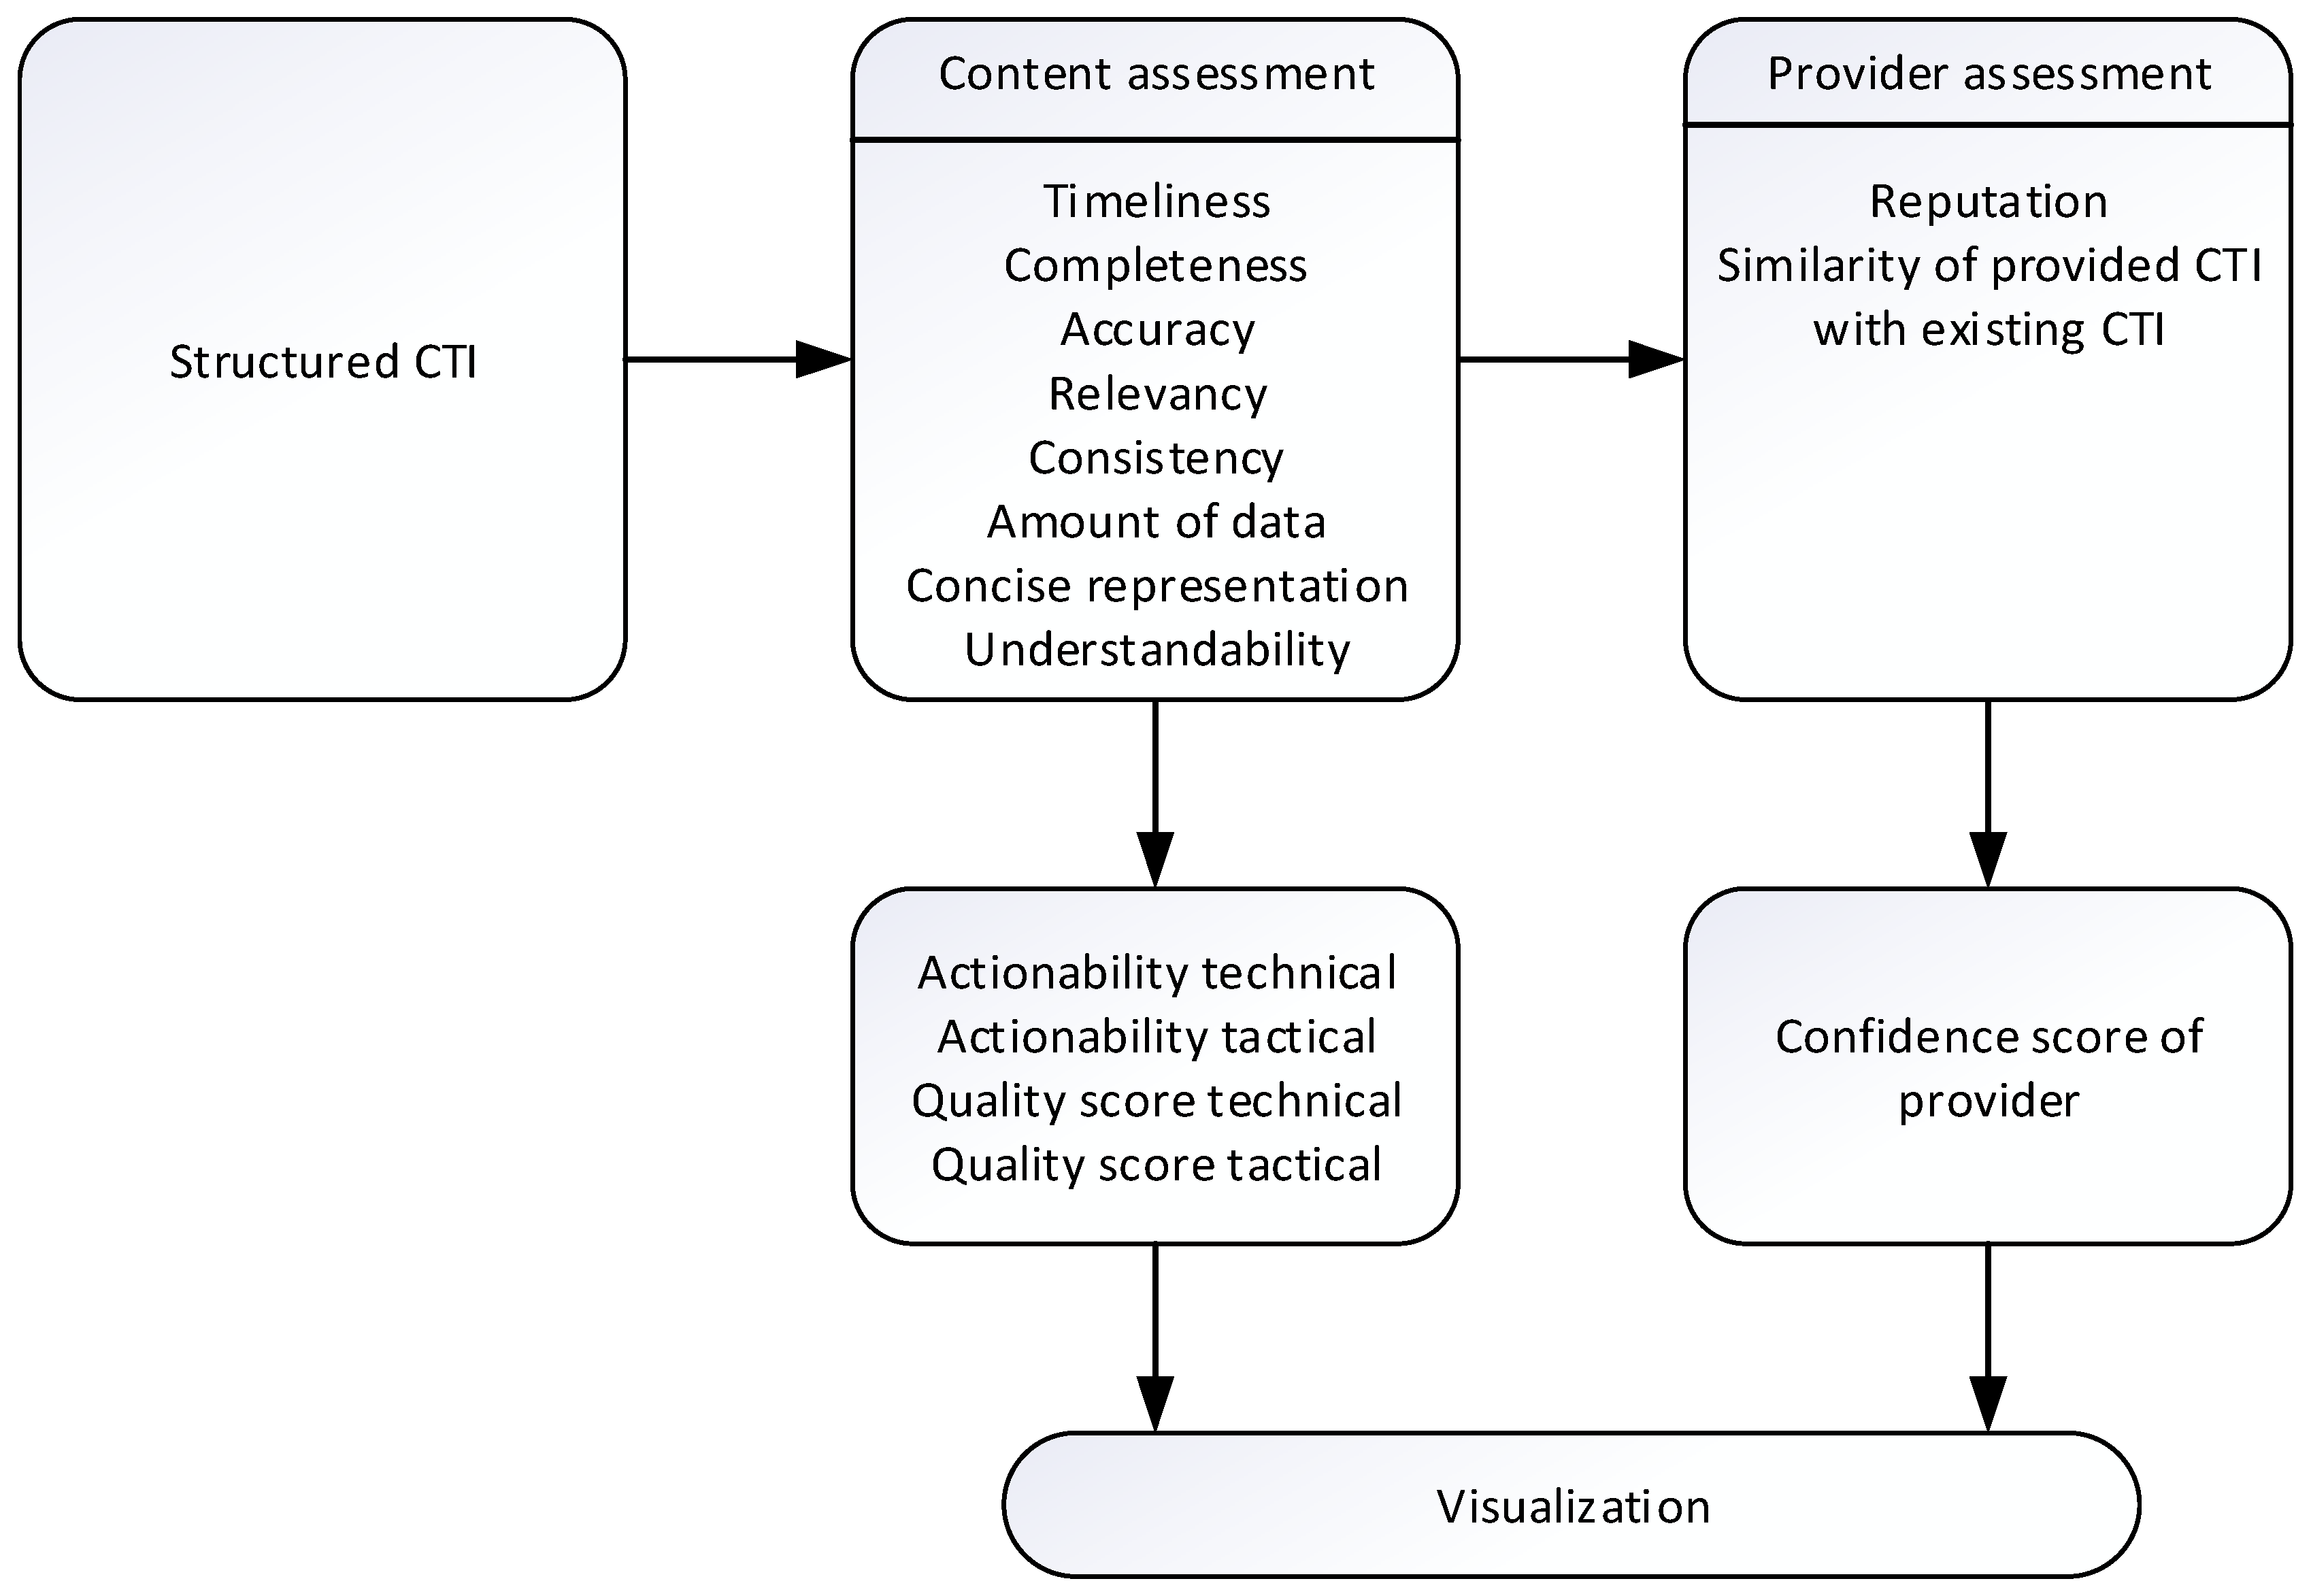
3.1. Choice of the Dimensions

| Dimension | Wang & Strong [15] | ISO/IEC 25012 [16] | Gao et al. [19] | Li et al. [20] | Meier et al. [21] | Grispos et al. [30] | Li et al. [22] | Schaberreiter et al. [23] | Griffioen et al. [35] | Tundis et al. [32] | Mavzer et al. [25] | Schlette et al. [24] | DeCastro-García & Pinto [33] | Wang et al. [34] | Zibak et al. [26] | Yang et al. [27] | Chen et al. [28] | Total |
|---|---|---|---|---|---|---|---|---|---|---|---|---|---|---|---|---|---|---|
| Timeliness | ** | + | ** | ** | ** | ** | + | ** | ** | ** | ** | ** | ** | ** | ** | ** | 16 | |
| Completeness | ** | ** | ** | ** | ** | + | ** | + | ** | ** | ** | + | *+ | ** | 14 | |||
| Accuracy | ** | ** | ** | ** | ** | ** | ** | ** | ** | 9 | ||||||||
| Reliability | + | + | + | + | + | + | ** | 7 | ||||||||||
| Relevance | ** | ** | ** | ** | ** | ** | ** | 7 | ||||||||||
| Reputation (Provenance) | ** | + | + | ** | ** | + | + | 7 | ||||||||||
| Similarity/Exclusivity | ** | ** | + | ** | + | + | ** | 7 | ||||||||||
| Consistency | ** | ** | ** | ** | ** | *+ | 6 | |||||||||||
| Amount of data | ** | + | + | ** | + | 5 | ||||||||||||
| Extensiveness | + | + | ** | ** | 4 | |||||||||||||
| Portability | ** | + | ** | 3 | ||||||||||||||
| Update frequency | ** | + | ** | 3 | ||||||||||||||
| Actionability | ** | ** | 2 | |||||||||||||||
| Compliance | ** | ** | 2 | |||||||||||||||
| Concise representation | ** | ** | 2 | |||||||||||||||
| Differential contribution | ** | + | 2 | |||||||||||||||
| Understandability | ** | ** | 2 | |||||||||||||||
| Objectivity | ** | ** | 2 | |||||||||||||||
| Security | ** | + | 2 | |||||||||||||||
| Value-Added | ** | + | 2 | |||||||||||||||
| Verifiability | ** | ** | 2 |
3.2. Definition of the Formulae for the Dimensions
- (a)
- Basic case. This is the time difference between the current time and creation time of the objects in the CTI provided by the feed. The timeliness of CTI vt is calculated as follows (Equation (1)):
- (b)
- Indicator object case. The timeliness dimension can be based on specific properties of objects. The indicator object has unique properties valid_from and valid_until available only in this object. The value of property valid_from usually repeats the value of property created. However, the value of property valid_until, if it is available (since it is optional), defines the time till this indicator is valid. So, to know the time till the indicator is valid is very important. If this value is available, it must be used in the calculation of the timeliness dimension (Equation (2)). The valid_until property is usually defined for an indicator with the pattern “ipv4-addr:value”. The threshold is applied for the indicator case, as well. The value of timeliness declines very quickly if the threshold is not applied.
- (c)
- Statistical data case. When statistical data about the decline of timeliness for specific CTI objects are available, the timeliness dimension must be adapted (Equation (3)). We know that the decline of certain CTI objects is higher than for others. File hashes used in the indicator object will likely have unchanged values, as malware binaries are often subject to slight modification, resulting in changed hash values. Meanwhile, information regarding object types such as malware analysis, threat actors, and tools might not change over time. For such object types, statistical decline must be taken into account.
4. Results Analysis
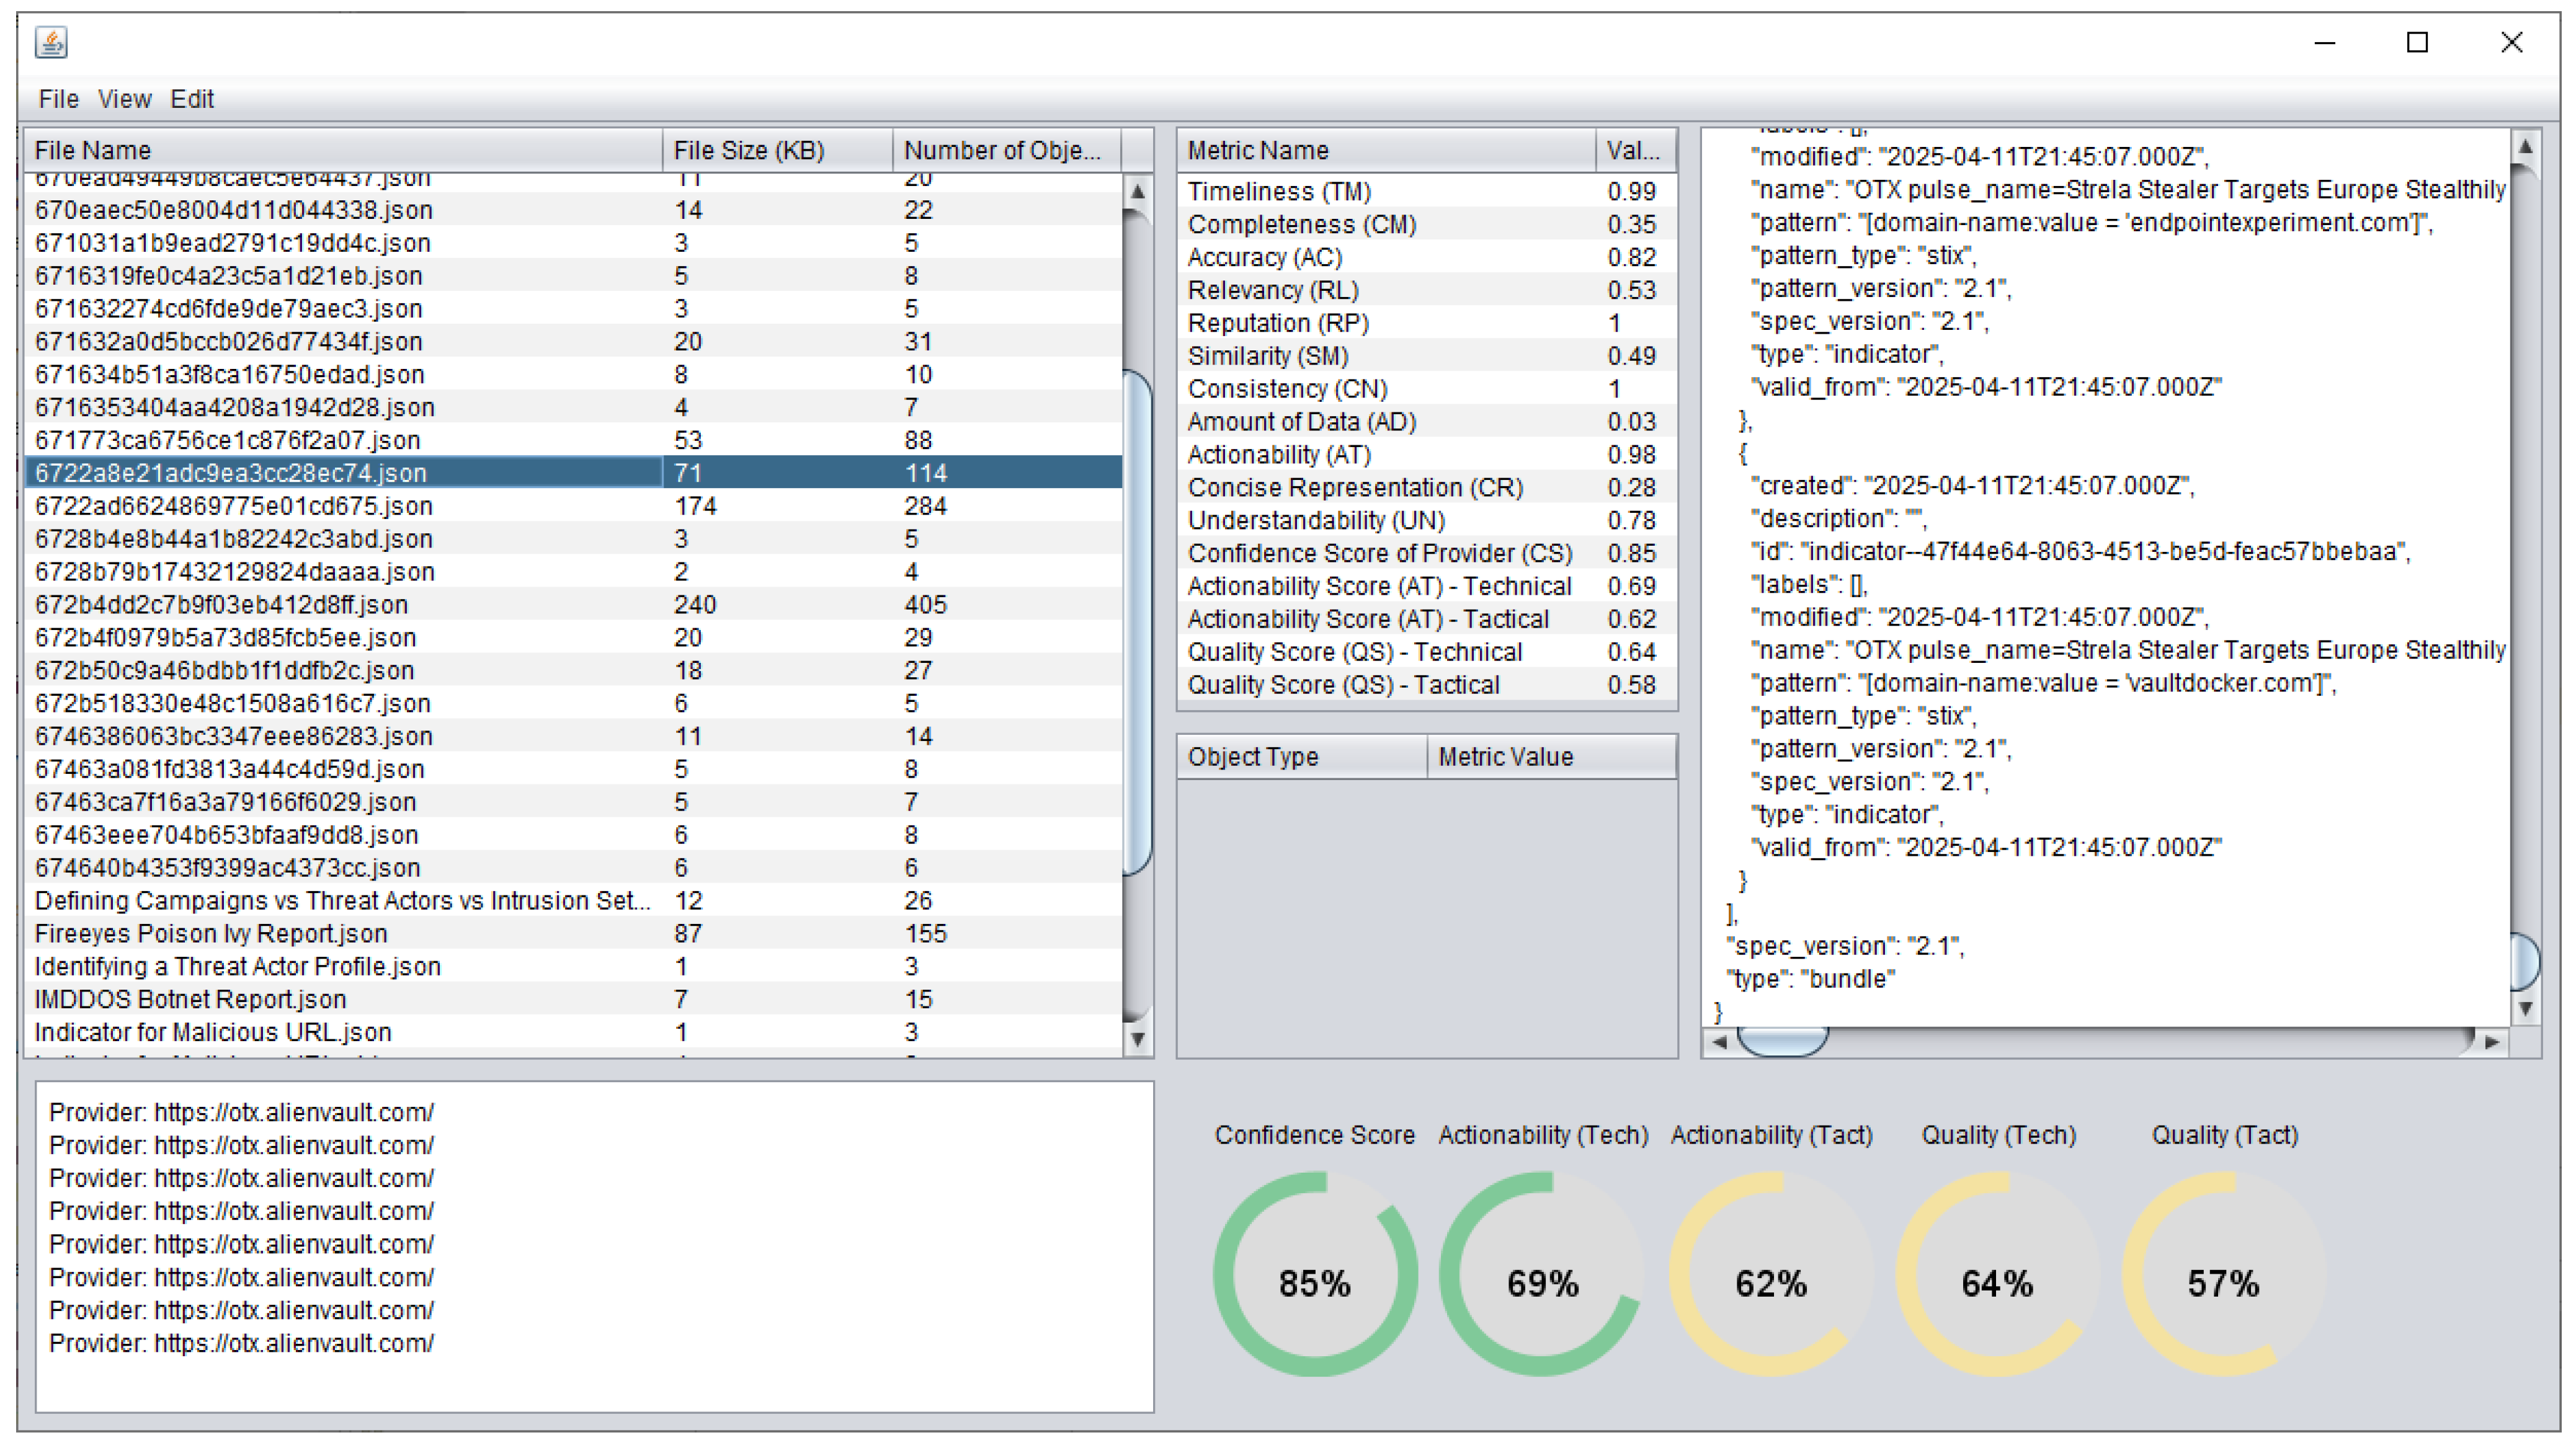
4.1. Experiment
- Gson Java library [48]—used to convert a JSON string to an equivalent Java object representing a STIX file.
- Apache POI library [49]—to export data in Excel format.
- Java version—JDK 23 (build 23.0.1+11-39)
| Listing 1. Example of STIX file. |
| { “type”: “bundle”, “id”: “bundle--56be2a3b-1534-4bef-8fe9-602926274089”, “objects”: [ { “type”: “indicator”, “spec_version”: “2.1”, “id”: “indicator--d81f86b9-975b-4c0b-875e-810c5ad45a4f”, “created”: “2024-10-22T13:49:37.079Z”, “modified”: “2024-10-22T13:49:37.079Z”, “name”: “Malicious site hosting downloader”, “description”: “This organized threat actor group operates to create profit from all types of crime.”, “indicator_types”: [ “malicious-activity” ], “pattern”: “[url:value = ‘http://x4z9arb.cn/4712/’”, “pattern_type”: “stix”, “valid_from”: “2024-10-22T13:49:37.079Z” }, { “type”: “malware”, “spec_version”: “2.1”, “id”: “malware--162d917e-766f-4611-b5d6-652791454fca”, “created”: “2024-10-22T09:15:17.182Z”, “modified”: “2024-10-22T09:15:17.182Z”, “name”: “x4z9arb backdoor”, “description”: “This malware attempts to download remote files after establishing a foothold as a backdoor.”, “malware_types”: [ “backdoor”, “remote-access-trojan” ], “is_family”: false, “kill_chain_phases”: [ { “kill_chain_name”: “mandiant-attack-lifecycle-model”, “phase_name”: “establish-foothold” } ] }, { “type”: “relationship”, “spec_version”: “2.1”, “id”: “relationship--864af2ea-46f9-4d23-b3a2-1c2adf81c265”, “created”: “2024-10-22T18:03:58.029Z”, “modified”: “2024-10-22T18:03:58.029Z”, “relationship_type”: “indicates”, “source_ref”: “indicator--d81f86b9-975b-4c0b-875e-810c5ad45a4f”, “target_ref”: “malware--162d917e-766f-4611-b5d6-652791454fca” } ] } |
4.2. Discussion
| CTI Quality Score | Confidence Score of the Provider | |||||||||
|---|---|---|---|---|---|---|---|---|---|---|
| Method | Timeliness | Completeness | Accuracy | Relevance | Consistency | Amount of Data | Concise Represent. | Understandability | Reputation | Similarity |
| Chen et al. [28] | 9% | 12% | 3% | 36% | 40% | - | - | - | 70% | 30% |
| Zibak et al. [26]. Ranks for CT data | First | - | Fourth | Second | - | - | - | - | Sixth | - |
| Zibak et al. [26]. Ranks for CTI | Third | - | Fourth | First | - | - | - | - | Fifth | - |
| Schlette et al. [24] | The weights are defined by the user. Initially, they are equal. | |||||||||
| DeCastro-García & Pinto [33] | The weights are defined by the user. The default values are not disclosed. | |||||||||
| Our CTI Quality Score Technical | 22% | 11% | 11% | 32% | 6% | 6% | 6% | 6% | 70% | 30% |
| Our CTI Quality Score Tactical | 8% | 18% | 18% | 32% | 6% | 6% | 6% | 6% | 70% | 30% |
| Features | Wang & Strong [15] | Li et al. [20] | Schaberreiter et al. [23] | Tundis et al. [32] | Mavzer et al. [25] | Schlette et al. [24] | DeCastro-García & Pinto [33] | Wang et al. [34] | Zibak et al. [26] | Yang et al. [27] | Chen et al. [28] | Our Method |
|---|---|---|---|---|---|---|---|---|---|---|---|---|
| Comprehensive literature analysis | + | + | ||||||||||
| Fully automatic assessment of the dimensions | + | + | + | + | + | + | + | + | ||||
| Ability to assess new CTI data | + | + | + | + | + | |||||||
| Way to calculate dimensions | + | + | + | + | + | + | + | + | ||||
| Number of summarizing dimensions | 4 | 1 | 1 | 1 | 1 | 1 | 1 | 1 | 0 | 1 | 2 | 5 |
| Structured CTI oriented | + | + | + | + | + | + | + | + | + | |||
| Visualization | + | + | + | |||||||||
| Delphi study | + | + | + | |||||||||
| Total number of possessed features | 3 | 1 | 4 | 5 | 5 | 5 | 4 | 4 | 4 | 3 | 5 | 7 |
5. Conclusions
Author Contributions
Funding
Institutional Review Board Statement
Informed Consent Statement
Data Availability Statement
Conflicts of Interest
References
- Chatziamanetoglou, D.; Rantos, K. Cyber Threat Intelligence on Blockchain: A Systematic Literature Review. Computers 2024, 13, 60. [Google Scholar] [CrossRef]
- Alaeifar, P.; Pal, S.; Jadidi, Z.; Hussain, M.; Foo, E. Current approaches and future directions for Cyber Threat Intelligence sharing: A survey. J. Inf. Secur. Appl. 2024, 83, 103786, ISSN 2214-2126. [Google Scholar] [CrossRef]
- Preuveneers, D.; Joosen, W. Sharing Machine Learning Models as Indicators of Compromise for Cyber Threat Intelligence. J. Cybersecur. Priv. 2021, 1, 140–163. [Google Scholar] [CrossRef]
- Bandara, E.; Shetty, S.; Mukkamala, R.; Rahaman, A.; Liang, X. LUUNU—Blockchain, MISP, Model Cards and Federated Learning Enabled Cyber Threat Intelligence Sharing Platform. In Proceedings of the 2022 Annual Modeling and Simulation Conference (ANNSIM), San Diego, CA, USA, 18–20 July 2022; pp. 235–245. [Google Scholar] [CrossRef]
- Gillard, S.; David, D.P.; Mermoud, A.; Maillart, T. Efficient collective action for tackling time-critical cybersecurity threats. J. Cybersecur. 2003, 9, tyad021. [Google Scholar] [CrossRef]
- Menges, F.; Putz, B.; Pernul, G. DEALER: Decentralized incentives for threat intelligence reporting and exchange. Int. J. Inf. Secur. 2021, 20, 741–761. [Google Scholar] [CrossRef]
- Ali, H.; Ahmad, J.; Jaroucheh, Z.; Papadopoulos, P.; Pitropakis, N.; Lo, O.; Abramson, W.; Buchanan, W.J. Trusted Threat Intelligence Sharing in Practice and Performance Benchmarking through the Hyperledger Fabric Platform. Entropy 2022, 24, 1379. [Google Scholar] [CrossRef]
- Sun, N.; Ding, M.; Jiang, J.; Xu, W.; Mo, X.; Tai, Y.; Zhang, J. Cyber Threat Intelligence Mining for Proactive Cybersecurity Defense: A Survey and New Perspectives. IEEE Commun. Surv. Tutor. 2023, 25, 1748–1774. [Google Scholar] [CrossRef]
- Chatziamanetoglou, D.; Rantos, K. Blockchain-Based Cyber Threat Intelligence Sharing Using Proof-of-Quality Consensus. Secur. Commun. Netw. 2023, 2023, 3303122. [Google Scholar] [CrossRef]
- Purohit, S.; Neupane, R.; Bhamidipati, N.R.; Vakkavanthula, V.; Wang, S.; Rockey, M.; Calyam, P. Cyber Threat Intelligence Sharing for Co-Operative Defense in Multi-Domain Entities. IEEE Trans. Dependable Secur. Comput. 2023, 20, 4273–4290. [Google Scholar] [CrossRef]
- Dimitriadis, A.; Lontzetidis, E.; Mavridis, I. Evaluation and Enhancement of the Actionability of Publicly Available Cyber Threat Information in Digital Forensics. In Proceedings of the 2021 IEEE International Conference on Cyber Security and Resilience (CSR), Rhodes, Greece, 26–28 July 2021; pp. 318–323. [Google Scholar] [CrossRef]
- Barnum, S. Standardizing Cyber Threat Intelligence Information with the Structured Threat Information Expression (STIX™). 2014. Available online: https://stixproject.github.io/about/STIX_Whitepaper_v1.1.pdf (accessed on 18 October 2024).
- Ainslie, S.; Thompson, D.; Maynard, S.; Ahmad, A. Cyber-threat intelligence for security decision-making: A review and research agenda for practice. Comput. Secur. 2023, 132, 103352, ISSN 0167-4048. [Google Scholar] [CrossRef]
- Introduction to STIX. Available online: https://oasis-open.github.io/cti-documentation/stix/intro.html (accessed on 18 October 2024).
- Wang, R.Y.; Strong, D.M. Beyond accuracy: What data quality means to data consumers. J. Manag. Inf. Syst. 1996, 12, 5–33. [Google Scholar] [CrossRef]
- ISO/IEC 25012; Software Engineering-Software Product Quality Requirements and Evaluation (Square)-Data Quality Model. The International Organization for Standardization: Geneva, Switzerland, 2008. Available online: https://www.iso.org/standard/35736.html (accessed on 7 October 2024).
- Wang, R.Y. A product perspective on total data quality management. Commun. ACM 1998, 41, 58–65. [Google Scholar] [CrossRef]
- ISO 25024; Systems and Software Engineering—Systems and Software Quality Requirements and Evaluation (SQuaRE)—Measurement of Data Quality. The International Organization for Standardization: Geneva, Switzerland, 2015. Available online: https://www.iso.org/standard/35749.html (accessed on 11 April 2025).
- Gao, Y.; Li, X.; Li, J.; Gao, Y.; Guo, N. Graph Mining-based Trust Evaluation Mechanism with Multidimensional Features for Large-scale Heterogeneous Threat Intelligence. In Proceedings of the 2018 IEEE International Conference on Big Data (Big Data), Seattle, WA, USA, 10–13 December 2018; pp. 1272–1277. [Google Scholar] [CrossRef]
- Li, Q.; Jiang, Z.; Yang, Z.; Liu, B.; Wang, X.; Zhang, Y. A Quality Evaluation Method of Cyber Threat Intelligence in User Perspective. In Proceedings of the 2018 17th IEEE International Conference on Trust, Security and Privacy in Computing and Communications/12th IEEE International Conference on Big Data Science and Engineering (TrustCom/BigDataSE), New York, NY, USA, 1–3 August 2018; pp. 269–276. [Google Scholar] [CrossRef]
- Meier, R.; Scherrer, C.; Gugelmann, D.; Lenders, V.; Vanbever, L. FeedRank: A tamper-resistant method for the ranking of cyber threat intelligence feeds. In Proceedings of the 2018 10th International Conference on Cyber Conflict (CyCon), Tallinn, Estonia, 29 May–1 June 2018; pp. 321–344. [Google Scholar] [CrossRef]
- Li, V.G.; Dunn, M.; Pearce, P.; McCoy, D.; Voelker, G.M.; Savage, S. Reading the tea leaves: A comparative analysis of threat intelligence. In Proceedings of the 28th USENIX Security Symposium (USENIX Security 19), Santa Clara, CA, USA, 14–16 August 2019; pp. 851–867. [Google Scholar]
- Schaberreiter, T.; Kupfersberger, V.; Rantos, K.; Spyros, A.; Papanikolaou, A.; Ilioudis, C.; Quirchmayr, G. A quantitative evaluation of trust in the quality of cyber threat intelligence sources. In Proceedings of the 14th international Conference on Availability, Reliability and Security, 26–29 August 2019; pp. 1–10. [Google Scholar] [CrossRef]
- Schlette, D.; Böhm, F.; Caselli, M.; Pernul, G. Measuring and visualizing cyber threat intelligence quality. Int. J. Inf. Secur. 2021, 20, 21–38. [Google Scholar] [CrossRef]
- Mavzer, K.B.; Konieczna, E.; Alves, H.; Yucel, C.; Chalkias, I.; Mallis, D.; Cetinkaya, D.; Sanchez LA, G. Trust and QualityComputation for Cyber Threat Intelligence Sharing Platforms. In Proceedings of the 2021 IEEE International Conference on Cyber Security and Resilience (CSR), Rhodes, Greece, 26–28 July 2021; pp. 360–365. [Google Scholar] [CrossRef]
- Zibak, A.; Sauerwein, C.; Simpson, A.C. Threat intelligence quality dimensions for research and practice. Digit. Threat. Res. Pract. 2022, 3, 44. [Google Scholar] [CrossRef]
- Yang, L.; Wang, M.; Lou, W. An automated dynamic quality assessment method for cyber threat intelligence. Comput. Secur. 2024, 148, 104079. [Google Scholar] [CrossRef]
- Chen, S.-S.; Hwang, R.-H.; Ali, A.; Lin, Y.-D.; Wei, Y.-C.; Pai, T.-W. Improving quality of indicators of compromise using STIX graphs. Comput. Secur. 2024, 144, 103972. [Google Scholar] [CrossRef]
- Sakellariou, G.; Fouliras, P.; Mavridis, I. A Methodology for Developing & Assessing CTI Quality Metrics. IEEE Access 2024, 12, 6225–6238. [Google Scholar] [CrossRef]
- Grispos, G.; Glisson, W.B.; Storer, T. How good is your data? Investigating the quality of data generated during security incident response investigations. In Proceedings of the 52nd Hawaii International Conference on System Sciences Scholar Space Hawaii International, Maui, HI, USA, 8–11 April 2019; pp. 7156–7165. Available online: https://hdl.handle.net/10125/60152 (accessed on 24 October 2024).
- Dalziel, H. A Problem Well-Defined is Half-Solved. In How to Define and Build an Effective Cyber Threat Intelligence Capability; Elsevier: London, UK, 2015; pp. 3–6. [Google Scholar]
- Tundis, A.; Ruppert, S.; Mühlhäuser, M. On the Automated Assessment of Open-Source Cyber Threat Intelligence Sources. In Lecture Notes in Computer Science, Proceedings of the International Conference on Computational Science, Amsterdam, The Netherlands, 3–5 June 2020; Krzhizhanovskaya, V.V., Závodszky, G., Lees, M.H., Dongarra, J.J., Sloot, P.M.A., Brissos, S., Teixeira, J., Eds.; Springer: Cham, Switzerland, 2020; Volume 12138. [Google Scholar] [CrossRef]
- DeCastro-García, N.; Pinto, E. Measuring the Quality Information of Sources of Cybersecurity by Multi-Criteria Decision Making Techniques. In Lecture Notes in Computer Science, Proceedings of the Hybrid Artificial Intelligent Systems, Salamancaa, Spain, 5–7 September 2022; Bringas, P.G., García, H.P., de Pisón, F.J.M., Flecha, J.R.V., Lora, A.T., de la Cal, E.A., Herrero, Á., Álvarez, F.M., Psaila, G., et al., Eds.; Springer: Cham, Switzerland, 2023; Volume 13469. [Google Scholar] [CrossRef]
- Wang, M.; Yang, L.; Lou, W. A Comprehensive Dynamic Quality Assessment Method for Cyber Threat Intelligence. In Proceedings of the 2022 52nd Annual IEEE/IFIP International Conference on Dependable Systems and Networks Workshops (DSN-W), Baltimore, MD, USA, 27–30 June 2022; pp. 178–181. [Google Scholar] [CrossRef]
- Griffioen, H.; Booij, T.; Doerr, C. Quality evaluation of cyber threat intelligence feeds. In Proceedings of the International Conference on Applied Cryptography and Network Security: 18th International Conference, ACNS 2020, Rome, Italy, 19–22 October 2020; Proceedings, Part II. Springer: Berlin/Heidelberg, Germany, 2020; pp. 277–296. [Google Scholar] [CrossRef]
- Ahlemann, F.; Gastl, H. Process model for an empiracally grounded reference model construction. In Reference Modeling for Business Systems Analysis; IGI Global Scientific Publishing: Hershey, PA, USA, 2007; pp. 77–97. [Google Scholar] [CrossRef]
- Sakellariou, G.; Fouliras, P.; Mavridis, I.; Sarigiannidis, P. A Reference Model for Cyber Threat Intelligence (CTI) Systems. Electronics 2022, 11, 1401. [Google Scholar] [CrossRef]
- Tundis, A.; Ruppert, S.; Mühlhäuser, M. A Feature-driven Method for Automating the Assessment of OSINT Cyber Threat Sources. Comput. Secur. 2022, 113, 102576. [Google Scholar] [CrossRef]
- Gong, S.; Cho, H.; Lee, C. A Reliability Comparison Method for OSINT Validity Analysis. IEEE Trans. Ind. Inform. 2018, 14, 5428–5435. [Google Scholar] [CrossRef]
- Batini, C.; Cappiello, C.; Francalanci, C.; Maurino, A. Methodologies for data quality assessment and improvement. ACM Comput. Surv. 2009, 41, 16. [Google Scholar] [CrossRef]
- European Union Agency for Cybersecurity, Actionable Information for Security Incident Response. 2015. Available online: https://www.enisa.europa.eu/publications/actionable-information-for-security (accessed on 28 October 2024).
- Geras, T.; Schreck, T. The “Big Beast to Tackle”: Practices in Quality Assurance for Cyber Threat Intelligence. In Proceedings of the RAID ‘24: 27th International Symposium on Research in Attacks, Intrusions and Defenses, Padua, Italy, 30 September–2 October 2024; pp. 337–352. [Google Scholar] [CrossRef]
- Yucel, C.; Chalkias, I.; Mallis, D.; Karagiannis, E.; Cetinkaya, D.; Katos, V. On the Assessment of Completeness and Timeliness of Actionable Cyber Threat Intelligence Artefacts. In Communications in Computer and Information Science, Proceedings of the Communications in Computer and Information Science, Kraków, Poland, 8–9 October 2020; Dziech, A., Mees, W., Czyżewski, A., Eds.; Springer: Cham, Switzerland, 2020; Volume 1284. [Google Scholar] [CrossRef]
- Bromander, S.; Swimmer, M.; Muller, L./P.; Jøsang, A.; Eian, M.; Skjøtskift, G.; Borg, F. Investigating Sharing of Cyber Threat Intelligence and Proposing a New Data Model for Enabling Automation in Knowledge Representation and Exchange. Digit. Threat. Res. Pract. 2021, 3, 6. [Google Scholar] [CrossRef]
- Cyber Threat Intelligence (CTI) Quality Metrics. Available online: https://github.com/geosakel77/s2 (accessed on 28 October 2024).
- AlienVault Open Threat Exchange (OTX). Available online: https://otx.alienvault.com/dashboard/new (accessed on 28 October 2024).
- Mitre-Attack/Attack-Stix-Data. Available online: https://github.com/mitre-attack/attack-stix-data/ (accessed on 28 October 2024).
- Google/Gson. Available online: https://github.com/google/gson (accessed on 27 September 2024).
- Apache POI. Available online: https://poi.apache.org/download.html (accessed on 7 October 2024).
- Indicator for Malicious URL. Available online: https://oasis-open.github.io/cti-documentation/examples/indicator-for-malicious-url.html (accessed on 28 October 2024).
- Venčkauskas, A.; Jusas, V.; Barisas, D.; Misnevs, B. Blockchain-Based Model for Incentivized Cyber Threat Intelligence Sharing. Appl. Sci. 2024, 14, 6872. [Google Scholar] [CrossRef]

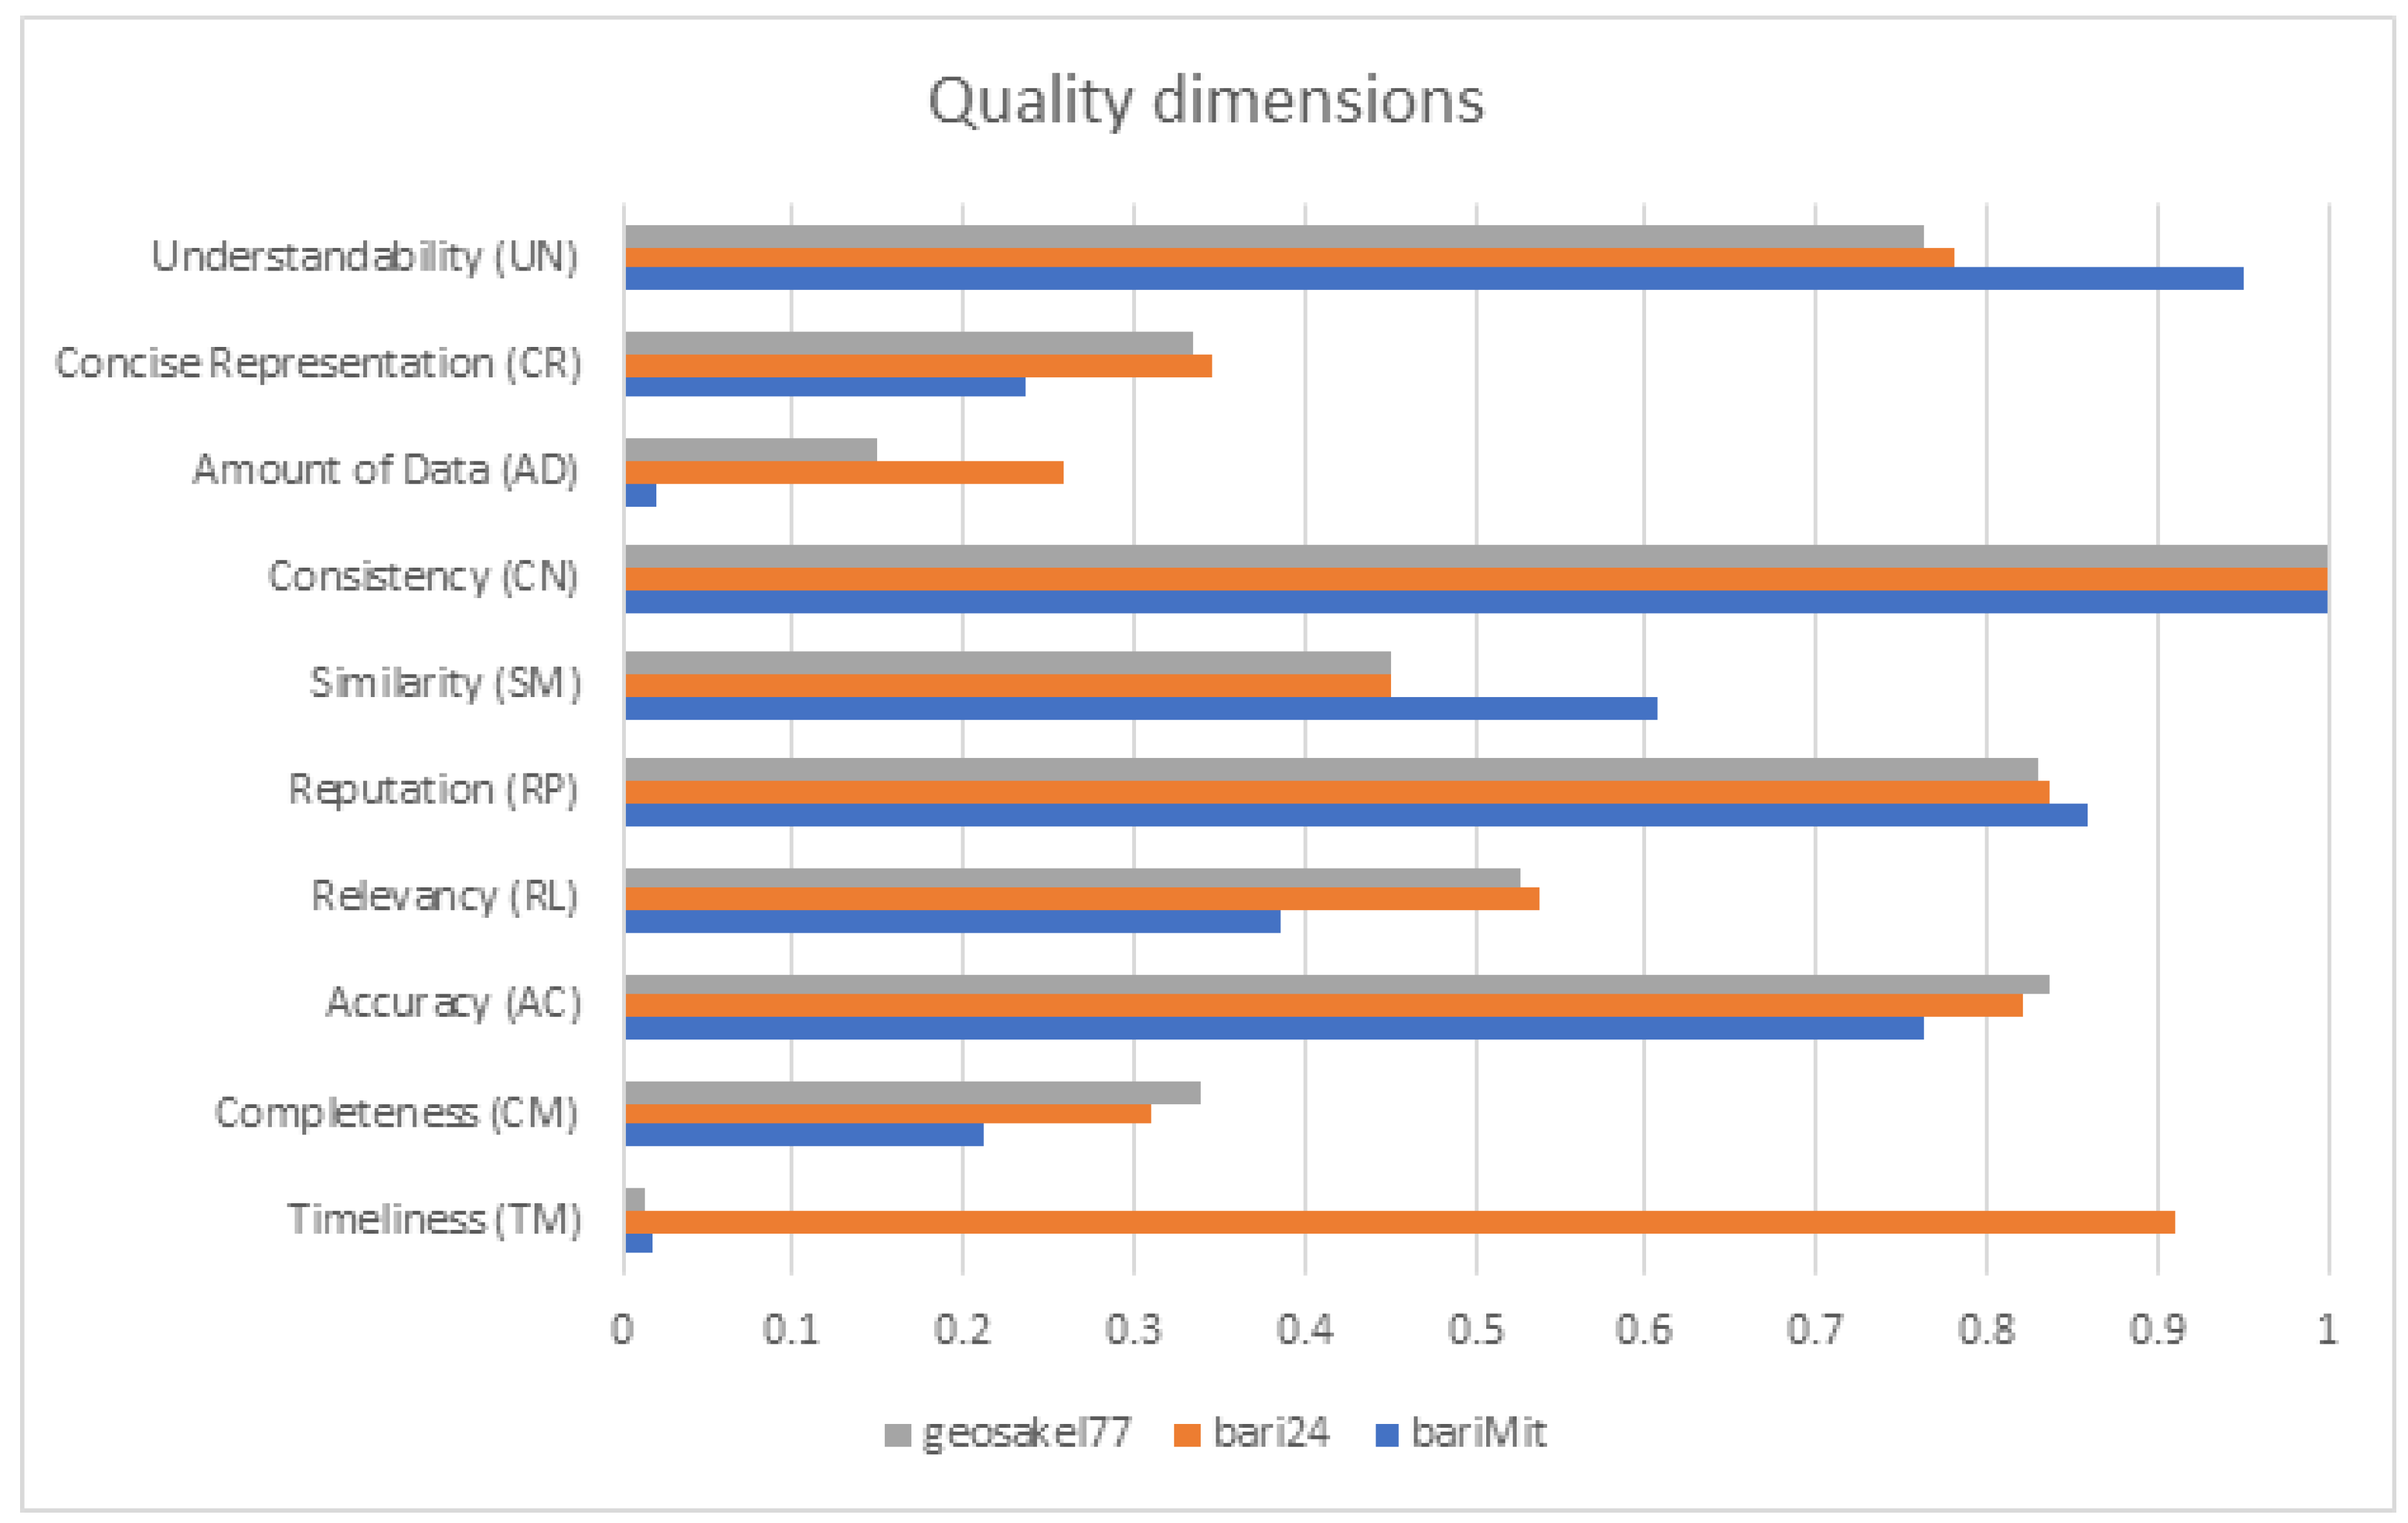

| Dataset | Objects | Number |
|---|---|---|
| geosakel77 | identity | 50 |
| indicator | 67,307 | |
| report | 50 | |
| threat-actor | 4 | |
| vulnerability | 4 | |
| bundles | 50 | |
| bari24 | identity | 30 |
| indicator | 1445 | |
| report | 30 | |
| threat-actor | 15 | |
| vulnerability | 14 | |
| bundles | 30 | |
| bariMit | attack-pattern | 853 |
| course-of-action | 140 | |
| identity | 10 | |
| intrusion-set | 17 | |
| malware | 465 | |
| marking-definition | 10 | |
| relationship | 4125 | |
| tool | 13 | |
| x-mitre-collection | 10 | |
| x-mitre-matrix | 16 | |
| x-mitre-tactic | 105 | |
| bundles | 10 |
| Dimension | Indicator | STIX File |
|---|---|---|
| Timeliness (TM) | 0.93 | 0.93 |
| Completeness (CM) | 0.65 | 0.49 |
| Accuracy (AC) | 0.82 | 0.69 |
| Relevance (RL) | 0.55 | 0.49 |
| Reputation (RP) | - | 0.99 |
| Similarity (SM) | - | 0.24 |
| Consistency (CN) | 1.00 | 1.00 |
| Amount of Data (AD) | - | 1.00 |
| Concise Representation (CR) | - | 0.47 |
| Understandability (UN) | 1.00 | 0.92 |
| Confidence Score of Provider (CS) | - | 0.92 |
| Actionability Score (AT) Technical | - | 0.67 |
| Actionability Score (AT) Tactical | - | 0.61 |
| Quality Score (QS) Technical | - | 0.70 |
| Quality Score (QS) Tactical | - | 0.65 |
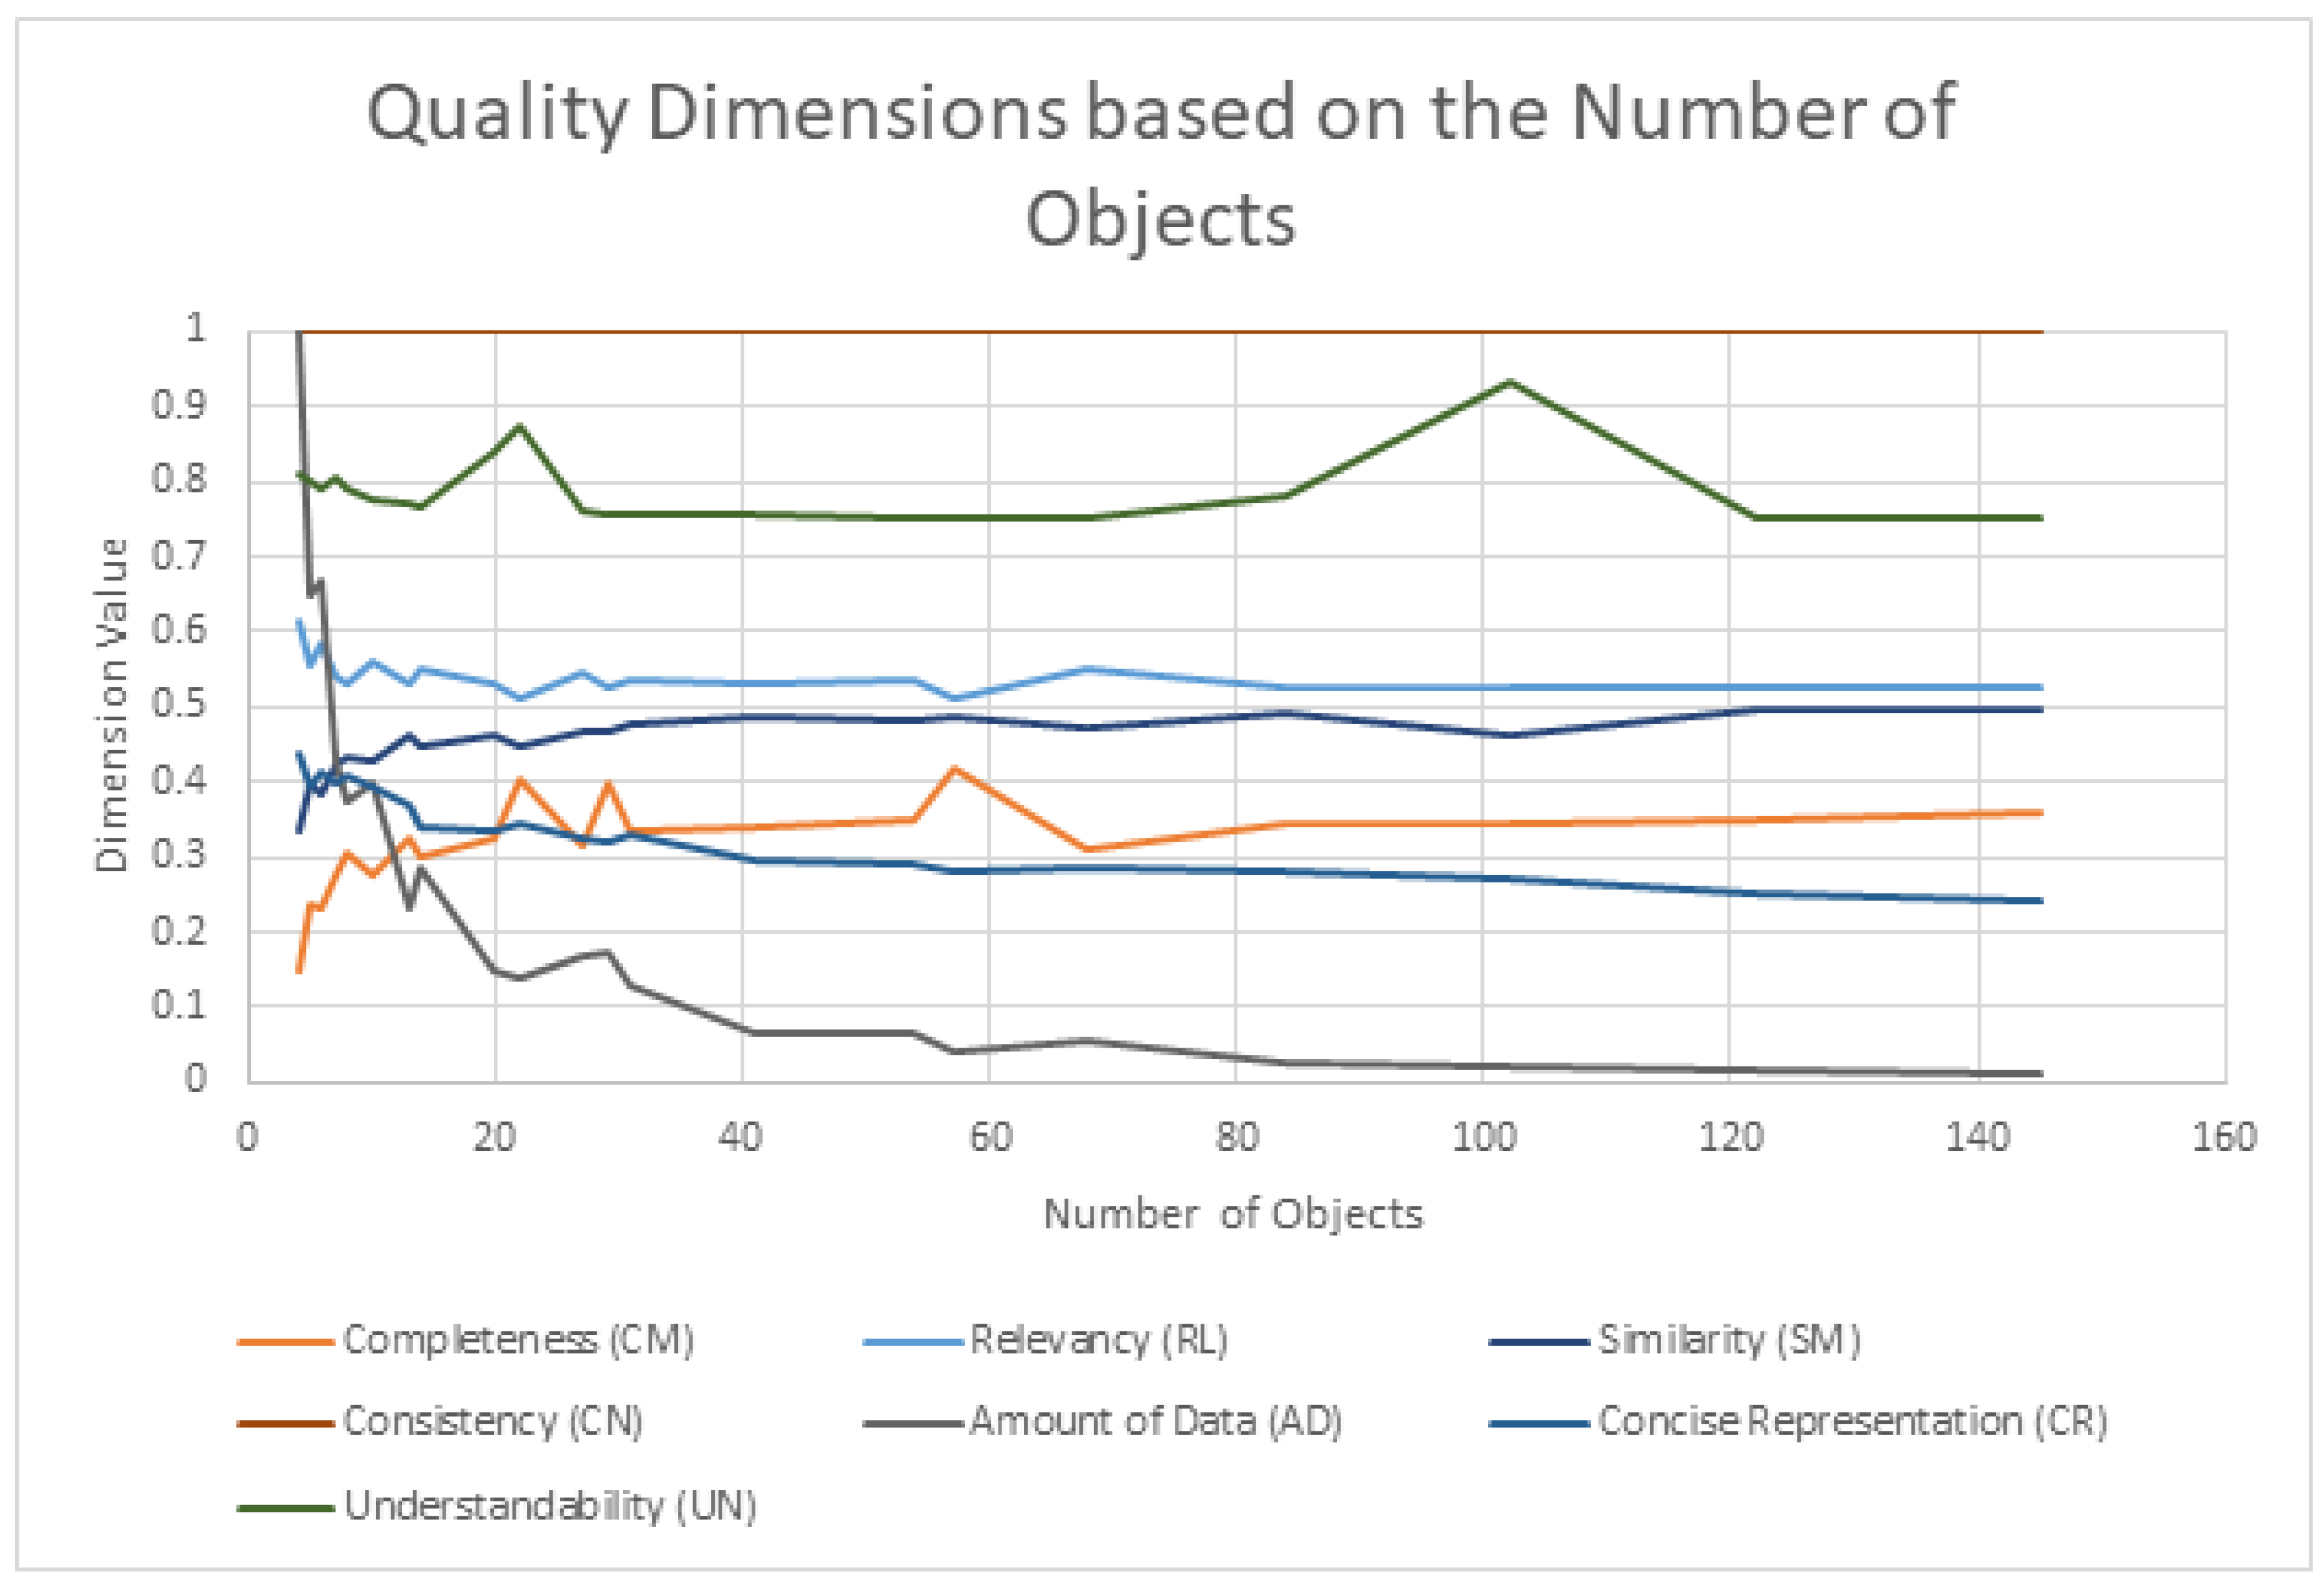
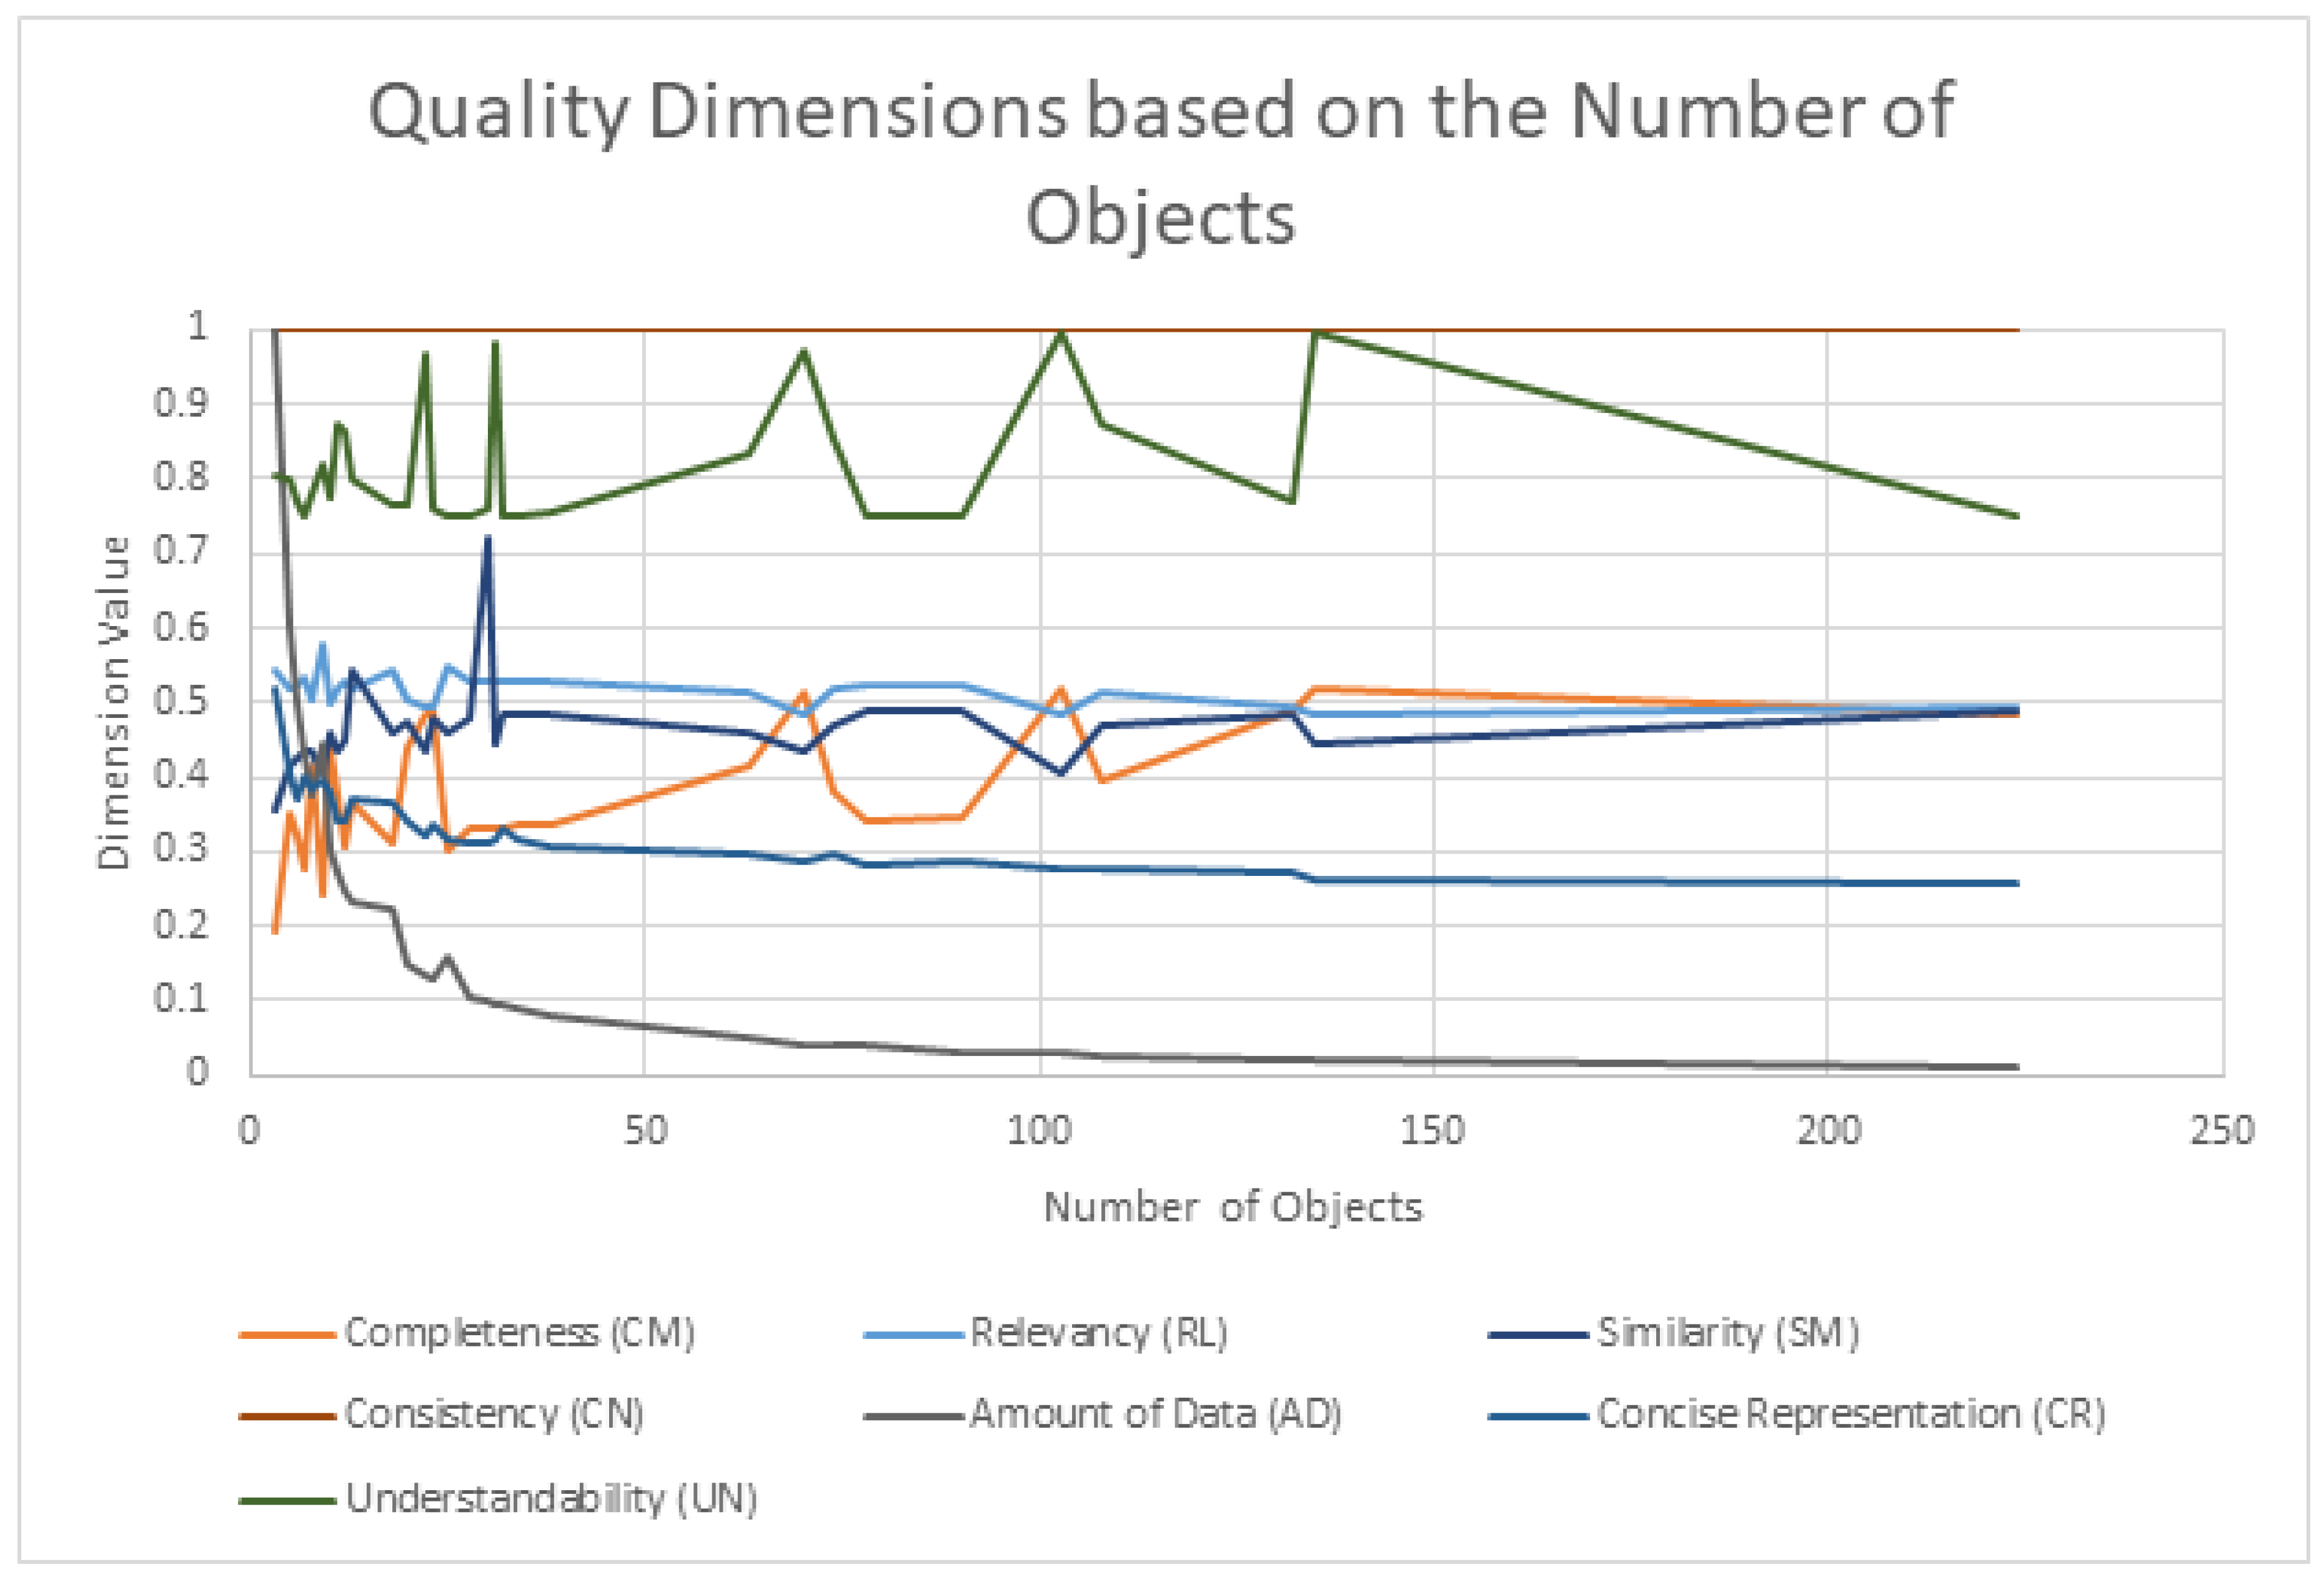
| Dimension | How It Relates to the Number of Objects |
|---|---|
| Completeness (CM) | STIX Domain Objects (SDOs) and STIX Relationship Objects (SROs) are counted. |
| Consistency (CN) | Constraints for all objects are checked for higher numbers of objects, higher probabilities of inconsistencies, incorrect relationships, or missing attributes. |
| Amount of Data (AD) | The number of object types is divided by the total number of objects. |
| Concise Representation (CR) | Related to similarity between objects. A larger number of objects introduces more opportunities for overlapping attributes and affects the dimension value. |
| Understandability (UN) | Related to the number of unique object types. |
| Similarity (SM) | Object pairs are compared looking for the maximum similarity, therefore files with more objects will have an impact on final value. |
| Relevance (RL) | The intersection of consumer required attributes with provider available attributes is compared across all objects. |
Disclaimer/Publisher’s Note: The statements, opinions and data contained in all publications are solely those of the individual author(s) and contributor(s) and not of MDPI and/or the editor(s). MDPI and/or the editor(s) disclaim responsibility for any injury to people or property resulting from any ideas, methods, instructions or products referred to in the content. |
© 2025 by the authors. Licensee MDPI, Basel, Switzerland. This article is an open access article distributed under the terms and conditions of the Creative Commons Attribution (CC BY) license (https://creativecommons.org/licenses/by/4.0/).
Share and Cite
Venčkauskas, A.; Jusas, V.; Barisas, D. Quality Dimensions for Automatic Assessment of Structured Cyber Threat Intelligence Data. Appl. Sci. 2025, 15, 4327. https://doi.org/10.3390/app15084327
Venčkauskas A, Jusas V, Barisas D. Quality Dimensions for Automatic Assessment of Structured Cyber Threat Intelligence Data. Applied Sciences. 2025; 15(8):4327. https://doi.org/10.3390/app15084327
Chicago/Turabian StyleVenčkauskas, Algimantas, Vacius Jusas, and Dominykas Barisas. 2025. "Quality Dimensions for Automatic Assessment of Structured Cyber Threat Intelligence Data" Applied Sciences 15, no. 8: 4327. https://doi.org/10.3390/app15084327
APA StyleVenčkauskas, A., Jusas, V., & Barisas, D. (2025). Quality Dimensions for Automatic Assessment of Structured Cyber Threat Intelligence Data. Applied Sciences, 15(8), 4327. https://doi.org/10.3390/app15084327